
TECHNICAL ANALYSIS
BTC/USDT
Bo Hines, Executive Director of the White House Digital Asset Advisory Council, stated that the US could use the proceeds from its gold reserves to buy more Bitcoin. On the other hand, Metaplanet bought another 150 Bitcoins, bringing its total holdings to 3,350 BTC. MicroStrategy founder Michael Saylor signaled a new asset update by sharing Bitcoin Tracker data. Moreover, Bitcoin spot ETFs are back in demand, recording a net inflow of $744 million last week.
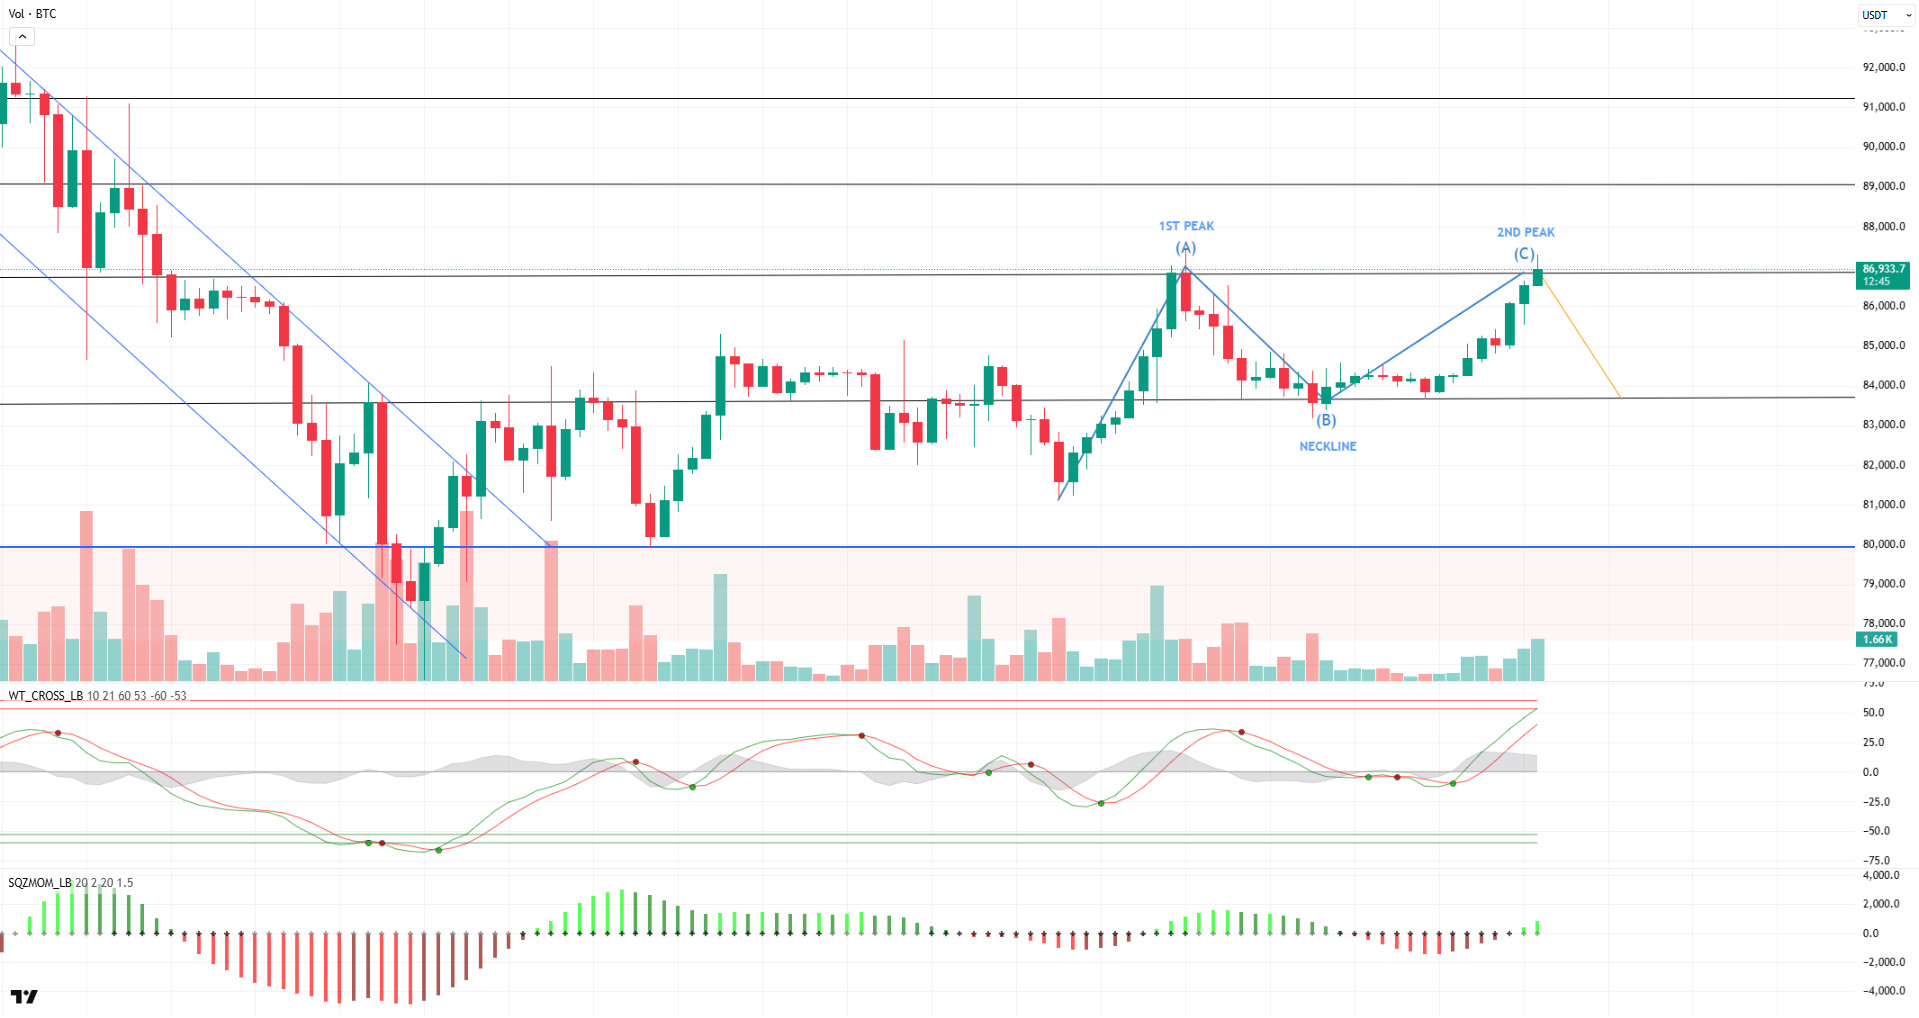
Looking at BTC’s technical outlook, in our last analysis last week, we noted that the price could form an ABC pattern. BTC, which followed a sideways trend at $83,500 over the weekend, turned upwards with the opening of Asian markets and reached the point C target. Currently, BTC is trading at $86,800 above the $86,600 resistance level. BTC, which tested these levels last week, failed to break through at that time. When technical oscillators are analyzed, it is observed that with the Wave Trend Oscillator reaching the overbought zone, the possibility of a double top pattern appears in price movements. This brings a potential bearish scenario back to the agenda, as the increase in long trades above the $80,000 level may support this scenario. On the other hand, a close above $86,600 could take BTC to the liquidation zone of $87,600. Periodically, the fact that the hourly, 4-hour and daily charts give a buy signal is a critical factor for the uptrend to continue.
Supports 83,500 – 82,400 – 80,000
Resistances 86,600 – 89,000 – 91,400
ETH/USDT
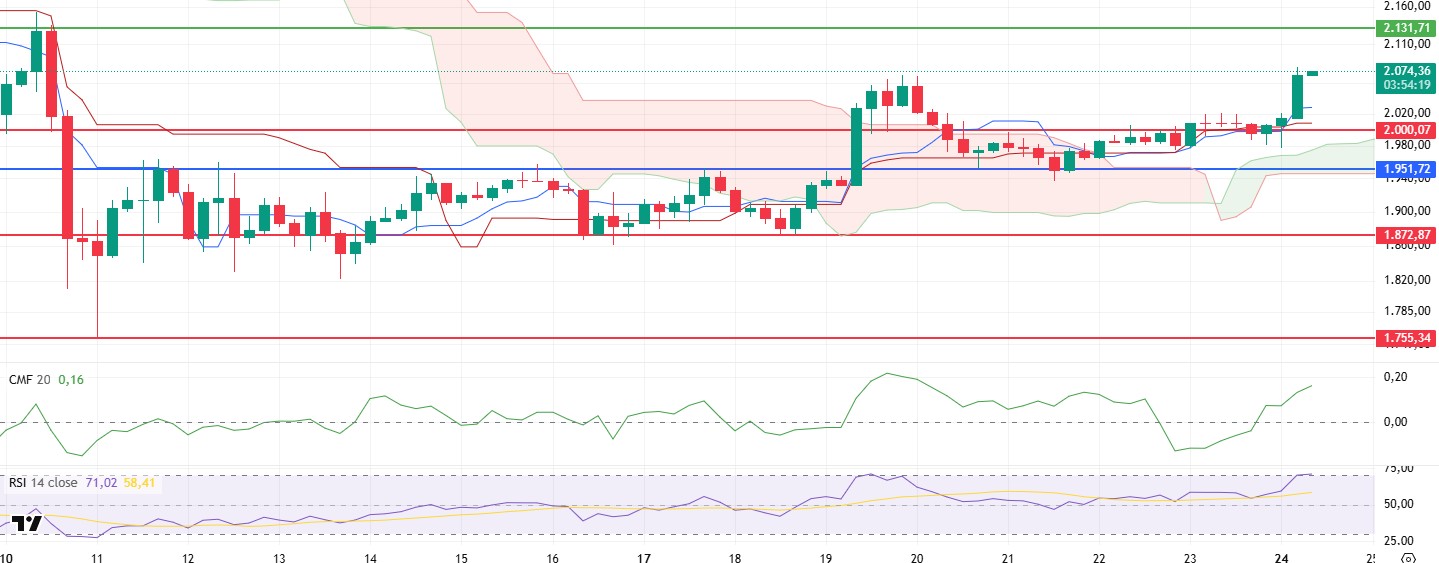
ETH fell below the $1,951 support with a sharp decline on Friday. but managed to hold above this level. The price, which recovered in a short time and rose above this level again, did not close below the support zone and continued its upward movement with the strength it received from here. It rose above the $2,000 level with spot purchases on Monday morning and is currently trading around $2,070.
Technical indicators are also experiencing remarkable changes. The Chaikin Money Flow (CMF) indicator, which fell sharply over the weekend, moved back into positive territory as the price recovered and maintains its momentum. This indicates that the liquidity entering the market is increasing and buyers are maintaining their strength. Looking at the Ichimoku indicator, the trend is gaining strength in a positive direction as the price moves above the Kumo cloud, Tenkan and Kijun levels. At the same time, the Kumo cloud continues to rise, another factor that supports the overall upward momentum of the market. Relative Strength Index (RSI), on the other hand, approached the overbought zone again. However, the fact that it does not show a negative divergence at the moment indicates that a strong sell signal has not yet formed on the price.
For the current uptrend to continue, ETH needs to close above the previous high of $2,068. If the technical indicators remain positive, $2,131 and higher levels could be targeted during the day once this level is breached. However, if the price closes below $2,068, there may be a possibility of a pullback to the $2,000 levels according to the price action strategy.
Supports 2,000 – 1,951 – 1,872
Resistances 2,131 – 2,254 – 2,507
XRP/USDT
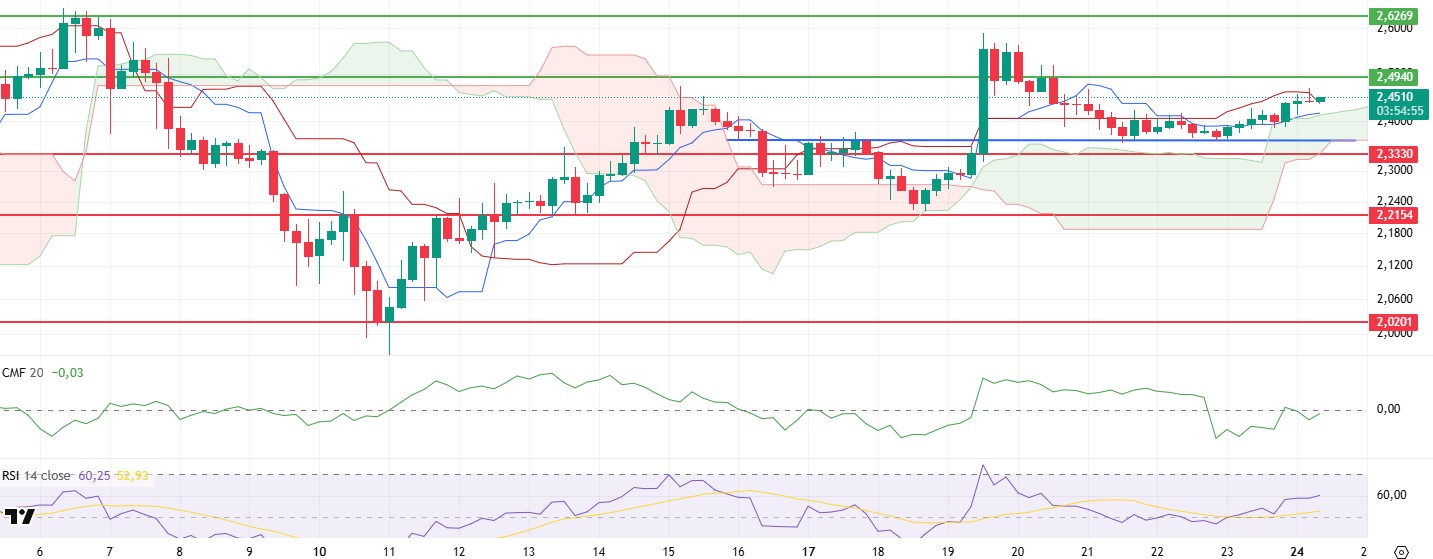
XRP found support near the $2.33 level, as expected after the decline on Friday, and managed to rise above the $2.40 level again. However, there have been changes in the positive outlook in the indicators after this rise.
First of all, when the ichimoku indicator is examined, it is seen that there is a sell signal formed by the intersections of tenkan and kijun. In addition, the rejection of the price at the kijun level after the rise suggests that this pressure may continue. On the other hand, the selling pressure on the spot side of the Cumulative Volume Delta (CVD) and the fact that the Chaikin Money Flow (CMF) indicator remained in the negative zone without keeping up with the rise produce important signals that the price may fall without sufficient spot support. Momentum indicators and Relative Strength Index (RSI), on the other hand, continue to be positive and support price rallies.
In summary, although the price is expected to rise up to the level of $ 2.49, it seems likely to decline by refusing at the level of $ 2.49 with the weaknesses in the indicators. However, the persistence above the $ 2.49 level can disrupt the negative outlook and ensure the continuation of the rise.
Supports 2.3330 – 2.2154 – 2.0201
Resistances 2.4940 – 2.8280 – 3.2125
SOL/USDT
According to Flipside data, the total supply of stablecoins on Solana exceeded $12.8 billion, reaching the highest level since January 2021. On the other hand, BlockBeats News noted that Fidelity Investments has registered a Solana Fund in Delaware on March 22, 2025. Solana co-founder Anatoly Yakovenko stated that there is no reason to create layer-2 (L2) solutions, sparking controversy.
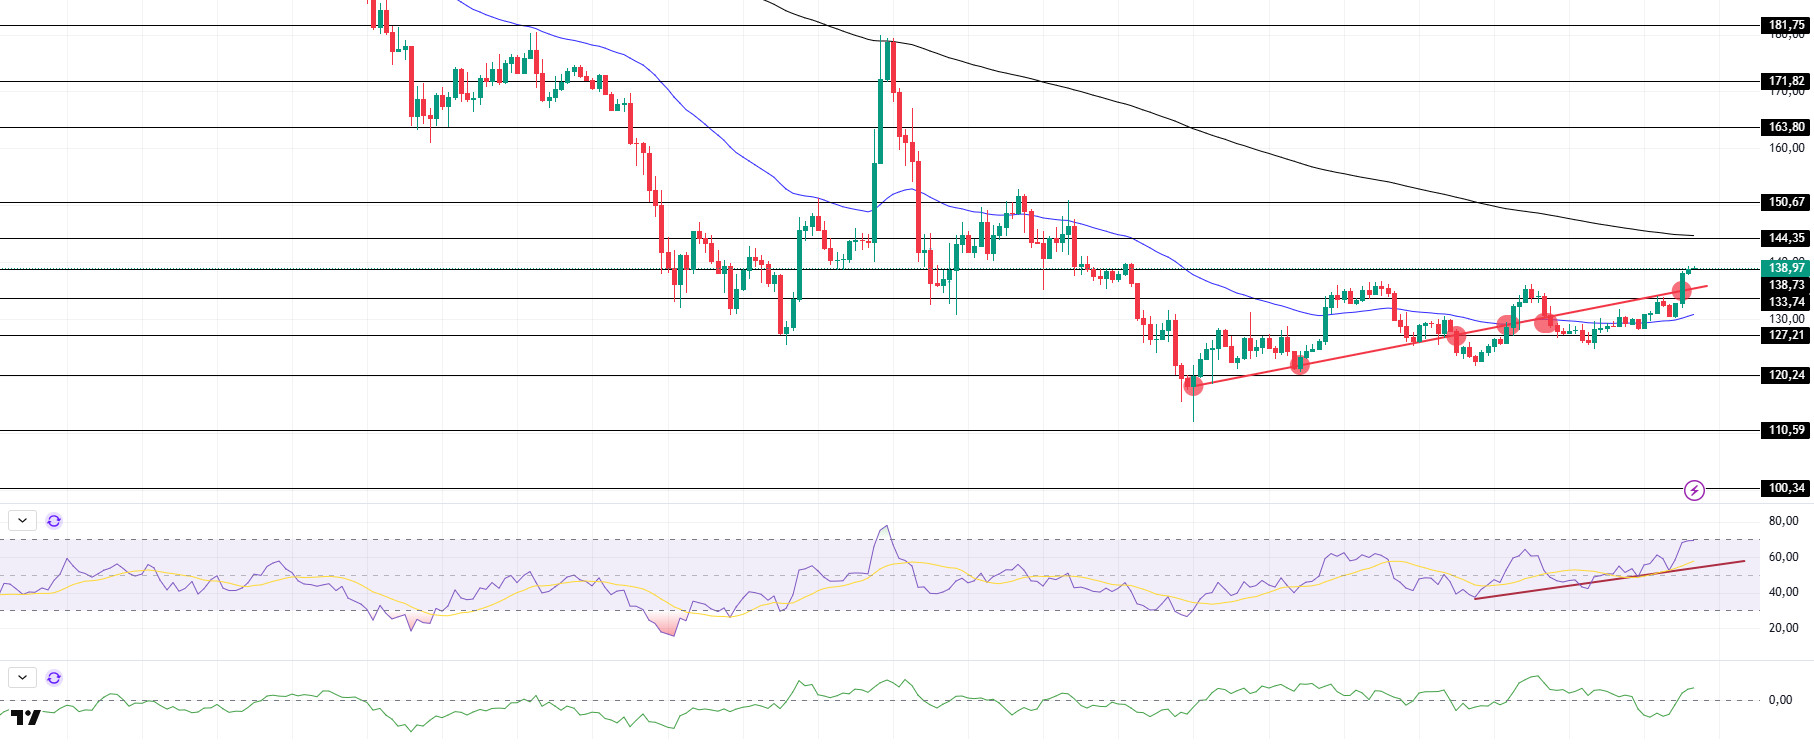
SOL kept pace with the overall market and turned bullish. This rally occurred when it tested the 50 EMA (Blue Line) as support. Thus, it started pricing above the uptrend that started on March 11. On the 4-hour timeframe, the 50 EMA (Blue Line) remained below the 200 EMA (Black Line). This could deepen the decline further in the medium term. At the same time, the price is moving between two moving averages again. The Chaikin Money Flow (CMF)20 indicator is in positive territory, but its daily positivity may increase inflows and push CMF higher. However, the Relative Strength Index (RSI)14 indicator is in overbought territory. This could cause traders to take profits and push the price lower. At the same time, the uptrend in the RSI, which started on March 18, continues. The $150.67 level is a very strong resistance point in the uptrend driven by both the upcoming macroeconomic data and the news in the Solana ecosystem. If it breaks here, the rise may continue. In case of retracements for the opposite reasons or due to profit sales, the support level of $127.21 can be triggered. If the price hits these support levels, a potential bullish opportunity may arise if momentum increases.
Supports 133.74 – 127.21 – 120.24
Resistances 138.73 – 144.35 – 150.67
DOGE/USDT
Rosen Bridge will integrate Dogecoin into its secure ecosystem in two weeks. This will allow Dogecoin holders to access DeFi opportunities and benefit from the bridge’s high-security technology. Whales, on the other hand, continue to accumulate Dogecoin. Between 1 million and 10 million DOGE, there has been a significant increase among whales holding between 1 million and 10 million DOGE, rising from 10.38 billion to 10.45 billion DOGE.
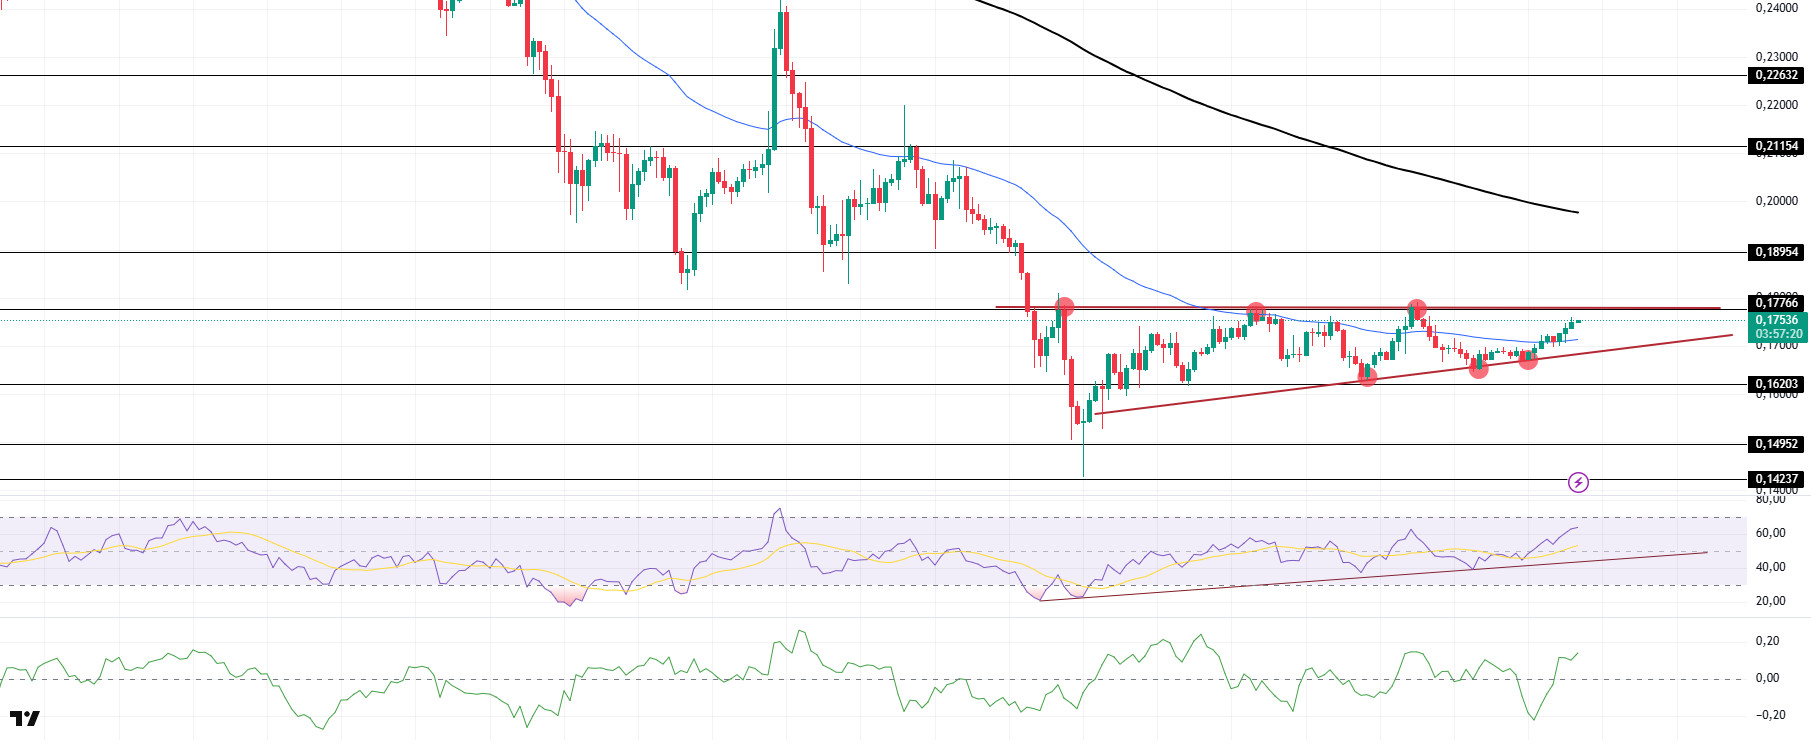
DOGE continued to price inside the ascending triangle pattern over the past weekend. After testing the base of the ascending triangle pattern 3 times, the asset broke the 50 EMA moving average to the upside and is poised to test the resistance of the triangle again. On the 4-hour timeframe, the 50 EMA (Blue Line) is below the 200 EMA (Black Line). This could mean that the decline could deepen in the medium term. However, the price started to price between two moving averages. In addition, the larger gap between the two moving averages increases the probability that DOGE will rise. When we analyze the Chaikin Money Flow (CMF)20 indicator, it is in positive territory. In addition, the fact that the 24-hour volume is on the plus side may increase money inflows, allowing CMF to reach the higher zone. On the other hand, Relative Strength Index (RSI)14 moved from negative to positive territory. However, it managed to stay above the uptrend on March 9. This may increase the uptrend further. The $0.18954 level stands out as a very strong resistance point in the rises due to political reasons, macroeconomic data and innovations in the DOGE coin. In case of possible pullbacks due to political, macroeconomic reasons or negativities in the ecosystem, the $0.14952 level, which is the base level of the trend, is an important support. If the price reaches these support levels, a potential bullish opportunity may arise if momentum increases.
Supports 0.16203 – 0.14952 – 0.14237
Resistances 0.17766 – 0.18954 – 0.21154
LEGAL NOTICE
The investment information, comments and recommendations contained herein do not constitute investment advice. Investment advisory services are provided individually by authorized institutions taking into account the risk and return preferences of individuals. The comments and recommendations contained herein are of a general nature. These recommendations may not be suitable for your financial situation and risk and return preferences. Therefore, making an investment decision based solely on the information contained herein may not produce results in line with your expectations.
