
TECHNICAL ANALYSIS
BTC/USDT
Regulatory and corporate developments in the crypto market continue unabated. Trump Media & Technology Group plans to launch “Made in the USA” themed digital asset and equity ETFs through its fintech brand Truth. Fi. The Oklahoma House of Representatives approved the Strategic Bitcoin Reserve Act, allowing public funds to invest in Bitcoin. The Governor of Kentucky officially legalized the right of individuals to self-custody and the freedom to operate blockchain nodes. On the other hand, Mt. Gox moved $1 billion worth of Bitcoin from its cold wallet, which is being watched carefully in the markets.
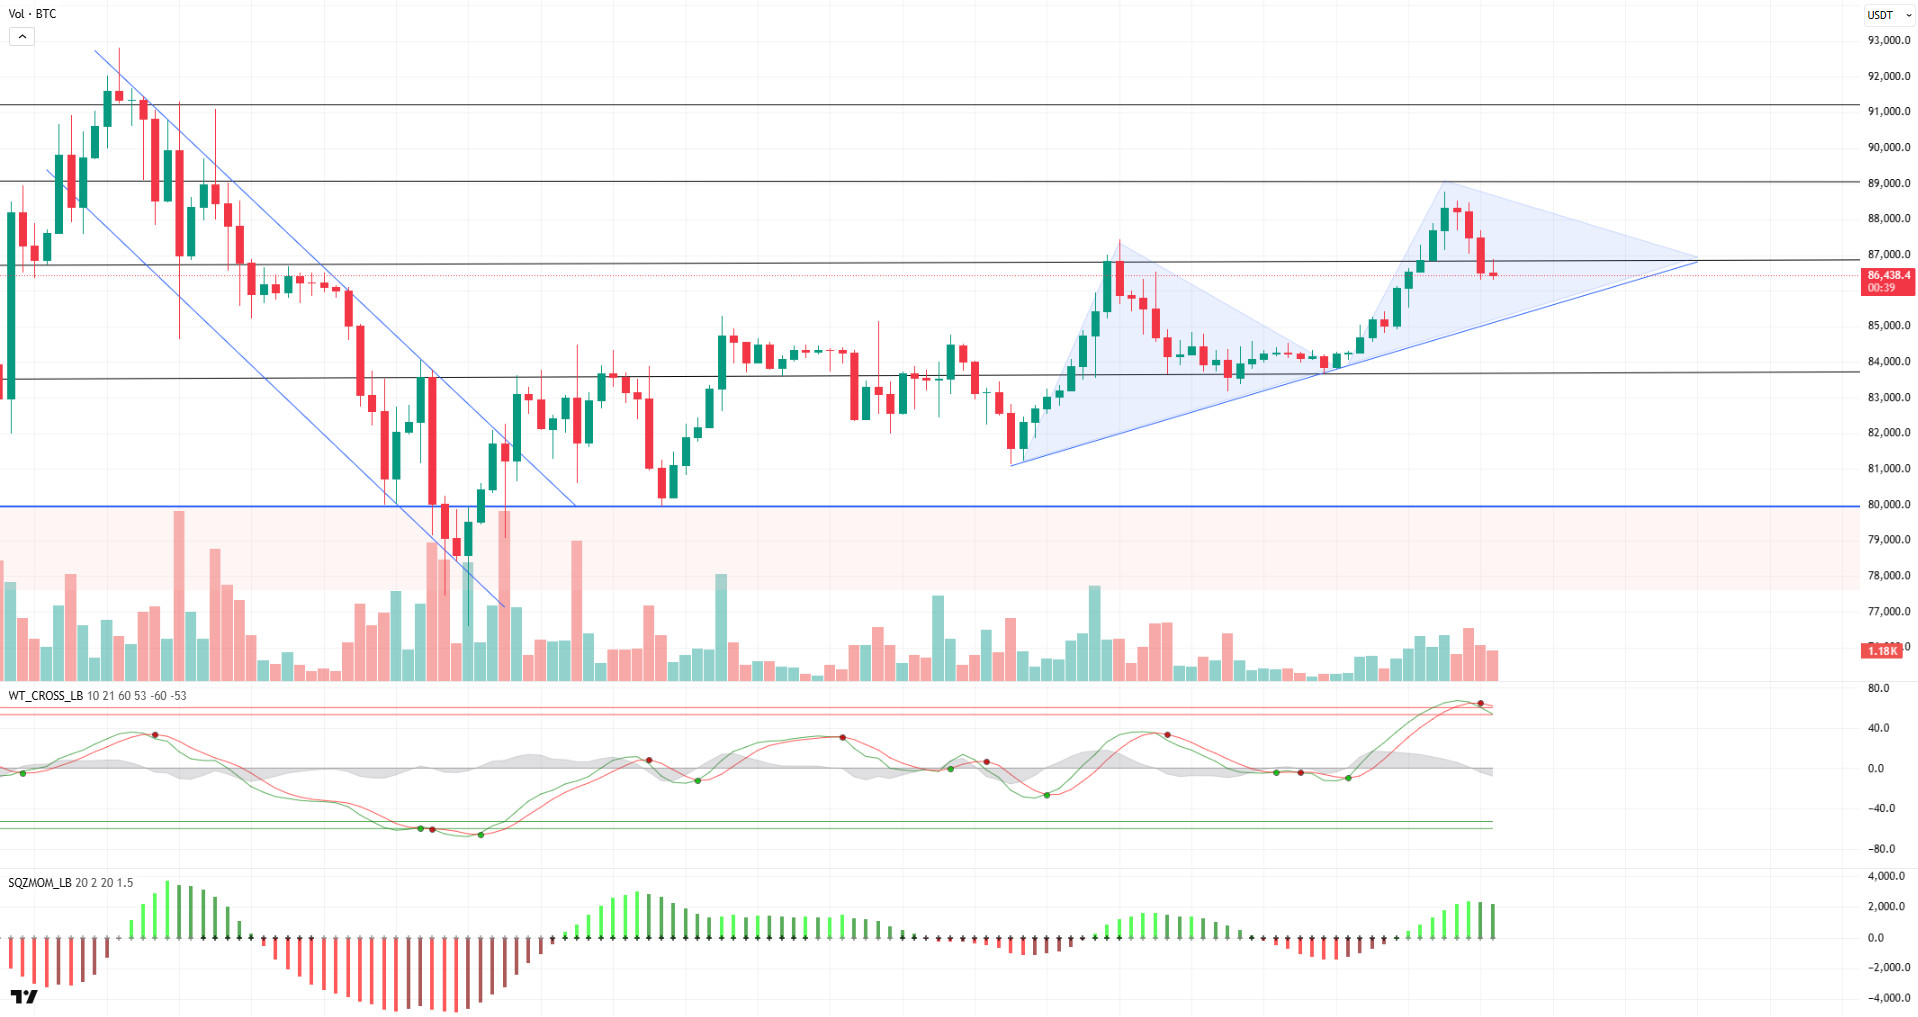
Looking at BTC’s technical outlook, the previously mentioned double top pattern was invalidated after the 86,600 level was breached. BTC, which has formed an uptrend, turned down again after the second top and is currently trading at 86,450. Analysing the technical oscillators, it is observed that the Wave Trend Oscillator is giving a sell signal in the overbought zone and the Squeeze Momentum indicator is weakening. While the sell signal is confirmed on the hourly charts, MACD (12.26) and RSI (14) maintain their buy signal on the 4-hour charts. On the daily chart, the buy signal after a long break confirms the price’s willingness to move upwards. On the liquidation chart, weekly shorts are cleared and there is a heavy accumulation of longs above 80,000. This raises the possibility of a breakout of the 85,000 level and a pullback towards the 83,500 levels if the price buys liquidity on the downside. On the other hand, if BTC tests the 85,000 level and a breakout fails to materialize at this point, it is likely that the price will again move towards the 89,000-resistance level.
Supports 86,600 – 83,500 – 82,400
Resistances 89,000 – 91,400 – 92,800
ETH/USDT
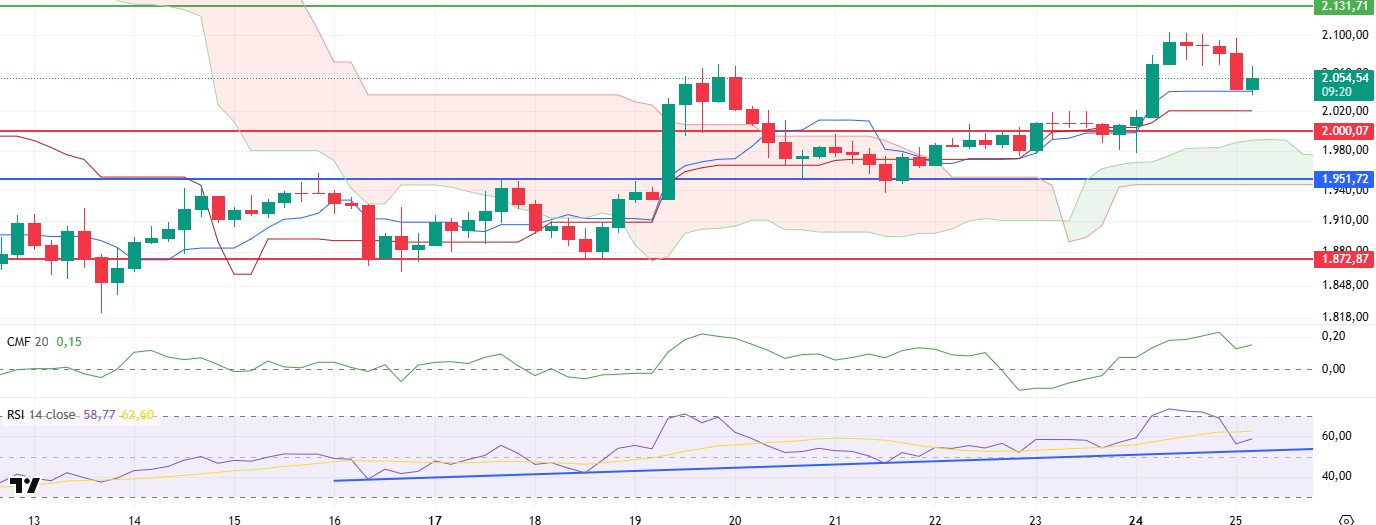
ETH price reached as high as $2,100 after yesterday’s bullish movement. The price, which remained flat at this level, experienced a slight retracement in the morning hours and fell to the tenkan level. Given the general upward trend in the US markets, it can be said that possible declines up to the $ 2,000 level can be considered as a correction movement.
Looking at the technical indicators, the Chaikin Money Flow (CMF) indicator is down slightly in line with the price action. Despite this, CMF remains in positive territory, maintaining its overall positive outlook. According to the Ichimoku indicator, the price is above the tenkan, kijun and kumo cloud levels, indicating that the positive trend remains valid. When the Relative Strength Index (RSI) is analyzed, it is seen that after rising to the overbought zone, it realized the expected correction and fell to 55 levels. In order for this decline in RSI to remain only a correction, it is critical to maintain the trend line.
Overall, it is crucial to maintain the tenkan level ($2,040) in the short term for the price to continue its uptrend. Closes below the Tenkan level could lead to a pullback to the $2,000 level. However, in case of a possible fall to this level, reaction buying is likely to come from the region. On the other hand, if the price does not breach the tenkan level, a bullish movement up to the $2,131 level may occur during the day.
Supports 2,000 – 1,951 – 1,872
Resistances 2,131 – 2,254 – 2,507
XRP/USDT
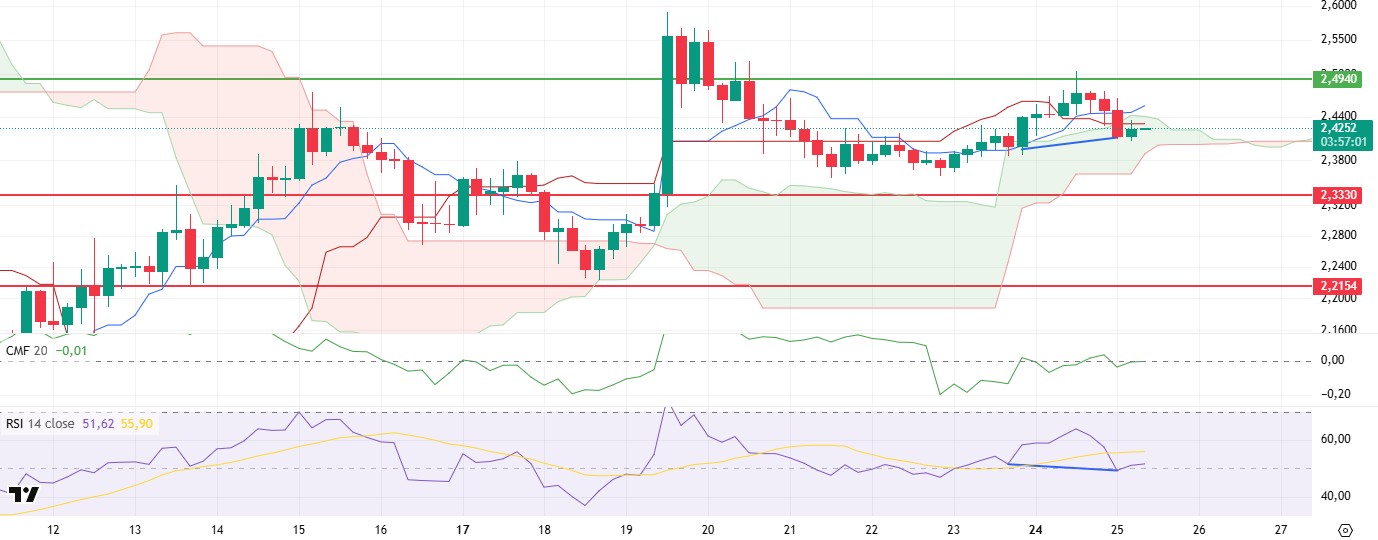
XRP retreated to the borders of the kumo cloud with intense short transactions from this region after its rise to the $2.49 level as expected yesterday. When the Cumulative Volume Delta (CVD) is analyzed, it is seen that the price activity is largely coming from futures transactions.
Looking at the technical indicators, the positive divergence on the Relative Strength Index (RSI) stands out. Below the $2.40 level, this divergence in the RSI, which seems to remain valid unless it falls below the $2.40 level, may have a positive effect on the price. On the other hand, after yesterday’s decline, the Chaikin Money Flow (CMF) indicator re-entered the negative area and then rose back to the zero line. This indicates that the liquidity flow in the spot remains strong. When the Ichimoku indicator is analyzed, it can be said that the price re-entered the kumo cloud boundaries and lost the tenkan and kijun levels, while the intersections of tenkan and kijun levels generally produce a positive signal.
As a result, despite the decline in the price, the indicators still maintain their generally positive structure. Unless the $2.40 intermediate support price is violated, rises can be seen during the day. However, the loss of the intermediate support level of $2.40 may bring pullbacks to $2.33 levels.
Supports 2.3330 – 2.2154 – 2.0201
Resistances 2.4940 – 2.8280 – 3.2125
SOL/USDT
Polymarket officially launched on the Solana blockchain, allowing users to make deposits using Solana’s cryptocurrency. On the other hand, 78.82% of traders hold long positions. SOL options volume increased by 1,117% in the last 24 hours. According to DeFiLlama data, Solana’s total locked value (TVL) increased to 54.87 million SOL, the highest level since June 2022.
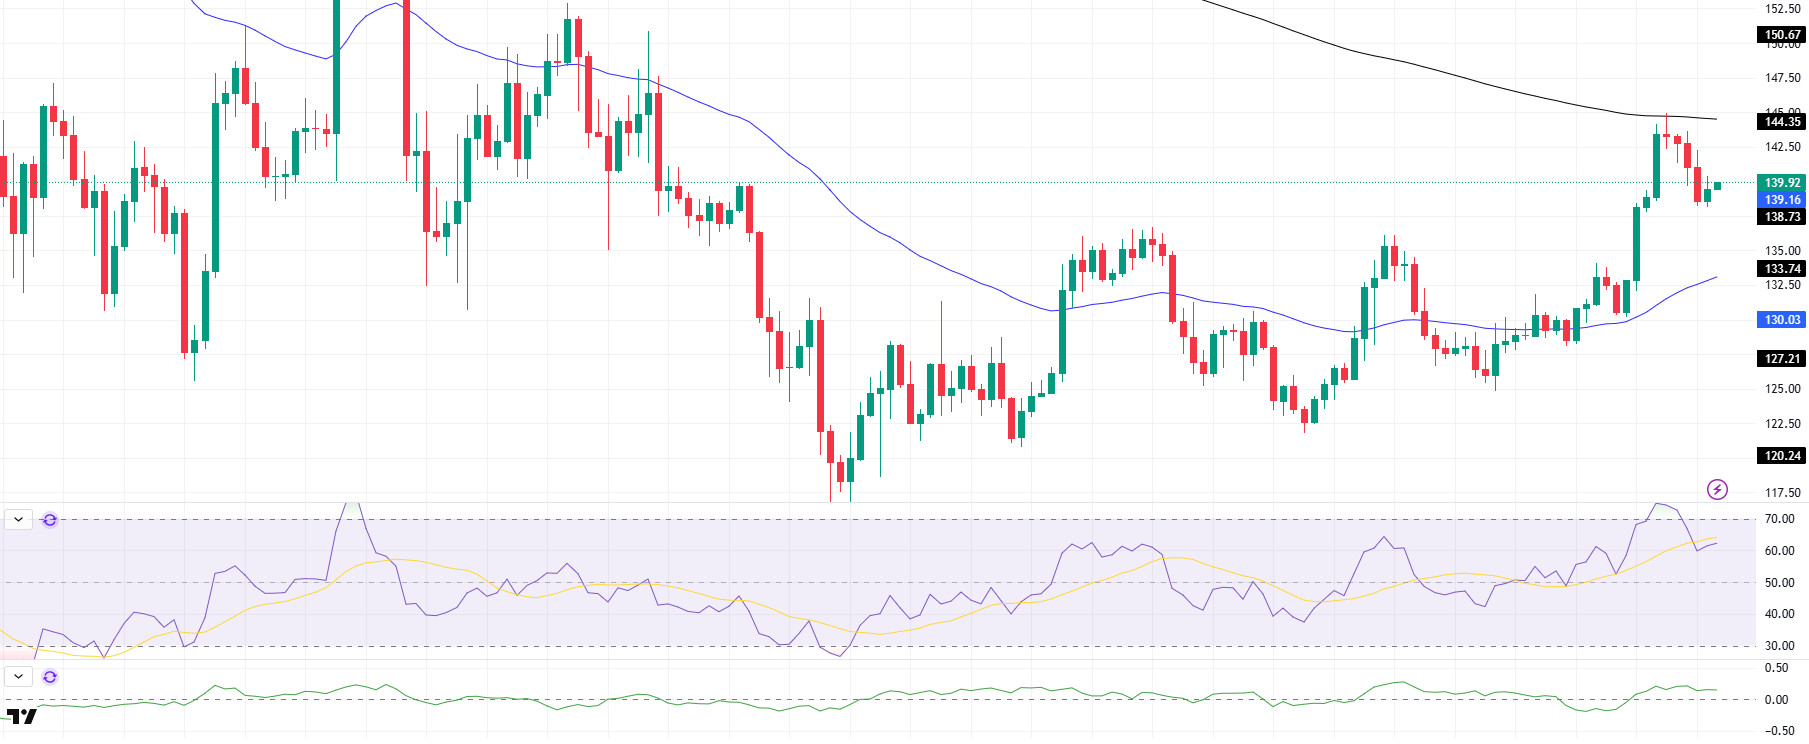
SOL has retreated slightly since our analysis yesterday. Thus, it started to be priced above the uptrend that started on March 11 again. Resistance at the 200 EMA (Black Line) has seen a slight pullback. If it breaks here, it may test the strong resistance level of $163.80. On the 4-hour timeframe, the 50 EMA (Blue Line) remained below the 200 EMA (Black Line). This could deepen the decline further in the medium term. At the same time, the price is moving between the two moving averages again. The Chaikin Money Flow (CMF)20 indicator is in positive territory, but the positive daily volume may increase inflows and push CMF higher. However, the Relative Strength Index (RSI)14 indicator retreated from the overbought zone and took place at the mid-level of the positive zone. The $150.67 level appears as a place of resistance in the rises driven by both the upcoming macroeconomic data and the news in the Solana ecosystem. If it breaks here, the rise may continue. In case of retracements for the opposite reasons or due to profit sales, the support level of $133.74 can be triggered. If the price reaches these support levels, a potential bullish opportunity may arise if momentum increases.
Supports 138.73 – 133.74 – 127.21
Resistances 144.35 – 150.67 – 163.80
DOGE/USDT
Dogecoin (DOGE) has made an important update. In an X post, House of Doge, an arm of the Dogecoin Foundation, officially informed the community about the significant developments, stating that the official Dogecoin Reserve is now live and will launch the reserve with 10 million Dogecoins. According to PANews, data from Santiment reveals that Dogecoin’s network activity has reached its lowest point since October 2024. The network is currently seeing only 66 ‘whale’ transactions per day and active addresses have dropped below 60,000.
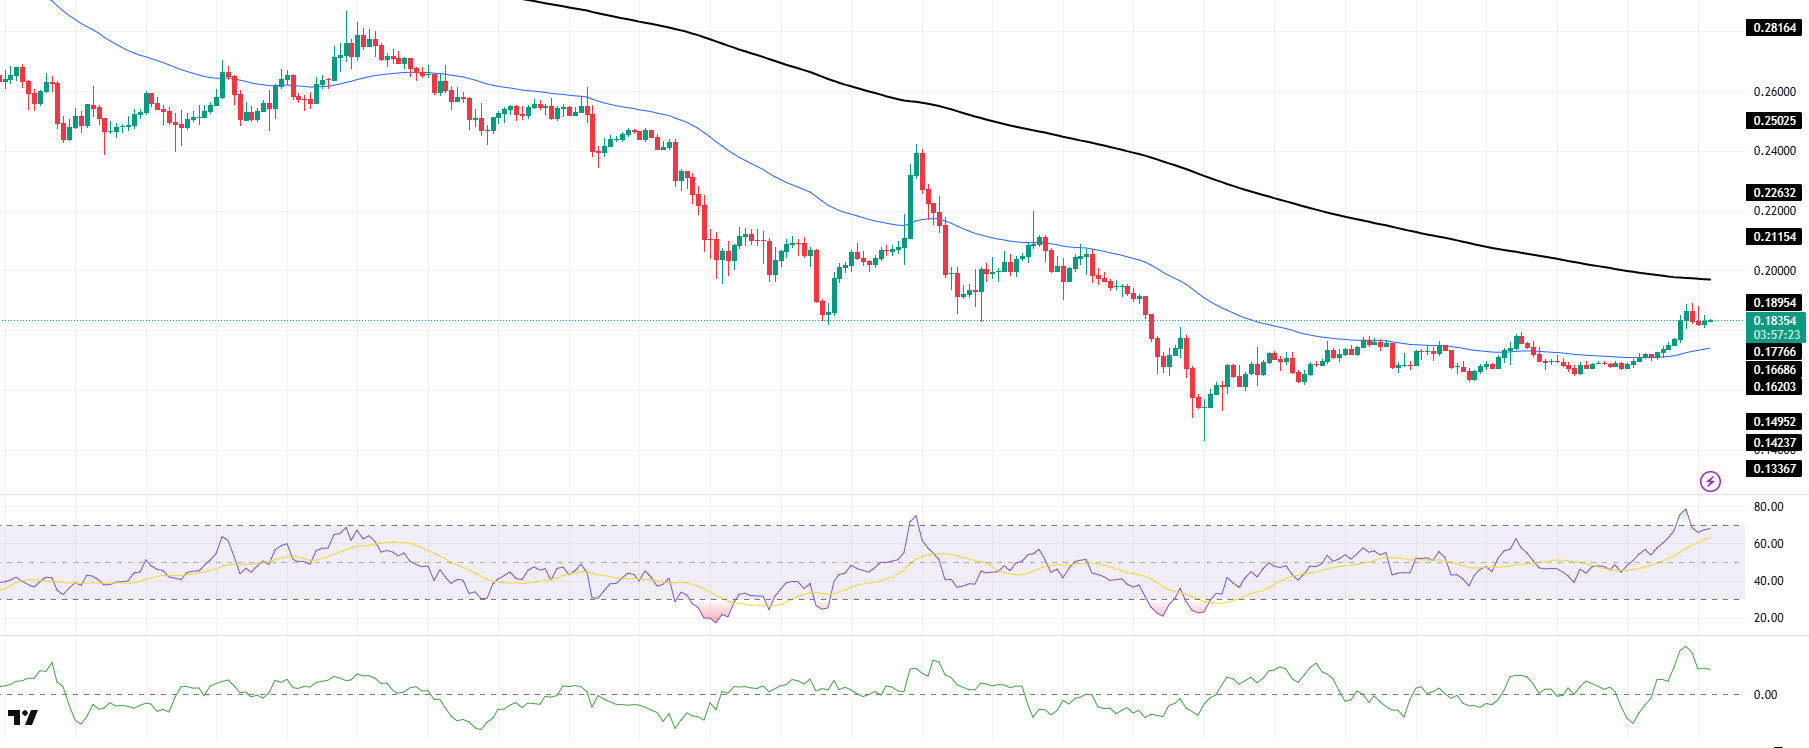
DOGE started to move sideways after yesterday’s rally. On the 4-hour timeframe, the 50 EMA (Blue Line) is below the 200 EMA (Black Line). This could mean that the decline could deepen in the medium term. However, the price started to price between two moving averages. The Chaikin Money Flow (CMF)20 indicator is in positive territory. In addition, the fact that the 24-hour volume is on the plus side may increase inflows, allowing CMF to reach the higher zone. On the other hand, Relative Strength Index (RSI)14 is positioned at the overbought level. This may cause pullbacks. The $0.18954 level stands out as a very strong resistance point in the rises due to political reasons, macroeconomic data and innovations in the DOGE coin. In case of possible retracements due to political, macroeconomic reasons or due to negativities in the ecosystem, the $ 0.16686 level, which is a strong support place, is an important support place. If the price comes to these support levels, a potential bullish opportunity may arise if momentum increases.
Supports 0.17766 – 0.16686 – 0.16203
Resistances 0.18954 – 0.21154 – 0.22632
Legal Notice
The investment information, comments and recommendations contained herein do not constitute investment advice. Investment advisory services are provided individually by authorized institutions taking into account the risk and return preferences of individuals. The comments and recommendations contained herein are of a general nature. These recommendations may not be suitable for your financial situation and risk and return preferences. Therefore, making an investment decision based solely on the information contained herein may not produce results in line with your expectations.
