
TECHNICAL ANALYSIS
BTC/USDT
34 leading crypto companies called on the US Congress to clarify the definition of “Fund Transferor” to reduce legal risks to developers. On the other hand, GameStop announced plans to issue $1.3 billion in bonds to increase Bitcoin investments. The US Senate approved a bill to remove the controversial DeFi tax rules. Spot Bitcoin ETFs recorded net inflows for the ninth consecutive day, reaching an asset size of $ 97.2 billion. Today, Paul Atkins, nominated as a candidate for chairman of the US Securities and Exchange Commission (SEC), will be followed as the confirmation hearing and US GDP data will be followed as developments that we expect to affect the price.
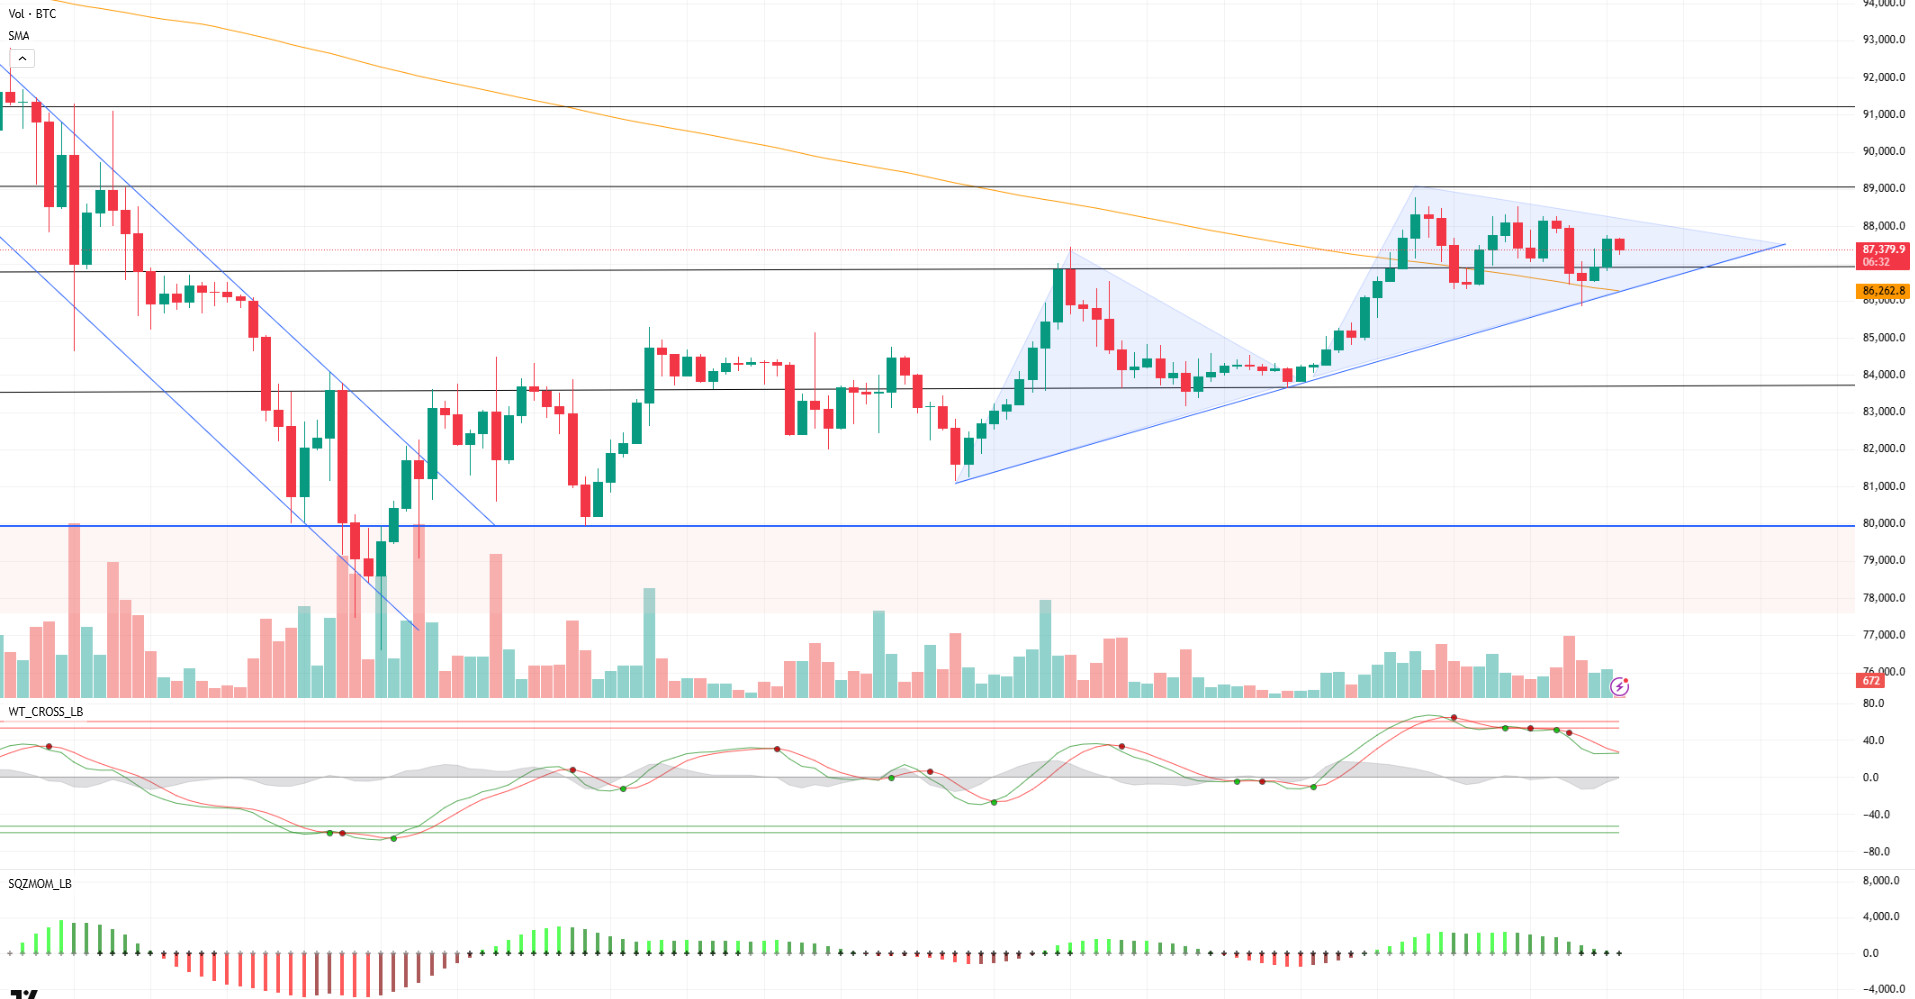
When we look at the technical outlook of BTC, it is seen that with the selling pressure experienced yesterday, the price touched the rising trend line and dropped to the 86,000 level. However, BTC, which recovered with the reaction from this level, continues to be traded at 87,400 as of now, rising above the resistance point of 86,600. The price remains above the 200-day simple moving average (SMA 200D) line, while the Wave Trend Oscillator is waiting for a new crossover for a buy signal. However, the Squeeze Momentum indicator is still trending lower. RSI (14) and MACD (12.26) indicators continue to give a buy signal on the 4-hour period. In case volatility increases during the day, short accumulation between 88,000 and 90,000 may be targeted. On the other hand, BTC is likely to test the liquidation zones in a possible recovery scenario today, following the negative close seen in pro-crypto and tech companies in traditional markets yesterday. Once the liquidity at these levels is taken, heavy long trades above 82,000 will be followed as the next target zone in case the price retraces with the break of support levels.
Supports 86,600 – 83,500 – 82,400
Resistances 89,000 – 91,400 – 92,800
ETH/USDT
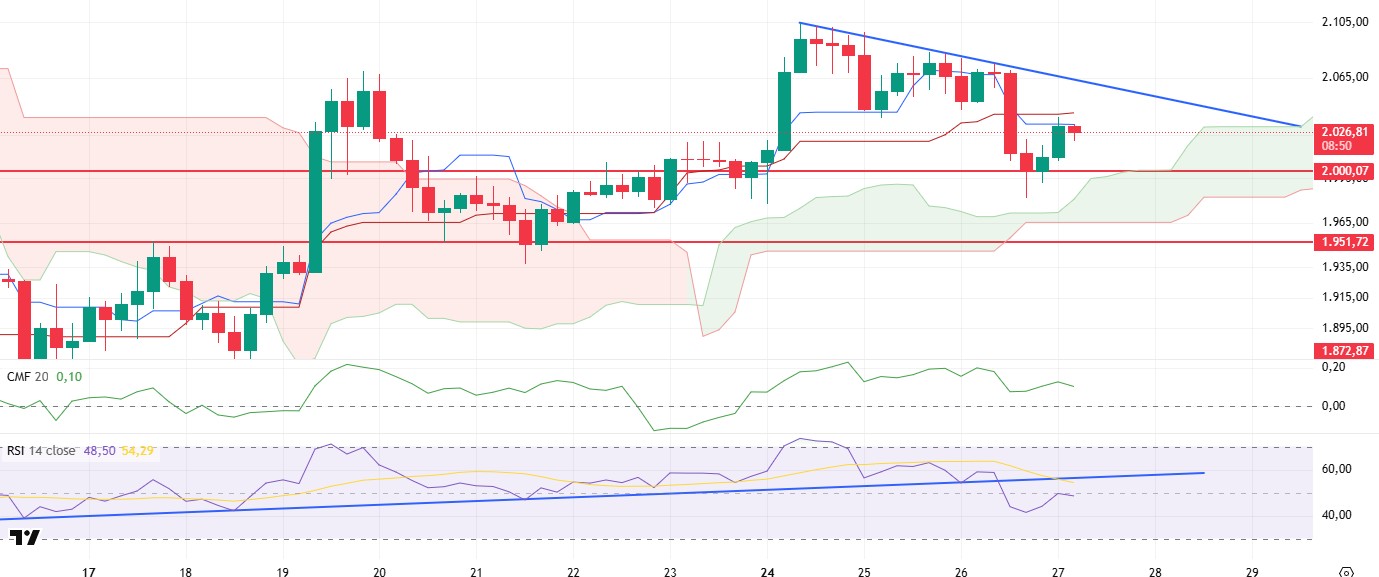
Yesterday’s negative opening of the US markets and sharp declines during the day led to similar movements in the cryptocurrency market. This general selling pressure also affected Ethereum, causing the price to retreat below the $2,000 level. ETH, which found support at the $2,000 level, managed to recover slightly in the night hours and managed to rise again to the level of $2,025.
When technical indicators are analyzed, it is seen that the Relative Strength Index (RSI) indicator triggered the downward movement with the trend break. The RSI indicator is currently below the 50 level and continues its negative outlook. This indicates that the price is facing weakening momentum in the short term. In terms of the Ichimoku indicator, a negative signal was formed as the tenkan level crossed the kijun level to the downside. However, the fact that the price is still above the kumo cloud suggests that this signal does not mean a definite trend reversal. As long as it remains above the kumo cloud, it can be said that the overall price structure maintains its positive trend. At this point, whether the price moves below the cloud or not will be a critical determinant for future price movements. On the other hand, although the Chaikin Money Flow (CMF) indicator, which measures liquidity flows, continues to hover in positive territory, it continues to move downwards, indicating liquidity outflows from the market. Although the fact that CMF remains in positive territory indicates that there is no clear sell signal at this stage, the downward trend of the indicator indicates a decrease in the appetite for buying.
To summarize, although technical indicators are signaling weakness in ETH price, the fact that the price continues to remain above the kumo cloud and the CMF indicator continues to be in the positive zone indicates that there may be slight bullish movements during the day. However, it should be kept in mind that the price movements that will come with the opening of the US markets will be decisive in terms of the market-wide direction and transactions should be managed carefully in this context.
Supports 2,000 – 1,951 – 1,872
Resistances 2,131 – 2,254 – 2,507
XRP/USDT
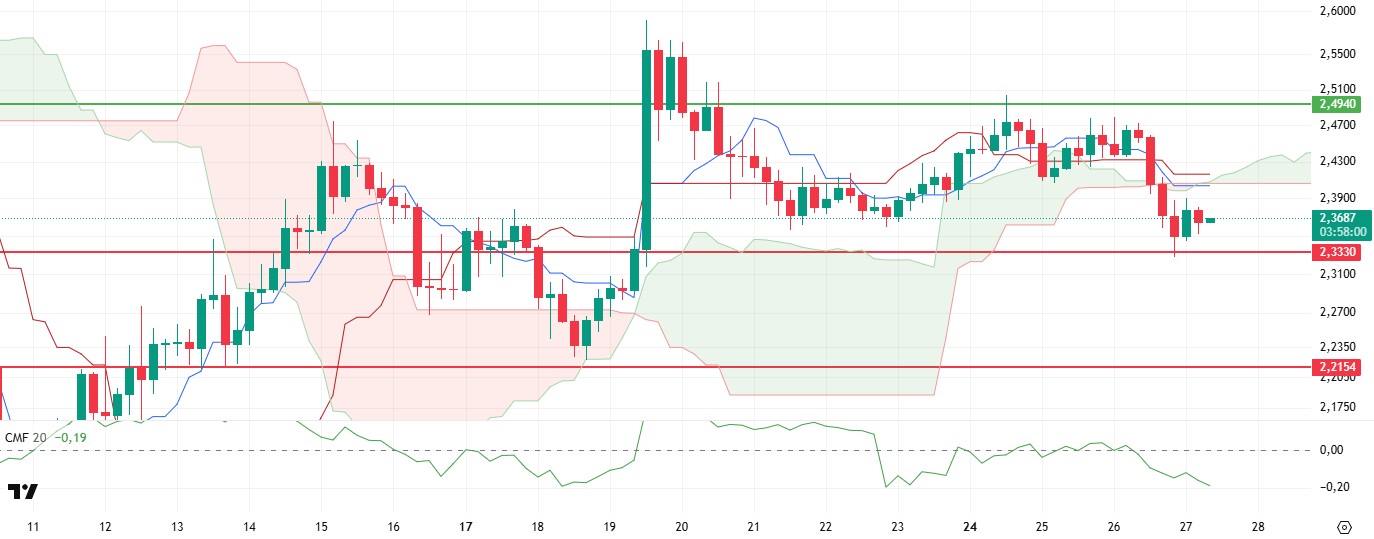
With the decline in the crypto market yesterday, XRP lost the $2.40 zone, an important intermediate support level and kumo cloud support. With this loss, XRP, which fell to the main support level of $2.33, recovered slightly with purchases from the support zone.
Analyzing the technical indicators, the Cumulative Volume Delta (CVD) spot side, which has been positive for a while, has continued to be sales-weighted since yesterday, which may continue the negative movement. Chaikin Money Flow (CMF) indicator also fell sharply and moved into negative territory, indicating liquidity outflows. However, the positive divergence on the CMF indicator and the fact that the price is in the support zone may indicate that buyers will start to regain strength in these regions. On the Ichimoku indicator, the negative outlook continues with the price losing the kumo cloud and the intersections of tenkan and kijun levels.
As a result, indicators continue to weaken in general. However, the fact that the price is close to the main resistance level of $2.33 and the positive divergence on CMF suggests that the slight recovery trend may continue in these regions. Closures below the $2.33 level may see steeper declines with weakening indicators.
Supports 2.3330 – 2.2154 – 2.0201
Resistances 2.4940 – 2.8280 – 3.2125
SOL/USDT
Pump Fun moved 54,113 SOLs to a centralized exchange. Pumpswap reached a record daily trading volume of $488 million. CME’s Solana futures ETF, on the other hand, failed to sustain and see the first day’s interest and quickly dwindled to 73 contracts.
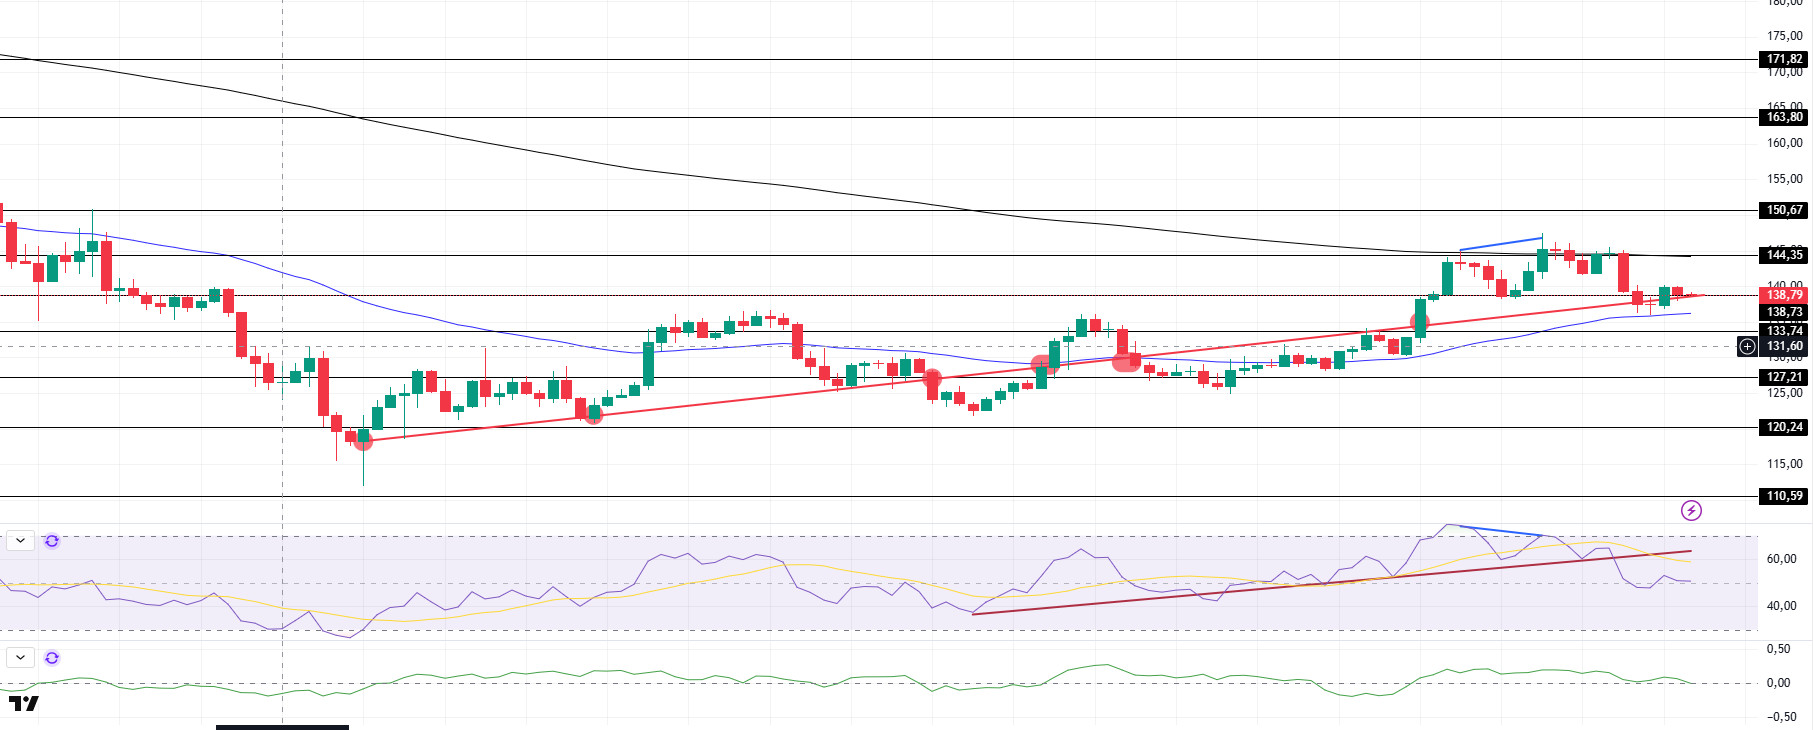
SOL has retreated since our analysis yesterday. The asset failed to break the strong resistance at $144.35 and the 200 EMA (Black Line) moving average. In addition, the discrepancy in the Relative Strength Index indicator RSI (14) also worked and the price lost 3.8%. Currently, the price is testing the uptrend that started on March 11 and the $138.73 level as support. On the 4-hour timeframe, the 50 EMA (Blue Line) remained below the 200 EMA (Black Line). This could deepen the decline further in the medium term. At the same time, the price is moving between the two moving averages again. The Chaikin Money Flow (CMF)20 indicator is in positive territory, but negative daily volume may reduce inflows and move CMF into negative territory. However, the Relative Strength Index (RSI)14 indicator retreated from the overbought zone and came to the neutral zone. However, it broke the downward uptrend that has formed since March 18. The $ 144.35 level appears as a resistance point in the rises driven by the upcoming macroeconomic data and the news in the Solana ecosystem. If it breaks here, the rise may continue. In case of retracements for the opposite reasons or due to profit sales, the support level of $ 133.74 can be triggered. If the price comes to these support levels, a potential bullish opportunity may arise if momentum increases.
Supports 138.73 – 133.74 – 127.21
Resistances 144.35 – 150.67 – 163.80
DOGE/USDT
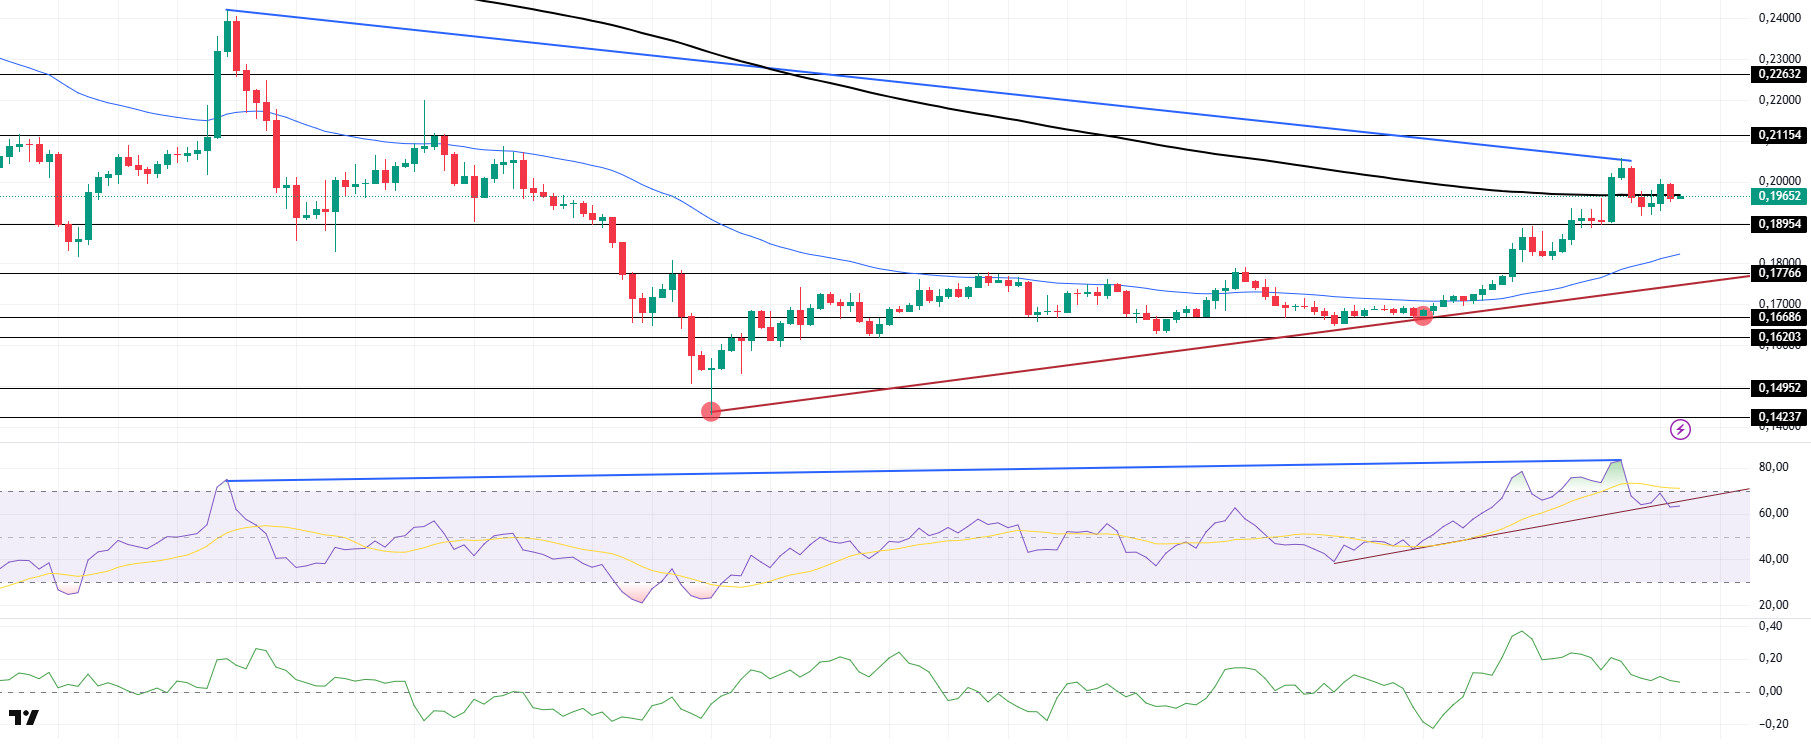
After our analysis yesterday, DOGE managed to hold its position and stay above the 200 EMA (Black Line) and the uptrend that started on March 11. It is currently testing the 200 EMA as support. On the 4-hour timeframe, the 50 EMA (Blue Line) is below the 200 EMA (Black Line). This could mean that the decline could deepen in the medium term. However, the price has started to price above the two moving averages. The Chaikin Money Flow (CMF)20 indicator is in positive territory. In addition, the fact that the 24-hour volume is on the rise may increase the inflows and cause CMF to increase further. On the other hand, Relative Strength Index (RSI)14 is testing the uptrend that started on March 21 as support, with a slight retracement from the overbought level. If it breaks here, the decline may deepen. On the other hand, bearish divergence should be taken into account. This may also cause pullbacks. The level of 0.21154 dollars appears as a very strong resistance in the rises due to political reasons, macroeconomic data and innovations in the DOGE coin. In case of possible pullbacks due to political, macroeconomic reasons or negativities in the ecosystem, the $ 0.17766 level, which is a strong support place, appears as an important support place. If the price reaches these support levels, a potential bullish opportunity may arise if momentum increases.
Supports 0.18954 – 0.17766 – 0.16686
Resistances 0.21154 – 0.22632 – 0.25025
Legal Notice
The investment information, comments and recommendations contained herein do not constitute investment advice. Investment advisory services are provided individually by authorized institutions taking into account the risk and return preferences of individuals. The comments and recommendations contained herein are of a general nature. These recommendations may not be suitable for your financial situation and risk and return preferences. Therefore, making an investment decision based solely on the information contained herein may not produce results in line with your expectations.

