
Technical Analysis – October 01, 2025
BTC/USDT
August JOLTS job openings in the US came in above expectations at 722K, while the rejection of the funding bill for the federal government made the government shutdown effective as of September 30. With approximately 750K federal employees furloughed, the release of critical data such as non-farm payrolls and CPI may be delayed. Senate Republican leader Thune announced a vote to reopen the government. At the Fed, Collins emphasized the possibility of further rate cuts, while Vice Chair Jefferson said inflation and labor risks were two-sided. According to CME data, the probability of a rate cut in October rose to 97%.
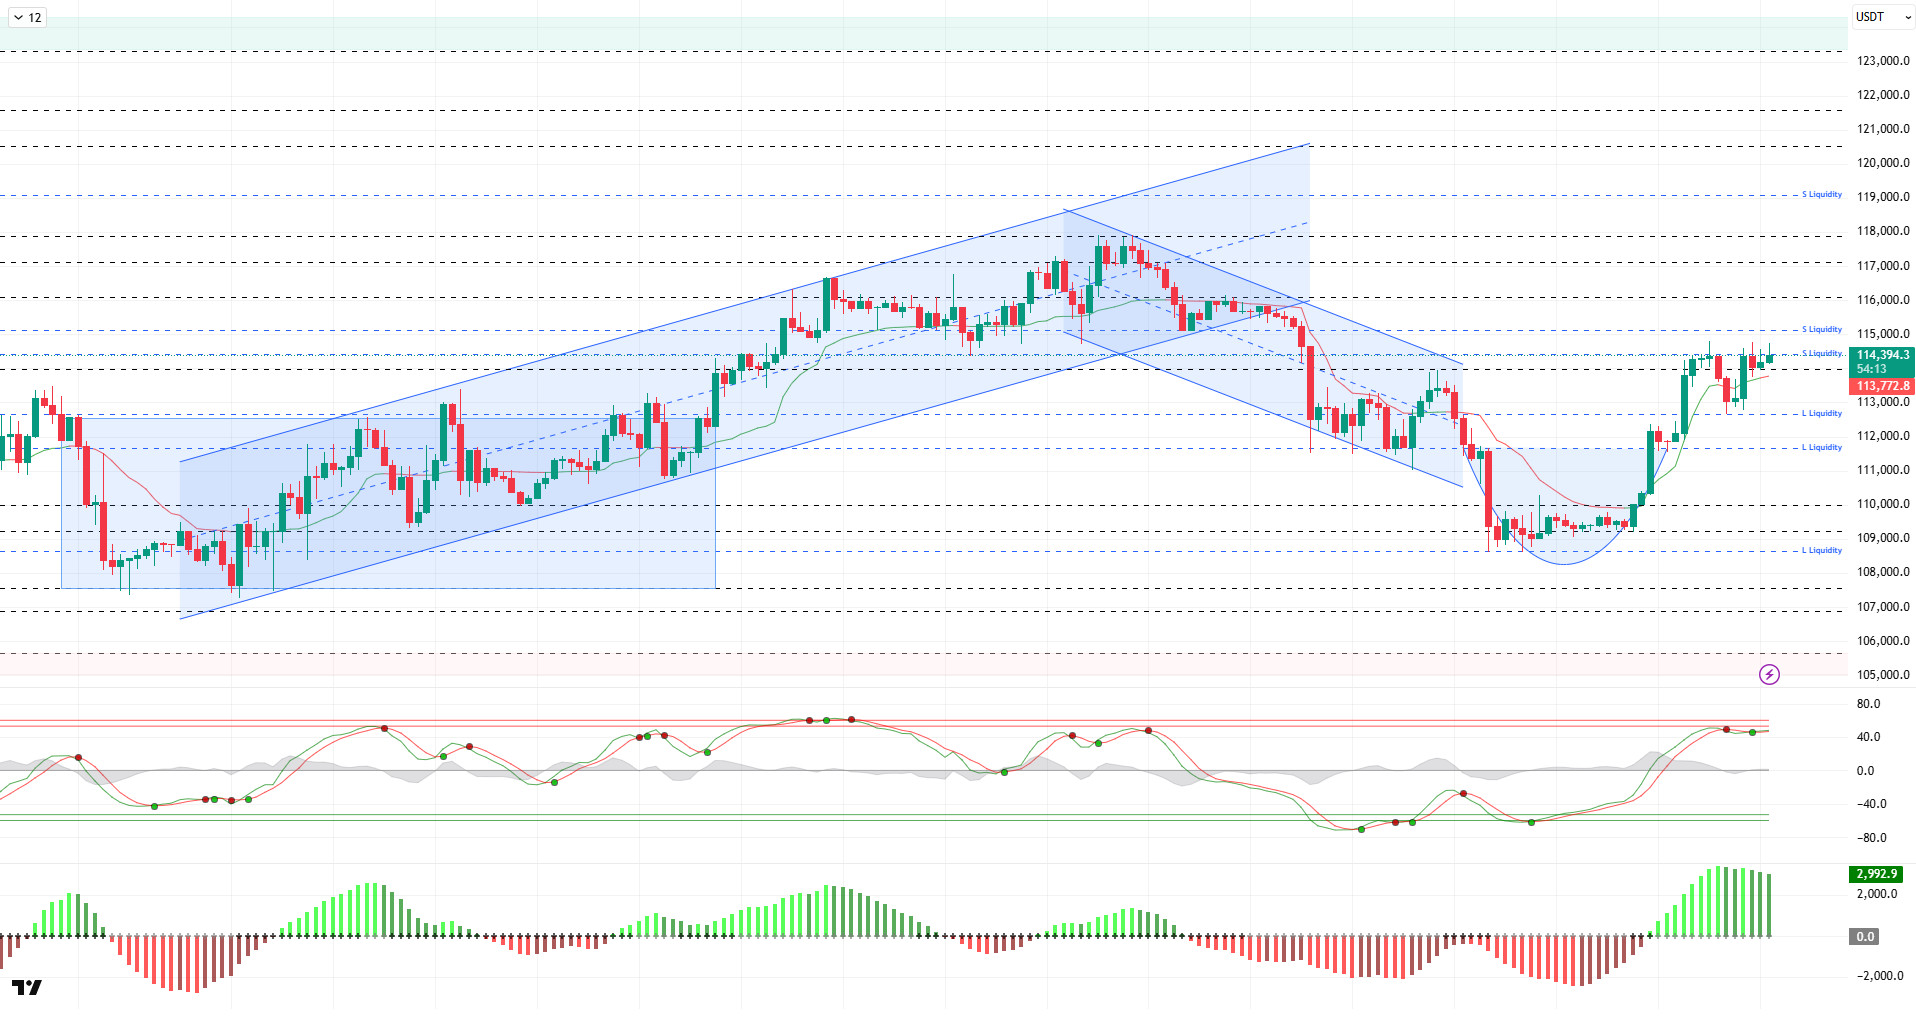
Looking at the technical picture, BTC continues to carry its upward momentum with a cup formation. After falling to the 112,500 level in the previous analysis, the price managed to recover and tested the 114,800 level. At the time of writing, it continues to trade at the 114,500 level.
Technical indicators signaled a trend reversal in line with the short-term sell signal given by the Wave Trend oscillator (WT) in the overbought zone. The oscillator then gave a buy signal again and turned upward once more. The Squeeze Momentum (SM) indicator’s histogram continues its momentum within the positive zone. The Kaufman moving average is currently trading below the price at the 113,750 level.
When examining liquidation data, it is seen that short positions concentrated in the 114,000-115,000 band have been liquidated along with the recent upward movement. However, a new accumulation process has begun in sell-side transactions, and it is noteworthy that this concentration is particularly evident at the 115,500 level. On the buy side, short-term positions were liquidated at the 112,500 level, while long-term trades concentrated at the 111,500 level. Over the past 24 hours, approximately $26 million worth of short positions and around $18 million worth of long positions were liquidated in BTC. Total market liquidations reached a notable level of $438 million.
In summary, while the US government shutdown has had no significant impact on the markets, the differing views of Fed members on interest rate cuts and the return of tariffs to the agenda are among the key developments. The negative outlook for short-term interest rate cuts regained strength with interest rate cut expectations reaching 97%. On the BTC side, we have entered the month of October, which has seen double-digit averages in terms of cyclical movements. The cup formation in the technical outlook supports the price’s recovery trend, while liquidity data continues to point to the target zone. In this context, if the rise continues, the 114,000 level stands out as a critical resistance point. Closes above this level remain important in terms of overcoming the 115,000 reference zone. On the other hand, in the event of potential selling pressure, the 112,600 level will be monitored as the first support point, with the 111,400 support coming to the fore below this level.
Supports: 112,600 – 111,400 – 110,000
Resistances: 114,000 – 115,000 – 116,000
ETH/USDT
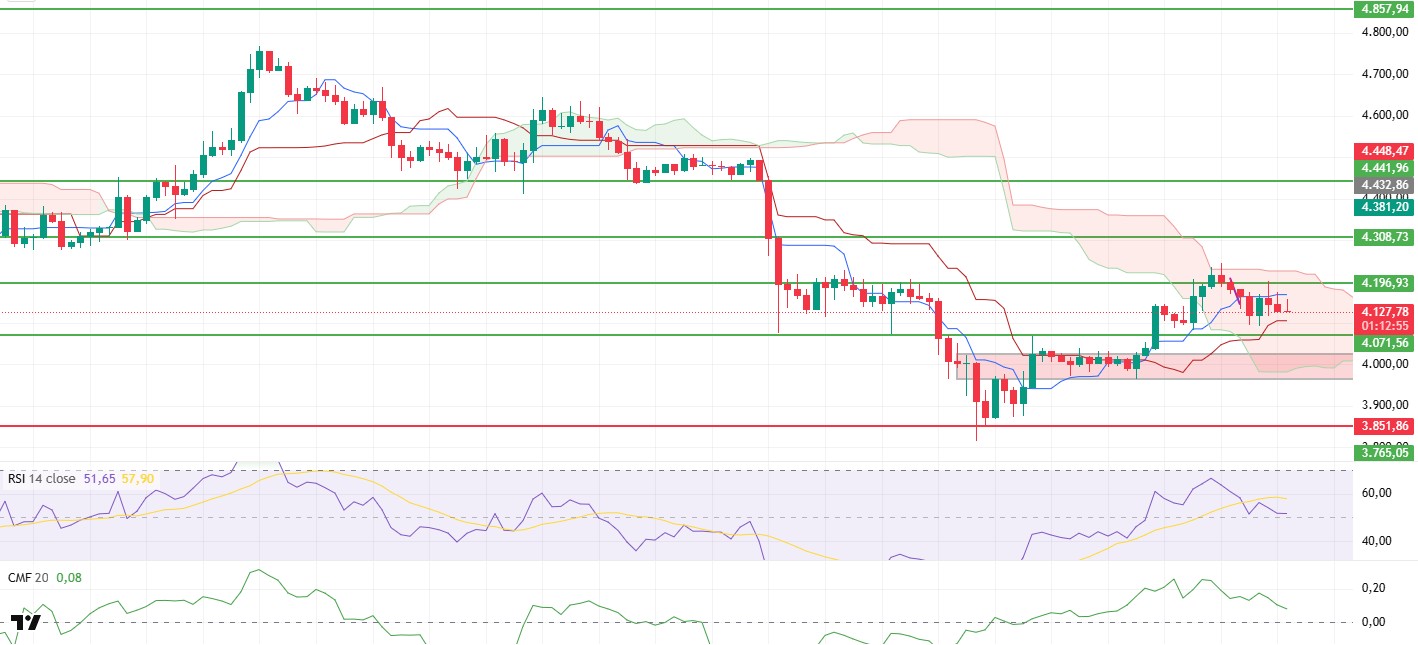
The ETH price rose to $4,196 yesterday evening, testing an important resistance zone. However, selling pressure at this point caused the price to retreat, falling to around $4,130. This pullback indicates that, despite buyers remaining strong in the market, selling pressure is still holding its ground, and a balanced power struggle is continuing in the short term.
Although the Chaikin Money Flow (CMF) indicator remains in positive territory, its downward trend indicates that market liquidity is decreasing and partial exits have begun. This weakening of liquidity flow suggests that buyers, despite still being in an advantageous position, may struggle to push prices higher. In contrast, the Relative Strength Index (RSI) indicator remaining at the 50 level confirms that buyers have not completely retreated and that momentum is attempting to recover. This scenario reveals that the price is at a critical threshold in the short term, poised to determine a new direction.
From the perspective of the Ichimoku indicator, the price remaining between the Tenkan and Kijun levels and moving within the boundaries of the kumo cloud signals a critical decision zone. This structure indicates that the market is in a narrowing squeeze and that potential breakouts will provide strong signals regarding direction. In other words, the price’s movement within the cloud serves as a test for both buyers and sellers.
In general, sustained closes above the $4,196 level could support the price regaining momentum and moving upward, paving the way for a test of the $4,308 level. Conversely, a break below the $4,070 level could accelerate selling, potentially leading to steeper declines. Whether critical levels can be maintained in the short term remains the most important factor in determining the market’s direction.
Top of Form
Below the Form
Supports: 4,071 – 3,851 – 3,672
Resistances: 4,196 – 4,308 – 4,441
XRP/USDT
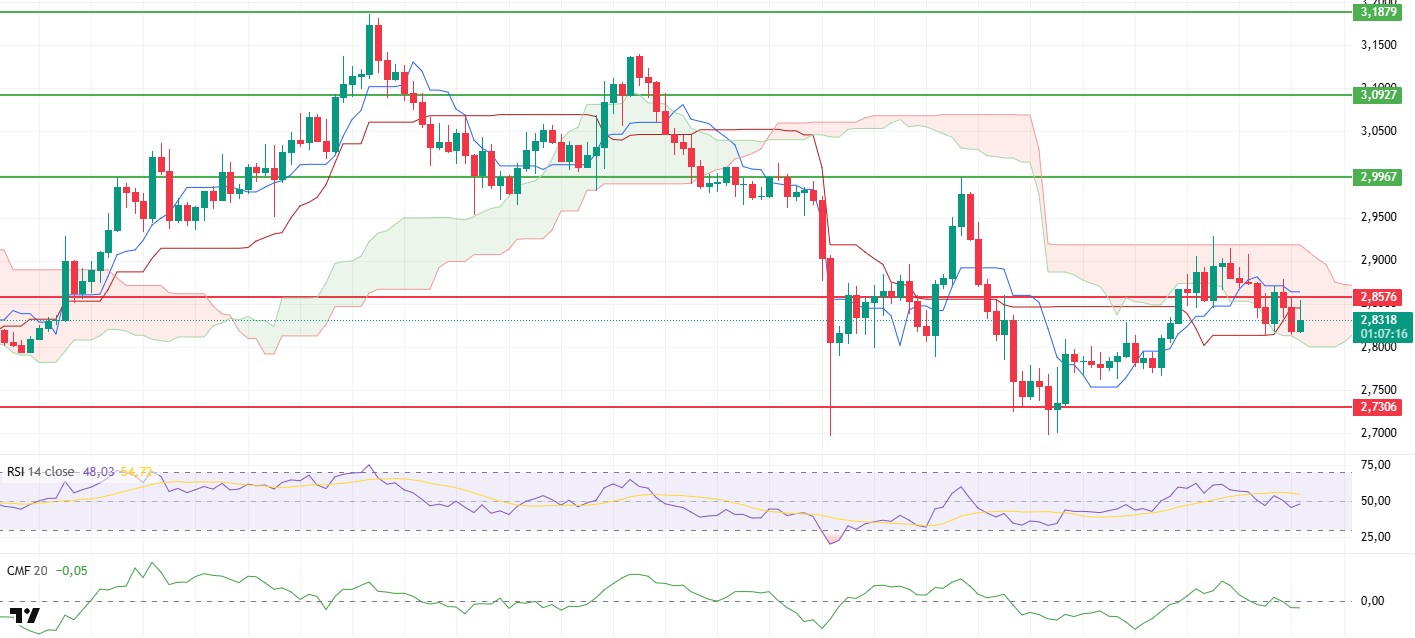
The XRP price has fluctuated around the $2.8570 level since yesterday evening. It is currently trading at $2.8350 within the cloud. Movement in this region indicates that the market is in an indecisive state and that a critical battle for balance is being fought between buyers and sellers.
The Chaikin Money Flow (CMF) indicator moving into negative territory signals an acceleration in liquidity outflows from the market. This development confirms that investors are beginning to avoid risk and that the selling side is gaining strength. The RSI indicator remaining below the 50 level and the underlying MA line also signals a weakening in momentum and indicates that buyers are losing strength.
The loss of the Tenkan and Kijun levels in the Ichimoku indicator strengthens the possibility of continued selling pressure in the short term. In particular, the loss of the lower band of the kumo cloud at the $2.80 level could lead to intensified selling and a faster pullback in the price. Whether this critical level can be maintained will be decisive for the direction of the market.
In general, if the price breaks below the $2.80 level, it is expected to retreat to the $2.73 level. Conversely, a significant break above the $2.8570 level could invalidate the current bearish scenario and pave the way for the price to resume its upward movement. In the short term, these two critical levels stand out as the most important indicators that will determine the market’s direction.
Supports: 2.7306 – 2.6513 – 2.4730
Resistances: 2.8576 – 2.9183 – 2.9967
SOL/USDT
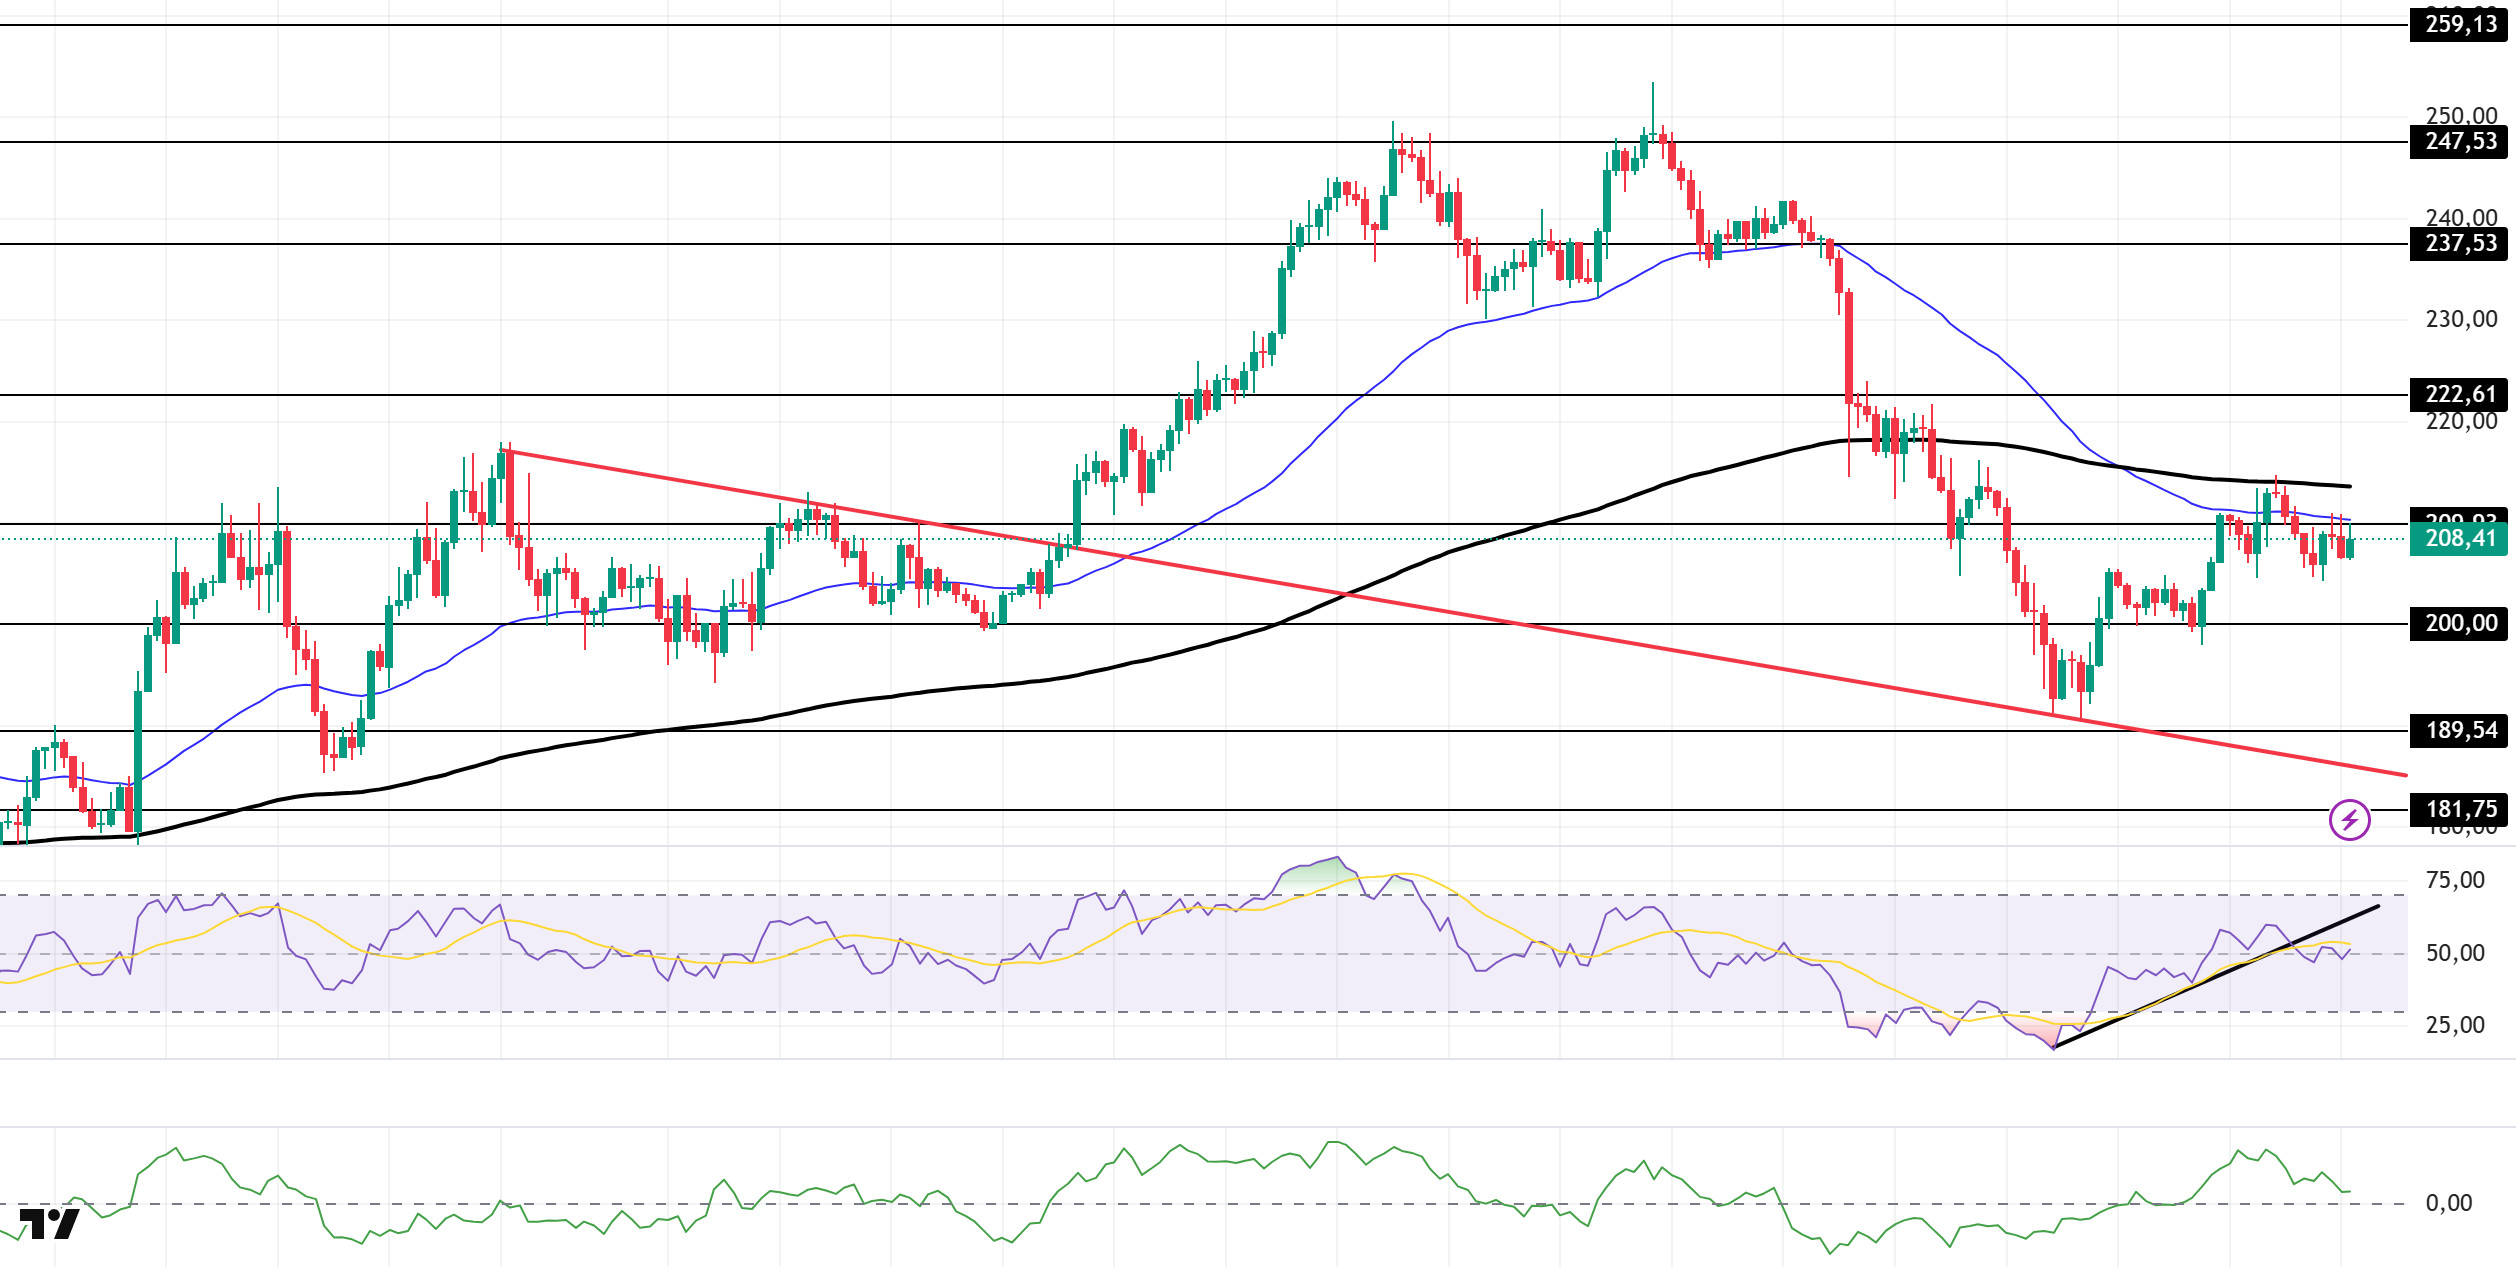
The SOL price has been moving sideways. The asset continues to trade in the upper region of the descending trend line that began on August 29. Currently testing the 50 EMA (Blue Line) moving average and resistance at the $209.93 level, the price could target the $200.00 level if the pullback continues. The $222.61 level should be monitored for candle closes above the 200 EMA (Black Line).
The price remained below the 50 EMA (Exponential Moving Average – Blue Line) and 200 EMA (Black Line) on the 4-hour chart. This indicates a possible downward trend in the medium term. At the same time, the price being below both moving averages shows us that the asset is trending downward in the short term. The Chaikin Money Flow (CMF-20) remained in positive territory. However, a decrease in money inflows could push the CMF into negative territory. The Relative Strength Index (RSI-14) remained at a neutral level. At the same time, it continued to be in the lower region of the upward trend that began on September 25, indicating that selling pressure continues. In the event of an uptrend due to macroeconomic data or positive news related to the Solana ecosystem, the $222.61 level stands out as a strong resistance point. If this level is broken upwards, the uptrend is expected to continue. If pullbacks occur due to developments in the opposite direction or profit-taking, the $200.00 level could be tested. A decline to these support levels could increase buying momentum, presenting a potential upside opportunity.
Supports: 200.00 – 189.54 – 181.75
Resistances: 209.93 – 222.61 – 237.53
DOGE/USDT
Thumzup Media provided DogeHash with a $2.5 million loan to help expand its Dogecoin mining fleet.
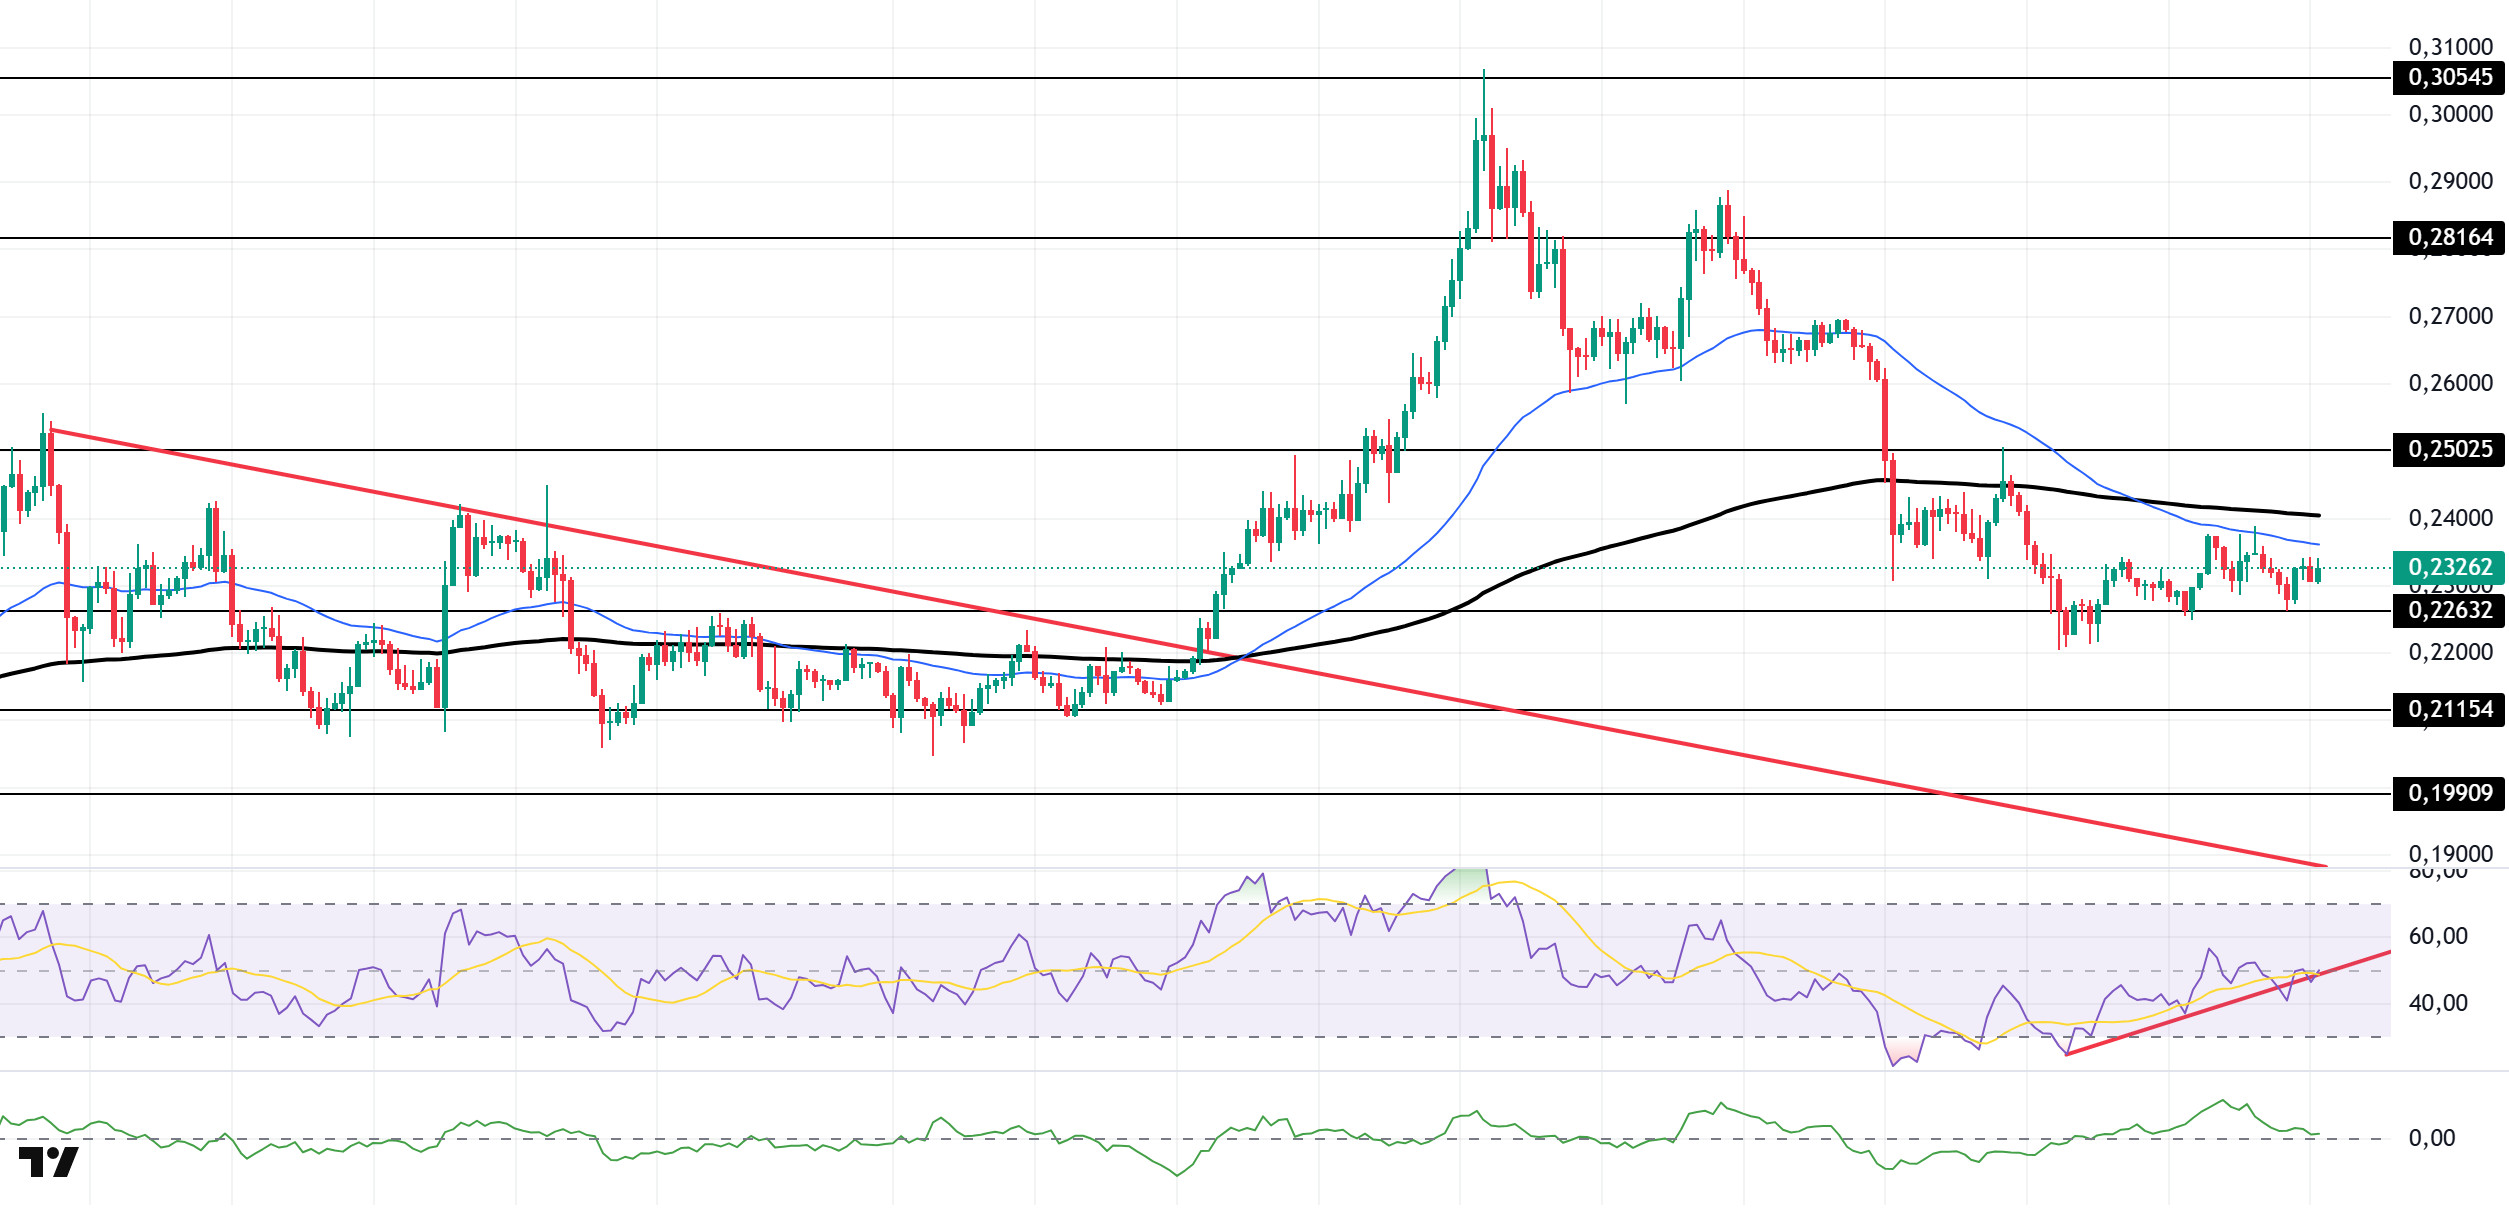
The DOGE price continued its sideways movement. The asset remained above the downward trend that began on August 14. Currently testing the 50 EMA (Exponential Moving Average – Blue Line), a strong resistance level, the price is preparing to test the $0.22632 level, a strong support level. Above the moving average, candle closes could test the $0.25025 level as resistance.
On the 4-hour chart, the 50 EMA (Exponential Moving Average – Blue Line) remained below the 200 EMA (Black Line). This indicates a downward trend in the medium term. The price being below both moving averages indicates a downward trend in the short term. Chaikin Money Flow (CMF-20) managed to stay in positive territory. Additionally, a decrease in money inflows could push CMF into negative territory. The Relative Strength Index (RSI-14) rose to a neutral level and broke above the upward trend that began on September 25. This could create buying pressure. In the event of an uptrend driven by political developments, macroeconomic data, or positive news flow in the DOGE ecosystem, the $0.25025 level stands out as a strong resistance zone. Conversely, in the event of negative news flow, the $0.21154 level could be triggered. A decline to these levels could increase momentum and initiate a new wave of upward movement.
Supports: 0.22632 – 0.21154 – 0.19909
Resistances: 0.25025 – 0.28164 – 0.30545
TRX/USDT
As of September 30, 2025, the total amount of TRX staked is 44,571,763,087, which is 47.08% of the circulating supply. Compared to the previous day, there has been a decrease of approximately 0.02% in the amount staked. However, the TRX market cap has reached $31.6 billion.
Furthermore, a total of 4,737,343 TRX was burned yesterday, permanently removing 821,631 TRX from the circulating supply. This situation is leading to increased deflationary pressure on Tron.
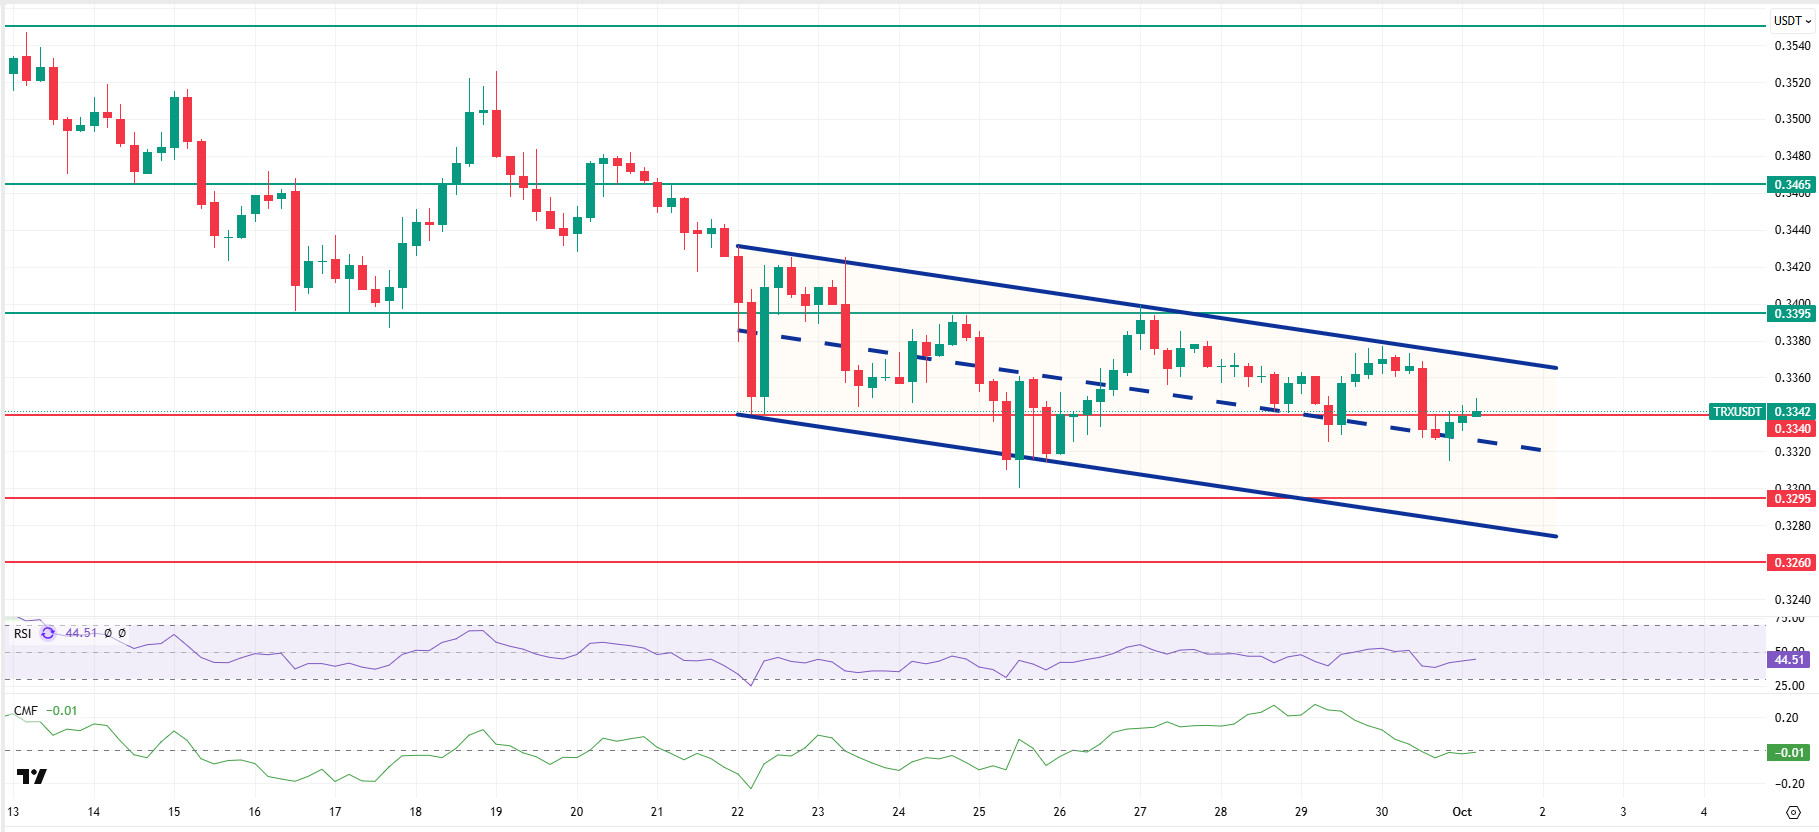
Technically speaking, TRX closed yesterday at $0.3336 after the decline, rose slightly in the morning hours, and is currently trading at $0.3342. Currently in the middle band of the bearish channel, TRX is priced just above the $0.3340 support level on the 4-hour chart. The Relative Strength Index (RSI) value is 44, indicating a sell zone. In addition, the Chaikin Money Flow (CMF) indicator is -0.01, below zero, indicating a decrease in money inflows. This situation signals that sellers’ pressure in the market is increasing and that selling movements may gain strength in the short term.
In light of all these indicators, TRX may decline slightly in the first half of the day, moving towards the lower band of the channel based on its current region and CMF value. It could then test the 0.3340 support level. If it closes below the 0.3340 support level, the decline may continue, potentially testing the 0.3295 support level. If it fails to close below the 0.3340 support level and the CMF indicator moves into positive territory, it may rise slightly with a possible buying reaction and test the 0.3395 resistance level.
On the 4-hour chart, 0.3260 is an important support level, and as long as it remains above this level, the upward momentum is expected to continue. If this support level is broken, selling pressure may increase.
Supports: 0.3340 – 0.3295 – 0.3260
Resistances: 0.3395 – 0.3465 – 0.3550
SHIB/USDT
On-chain indicators in the Shiba Inu ecosystem today paint a picture of tightening supply and strengthening holding tendencies. A net outflow of 154.4 billion SHIB across exchanges indicates that the amount of tokens withdrawn from platforms such as Coinbase and Binance significantly exceeded the amount sent for sale, suggesting that both small and large wallets are avoiding selling and accumulating their assets in self-custody wallets. On the burn side, the permanent removal of 171,407 SHIB from circulation, representing a 22.98% increase compared to previous days, is another factor technically reducing supply. When the burn momentum is considered alongside withdrawals from exchanges, it appears that the visible portion of liquidity on centralized exchanges is narrowing.
The accompanying whale behavior is noteworthy. The confirmation of a total of 139 billion SHIB entering a single Coinbase-sourced wallet supports the narrative that large players are quietly accumulating positions during a period of waning retail investor interest. The overall picture for the day is one where, in an environment of continued caution in trading appetite, net outflows and a limited but reviving burn are tightening the supply side of the ecosystem, a behavior pattern focused on accumulation rather than speculative circulation is coming to the fore, and institutional-grade wallet movements are shaping the agenda with strategic shifts as the end of the quarter approaches.
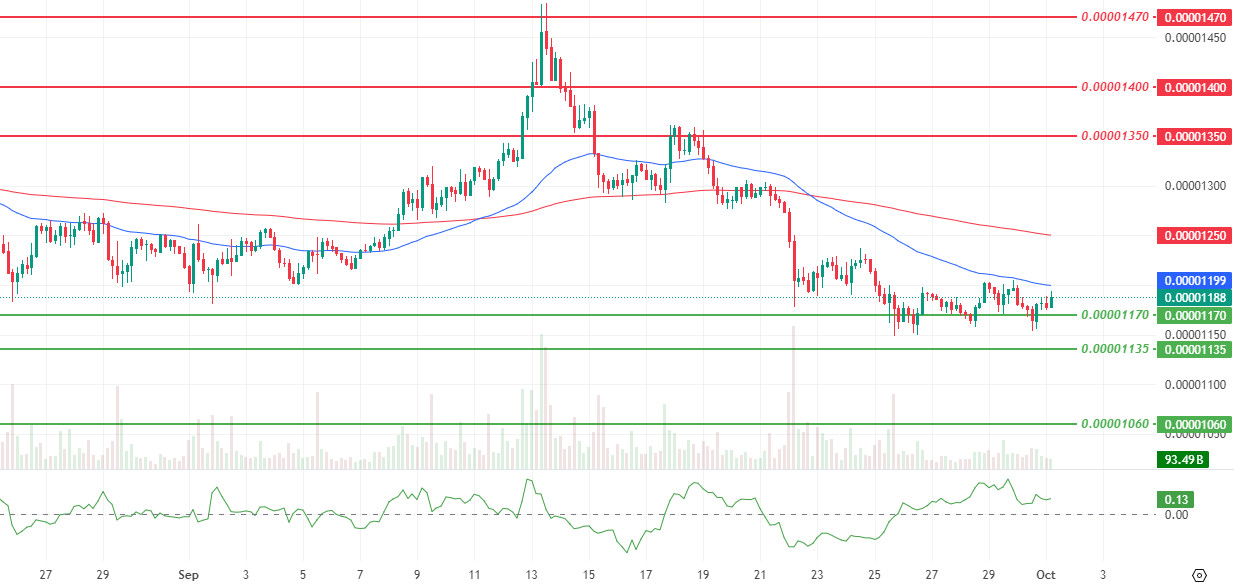
While the technical outlook remains cautiously balanced, the recovery in momentum and trading volume, coupled with declining volatility, is shifting price behavior to a more controlled response. Fresh reaction from the support zone at $0.00001170 strengthens short-term defense, and Chaikin Money Flow (CMF) remains in positive territory with a slight increase, confirming that money flow is supporting the price. However, for upward attempts to gain traction, the price must first close above $0.00001205 and, more importantly, above $0.00001240 on a four-hour basis, as the price remains below the 50 EMA and 200 EMA. If this condition is met, intermediate resistance levels at $0.00001255 and $0.00001350 could come back into play. On the downside, the $0.00001170 region continues to serve as the current defense line, and if prices remain below this level, the likelihood of testing the $0.00001135 and $0.00001060 areas increases.
When signs of recovery are read together with narrowing volatility, a framework is maintained where the search for reactive equilibrium continues, and closing above moving averages and volume confirmation are necessary for sustainability. (EMA50: Blue line, EMA200: Red line)
Supports: 0.00001170 – 0.00001135 – 0.00001060
Resistances: 0.00001350 – 0.00001400 – 0.00001470
Legal Notice
The investment information, comments, and recommendations contained herein do not constitute investment advice. Investment advisory services are provided individually by authorized institutions taking into account the risk and return preferences of individuals. The comments and recommendations contained herein are of a general nature. These recommendations may not be suitable for your financial situation and risk and return preferences. Therefore, making an investment decision based solely on the information contained herein may not produce results in line with your expectations.

