
Technical Analysis
BTC/USDT
Federal Reserve Chair Mary Daly stated that the time for interest rate cuts is approaching due to signs of weakening in the labor market and diminishing signals of persistent inflation, and hinted at the possibility of two or more cuts this year. President Trump announced that tariffs on India will be significantly increased. According to the Wall Street Journal, the White House is preparing an executive order that would penalize banks that do not provide services to crypto companies. A total of 886.39 BTC was transferred from three different wallets belonging to Grayscale to a centralized exchange.
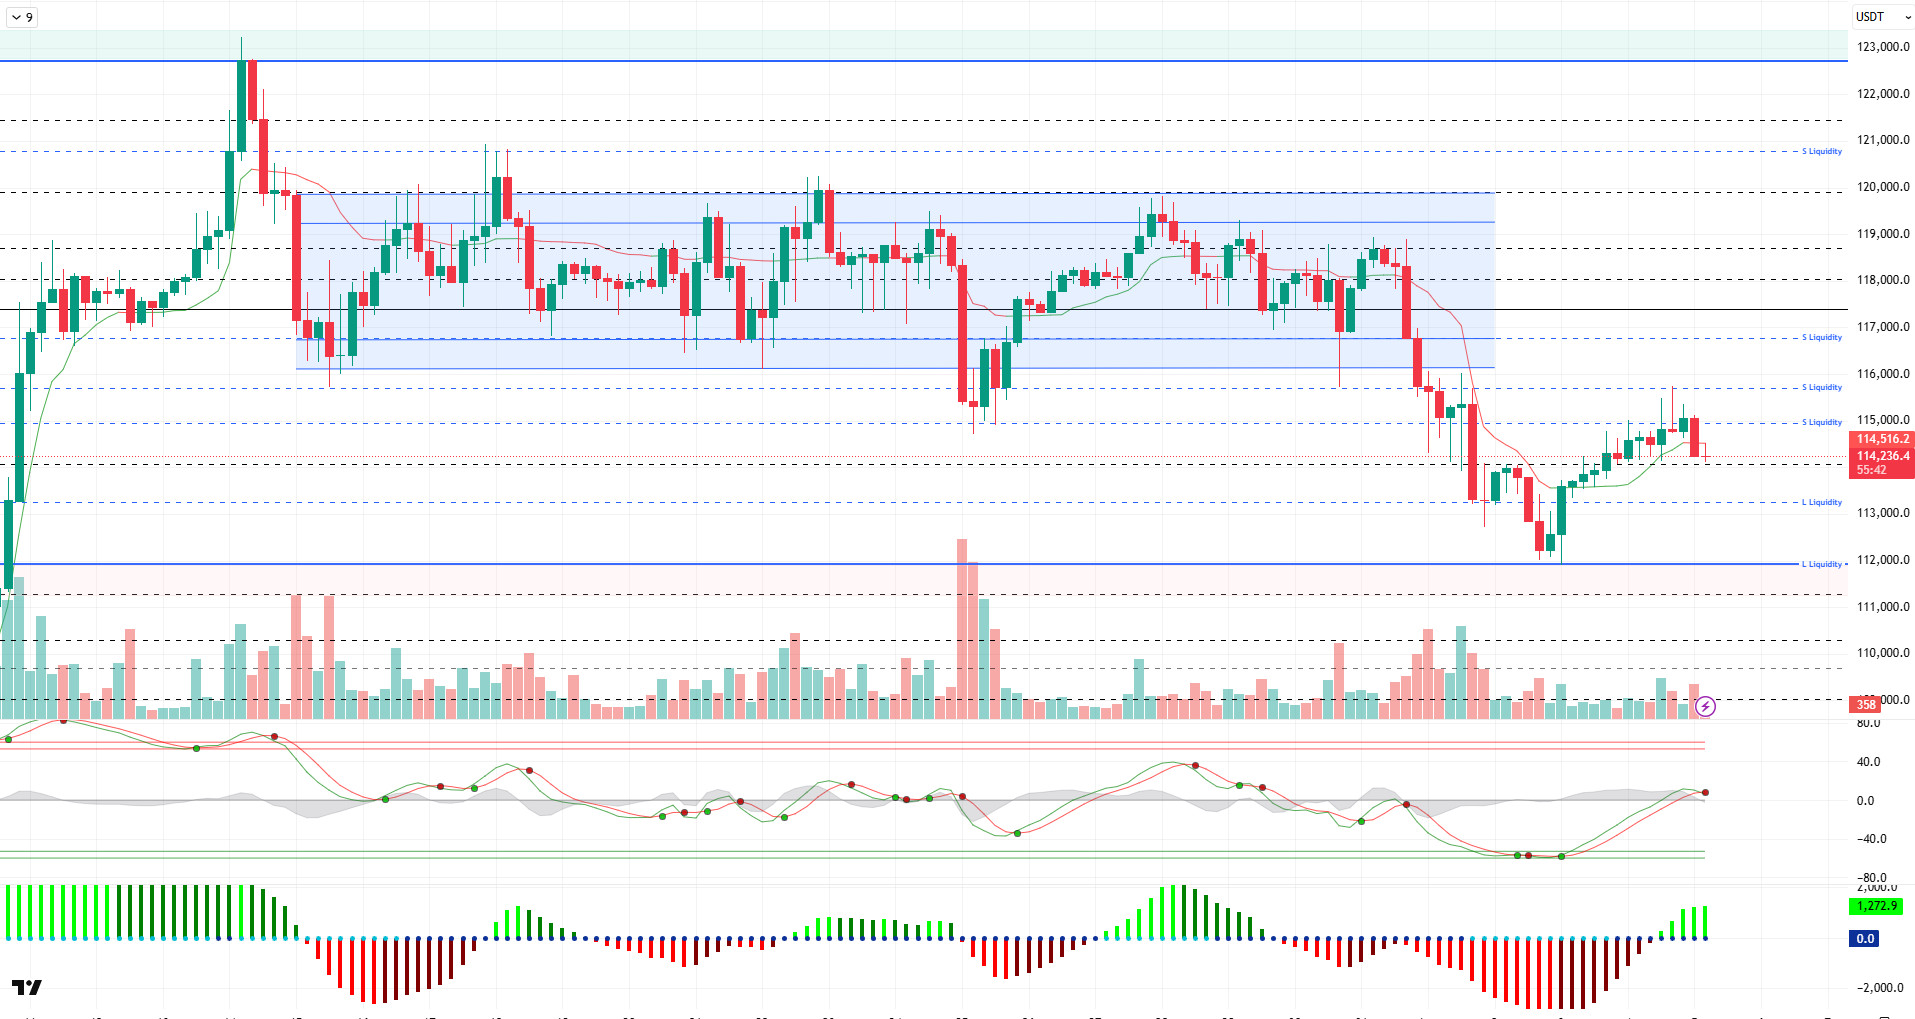
Looking at the technical picture, BTC corrected its decline with support from the 112,000 level and tested the 115,700 level. However, the price failed to hold at this level and fell back to the 114,000 level amid selling pressure. At the time of writing, BTC continues to trade at the 114,300 level. From a technical perspective, the possibility of the price forming a double bottom pattern at the previous low stands out.
Technical indicators show that the upward attack attempt at the middle band of the Wave Trend oscillator was weak, and the indicator has begun to produce downward reversal signals again. The Squeeze Momentum indicator is trying to remain in the positive zone but is struggling to gain momentum. The Kaufman moving average is positioned just above the price at the 114,500 level and is acting as short-term resistance.
Looking at liquidity data, we see that short-term sell positions opened at the 115,000 and 115,700 levels have been liquidated. On the other hand, it is noteworthy that sell accumulation above the 120,000 level continues in a broader time frame. Buy positions are beginning to re-emerge in the 111,500–112,000 range, while some long accumulation is also observed at the 113,000–114,000 levels.
In summary, looking at the key developments, while buying continues on the corporate front, macro, customs, and geopolitical steps continue to put pressure on the market. The technical outlook is losing the ground it had built for an uptrend, while liquidity data continues to draw price limits in the gap area. In this context, if selling pressure intensifies, the 114,000 level emerges as a minor support level, while the 113,200-price gap represents the last support point. On the other hand, the 115,000 level will continue to be monitored as a reference point for upward movement.
Support levels: 114,000 – 113,200 – 112,000
Resistance levels: 115,000 – 116,000 – 116,800
ETH/USDT
According to Onchain Lens data, Sharrpling Gaming purchased approximately 18,680 ETH worth $66.63 million, bringing its total reserves to 498,884 ETH. The current market value of these assets has reached approximately $1.8 billion.
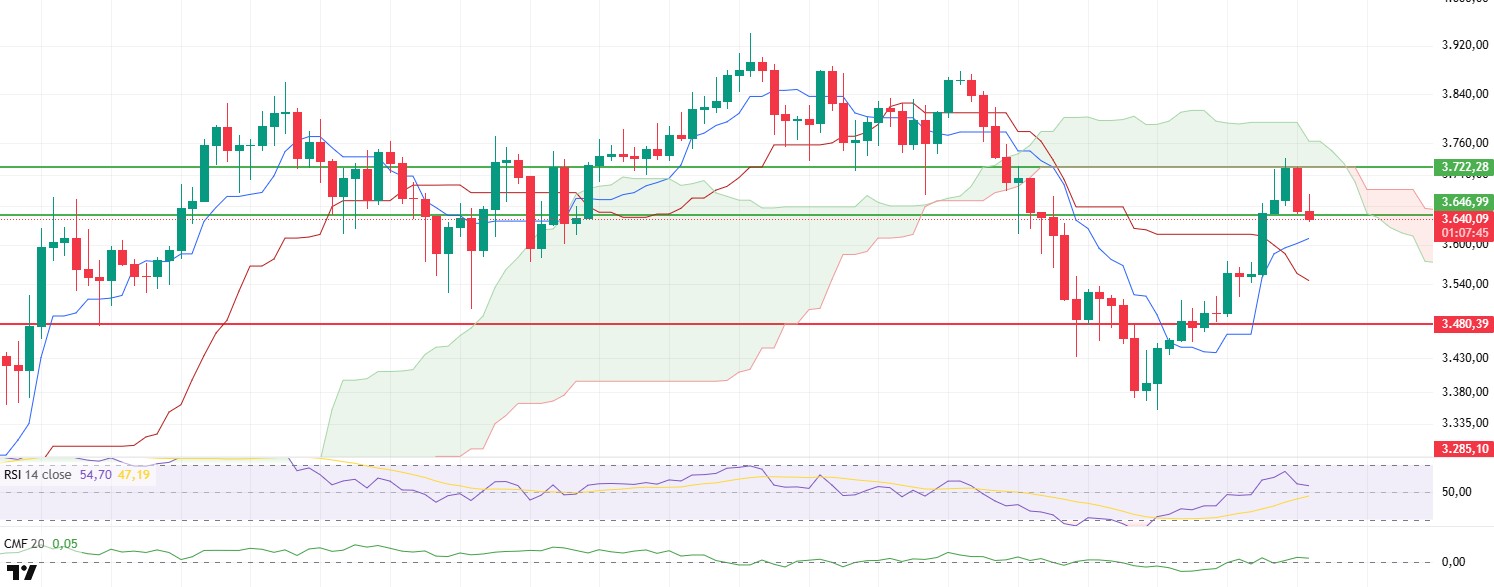
The ETH price managed to hold steady at the 3,480-dollar level in line with expectations yesterday before gaining strong momentum and rising to 3,722 dollars, reaching the lower band of the Ichimoku cloud. This upward movement not only reflects positive price action but also indicates that technical indicators are strengthening, signaling favorable conditions.
With the price settling above the $3.646 level, the Ichimoku indicator showed a notable reversal signal as the Tenkan and Kijun lines crossed upward. This crossover confirms that the market’s short-term momentum has shifted back to the positive side. If the price breaks above the lower band of the Kumo cloud, the likelihood of the trend continuing with a stronger upward movement is quite high.
The Chaikin Money Flow (CMF) indicator continues to remain in positive territory, maintaining its slight upward trend. This indicates that liquidity inflows are continuing in the market and that buyers remain active. The CMF’s positive outlook can be considered an important factor supporting the upside scenario.
In general, if the price stays above the $3.646 level during the day, it is likely to test the Ichimoku cloud’s lower band at $3.722 again. A clear break above this area would allow the uptrend to continue with increased momentum. On the other hand, closes below the 3.646-dollar level could weaken short-term momentum, potentially opening the door to a limited pullback. Therefore, the aforementioned support level is expected to play a decisive role in price behavior.
Top of Form
Below the Form
Support levels: 3,646 – 3,480 – 3,285
Resistance levels: 3,722 – 4,084 – 4,381
XRP/USDT
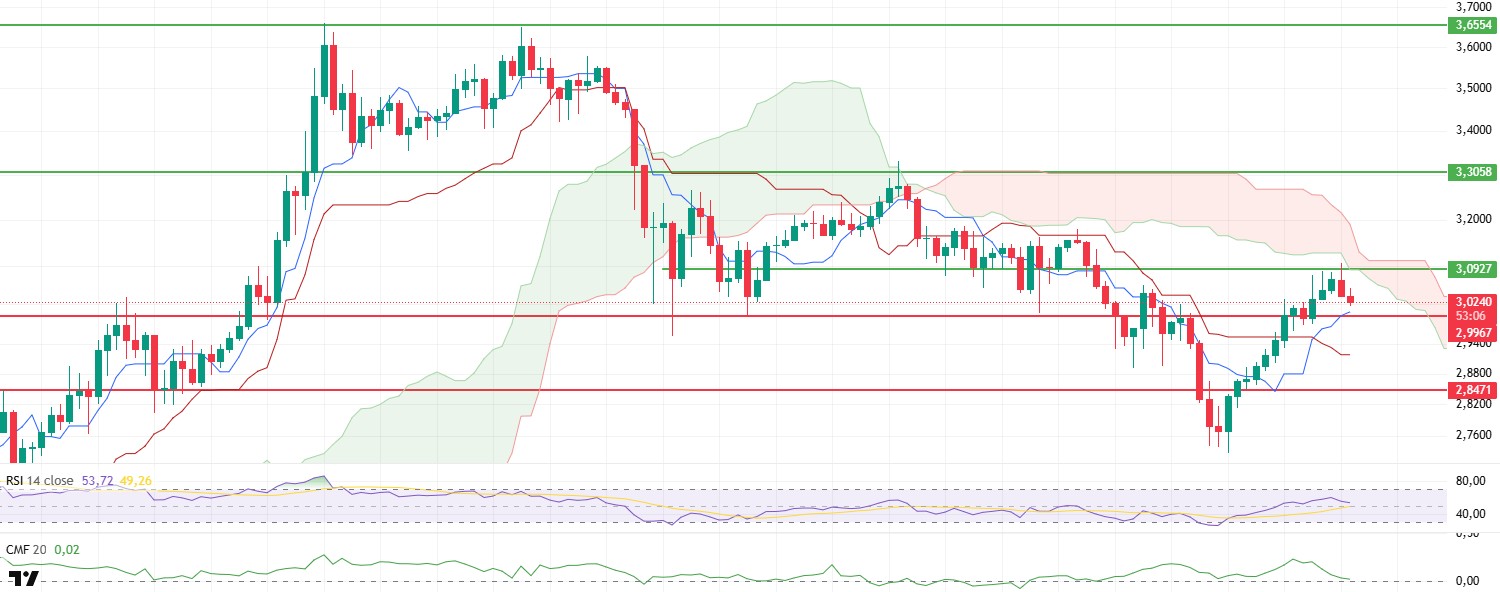
XRP managed to regain the 2.99-dollar level, which had been tested multiple times before and is considered quite critical from a technical perspective. Following this move, the price gained upward momentum and rose to the 3.10-dollar level, which is the lower band of the Ichimoku cloud. However, the price retreated back to the $2.99 support level due to selling pressure from this region. This indicates that the market remains indecisive in this area and that upward movements are currently limited.
When examining the Ichimoku indicator, a notable development in the short-term outlook is that the tenkan line has crossed above the kijun line. This crossover suggests that short-term buy signals are gaining strength and that the price may attempt an upward move. However, the price is still trading below the kumo cloud. This indicates that the overall structure remains intact, and a sustained move above this level is necessary to confirm a clear trend reversal in the market.
The Chaikin Money Flow (CMF) indicator provides an important signal regarding liquidity flow in the market. The indicator, which has fallen back to the zero line along with the latest movement, shows that buying pressure has decreased and money outflows from the market have increased. This situation should be monitored closely in terms of the sustainability of the uptrend.
If the $2.99 level holds as support for the rest of the day, it could allow the price to rebound slightly. However, if this level is broken, the first strong support level to watch will be $2.91, which also coincides with the kijun line. A pullback to this area could be decisive in testing buyer sentiment.
Supports: 2.9967 – 2.8471 – 2.6513
Resistances: 3.0927 – 3.3058 – 3.6554
SOL/USDT
DeFi Development Corp added 110,466 SOL to its treasury. Solana Mobile’s Seeker smartphone begins shipping today with over 150,000 pre-orders.
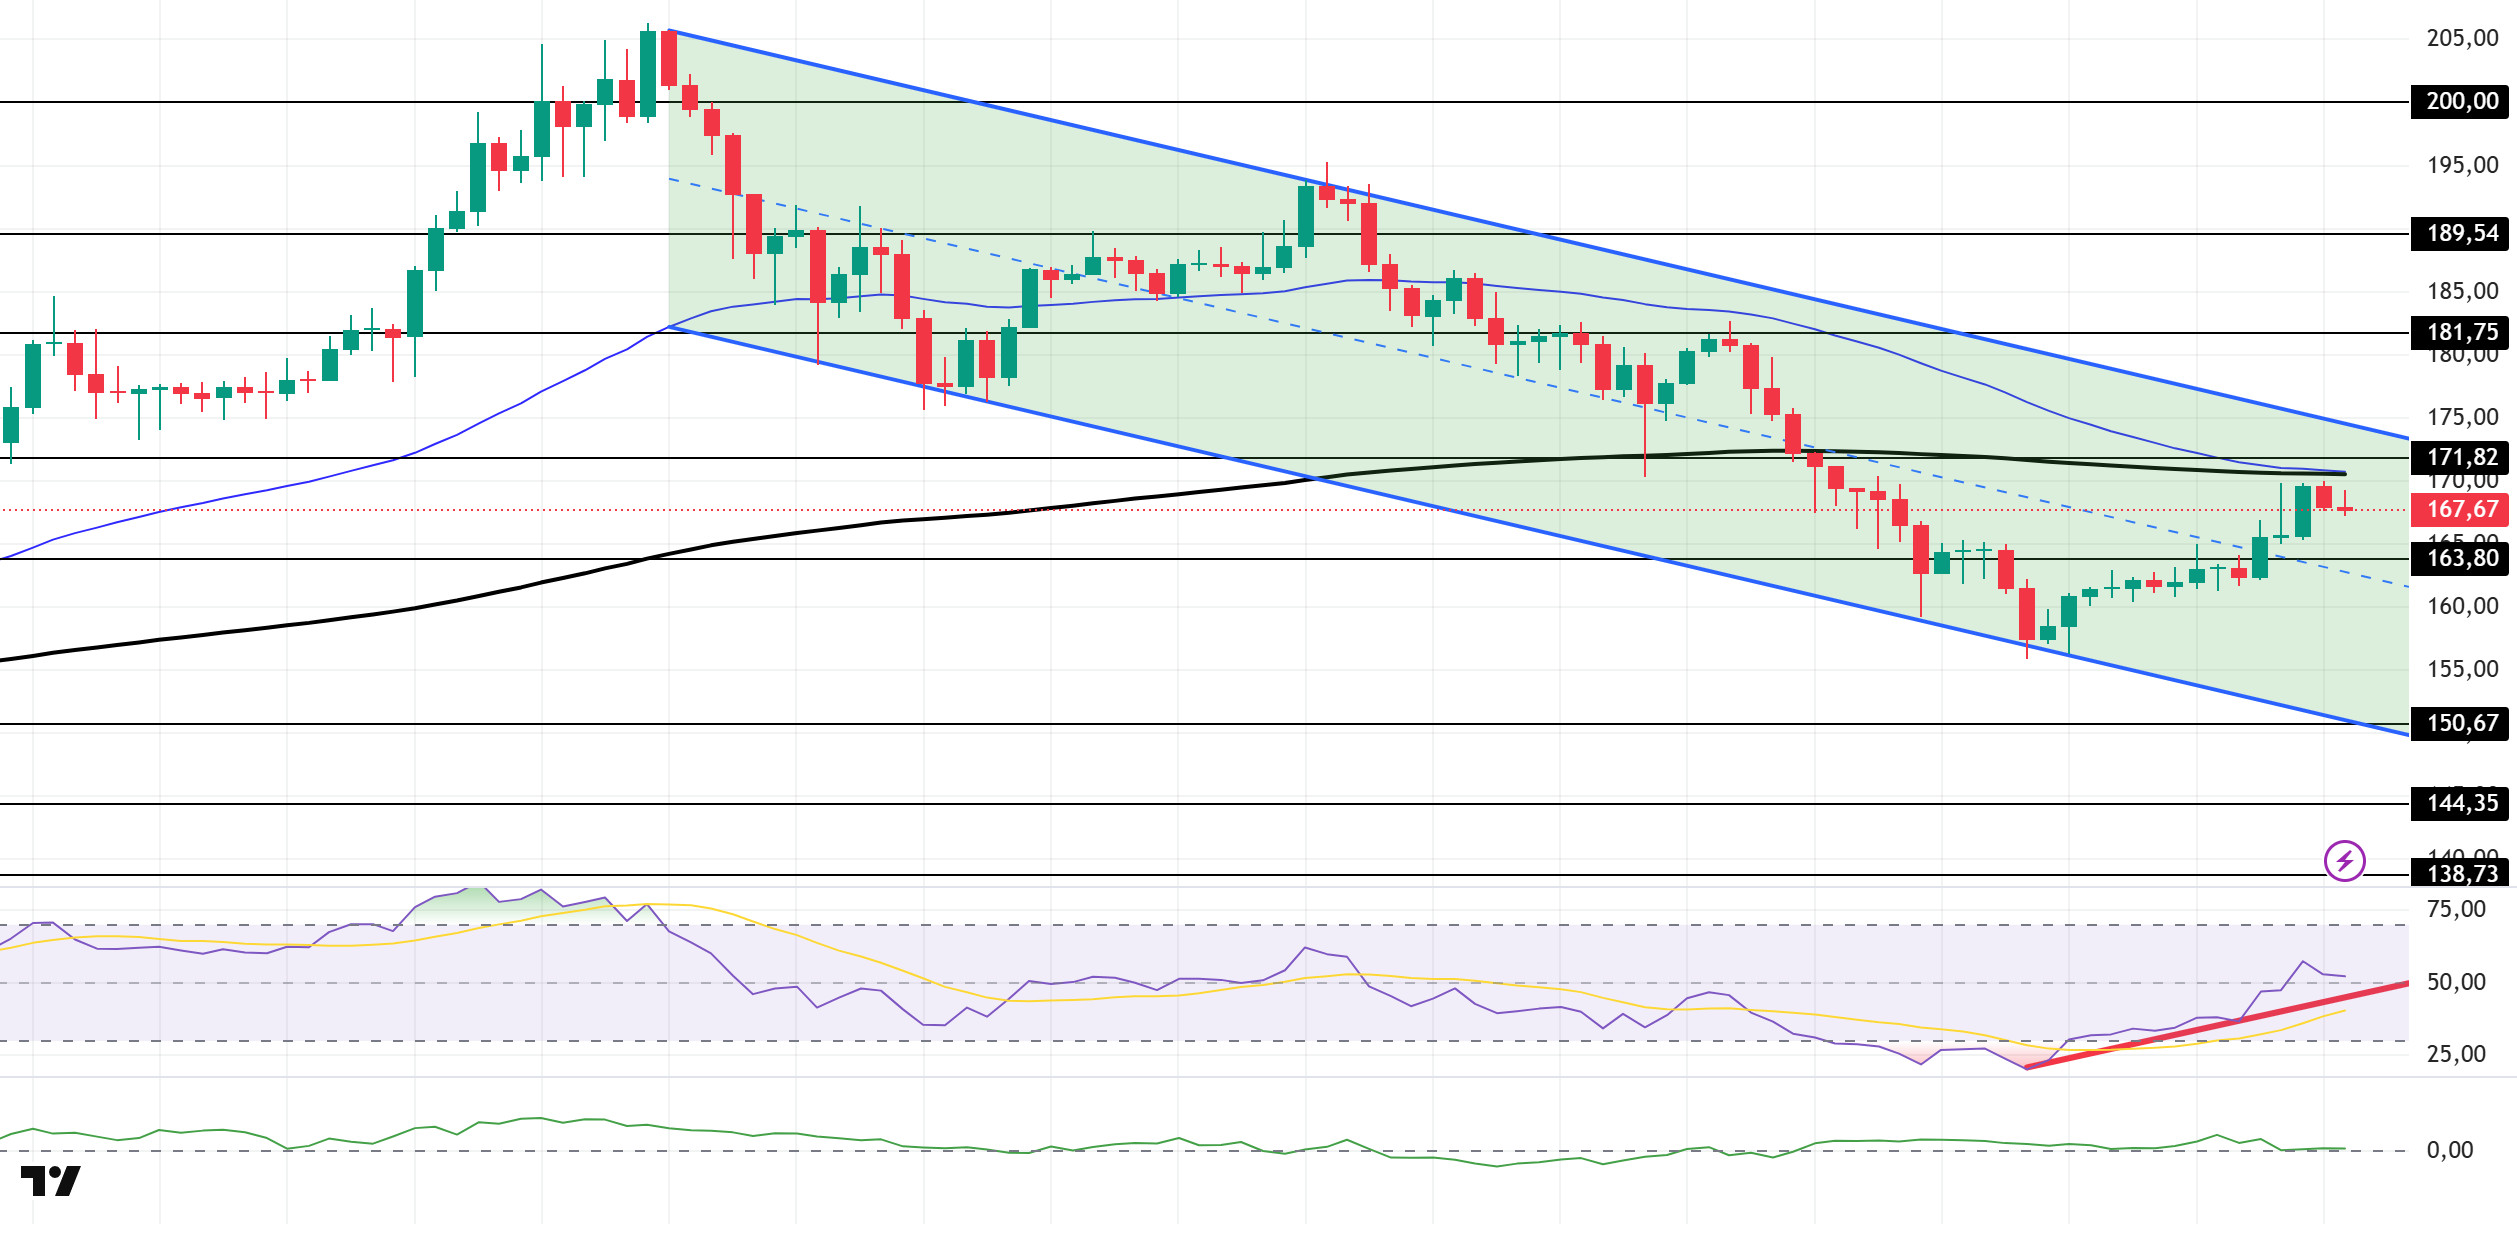
SOL price continued its horizontal trend. The asset remained within the downward trend that began on July 23. The price, which continues to remain below the 200 EMA (Black Line) moving average, is currently testing the 50 EMA (Blue Line) and 200 EMA (Black Line) moving averages as resistance. If the upward trend continues, the 171.82-dollar level can be monitored. In the event of a contrary movement, the 163.80-dollar level should be monitored as a support level.
On the 4-hour chart, the 50 EMA (Blue Line) remains above the 200 EMA (Black Line). This indicates that the upward trend may continue in the medium term. At the same time, the price being below both moving averages shows that the market is currently in a downward trend. The Chaikin Money Flow (CMF-20) remains in positive territory. However, an increase in money inflows could push the CMF into the upper levels of the positive zone. The Relative Strength Index (RSI-14) is above the upward trend that began on August 2. This indicates that buying pressure is continuing. If there is an upward movement due to macroeconomic data or positive news related to the Solana ecosystem, the $171.82 level emerges as a strong resistance point. If this level is broken upward, the upward trend is expected to continue. In case of pullbacks due to developments in the opposite direction or profit-taking, the $163.80 level could be tested. A decline to these support levels could increase buying momentum, presenting a potential opportunity for an upward move.
Support levels: 163.80 – 150.67 – 144.35
Resistance levels: 171.82 – 181.75 – 189.54
DOGE/USDT
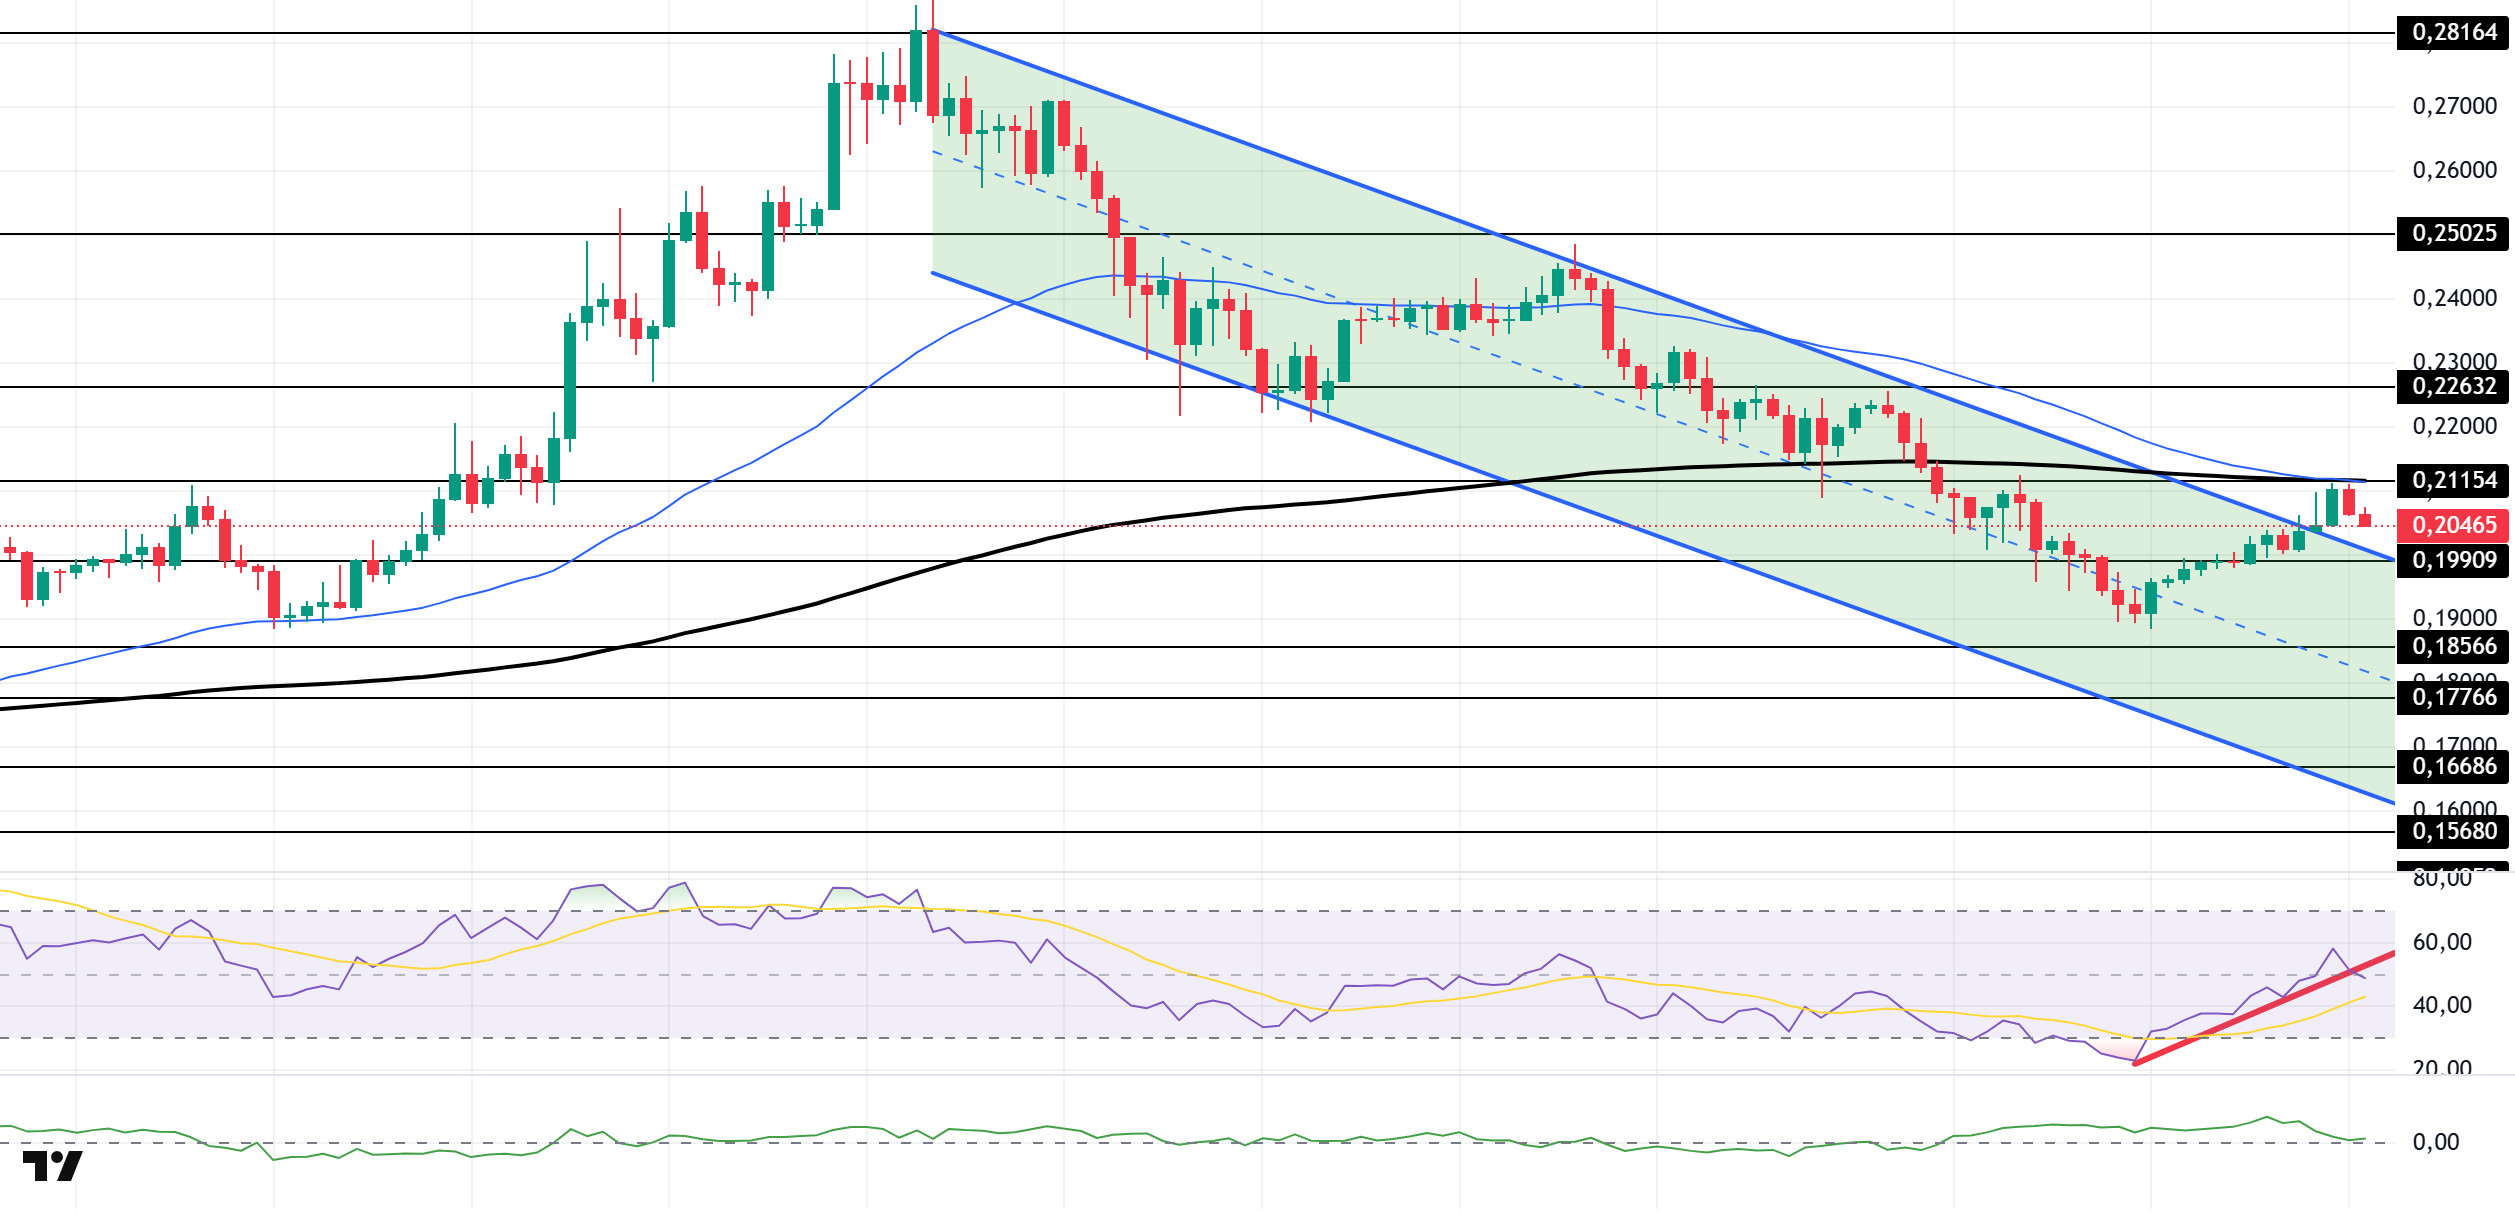
The DOGE price showed a slight increase. The asset broke the downward trend that began on July 21 and continued its upward movement, currently testing the 50 EMA (Blue Line) and 200 EMA (Black Line) moving averages as resistance levels. If the upward trend continues, the 0.22632 dollar level should be monitored. In the event of a pullback, the 0.19909-dollar level can be tracked as support.
On the 4-hour chart, the 50 EMA (Blue Line) remains above the 200 EMA (Black Line). This indicates that the asset is in an upward trend in the medium term. The price being below both moving averages signals that the asset is in a downward trend in the short term. The Chaikin Money Flow (CMF-20) remains positive. Additionally, negative cash inflows could push the CMF into negative territory. The Relative Strength Index (RSI-14) has moved into positive territory. It has also remained above the upward trend that began on August 2. However, it is currently testing this trend as support. In the event of potential increases driven by political developments, macroeconomic data, or positive news flow within the DOGE ecosystem, the $0.22632 level emerges as a strong resistance zone. In the opposite scenario or in the event of negative news flow, the 0.19909 dollar level could be triggered. A decline to these levels could increase momentum and potentially trigger a new upward wave.
Support levels: 0.19909 – 0.18566 – 0.17766
Resistance levels: 0.21154 – 0.22632 – 0.25025
Legal Notice
The investment information, comments, and recommendations contained herein do not constitute investment advice. Investment advisory services are provided individually by authorized institutions taking into account the risk and return preferences of individuals. The comments and recommendations contained herein are of a general nature. These recommendations may not be suitable for your financial situation and risk and return preferences. Therefore, making an investment decision based solely on the information contained herein may not produce results in line with your expectations.

