
Technical Analysis
BTC/USDT
The Trump administration announced that a 100% tariff will be imposed on semiconductor products without a production commitment in the US. In an announcement made alongside Apple CEO Tim Cook, it was stated that Apple will add 100 billion dollars to its investments in the US, bringing the total investment amount to 600 billion dollars. President Trump stated on social media that the reciprocal tariffs would take effect tonight. Japan-based ANAP Lightning Capital purchased an additional 82.33 BTC, bringing its total Bitcoin holdings to 913.45. Minneapolis Fed President Kashkari said that the economic slowdown increases the likelihood of an interest rate cut, while San Francisco Fed President Daly said that weakness in the labor market may require such a decision. Fed Chairman Cook pointed to sharp revisions in July employment data as a sign of economic fragility.
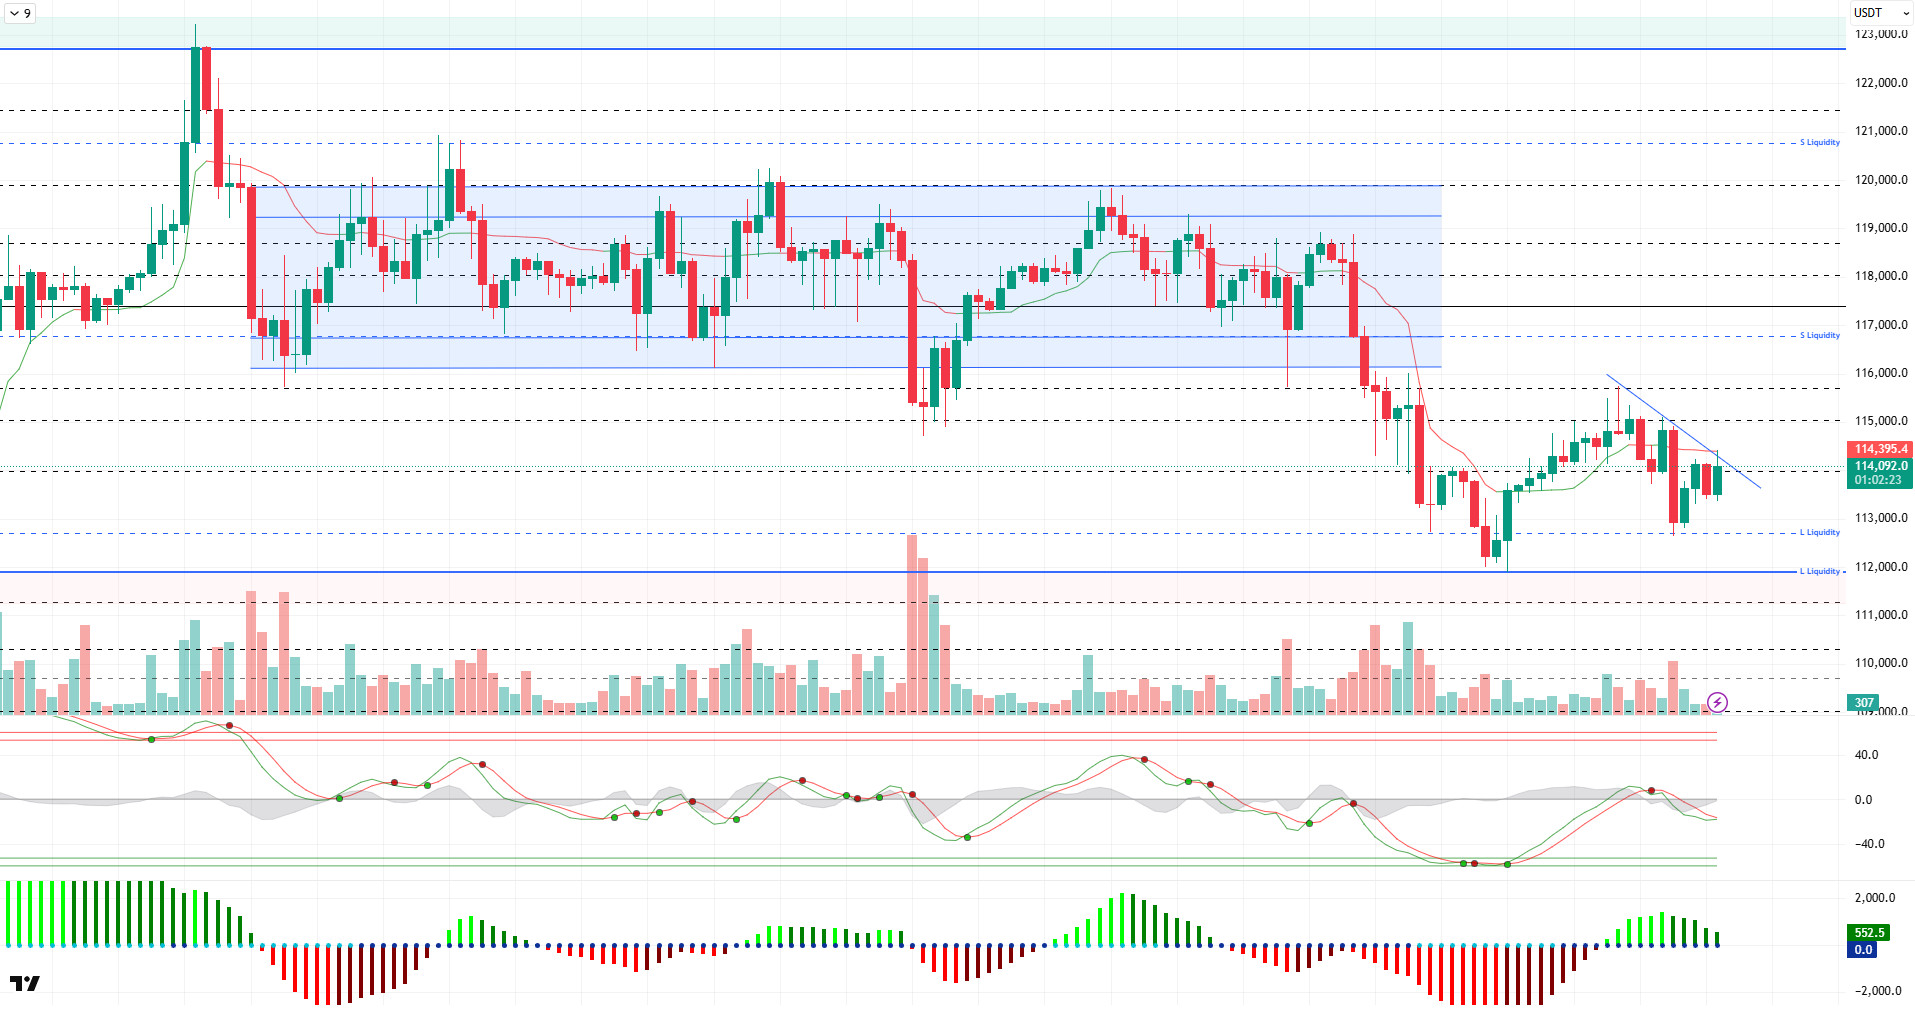
Looking at the technical picture, BTC managed to hold above the 115,000 level for a while after breaking the short-term minor downtrend line. However, it failed to maintain its position in this region and fell back to the 114,500 level following selling pressure after the double top formation at 115,700. At the time of writing, BTC continues to trade at the 114,700 level.
Technical indicators show that the Wave Trend oscillator (WT) has weakened again after a trend reversal in the middle band of the channel. The Squeeze Momentum (SM) indicator remains in positive territory but is struggling to gain momentum. The Kaufman moving average is currently acting as support just below the price at 114,450.
Looking at liquidity data, we see that some of the sell-side transactions opened in the 115,000–116,000 band have been liquidated, while a new accumulation zone has formed at the 116,500 level. In the broader time frame, sell-side positions remain concentrated above the 120,000 level. Buy-side transactions, however, are observed in a more sparse structure at the 113,100 level, indicating that the buyer side has not been able to establish a strong position.
In summary, although the market appears to have calmed down somewhat in terms of fundamental developments, statements from the Trump administration and announcements regarding new trade tariffs continue to weigh on risk appetite. The technical structure shows signs of weakening on the upside after previously establishing a favorable ground for upward movement. Liquidity data indicates that the new potential target is 116,700. This area could emerge as a liquidity target in the event of a potential upward move. However, if selling pressure intensifies, the 114,000 level should be monitored as a critical support point. A break below this level could lead to a pullback to the 111,000–112,000 range.
Support levels: 114,000 – 113,200 – 112,000
Resistance levels: 115,000 – 116,000 – 116,800
ETH/USDT
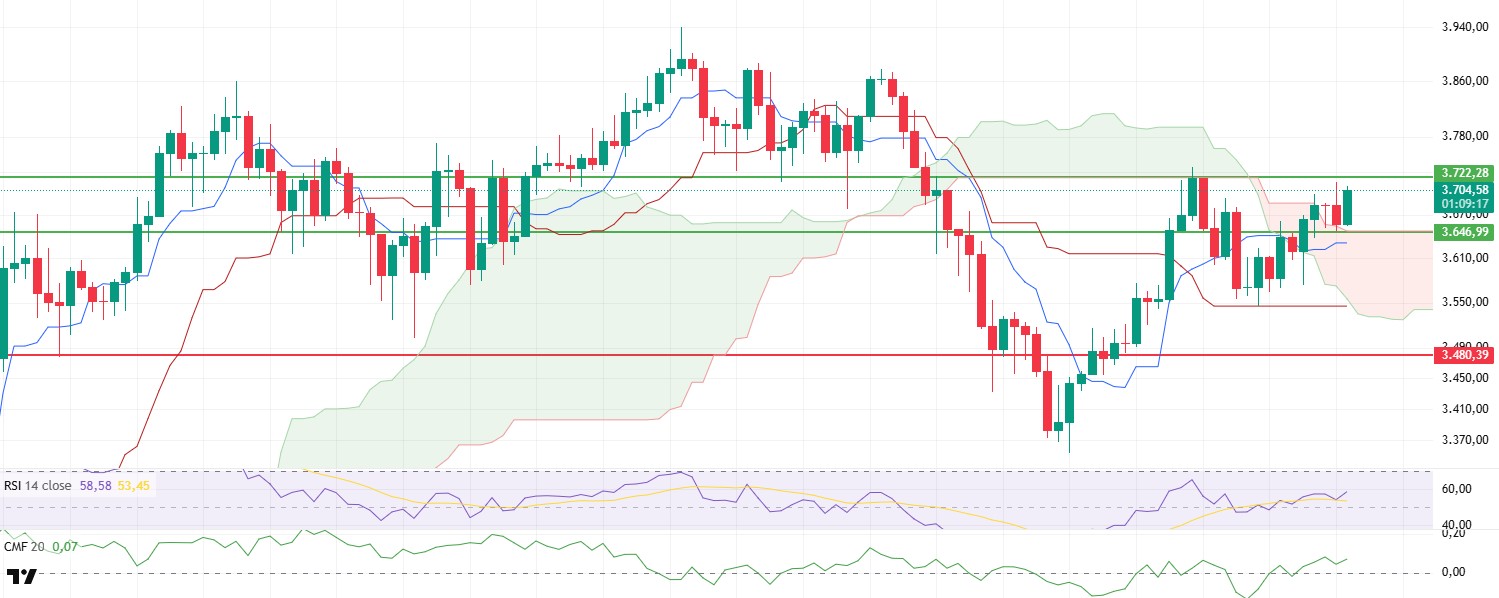
ETH broke through the strong resistance zone at $3,646 yesterday evening and continued its upward momentum, rising to $3,722. With selling pressure from this level, the price briefly retested the $3,646 level in the short term but maintained its upward structure with support from this zone and continued its upward trend.
Technical indicators generally show that the recovery is gaining momentum. In particular, the price rising above the Kumo cloud in the Ichimoku indicator indicates that the short-term trend is turning upward, while the upward breaks seen at the Tenkan and Kijun levels also support this positive structure. This structure of the Ichimoku indicator suggests that the price has formed a reliable support base for both the short and medium term, indicating that buyers are re-entering the market with renewed strength.
In addition, indicators on the volume and money flow side also show that this rise is based on a healthy foundation. The Chaikin Money Flow (CMF) indicator continues its positive trend, signaling that liquidity is still flowing into the market, while the Relative Strength Index (RSI) indicator maintains its upward trend and moves above the neutral zone, confirming that buying momentum is strengthening. Both indicators reveal that the current uptrend is supported by both demand and volume.
In general, if the ETH price breaks above the $3,722 level, it could accelerate towards the next resistance zone of $3,780–$3,820. The movement up to this region is likely to progress in line with both momentum and trend indicators from a technical perspective. However, a close below the $3.646 level could weaken the current positive outlook, potentially leading to the price entering a short-term correction phase.
Top of Form
Below the Form
Support levels: 3,646 – 3,480 – 3,285
Resistance levels: 3,722 – 4,084 – 4,381
XRP/USDT
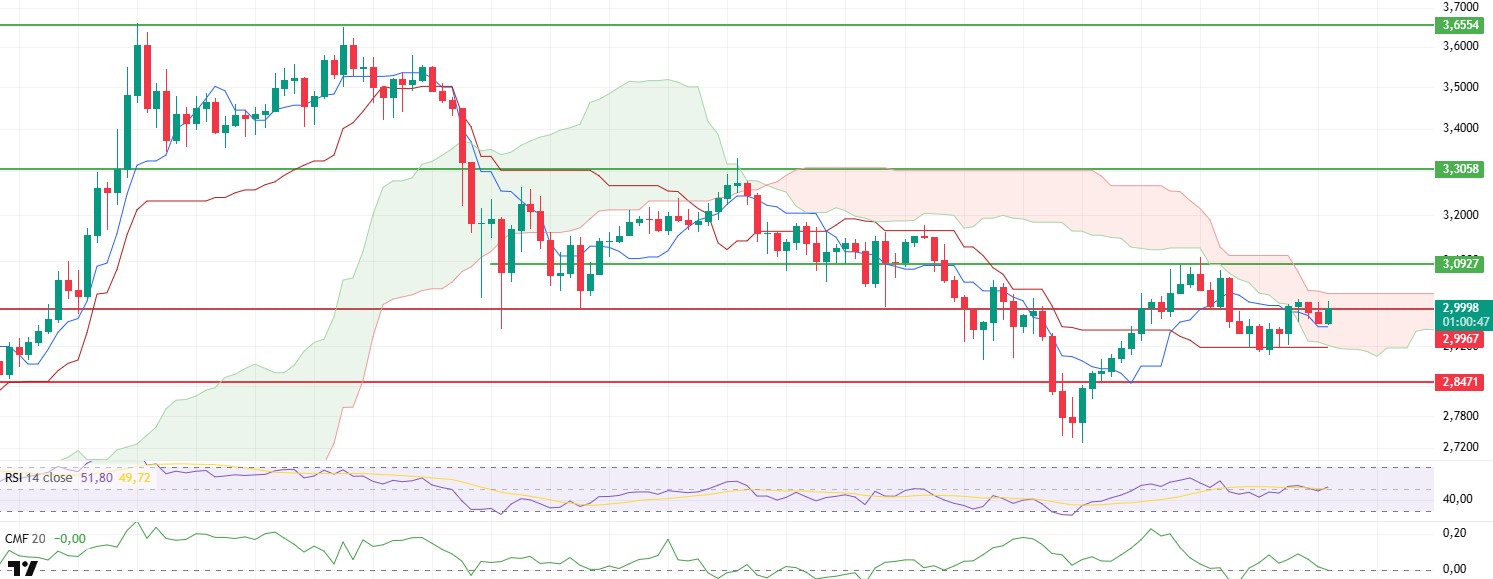
XRP showed resistance against downward pressure with support from the kijun level yesterday and rose back to the main resistance zone at $2.99. Following this movement, the price took on a horizontal and indecisive structure at the aforementioned level, indicating that the market is searching for direction and that investors are taking a cautious stance in the short term. The current consolidation at the 2.99 dollar level indicates that a technically critical threshold has been reached.
When examining the Ichimoku indicator, the fact that the price is currently positioned within the kumo cloud clearly confirms that the market is in a phase of indecision. This structure reflects a balanced environment where neither buyers nor sellers are dominant. Closes above the upper band of the kumo cloud are of critical importance for the price to potentially resume a strong upward trend. If the price manages to sustain itself above the cloud, the likelihood of the market structure shifting to a positive trend and short-term resistance levels being broken more quickly increases.
On the other hand, the Chaikin Money Flow (CMF) indicator is moving horizontally around the zero line, indicating that there is currently no significant imbalance between capital entering and exiting the market. This situation suggests that there is no strong liquidity flow in the market and that investors are hesitant to open new positions. A break above the zero line by the CMF could be interpreted as a potential signal of buying pressure.
In conclusion, the reaction of the XRP price at the $2.99 level during the day is critical for determining the short-term direction. If this resistance zone is broken with high volume and the price settles above the cloud, it could pave the way for the bullish technical structure to gain strength and the price to accelerate towards higher resistance levels. However, in an alternative scenario, where the $2.99 resistance level is not breached and the price remains within the cloud or dips toward the lower band, the possibility of limited pullbacks remains on the table.
Supports: 2.8471 – 2.6513 – 2.4795
Resistances: 2.9967 – 3.0927 – 3.3058
SOL/USDT
BIT Mining launched its first Solana validator with an investment of 4.89 million dollars.
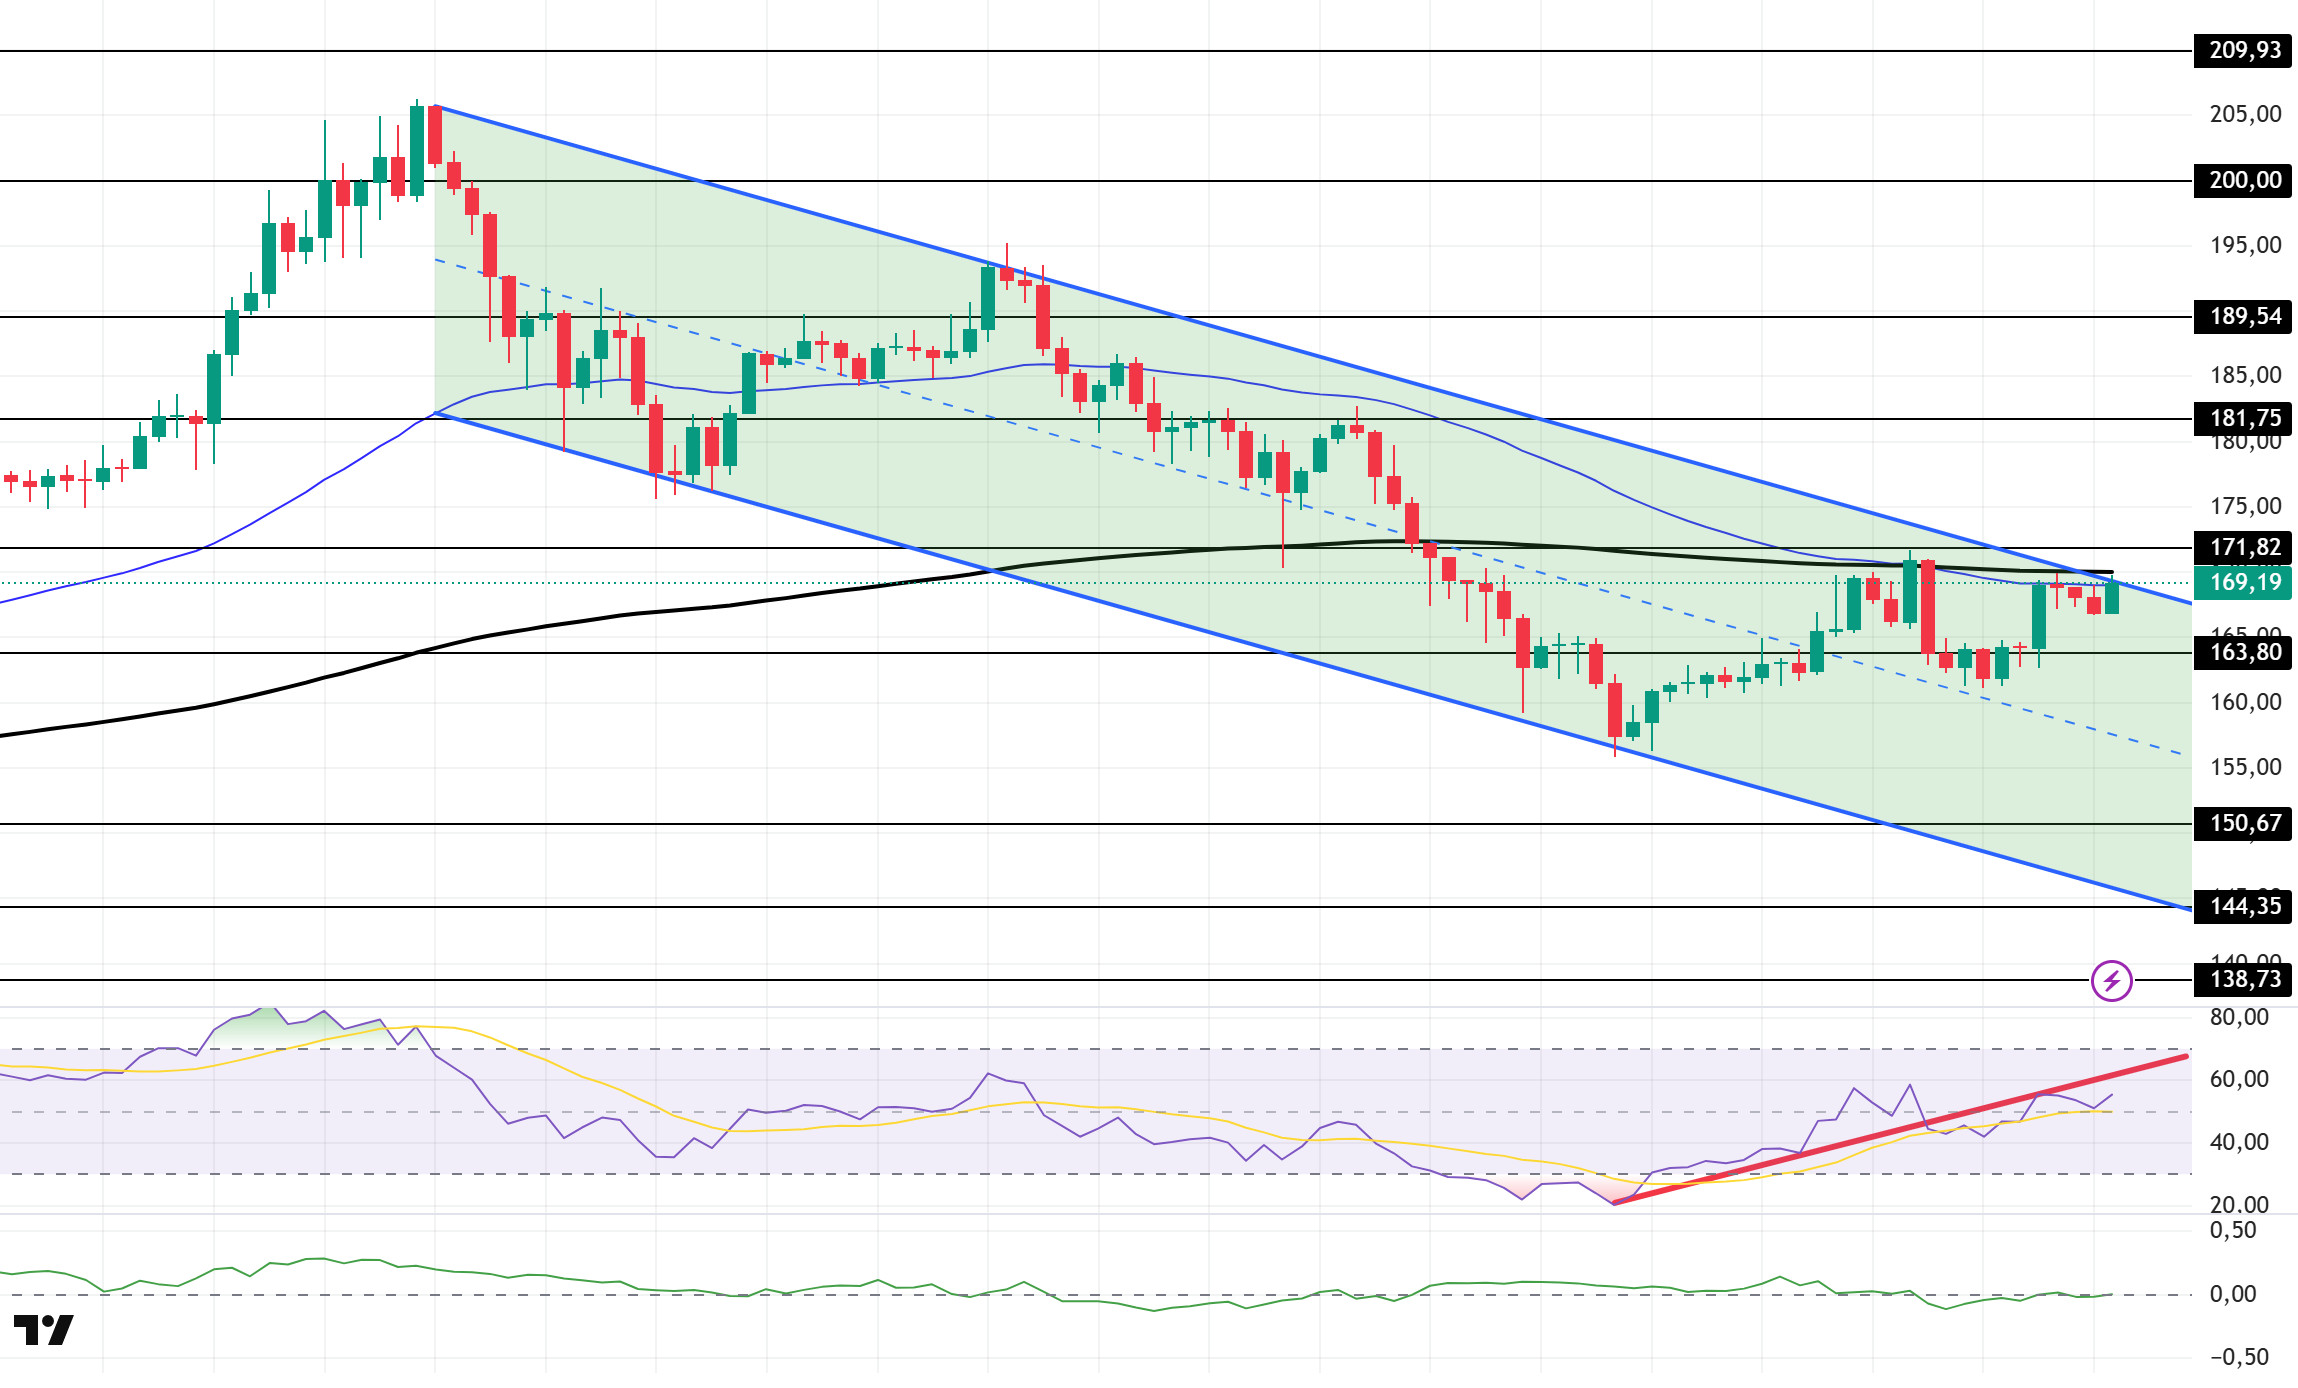
The SOL price showed a slight increase. The asset continued to remain within the downward trend that began on July 23. At the same time, the price, which continues to remain below the 200 EMA (Black Line) and 50 EMA (Blue Line) moving averages, is currently testing the 50 EMA and the trend’s ceiling level as resistance. The $181.75 level can be monitored for candle closes above the downward trend. In case of pullbacks, the $163.80 level should be monitored as a support level.
On the 4-hour chart, the 50 EMA (Blue Line) continues to remain below the 200 EMA (Black Line). This indicates that the upward trend may continue in the medium term. At the same time, the price being below both moving averages shows that the market is currently in a downward trend. The Chaikin Money Flow (CMF-20) is at a neutral level. However, a decrease in money inflows could push the CMF into the negative zone. The Relative Strength Index (RSI-14) remains in the positive zone but continues to trade below the upward trend that began on August 2. This suggests that selling pressure may be present. In the event of an upward movement driven by macroeconomic data or positive news related to the Solana ecosystem, the $181.75 level emerges as a strong resistance point. If this level is broken to the upside, the upward movement is expected to continue. In case of pullbacks due to developments in the opposite direction or profit-taking, the 150.67 dollar level could be tested. A decline to these support levels could increase buying momentum, presenting a potential opportunity for an upward movement.
Support levels: 163.80 – 150.67 – 144.35
Resistance levels: 171.82 – 181.75 – 189.54
DOGE/USDT
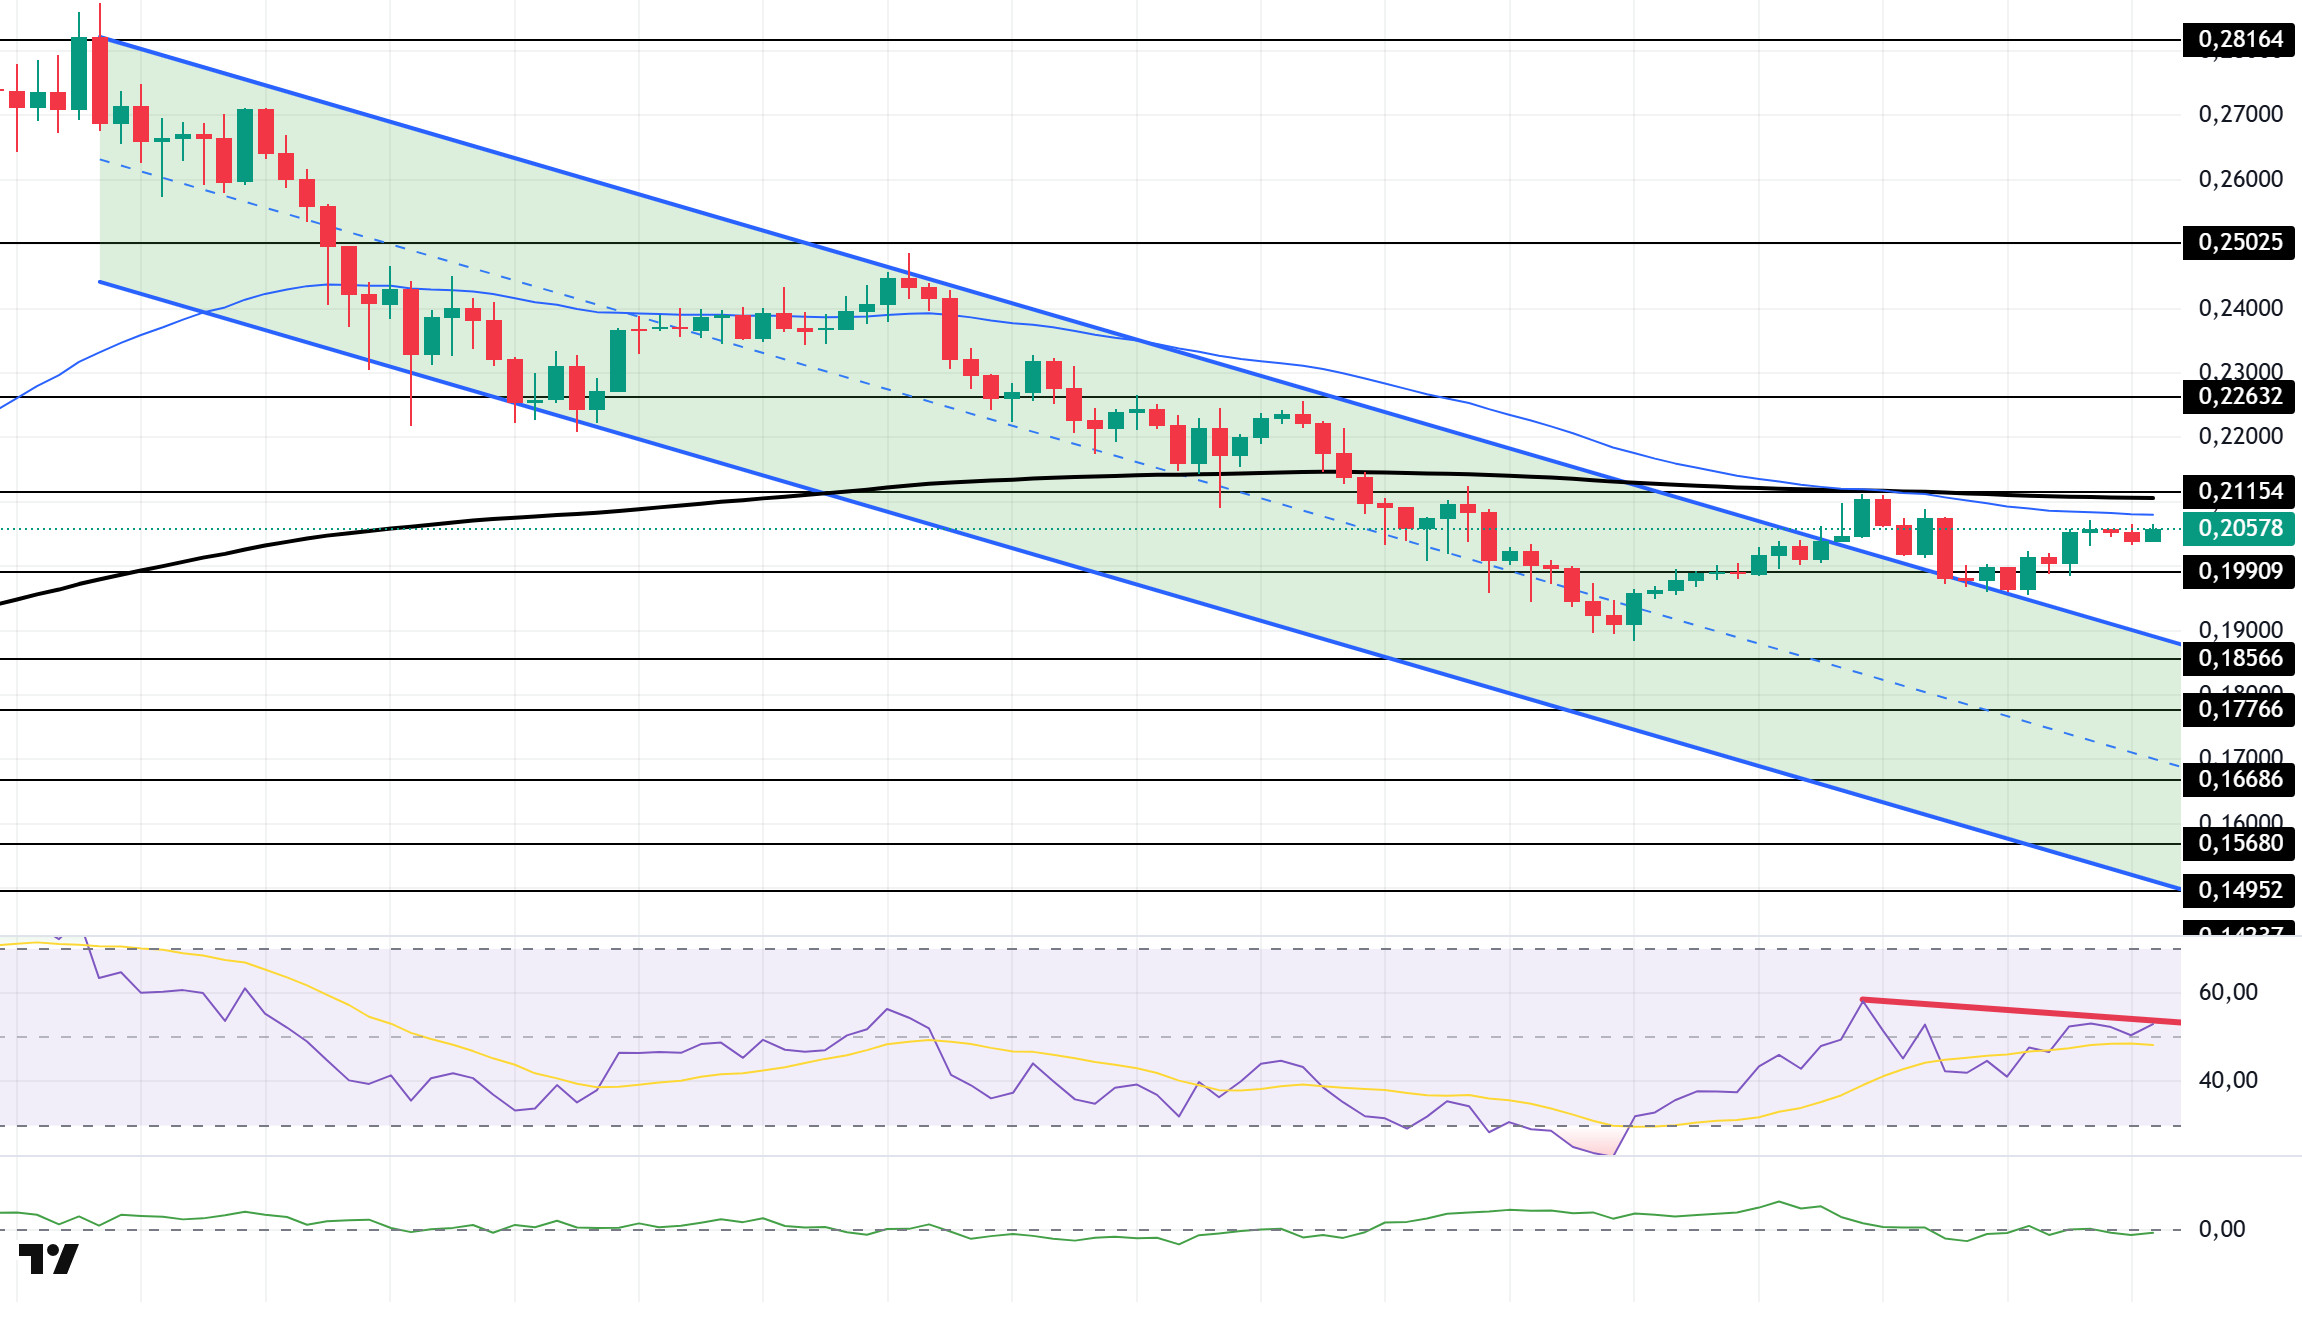
The DOGE price continued its horizontal movement. The asset broke the downward trend that began on July 21 and has remained above it. The price, which is below the 50 EMA (Blue Line) and 200 EMA (Black Line) moving averages, tested the ceiling of the upward trend as support and is currently testing the moving averages while showing an upward movement. If the upward movement continues, the $0.22632 level can be monitored as resistance.
On the 4-hour chart, the 50 EMA (Blue Line) remained below the 200 EMA (Black Line). This indicates that the asset is in a downward trend in the medium term. The price being below both moving averages also indicates that the asset is in a downward trend in the short term. The Chaikin Money Flow (CMF-20) remained at a neutral level. Additionally, negative cash inflows could push the CMF into negative territory. The Relative Strength Index (RSI-14) has moved back into positive territory. At the same time, the indicator, which is below the downward trend that began on August 4, signals the formation of selling pressure. In the event of potential increases driven by political developments, macroeconomic data, or positive news flow within the DOGE ecosystem, the $0.22632 level emerges as a strong resistance zone. In the opposite scenario or in the event of negative news flow, the 0.18566 dollar level could be triggered. A decline to these levels could lead to increased momentum, potentially initiating a new upward wave.
Support levels: 0.19909 – 0.18566 – 0.17766
Resistance levels: 0.21154 – 0.22632 – 0.25025
Legal Notice
The investment information, comments, and recommendations contained herein do not constitute investment advice. Investment advisory services are provided individually by authorized institutions taking into account the risk and return preferences of individuals. The comments and recommendations contained herein are of a general nature. These recommendations may not be suitable for your financial situation and risk and return preferences. Therefore, making an investment decision based solely on the information contained herein may not produce results in line with your expectations.

