TECHNICAL ANALYSIS
BTC/USDT
In the US, non-farm payrolls (NFP) data came in at 228K, well above expectations, while the unemployment rate rose to 4.2%, 4.1% above market expectations. China announced that it will impose a 34% tariff on all imports from the US, while Japanese PM Ishiba described the current tariff wars as a “national crisis” and announced plans to establish a global response organization. Trade wars are expected to increase the pressure on the markets.
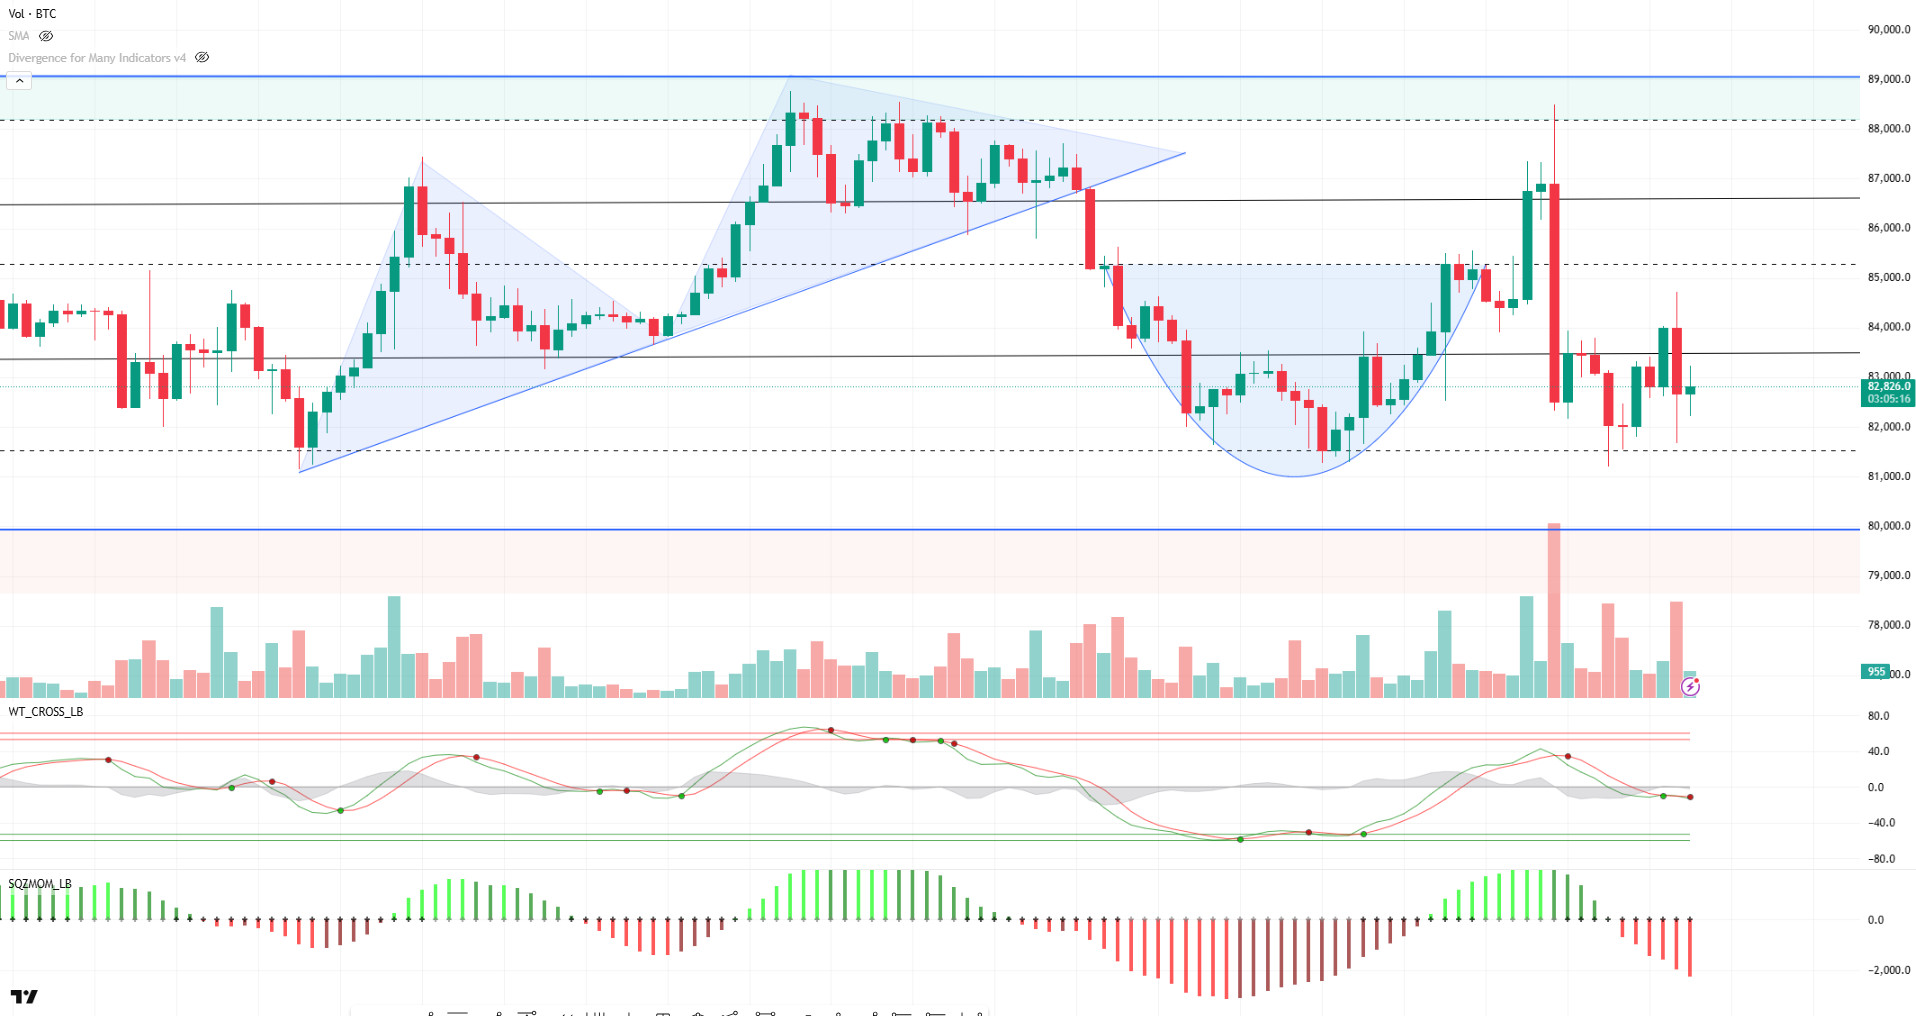
When we look at the technical outlook, BTC pushed the 85,000 level during the day, but turned its direction down again with increasing selling pressure. The tariff crisis has deepened the selling pressure in traditional markets as well. Recession concerns, especially in the US, and the rise in the fear index further increase the impact of uncertainty in the markets. The Wave Trend oscillator lost its short-term buy signal during the day and turned back to a sell signal. Momentum indicators continue to display a weak outlook. When liquidation data is analyzed, it is seen that positions are sparse, and investors maintain their cautious stance. With all these developments, BTC is currently trading at 82,700 and manages to price within our critical reference range. If the minor support level of 81,500 is lost, selling pressure can be expected to deepen and in this scenario, the 78,000 level will stand out as the next target. In a possible recovery scenario, closes above 83,500 should be carefully monitored. Exceeding this level would be an important sign for buyers to re-enter the market in the short term.
Supports 82,400 – 81,500 – 80,000
Resistances: 83,500 – 86,600 -89,000
ETH/USDT
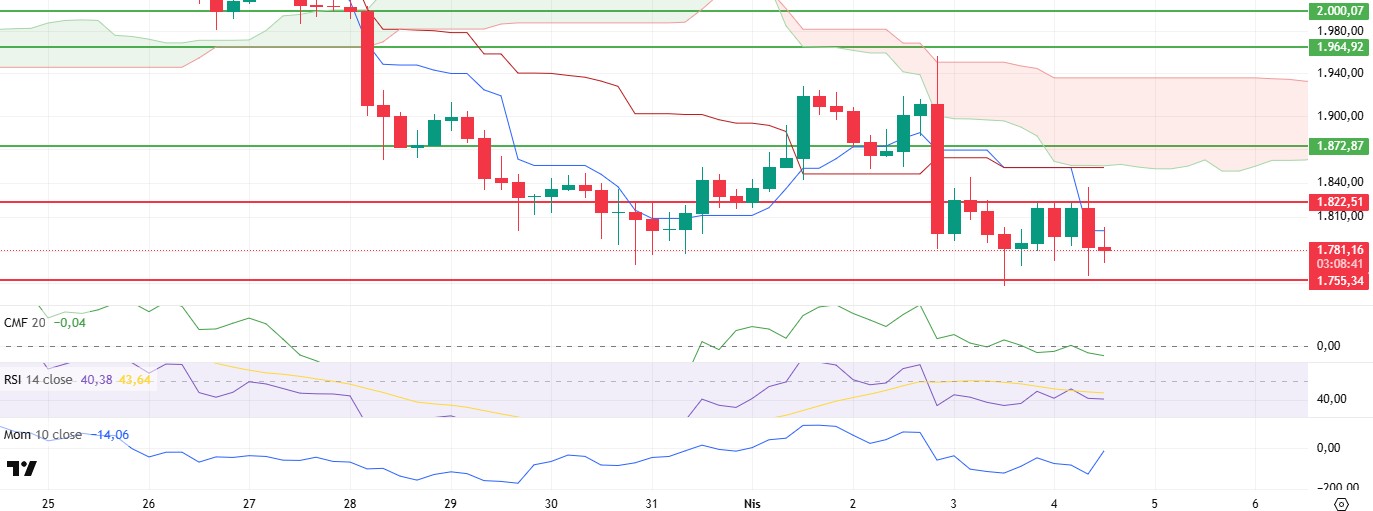
During the day, ETH rose as high as $1,822 in line with expectations. However, this rise was short-lived due to macroeconomic developments. In particular, China’s announcement of an additional 34% tax on US-origin products in response to the tariffs imposed by the US significantly reduced the risk appetite in global markets, leading to sharp sales. Following this development, a similar pressure was observed in the cryptocurrency markets and ETH quickly retreated and fell to the critical main support at the $1,755 level. Although weak reaction purchases from this region stabilized the price for a while, with the non-farm employment data released later in the day coming above expectations, the selling pressure gained weight again and the price continued its downward trend.
On the technical side, it is noteworthy that the general weakness continues. The Chaikin Money Flow (CMF) indicator, which measures liquidity flows, moved back into the negative territory, indicating that there was a significant outflow of money from the market and the downward pressure increased. Looking at the Ichimoku cloud, the fact that the tankan level fell below the kijun level and the kumo cloud continued its downward trend reveals that the negative outlook is also supported from a technical perspective. This picture shows that the overall direction of the market continues to remain bearish. On the other hand, the RSI (Relative Strength Index) indicator, which managed to exceed the based MA level by showing an upward trend in the morning hours, fell below this level again during the day and continued its downward movement. Although this reflects that buying power remains weak and rallies may be limited, the change in direction seen in the momentum indicator indicates that a short-term reaction rally may be possible, especially if the $1,755 level is maintained.
In the light of all these data, although the weaknesses in technical indicators suggest that the downtrend may continue, the fact that the price has fallen to the $1,755 level, which is an important support, and the partial buy signals on the momentum side suggest that if this region is not broken, the $1,822 level may be tested again. However, it should be noted that if the $1,755 level is broken down, selling pressure may increase further and trigger a steeper decline.
Supports 1,755 – 1,540 – 1,220
Resistances 1,822 – 1,872 – 1,964
XRP/USDT
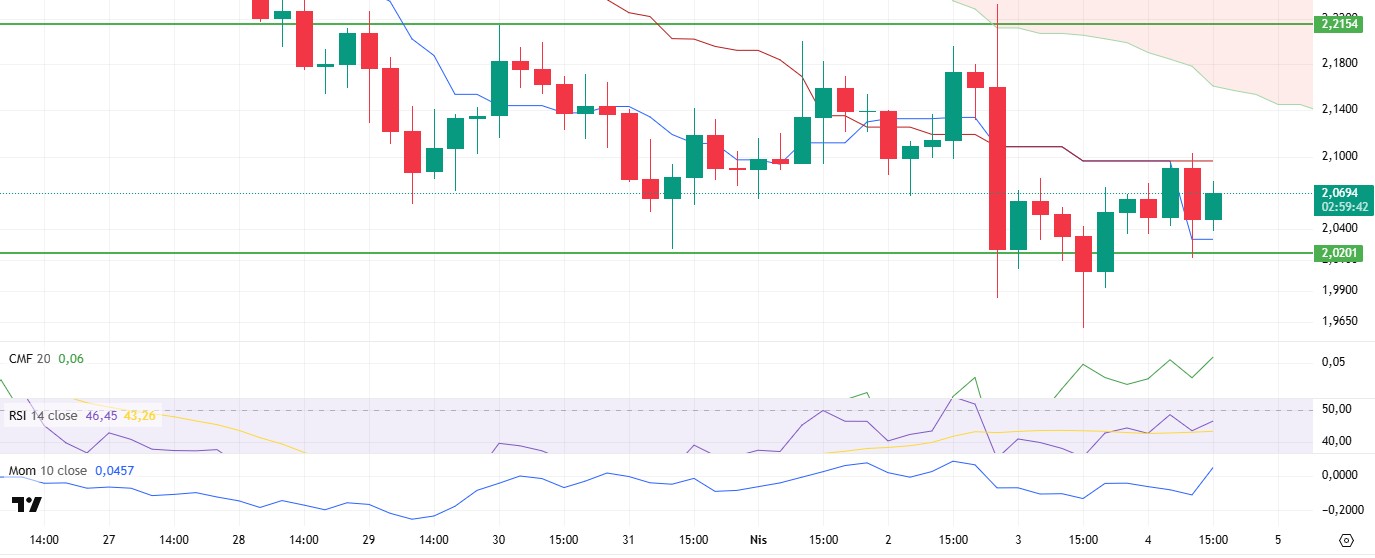
As mentioned in the analysis in the morning, XRP continued to rise during the day and managed to reach the kijun level, which is an important resistance according to the Ichimoku indicator. However, the negative macroeconomic news flow in the middle of the day, especially China’s 34% additional tax announcement on some US-origin products, quickly reduced the risk appetite in global markets and triggered a large-scale sales wave. The cryptocurrency market was also hit hard by this development and XRP retreated in a short period of time, falling to the strong main support at the $2.02 level. While the price stabilized with the purchases from this level, it is noteworthy that most of the technical indicators maintain their positive outlook.
Despite the decline, the Chaikin Money Flow (CMF) indicator remains in positive territory and continues to move upwards. This indicates that liquidity inflows to the market are still strong and there is no weakening in buying interest. Likewise, the RSI (Relative Strength Index) indicator also found support from the based MA line during the decline and continues its upward trend supported by momentum. Taking these two indicators together, it can be said that the potential for a strong reaction from the critical support zone of the price is preserved. However, in the technical analysis made on the Ichimoku indicator, the tankan (return line) level shows a significant decline, warning that if the price sags below the support level, it may generate a sell signal. This situation indicates that caution should be exercised in the short term.
Overall, technical indicators remain positive and the price tested the $2.02 level for the third time, confirming that this level works as a strong support. It is possible that an upward movement may start from this area again, and this scenario may be supported more strongly, especially if the kijun level breaks upwards. However, possible closes below the main support level of USD $2.02 may deepen the selling pressure and make the downtrend more severe. Therefore, whether or not this support level can be maintained will be decisive for the short-term price movements ahead.
Supports 2.0201 – 1.8932 – 1.6309
Resistances 2.2154 – 2.3330 – 2.4940
SOL/USDT
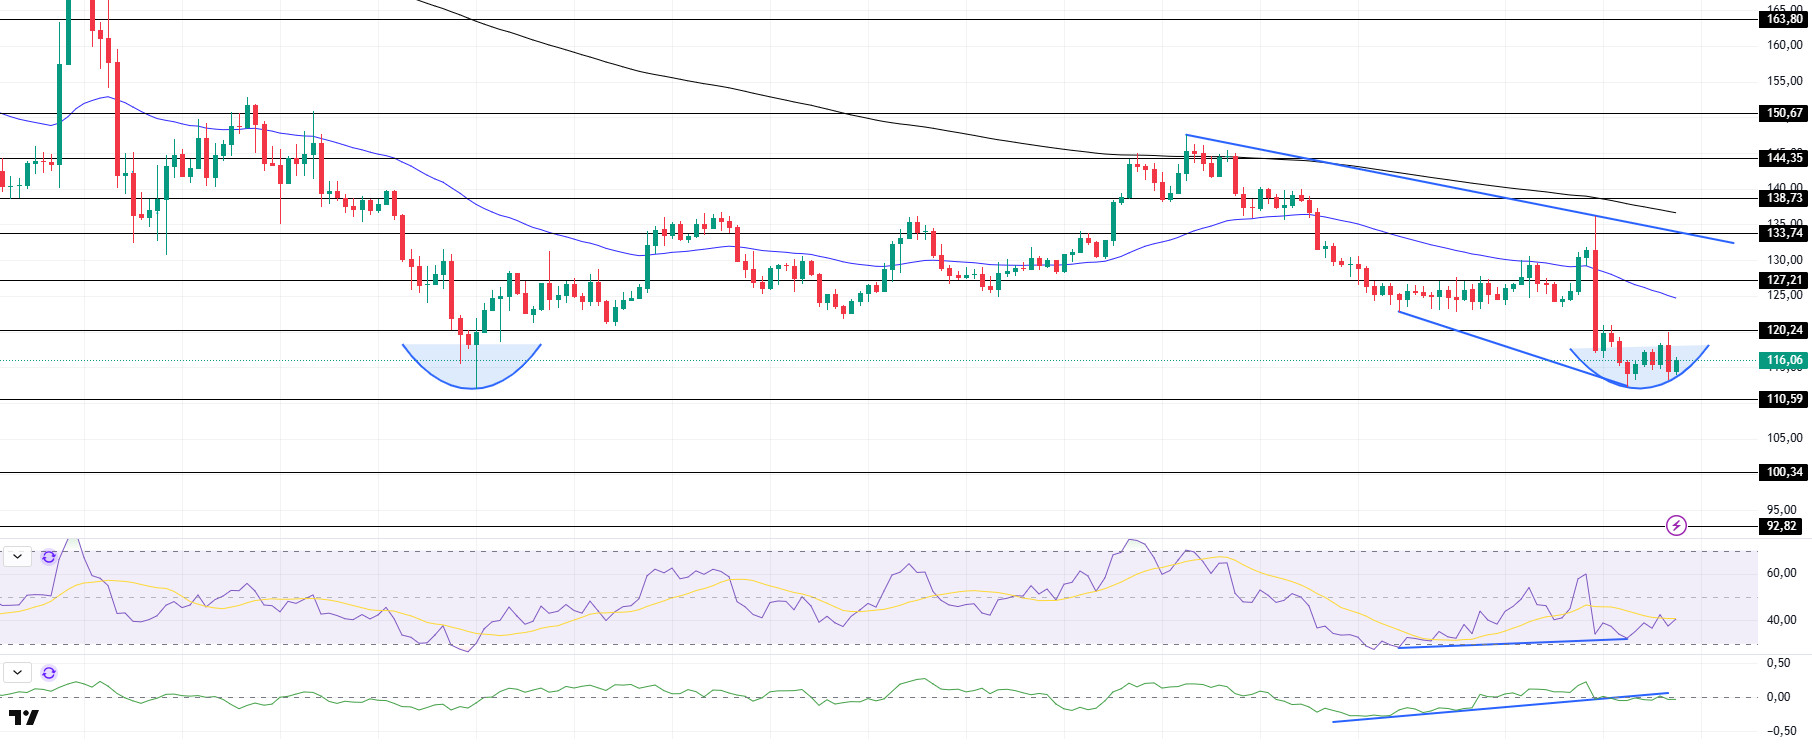
Grayscale has filed for a Solana ETF. SOL has retreated slightly since our morning analysis. The asset continued to continue the downtrend that started on March 25. At the same time, a double bottom formation was formed. This should be taken into consideration. On the 4-hour timeframe, the 50 EMA (Blue Line) remained below the 200 EMA (Black Line). This could deepen the decline further in the medium term. At the same time, the price continued to move below the two moving averages. When we analyze the Chaikin Money Flow (CMF)20 indicator, it is in negative territory, but the negative daily volume may cause CMF to retreat further. On the other hand, CMF broke down the uptrend that started on March 29. It then tested this as resistance but failed to break it and the momentum continued downwards. However, the Relative Strength Index (RSI)14 indicator remains in negative territory. In addition, there is a bullish mismatch. This could be a bullish harbinger. The $127.21 level appears as a place of resistance in the rises driven by the upcoming macroeconomic data and news in the Solana ecosystem. If it breaks here, the rise may continue. In case of retracements for the opposite reasons or due to profit sales, the support level of 110.59 dollars can be triggered. If the price comes to these support levels, a potential bullish opportunity may arise if momentum increases.
Supports 110.59 – 100.34 – 92.82
Resistances 120.24 – 127.21 – 133.74
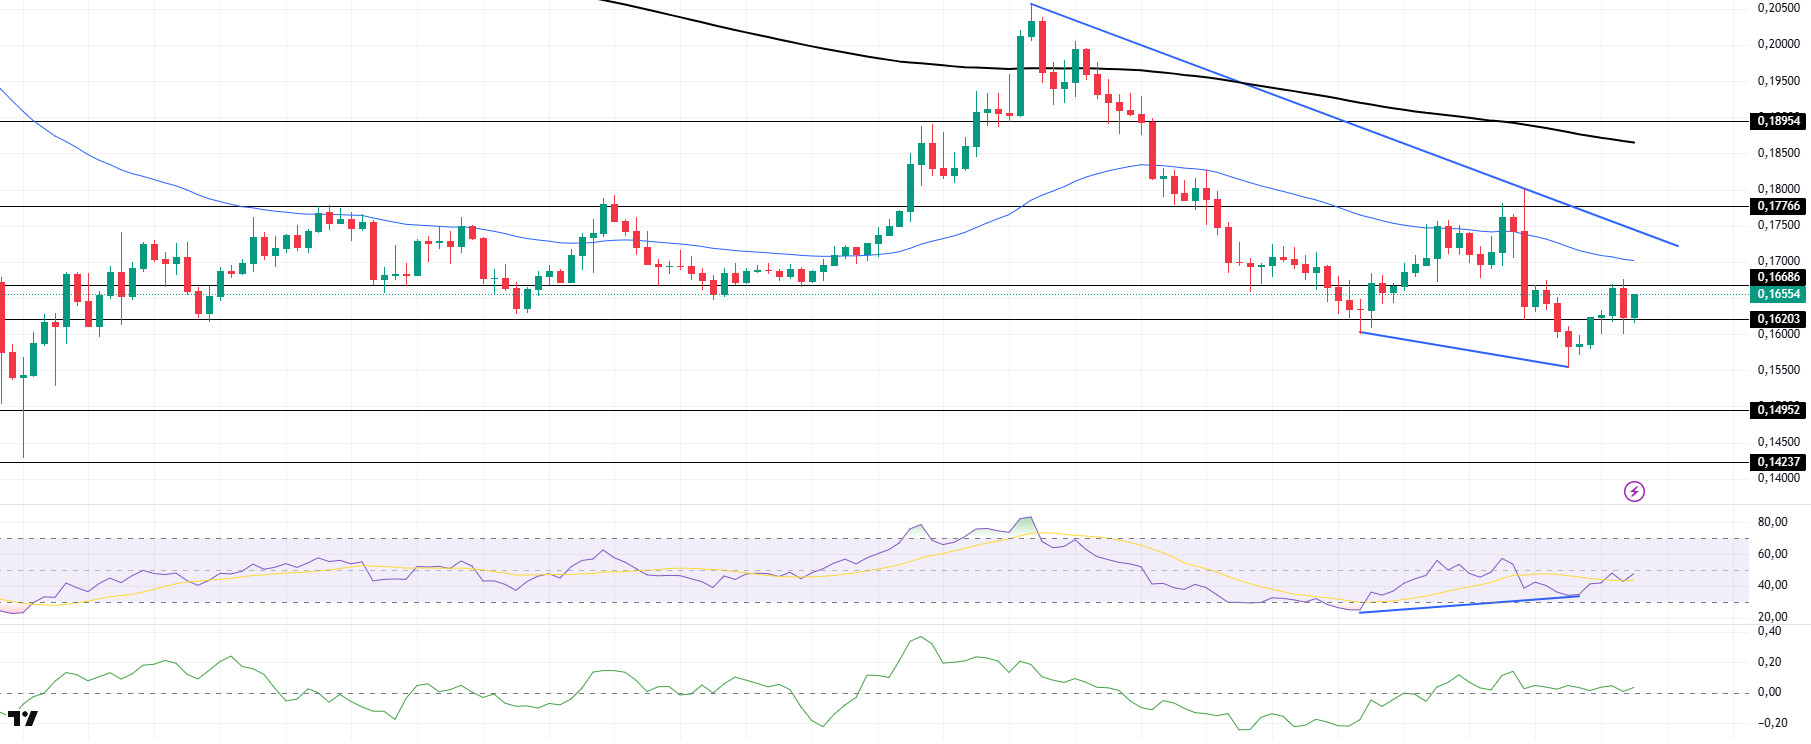
DOGE/USDT
DOGE has traded sideways since our morning analysis. The asset continues to hover below the downtrend that started on March 26. After breaking the strong support at $0.16203, the price rebounded back above $0.16203 and managed to hold above this level. On the 4-hour timeframe, the 50 EMA (Blue Line) continues to be below the 200 EMA (Black Line). This could mean that the decline could deepen in the medium term. However, the price continues to price below the two moving averages. The Chaikin Money Flow (CMF)20 indicator is in positive territory. In addition, the negative 24-hour volume may reduce inflows and cause CMF to move into the negative zone. On the other hand, Relative Strength Index (RSI)14 is in negative territory, but it seems to have broken the selling pressure. At the same time, there is an upward mismatch. The level of 0.17766 dollars appears to be a very strong resistance place in the rises due to political reasons, macroeconomic data and innovations in the DOGE coin. In case of possible retracements due to political, macroeconomic reasons or due to negativities in the ecosystem, the $ 0.14952 level, which is a strong support place, is an important support place. If the price comes to these support levels, a potential bullish opportunity may arise if momentum increases.
Supports 0.16203 – 014952 – 0.14237
Resistances 0.16686 – 0.17766 – 0.18954
Legal Notice
The investment information, comments and recommendations contained herein do not constitute investment advice. Investment advisory services are provided individually by authorized institutions taking into account the risk and return preferences of individuals. The comments and recommendations contained herein are of a general nature. These recommendations may not be suitable for your financial situation and risk and return preferences. Therefore, making an investment decision based solely on the information contained herein may not produce results in line with your expectations.


