
TECHNICAL ANALYSIS
BTC/USDT
Global markets and the crypto ecosystem continue to search for direction amid macroeconomic data and regulatory developments. US GDP was in line with expectations at 2.3%, while jobless claims rose to 242K, signaling a weakening in the labor market. House Democrats introduced the MEME Act, which would ban public officials from issuing memecoins like TRUMP. CryptoQuant said it won’t be clear for at least another month whether Bitcoin has entered a bear market, while whales took the dips as a buying opportunity by buying another 15,000 BTC. Positive regulatory developments, strong earnings from Nvidia and PCE inflation data due out this Friday could provide the backdrop for a potential uptrend for Bitcoin.
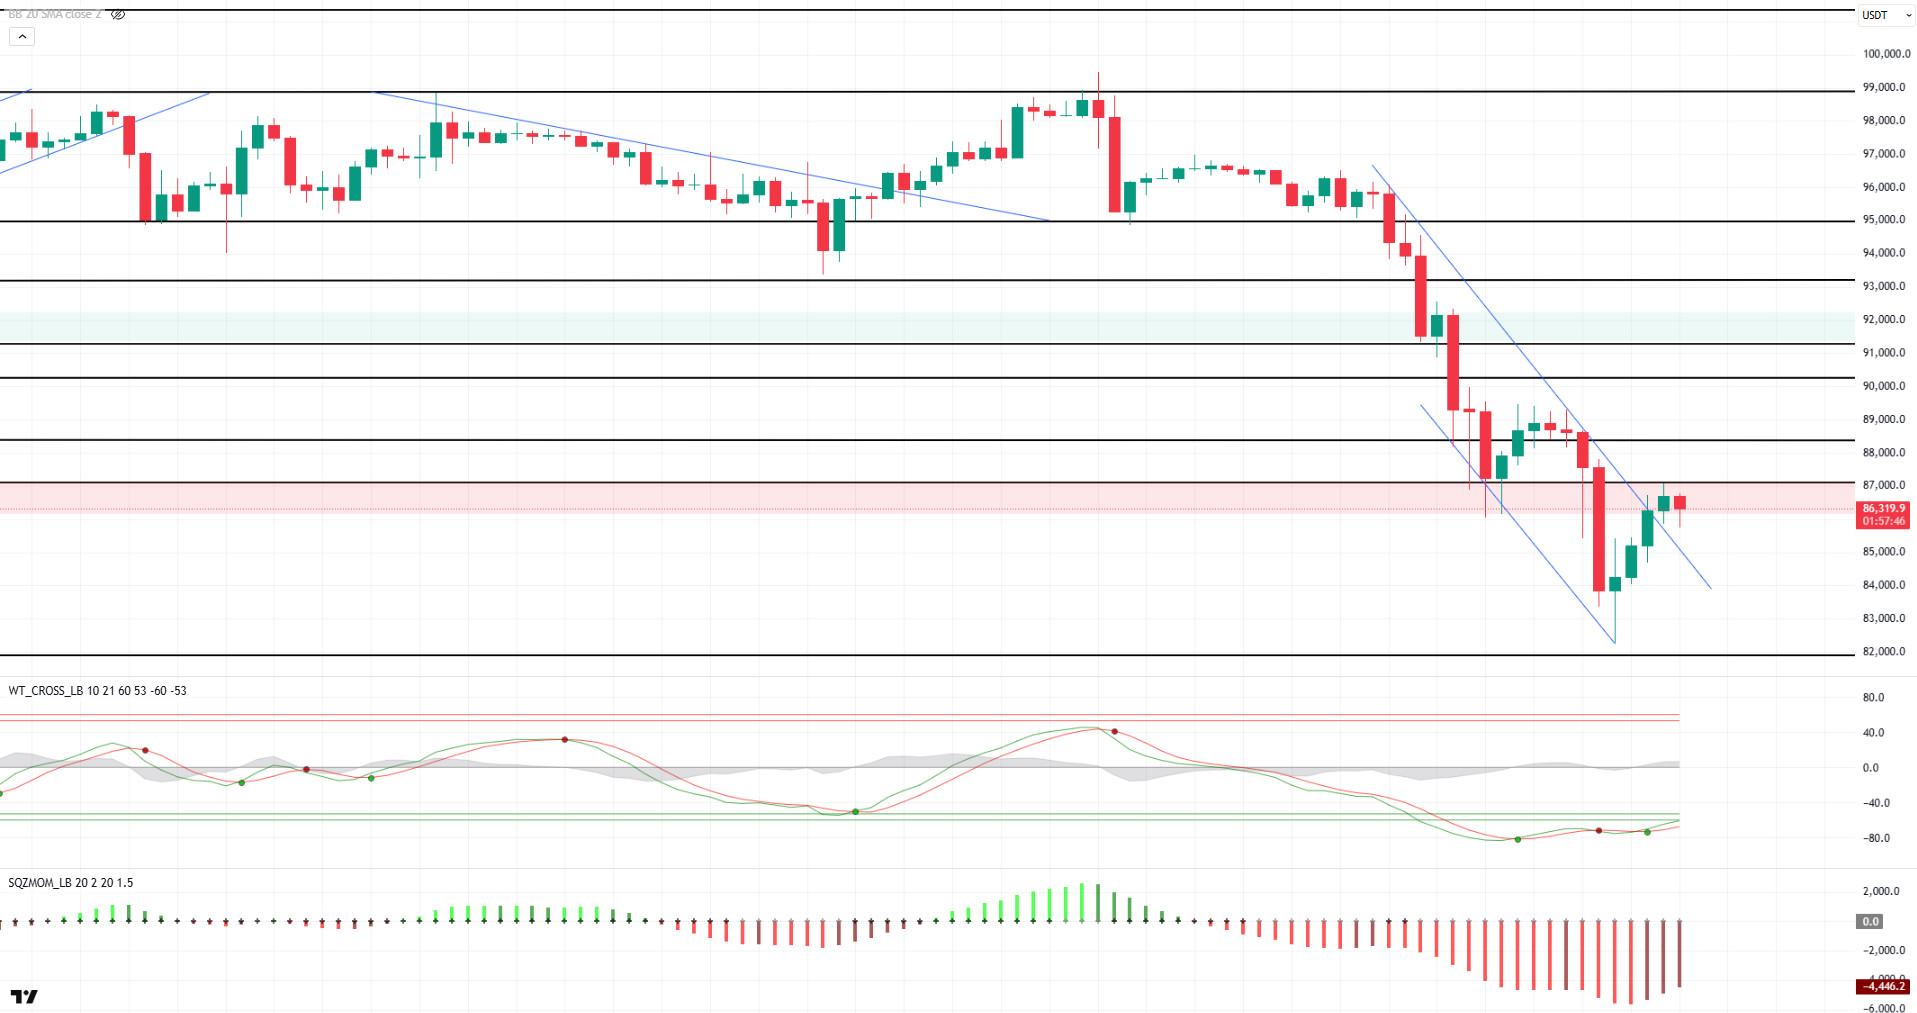
Looking at the technical outlook, BTC has yet to gain a strong bullish momentum despite breaking above the medium-term downtrend structure during the day. Currently trading at 86,100, technical oscillators continue to maintain a buy signal in the oversold area, while momentum indicators are yet to confirm this signal. Looking at the weekly liquidation heatmap, it is noteworthy that short trades concentrated in the region of 88,000 and above have increased the selling pressure in the market. As BTC moves within the downtrend structure, the consolidation of the price within the horizontal band may signal a potential bowl formation. In this scenario, BTC’s recovery may be expected to be more U-shaped rather than V-shaped as in previous declines. However, considering that the price has not yet reached its bottom, the current decline is 23% compared to the 30% correction rate calculated from the previous peak. This may indicate that the decline may not yet be complete and the downward movement may continue. If the downtrend deepens, the 82,000 level, where BTC received a reaction yesterday in the gap zone, stands out as a critical support point. On the other hand, in case of a recovery, the price may be expected to pin this level to liquidate the short positions concentrated in futures at 88,000.
Supports 85,000 – 82,000 – 80,000
Resistances 87,000 – 88,300 – 90,300
ETH/USDT
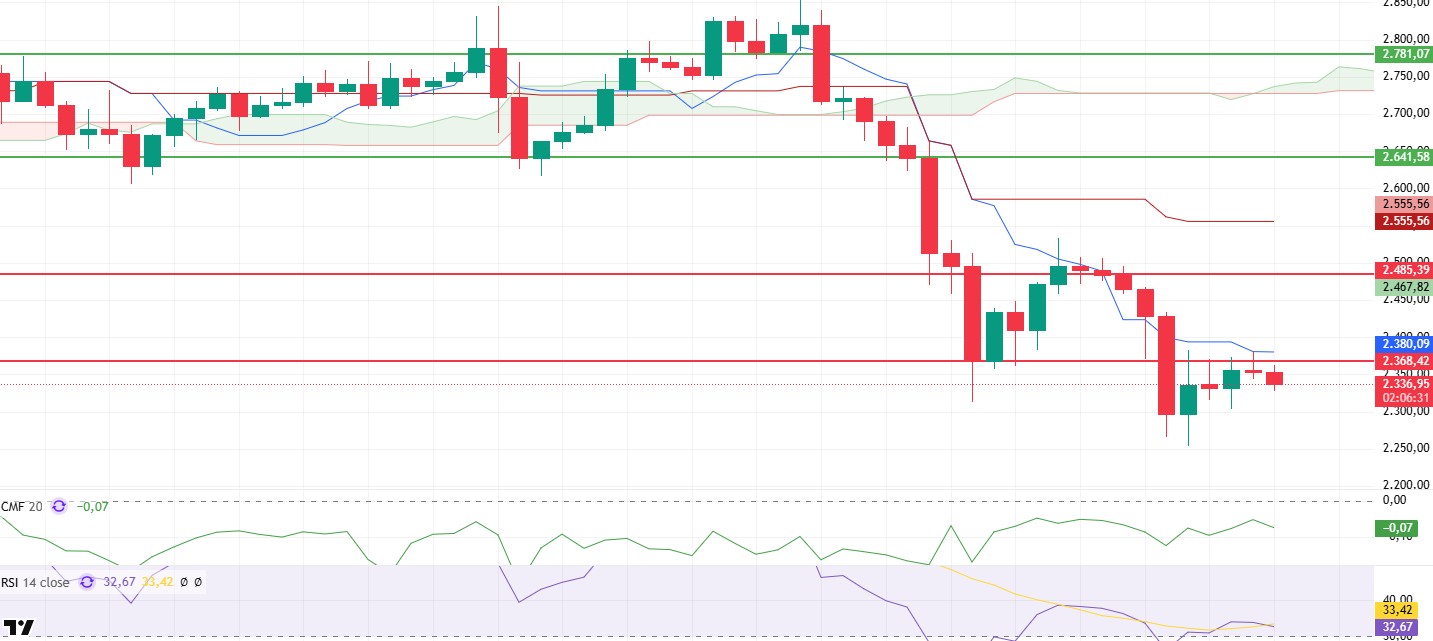
ETH followed a horizontal course in a narrow price range during the day. With the effect of light purchases in the morning hours, it rose to the tenkan resistance at $ 2,381. However, increased selling pressure at this level caused the price to turn down again and led it to sag below the support level of $ 2,368.
Technical indicators suggest that the market is trying to maintain the balance between liquidity conditions and price movements. The horizontal trend of the Chaikin Money Flow (CMF) indicator near the zero line suggests that the market is maintaining the current liquidity level and there is no significant capital outflow or inflow. The Relative Strength Index (RSI), on the other hand, displays a slightly positive momentum, remaining above the Based MA baseline. This indicates that the price may show an upward trend in the short term.
If the price exceeds the tenkan resistance at $ 2,380 in the evening, a movement up to $ 2,485 can be observed by gaining bullish momentum. However, if it continues to stay below this level, there is a possibility that the price may experience a gradual retreat to $ 2,131 levels with increasing selling pressure. In terms of the direction of the market, whether it can be sustained above the $ 2,380 zone will be a critical determinant.
Supports 2,131 – 1,999 – 1,860
Resistances 2,368 – 2,485 – 2,641
XRP/USDT
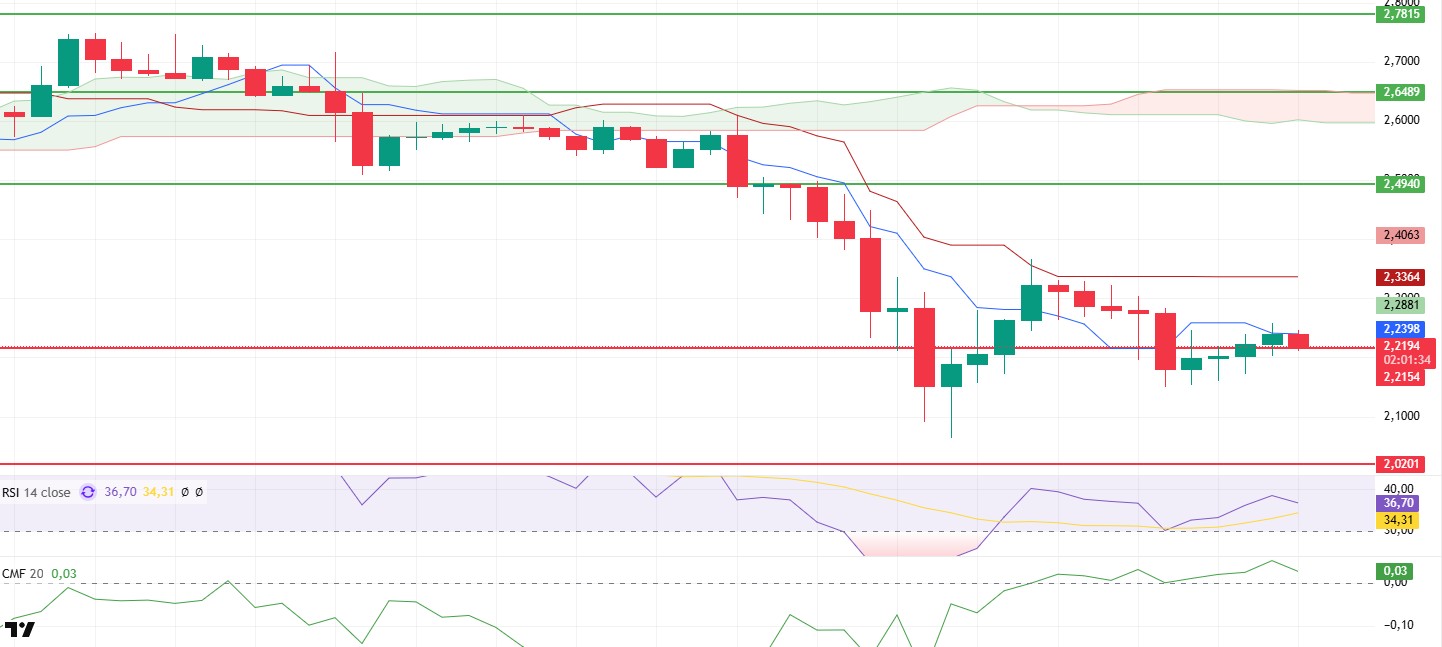
After its morning surge, XRP faced selling pressure at the tenkan resistance at the $2.23 level and turned its direction down again. This pullback caused the price to sag to the $2.21 support. However, as of now, XRP seems to have managed to hold at this level and there is no significant change in technical indicators.
Technical analysis indicators suggest that price action is trying to stabilize at current levels. The Chaikin Money Flow (CMF) indicator is in positive territory, indicating that liquidity inflows into the market are strong and supporting price rallies. Moreover, the Relative Strength Index (RSI) maintained its upward bias and remained above the based MA baseline, indicating that the current momentum remains positive.
XRP’s current technical structure suggests that the price continues to hold above important levels and the overall outlook is trending sideways to slightly positive. However, a close below the $2.21 support level could lead to increased selling pressure and cause the price to pull back towards lower levels. Therefore, in order for XRP to continue its upward movement, it is critical for XRP to maintain the support of $2.21 and persist past the $2.23 resistance.
Supports 2.2154 – 2.0201 – 1.6309
Resistances 2.4940 – 2.6489 – 2.7815
SOL/USDT
Volatility Shares has launched its first Solana futures ETFs, marking an important step in the increasing integration of cryptocurrency into regulated financial markets. The two ETFs, Volatility Shares 2x Solana ETF (SOLT) and Solana ETF (SOLZ), are now listed on the Depository Trust & Clearing Corporation (DTCC).
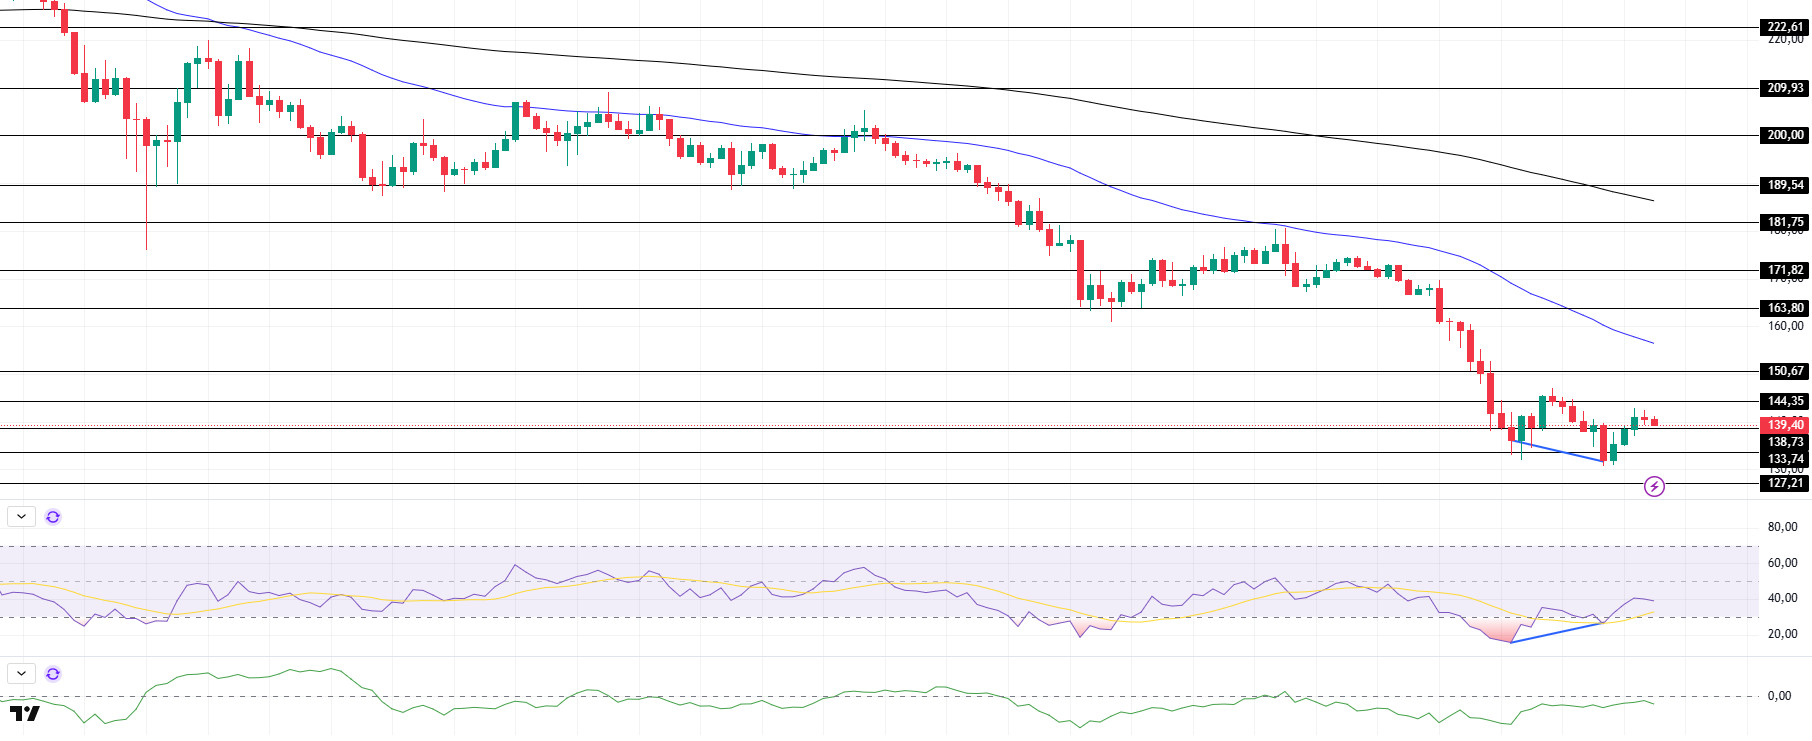
SOL has moved sideways since our morning analysis. On the 4-hour timeframe, the 50 EMA (Blue Line) continues to be below the 200 EMA (Black Line). This could deepen the decline further in the medium term. At the same time, the price remained below both moving averages. However, the larger difference between the two moving averages could push the asset higher. When we examine the Chaikin Money Flow (CMF)20 indicator, it is in the negative zone, close to the neutral level, but the increase in volume may make money inflows much more dominant. However, the Relative Strength Index (RSI)14 indicator has moved from the oversold zone to the middle level of the negative zone. There is also a bullish mismatch. This could be a bullish start. The $ 163.80 level is a very strong resistance point in the rises driven by both the upcoming macroeconomic data and the news in the Solana ecosystem. If it breaks here, the rise may continue. In case of retracements for the opposite reasons or due to profit sales, the support level of $ 127.21 can be triggered again. If the price comes to these support levels, a potential bullish opportunity may arise if momentum increases.
Supports 138.73 – 133.74 – 127.21
Resistances 144.35 – 150.67 – 163.80
DOGE/USDT
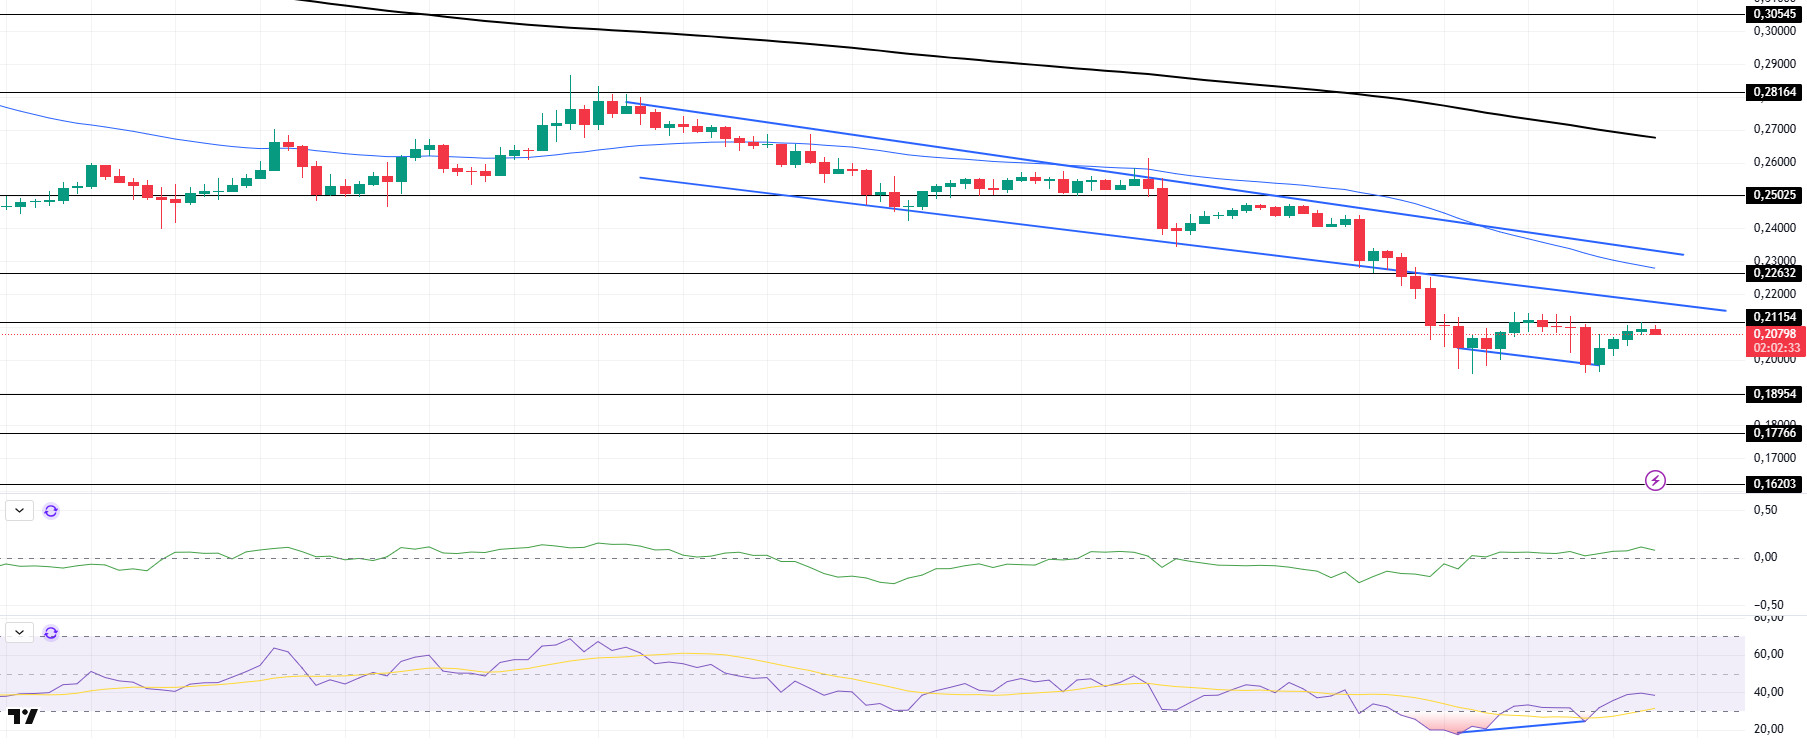
DOGE has been sideways since our analysis in the morning and has tested the 0.21154 resistance level twice. On February 15, it may test the support level of the downtrend that started to form as resistance. On the 4-hour timeframe, the 50 EMA (Blue Line) is below the 200 EMA (Black Line). This could mean that the decline could deepen further in the medium term. However, the price is below two moving averages. However, the difference between the two moving averages as well as the difference between the price and the 50 EMA increases the probability that DOGE will rise. When we examine the Chaikin Money Flow (CMF)20 indicator, it is in the positive zone near the neutral level. However, the fact that the volume is on the plus shows us the possibility of more money inflows. On the other hand, the Relative Strength Index (RSI)14 is at the mid-level of the negative zone, but the bullish mismatch should be taken into account. These may lead to a recovery. The $0.22632 level stands out as a very strong resistance point in the rises due to political reasons, macroeconomic data and innovations in the DOGE coin. In case of possible pullbacks due to political, macroeconomic reasons or negativities in the ecosystem, the $0.18954 level, which is the base level of the trend, is an important support. If the price reaches these support levels, a potential bullish opportunity may arise if momentum increases.
Supports 0.18954 – 0.17766 – 0.16203
Resistances 0.21154 – 0.22632 – 0.25025
Legal Notice
The investment information, comments and recommendations contained herein do not constitute investment advice. Investment advisory services are provided individually by authorized institutions taking into account the risk and return preferences of individuals. The comments and recommendations contained herein are of a general nature. These recommendations may not be suitable for your financial situation and risk and return preferences. Therefore, making an investment decision based solely on the information contained herein may not produce results in line with your expectations.

