
TECHNICAL ANALYSIS
BTC/USDT
Crypto markets are going through a critical period in terms of macroeconomic data and investor sentiment. The US Core Personal Consumption Expenditure (PCE) Price Index was announced as 2.6% on an annualized basis, in line with expectations. On the other hand, US Spot Bitcoin ETFs have experienced eight consecutive days of outflows, losing a total of $3.2 billion and reaching the record outflow level in August 2024.
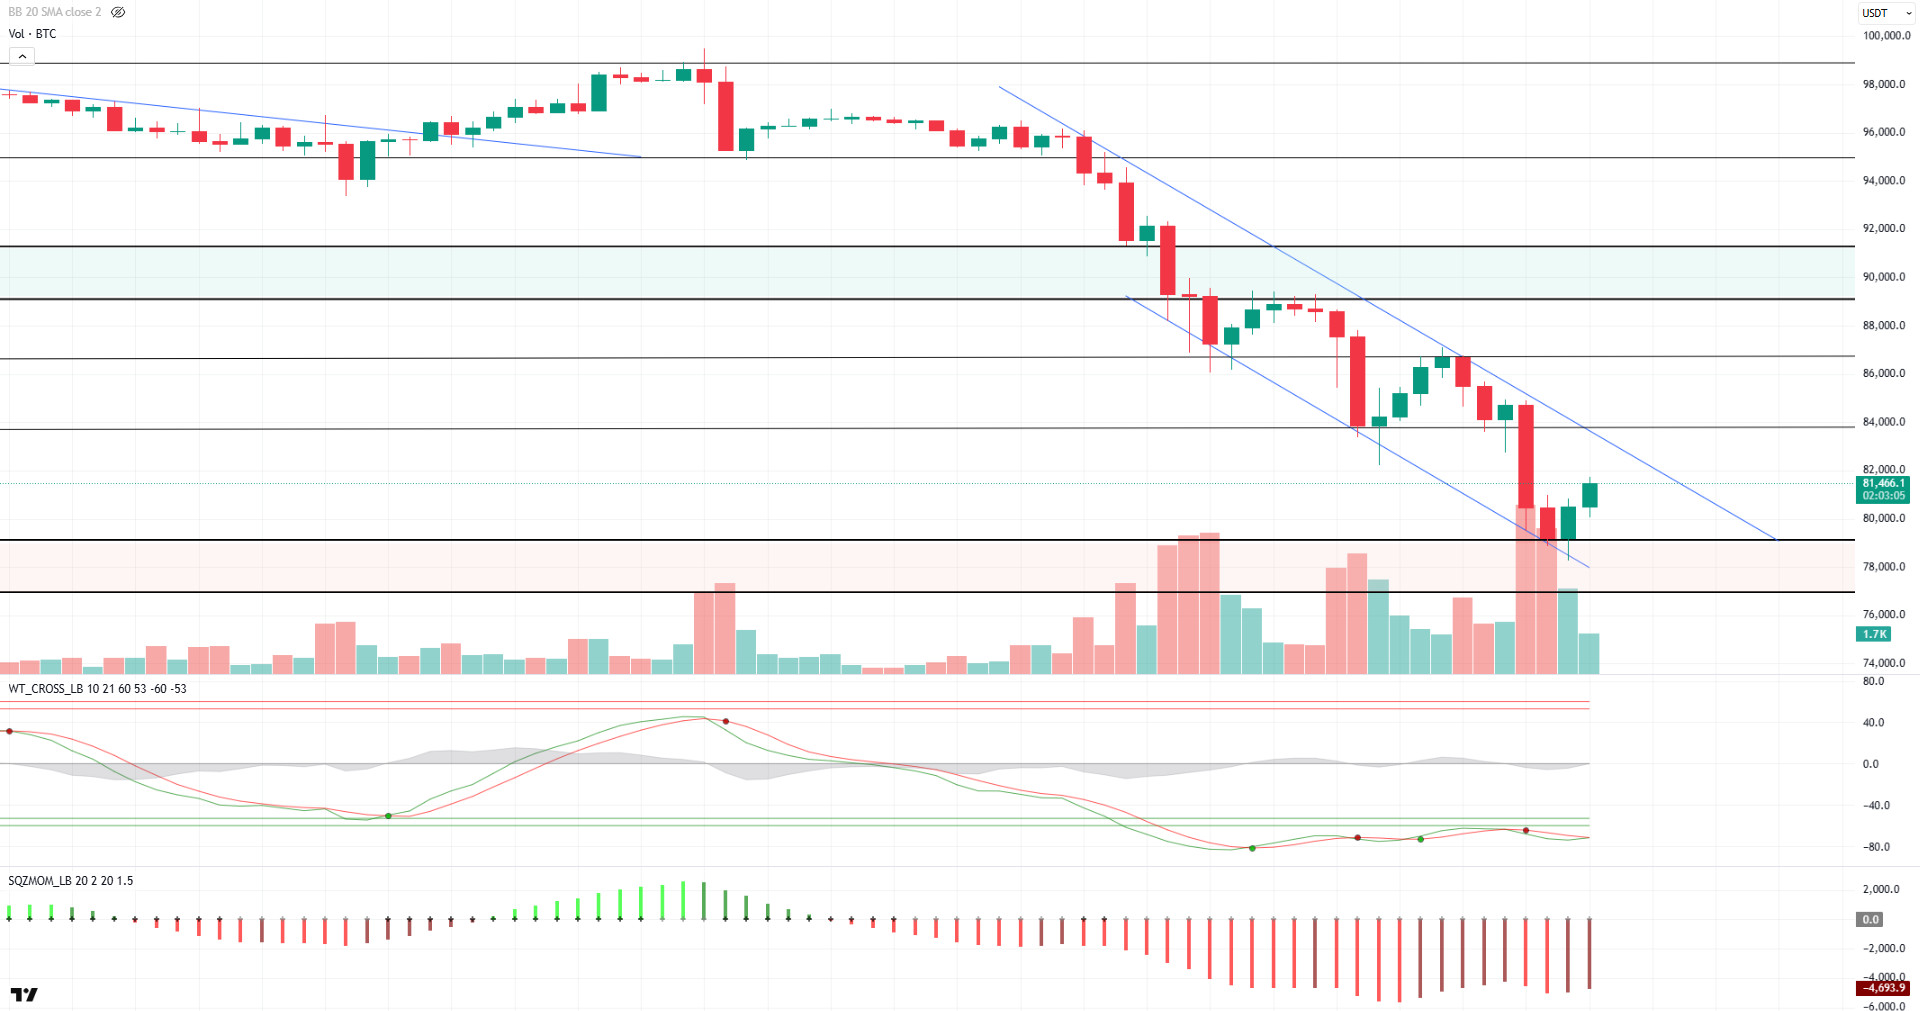
When we look at the technical outlook, BTC, which continues its price movements within the falling trend structure, is seen to have fallen to 78,300 levels in the morning hours. BTC, which recovered with purchases from this level, is currently trading at 81,500. However, it should be noted that the price is still moving in a downtrend in the short term. When technical indicators are analyzed, BTC, which displays a neutral outlook on hourly charts in the oversold zone, continues to maintain its sell signal on the 4-hour and daily charts. This shows that despite the recovery effort, the selling pressure has not yet been fully broken. When we look at momentum indicators, it is observed that a significant increase in risk appetite has not yet occurred and the market continues to move cautiously. Although BTC price is currently correcting the decline, it needs to break the falling trend structure and maintain above this level for the uptrend to continue. On the other hand, if the selling pressure increases again, we can state that the 79,000 level acts as support during the day. A fall below this level may cause the downtrend to regain strength.
Supports 79,000 – 77,000 – 73,140
Resistances 82,000 – 83,700 – 87,000
ETH/USDT
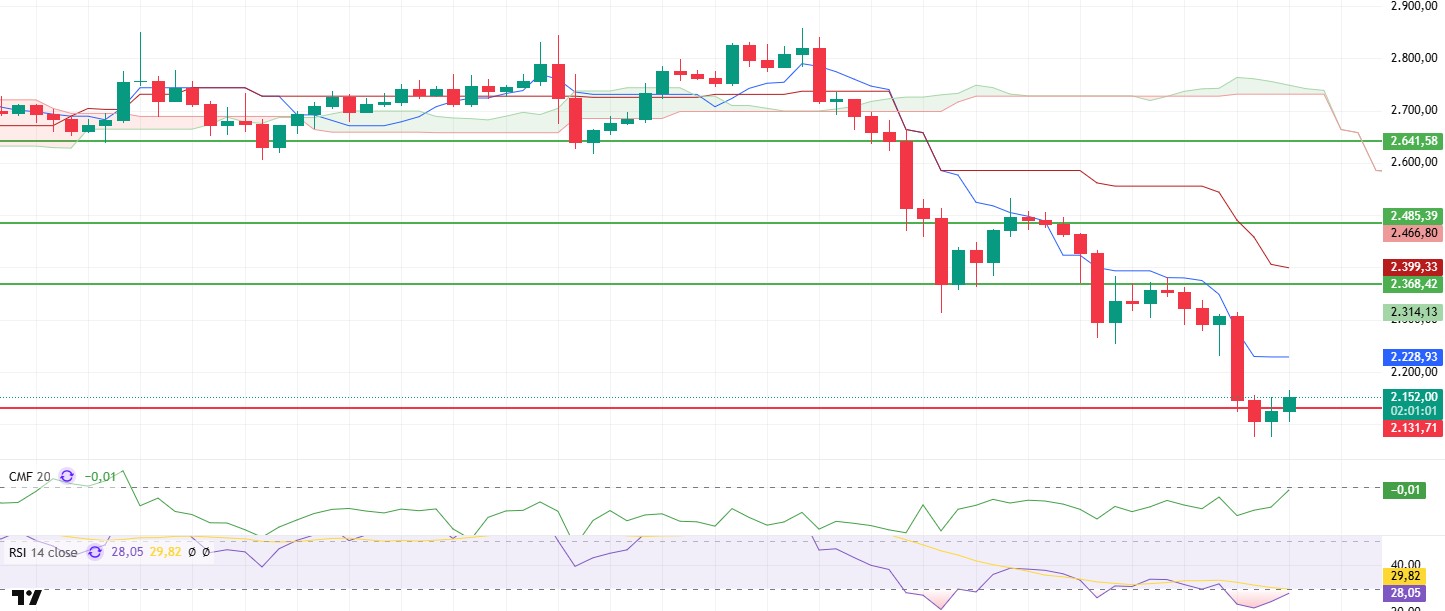
ETH has been holding on to the support at $2,131 during the day, getting a reaction from this area and continues to price above this level as of now. Although this move alone does not create a strong bullish signal, it shows that the support at $2,131 is working and the declines are slowing down a bit. This may indicate that the price is approaching possible bottom levels.
Analysing the technical indicators, the Chaikin Money Flow (CMF) indicator rose to the zero line, indicating that liquidity inflows have started and market buyers are regaining strength. Relative Strength Index (RSI), on the other hand, reacted from the oversold territory and rose to 30 levels. This recovery in the RSI suggests that the selling pressure has eased somewhat in the short term and the price has become open to reaction buying. When the Ichimoku indicator is analyzed, it continues to show that the kump cloud continues its downward movement and the market is generally in a downtrend. The fact that the Tenkan level has fallen to the $2,230 level reveals that the short-term resistance zone is converging to these levels. However, it can be assessed that the $2,230-$2,315 range constitutes a strong resistance zone, and the price may face selling pressure as it approaches this level.
In general, ETH price holding above the $2,131 level during the day could support a short-term recovery. However, the lack of sufficient spot demand to overcome the resistance zone between $2,230 and $2,315 suggests that strong selling reactions may be encountered at these levels. On the contrary, a close below the $2,131 level indicates that the downward trend may continue. Therefore, whether the current support level can be maintained and whether price movements above $2,230 can gain strength are the determining factors in terms of the direction of the market.
Supports 2,131 – 1,907 – 1,755
Resistances 2,230 – 2,485 – 2,641
XRP/USDT
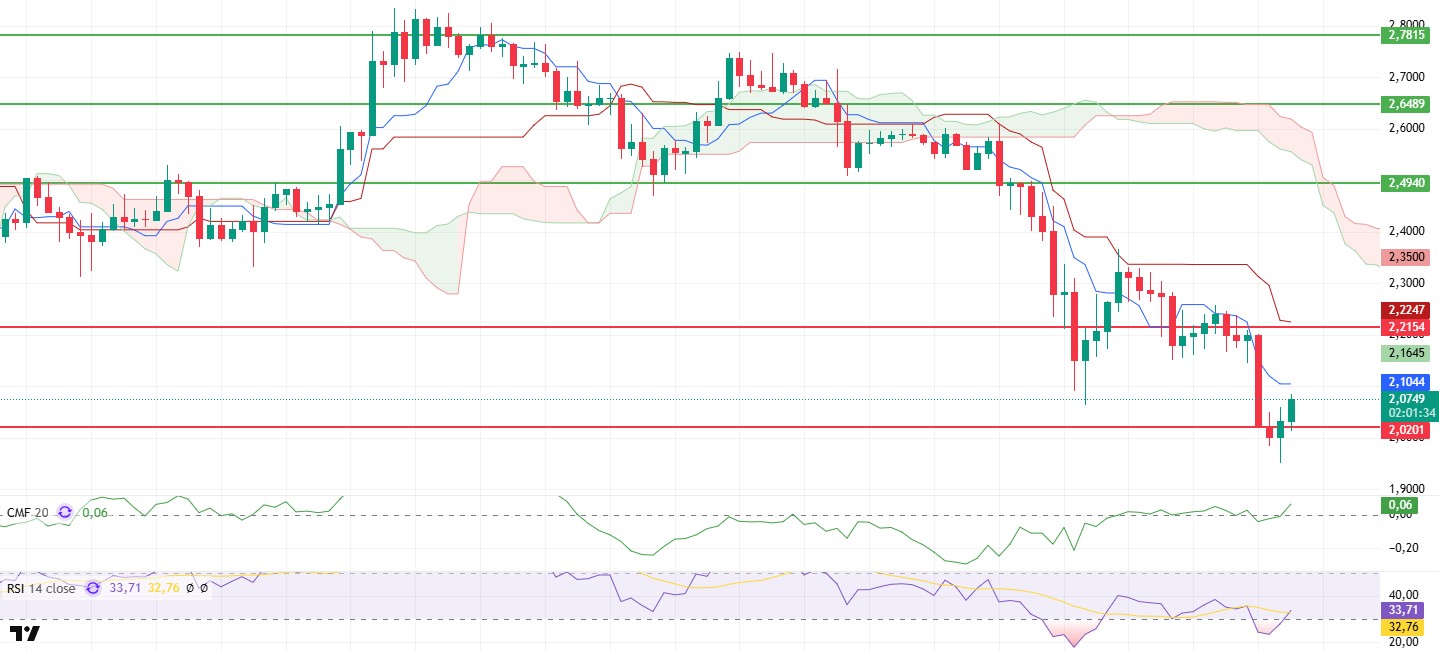
Although XRP fell below the $2.02 support during the day, it has regained the $2.02 level with the buying reaction from this region. This move shows that the price has found strong support in this region and buyers have stepped in. The price’s rise from the current level towards the tenkan region suggests that the market momentum is starting to change and a short-term recovery signal may occur.
When the technical indicators are analyzed, it is seen that the Chaikin Money Flow (CMF) indicator continues to rise by moving into the positive area, revealing that the liquidity flow has changed in favor of buyers. This indicator indicates that there are new entries into the market and that buyers are starting to regain dominance. The Relative Strength Index (RSI), on the other hand, has moved out of the oversold zone, indicating that the momentum has gained bullish momentum and momentum has started to strengthen upwards. This recovery in the RSI supports that the selling pressure on the price has decreased and upward movements may be at the forefront in the short term.
In light of the current technical data, it can be said that rises up to the level of $ 2.21 are possible in the short term, provided that XRP maintains its support of $ 2.02. However, a voluminous buying wave is needed to overcome this resistance zone. On the other hand, if it sags below the $2.02 level and this region is lost as support, it may cause the downtrend to continue. In such a scenario, it seems likely that selling pressure will increase, causing the price to fall to deeper levels. Therefore, maintaining the current support level and maintaining the price’s movement towards the $2.21 level is a critical factor in terms of short-term market direction.
Supports 2.0201 – 1.8303 – 1.6309
Resistances 2.2154 – 2.4940 – 2.6489
SOL/USDT
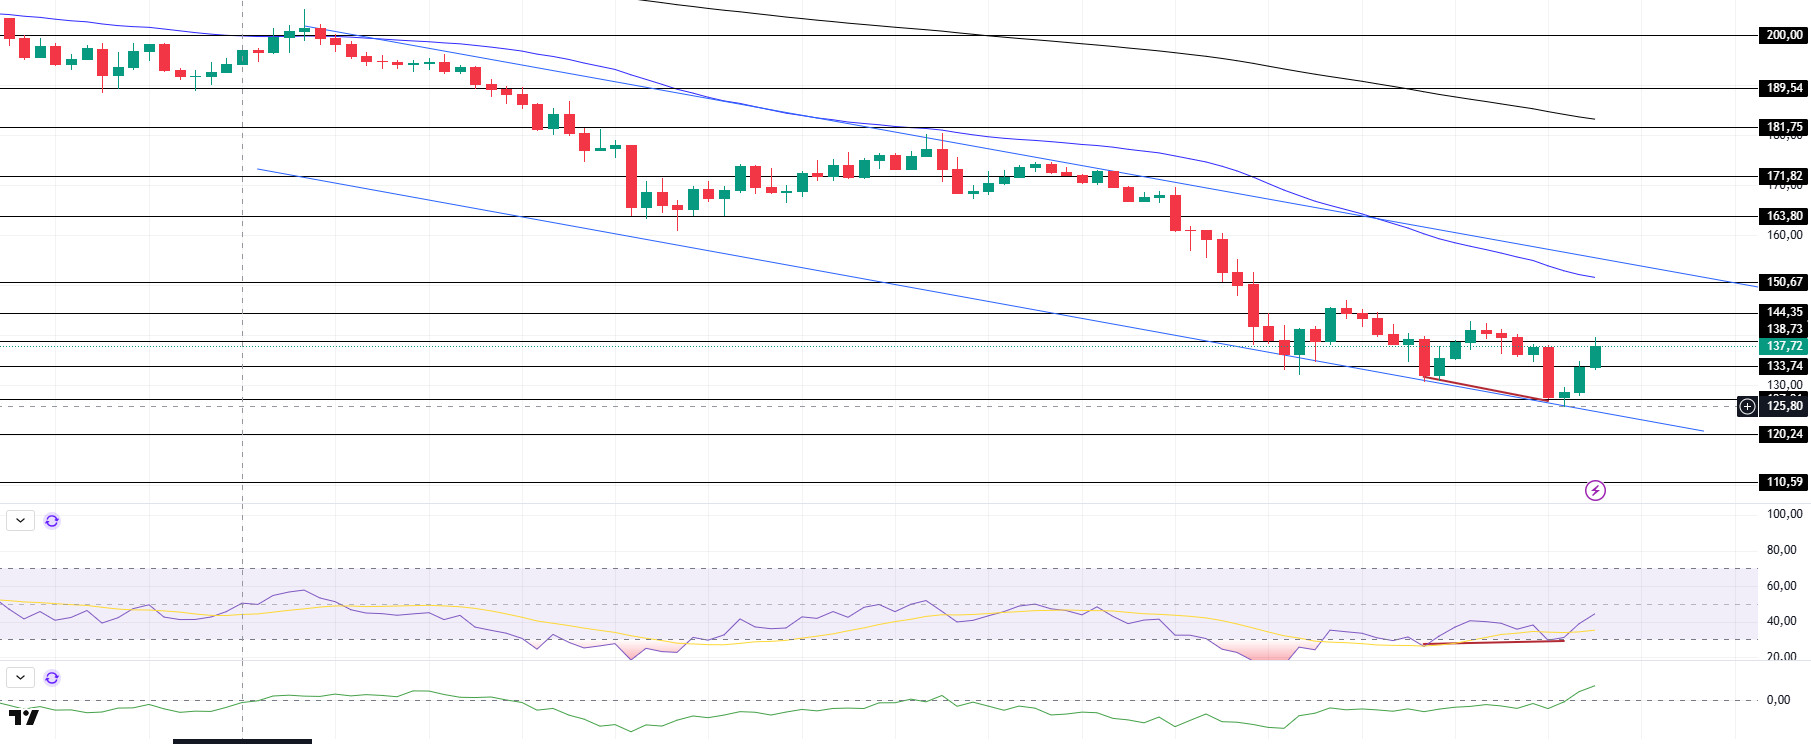
SOL has rallied since our morning analysis, finding support from the support zone of the downtrend that started on February 14. On the 4-hour timeframe, the 50 EMA (Blue Line) continues to be below the 200 EMA (Black Line). This could deepen the decline further in the medium term. At the same time, the price remained below both moving averages. However, the larger difference between the two moving averages could push the asset higher. When we examine the Chaikin Money Flow (CMF)20 indicator, it is in positive territory, but the increase in volume may further increase the money increases. However, the Relative Strength Index (RSI)14 indicator gained momentum from the oversold zone and moved towards the neutral zone. At the same time, the bullish mismatch between RSI and price seems to have worked. This could be a bullish start. The $150.67 level appears to be a very strong resistance point in the rises driven by both the upcoming macroeconomic data and the news in the Solana ecosystem. If it breaks here, the rise may continue. In case of retracements for the opposite reasons or due to profit sales, the support level of 120.24 dollars can be triggered again. If the price comes to these support levels, a potential bullish opportunity may arise if momentum increases.
Supports 133.74 – 127.21 – 120.24
Resistances 138.73 – 144.35 – 150.67
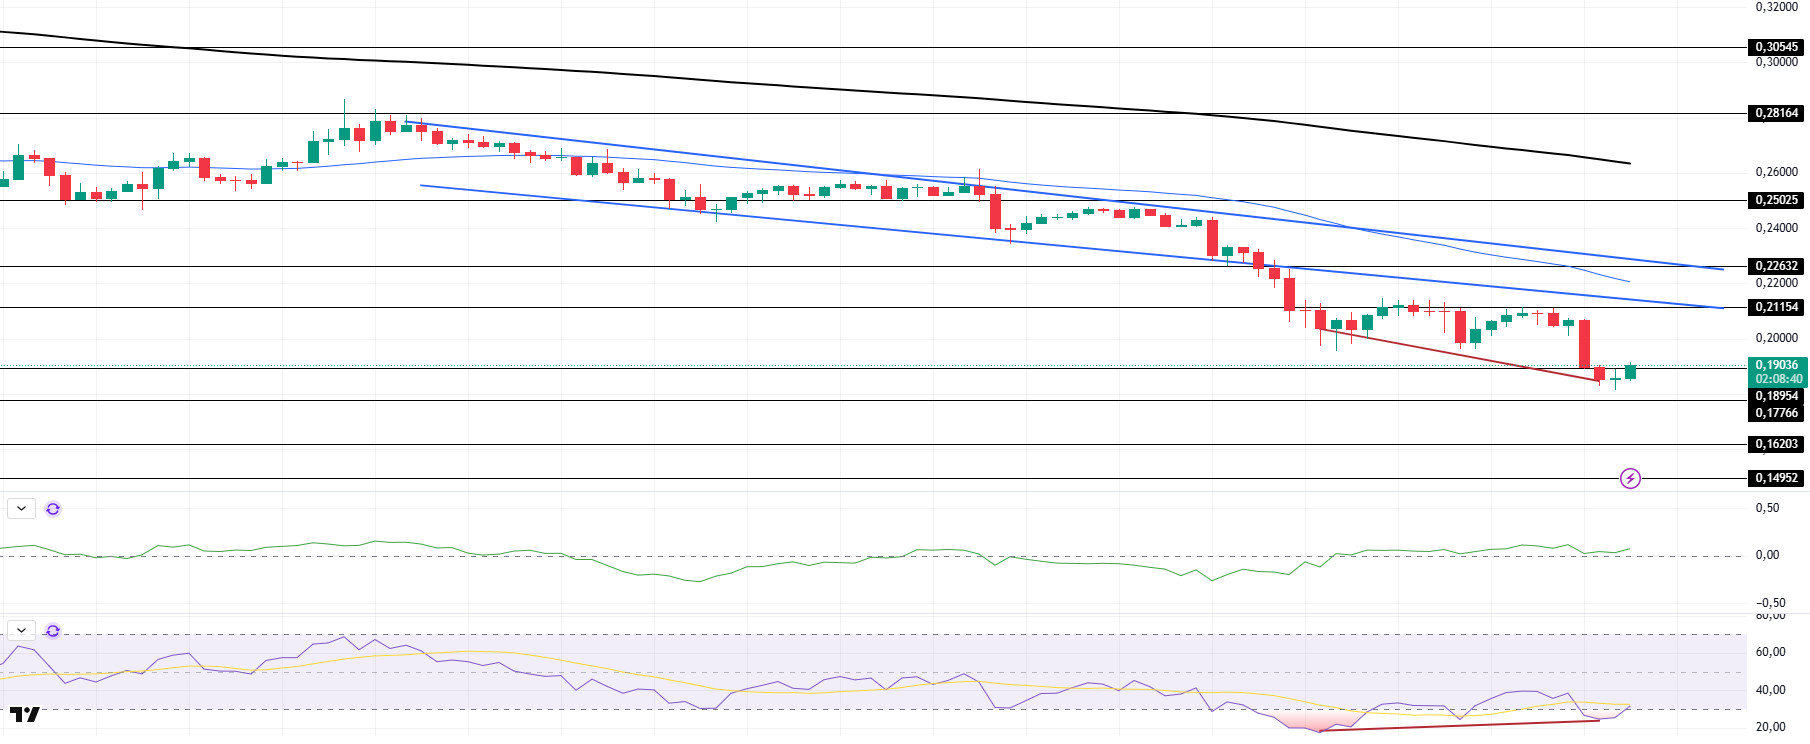
DOGE/USDT
DOGE has shown a slight recovery trend after deep pullbacks since our analysis in the morning. On the 4-hour timeframe, the 50 EMA (Blue Line) is below the 200 EMA (Black Line). This could mean that the decline could deepen further in the medium term. However, the price is hovering below two moving averages. However, the difference between the two moving averages as well as the difference between the price and the 50 EMA increases the probability that DOGE will rise. The Chaikin Money Flow (CMF)20 indicator is in positive territory. However, the fact that the volume is on the plus side shows us the possibility that money inflows may increase further. On the other hand, the Relative Strength Index (RSI)14 started to accelerate upwards from the oversold level again. However, bullish divergence should be taken into account. These may lead to a rebound. The $0.22632 level stands out as a very strong resistance point in the rises driven by political reasons, macroeconomic data and innovations in the DOGE coin. In case of possible pullbacks due to political, macroeconomic reasons or negativities in the ecosystem, the $0.16203 level, which is the base level of the trend, is an important support. If the price reaches these support levels, a potential bullish opportunity may arise if momentum increases.
Supports 0.17766 – 0.16203 – 0.14952
Resistances 0.18954 – 0.21154 – 0.22632
LEGAL NOTICE
The investment information, comments and recommendations contained herein do not constitute investment advice. Investment advisory services are provided individually by authorized institutions taking into account the risk and return preferences of individuals. The comments and recommendations contained herein are of a general nature. These recommendations may not be suitable for your financial situation and risk and return preferences. Therefore, making an investment decision based solely on the information contained herein may not produce results in line with your expectations.

