
TECHNICAL ANALYSIS
BTC/USDT
US core PCE data came in above expectations, indicating that inflationary pressures continued. The data, which was announced as 2.8% yoy, strengthened the expectations that the Fed will not rush to cut interest rates. On the other hand, Texas Senator Ted Cruz introduced a bill aiming to ban the Fed from issuing central bank digital currency (CBDC).
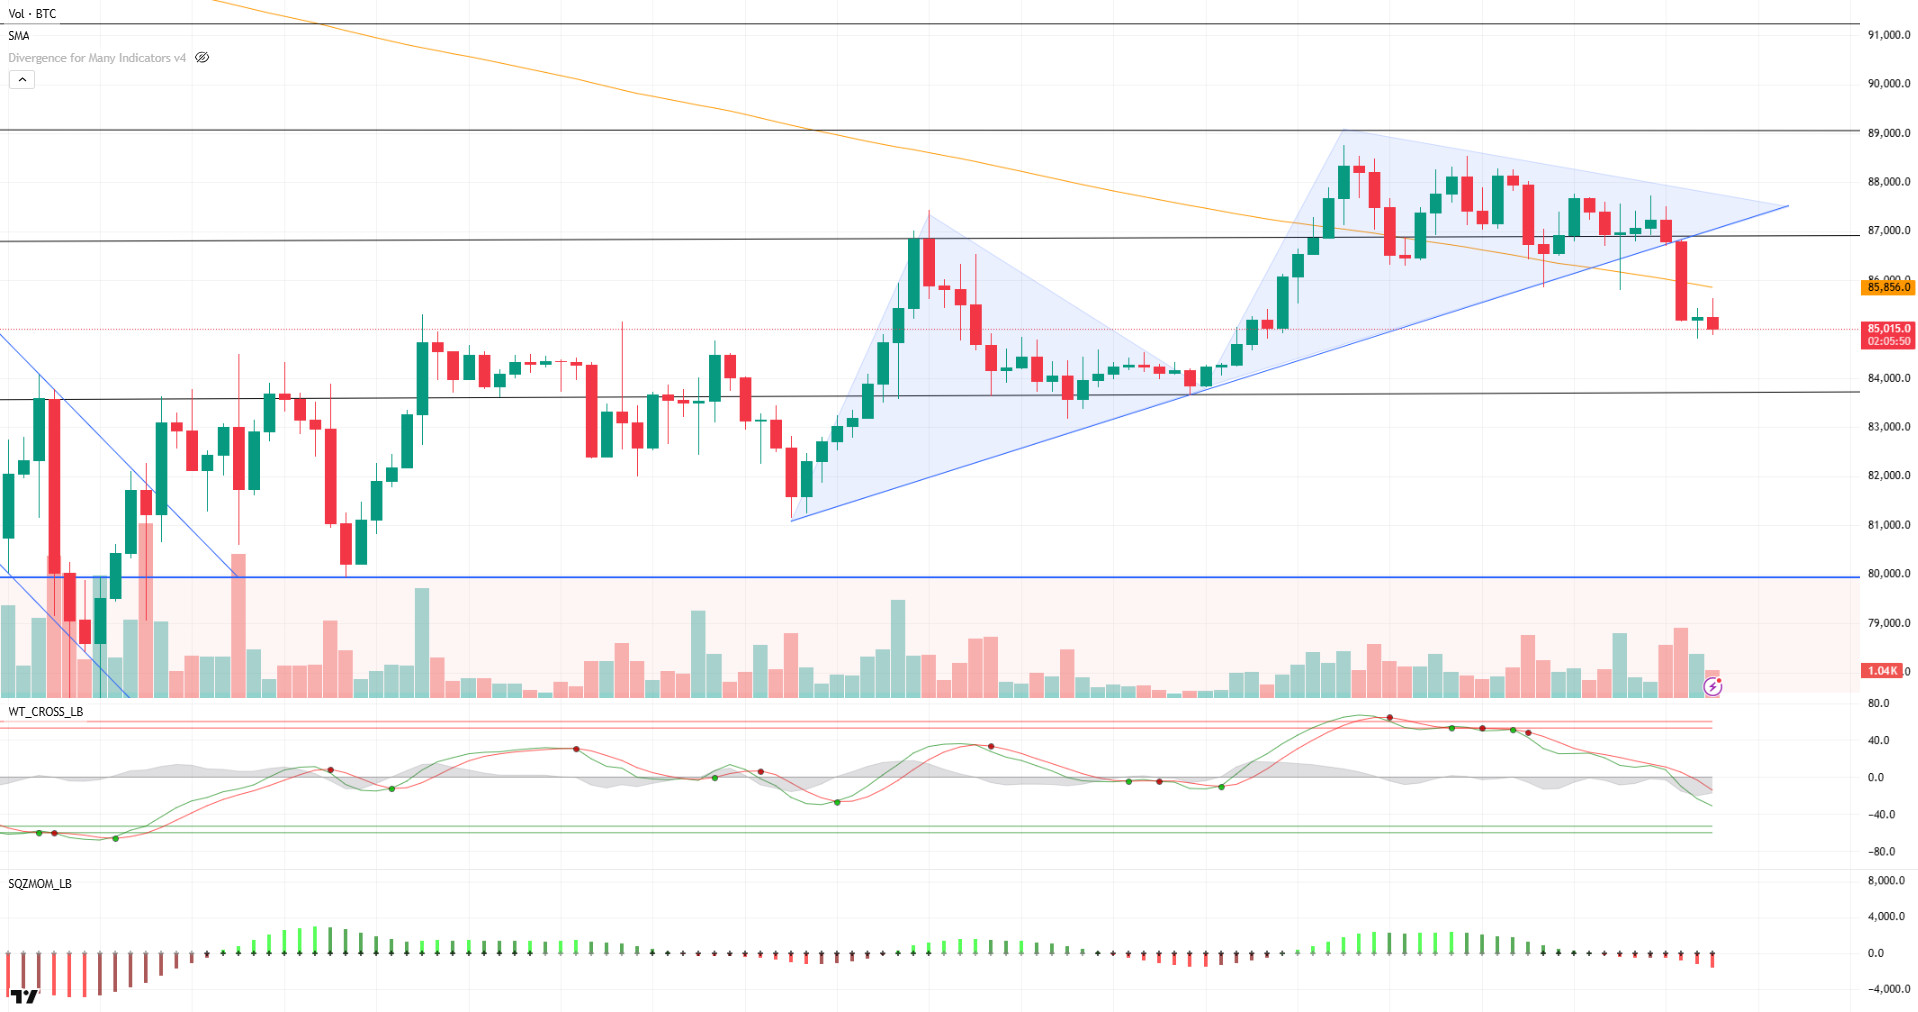
When we look at the technical outlook of BTC, it is seen that the uptrend that has been maintained since March 18 has been lost. After the second top at 88,800, which started at 82,000, the price entered a minor downtrend. With the downside break of the support level of 86,600, the price fell as low as 84,850. Following this decline, BTC formed a Long Legged Doji candle, followed by a second doji to continue its indecision. At the time of writing, BTC is trading at 85,250. The Wave Trend Oscillator is approaching the oversold zone but is yet to produce a clear buy signal. Long positions at 85,000 have been liquidated, but accumulation continues above 83,500. If the downward movement continues, the 83,500 level may be met as a strong support point. In a possible recovery scenario, the 86,600 level will be followed as a resistance point. Persistence above this level may be critical for BTC to regain strength.
Supports 83,500 – 82,400 – 80,000
Resistances: 86,600 -89,000 – 91,400
ETH/USDT
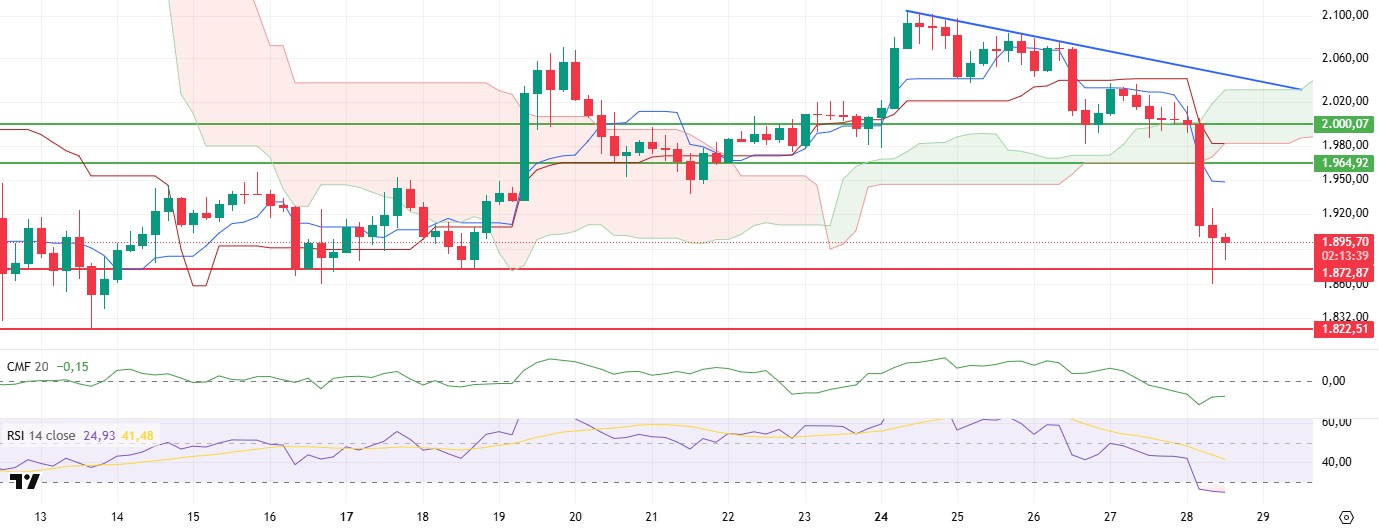
ETH experienced a sharp decline during the day after exceeding the $2,000 level in the morning hours. ETH, which momentarily dipped below the $1,872 support, showed a limited recovery with reaction buying from this level. However, technical indicators continue to signal weakness as selling pressure increases with the violation of critical support levels.
Technical indicators showed that the Chaikin Money Flow (CMF) indicator fell sharply into negative territory. However, as the US markets opened, a slight upward movement in CMF was observed. This indicates that buyers reacted at a certain point and liquidity inflows started. Relative Strength Index (RSI), which entered the oversold zone with the decline in the morning hours, is following a horizontal course at these levels. The fact that the RSI remains stable at the bottom suggests that there are appropriate levels for a possible turnaround. However, it should be kept in mind that the sideways movement in this region may continue if market conditions are not supportive. Looking at the Ichimoku indicator, the market is showing signs of weakness. The widening gap between Tenkan and Kijun levels suggests that the price is struggling to recover in the short term and the downward trend may continue.
If the price maintains the $1,872 level, upward reaction movements, albeit weak, can be seen from these regions. However, if the $1,872 support breaks, the declines are likely to accelerate and deepen to $1,822.
Supports 1,872 – 1,822 – 1,755
Resistances 1,964 – 2,000 – 2,131
XRP/USDT
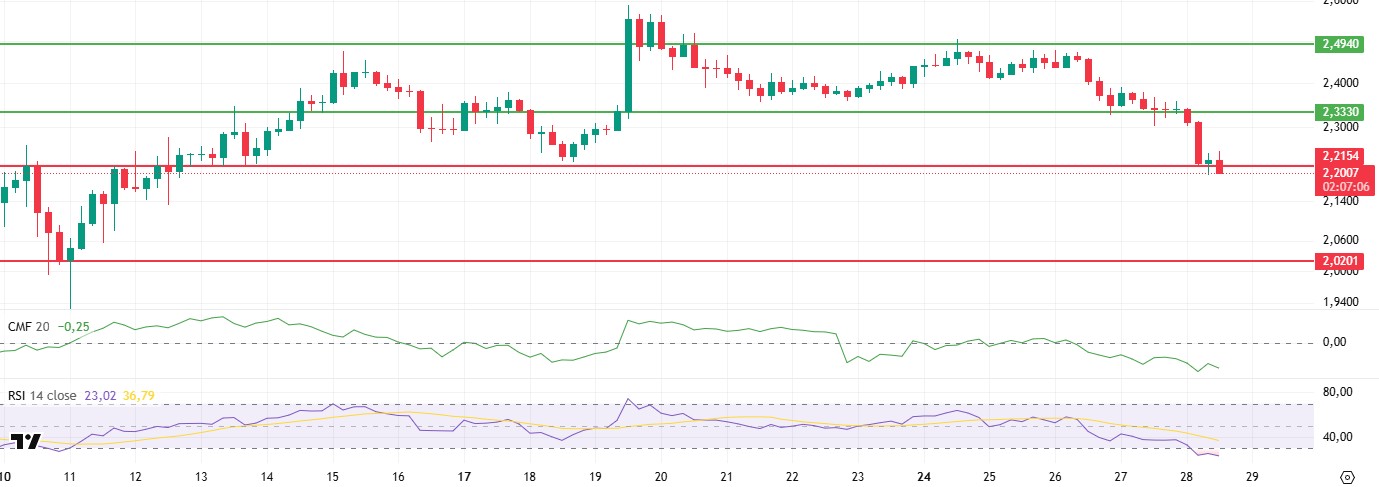
XRP is trying to hold in this region after retreating to the $2.21 level during the day. With the loss of the $2.33 level, the weakening in momentum has become remarkable, while increasing fragility is observed in price movements. Especially with the last wave of declines, testing critical support levels indicates that the selling pressure on the market continues.
Technical indicators show that the Relative Strength Index (RSI) indicator continues to hover in the oversold area. Although the fact that the RSI remains at these levels suggests that the current price range may be a short-term bottom, the lack of a significant rebound in the indicator suggests that buyer interest is still weak. The Chaikin Money Flow (CMF) indicator, on the other hand, continued its decline in the negative territory, indicating that intense selling pressure prevails in the market and liquidity outflows continue. The deepening of CMF in the negative zone suggests that the market has not yet faced a strong buying response.
In this context, despite the continued weakness in technical indicators, the fact that the price is in a critical support zone and the indicators are converging to the bottom levels raises the possibility of a potential short-term reaction purchase. However, it will be important for buyers to regain the $2.33 level for the permanence of this bullish movement. Otherwise, XRP’s loss of the $2.21 support could lead to further selling pressure and deeper price retracements. In this case, the $2.00 levels should be followed as the next support zones.
Supports 2.2154 – 2.0201 – 1.8932
Resistances 2.3330 – 2.4940 – 2.6269
SOL/USDT
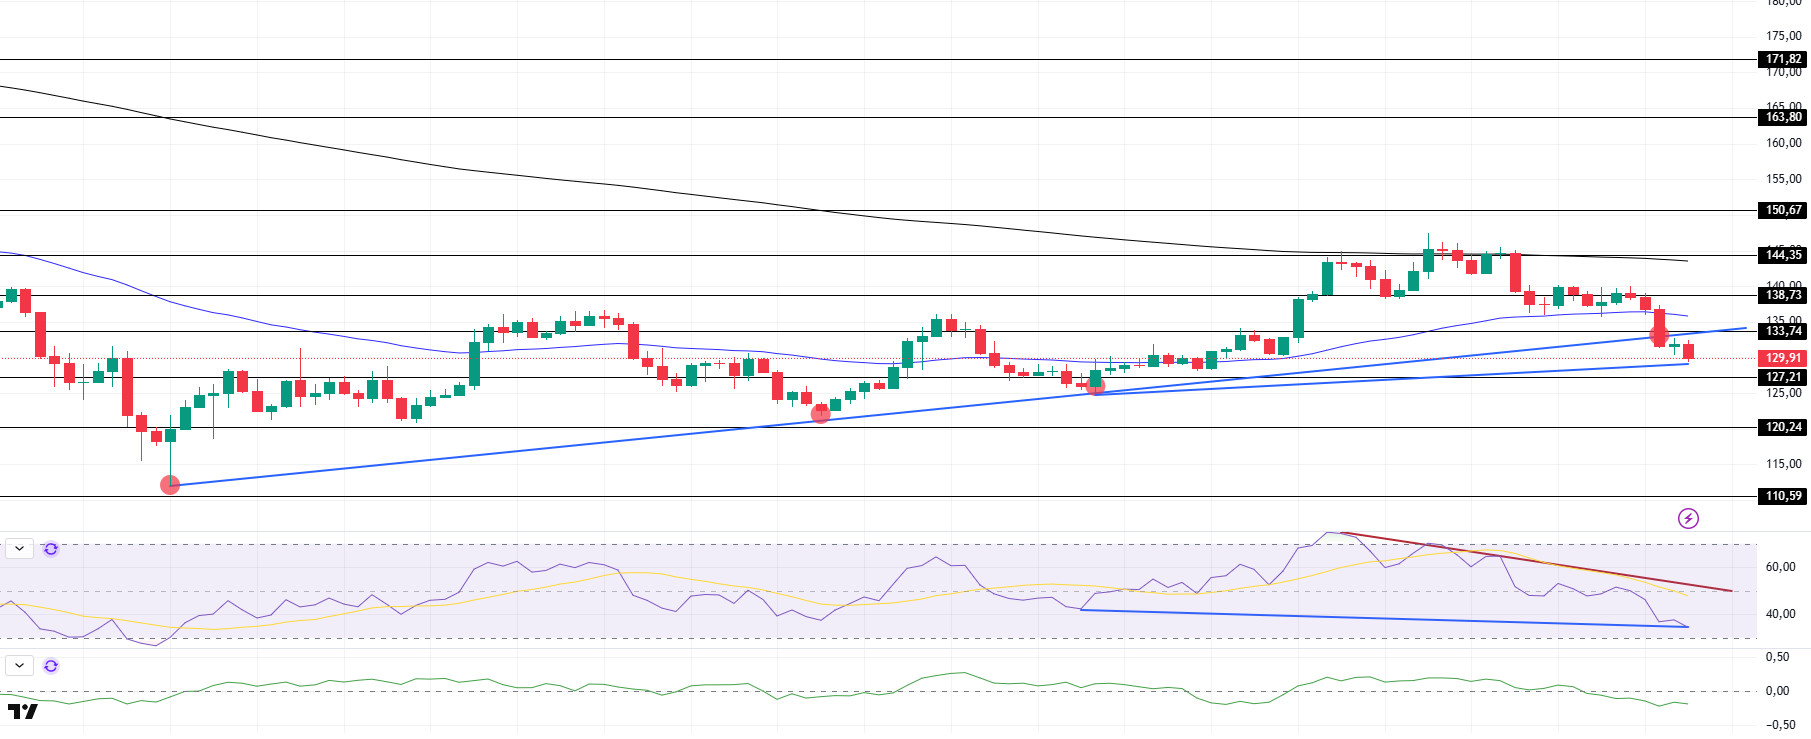
SOL has been slightly bearish since our analysis in the morning. The asset also broke the uptrend that started on March 11 and tested the uptrend as resistance but failed to break it, deepening its decline. On the 4-hour timeframe, the 50 EMA (Blue Line) remained below the 200 EMA (Black Line). This could deepen the decline further in the medium term. At the same time, the price is moving below the two moving averages again. The Chaikin Money Flow (CMF)20 indicator is in negative territory, but positive daily volume may increase inflows and cause CMF to move into positive territory. However, the Relative Strength Index (RSI)14 indicator retreated to the mid-level of the negative zone. However, the downtrend since March 24 continues. At the same time, the upside discrepancy should be taken into account. The $ 138.73 level appears as a resistance point in the rises driven by the upcoming macroeconomic data and the news in the Solana ecosystem. If it breaks here, the rise may continue. In case of retracements for the opposite reasons or due to profit sales, the support level of $ 127.21 can be triggered. If the price comes to these support levels, a potential bullish opportunity may arise if momentum increases.
Supports 127.21 – 120.24 – 110.59
Resistances 133.74 – 138.73 – 144.35
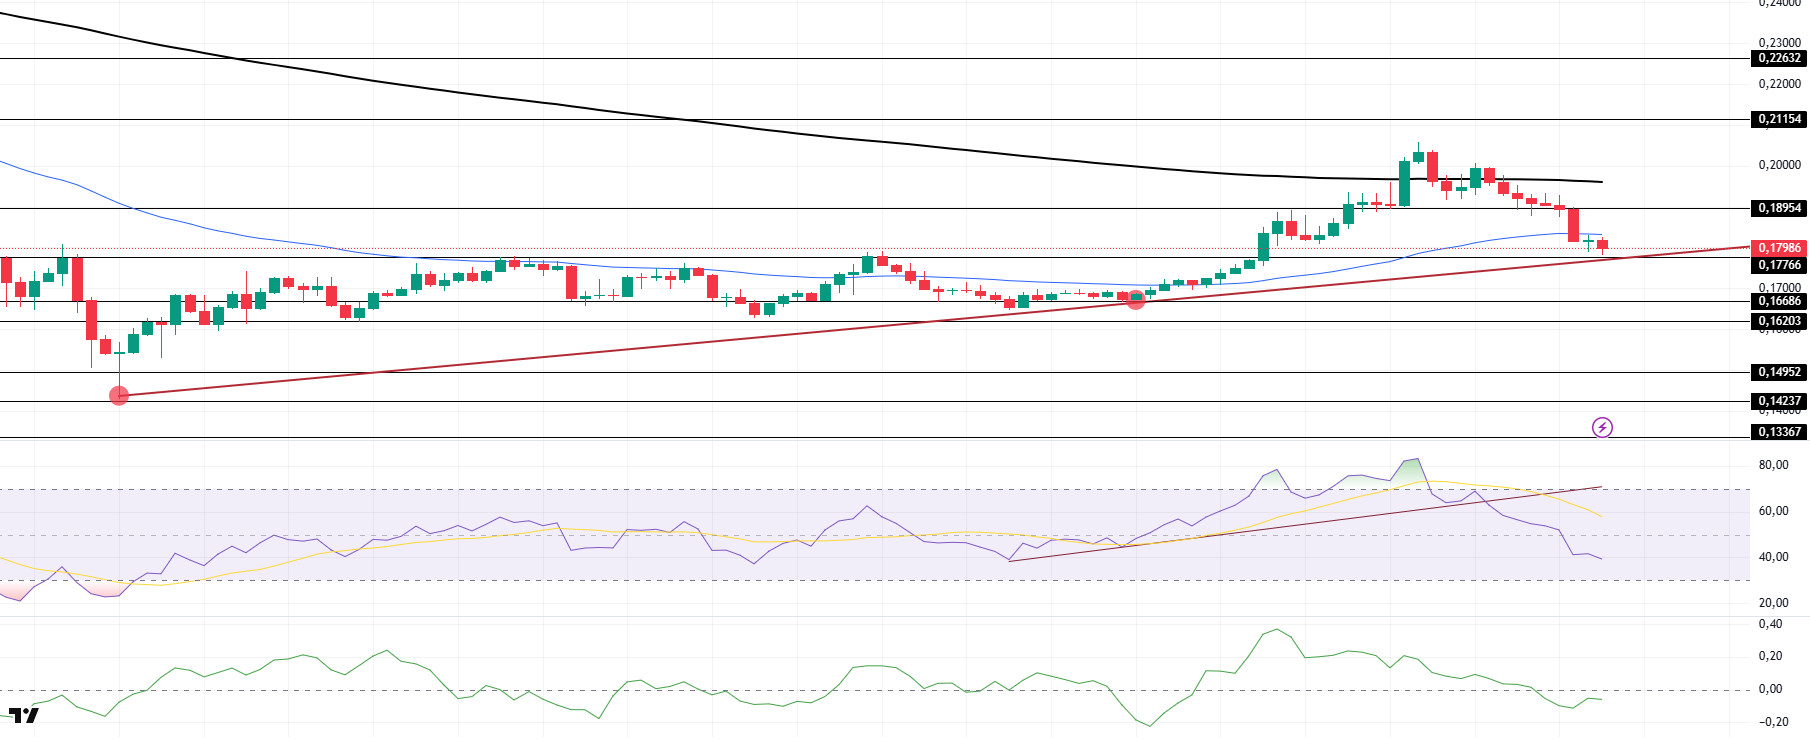
DOGE/USDT
DOGE moved sideways after our morning analysis. The asset continued to remain below the 200 EMA (Black Line) and broke the strong support at $0.18954. It is currently testing the 50 EMA (Blue Line) moving average as resistance. If it fails to break upwards, it may test the strong support at $0.17766. On the 4-hour timeframe, the 50 EMA (Blue Line) continues to be below the 200 EMA (Black Line). This could mean that the decline could deepen in the medium term. However, the price has started to price below the two moving averages. The Chaikin Money Flow (CMF)20 indicator is in negative territory. In addition, the negative 24-hour volume may reduce inflows and keep CMF in negative territory. On the other hand, Relative Strength Index (RSI)14 continued to retreat, breaking the uptrend that started on March 21. This may deepen the decline further. The $0.21154 level stands out as a very strong resistance point in the rises driven by political reasons, macroeconomic data and innovations in the DOGE coin. In case of possible retracements due to political, macroeconomic reasons or due to negativities in the ecosystem, the $ 0.17766 level, which is a strong support place, is an important support place. If the price comes to these support levels, a potential bullish opportunity may arise if momentum increases.
Supports 0.17766 – 0.16686 – 0.16203
Resistances 0.18954 – 0.21154 – 0.22632
Legal Notice
The investment information, comments and recommendations contained herein do not constitute investment advice. Investment advisory services are provided individually by authorized institutions taking into account the risk and return preferences of individuals. The comments and recommendations contained herein are of a general nature. These recommendations may not be suitable for your financial situation and risk and return preferences. Therefore, making an investment decision based solely on the information contained herein may not produce results in line with your expectations.

