
TECHNICAL ANALYSIS
BTC/USDT
According to CoinShares’ latest report, digital asset investment products saw outflows for the third consecutive week, reaching a record $2.9 billion last week. Total outflows over the past three weeks totalled $3.8 billion, with Bitcoin being the hardest hit asset with losses of $2.59 billion. Ethereum also broke a weekly record with an outflow of $300 million, which increased the selling pressure in the market. However, Trump’s messages on the reserve system yesterday may revive investor confidence. If capital inflows regain momentum, it may be possible for Bitcoin to reach six-digit levels.
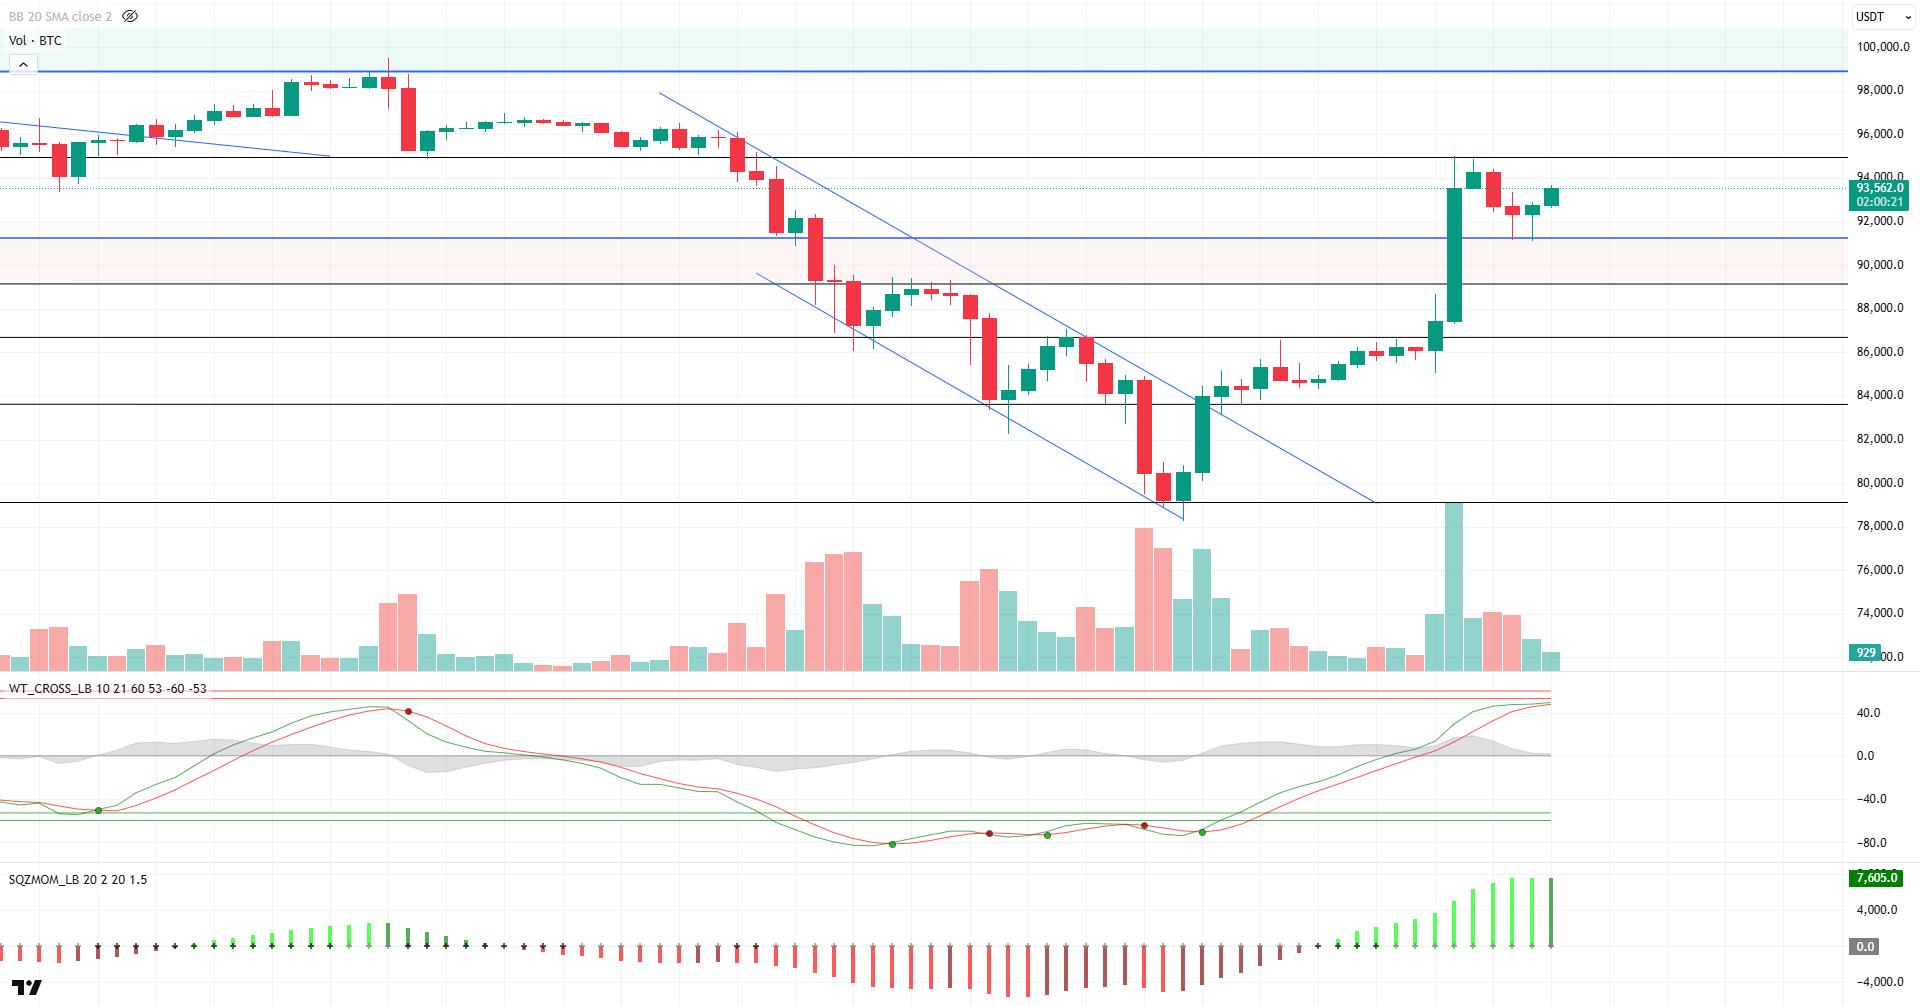
Looking at the technical outlook, Bitcoin (BTC) is following a horizontal course today after yesterday’s bullish movement. BTC, which entered the accumulation process close to the levels it reached with the rise, maintains its strong stance with the support of the optimistic mood in the market. Currently trading at 93.500, above the 92.800 intermediate support level, BTC is moving in the overbought zone on the 4-hour chart in terms of technical oscillators. In a possible selling wave, the possibility of a cup-and-handle pattern may come to the fore. In this scenario, the 89,000 level stands out as a strong support point, while the 95,000 level will be followed as a reference point with Trump’s statements today if the upward movement continues. Exceeding this level may strengthen the wave of optimism in the markets and bring the six-digit levels back to the agenda.
Supports 92,800 – 91,400 – 89,000
Resistances 95,000 – 97,000 – 99,100
ETH/USDT
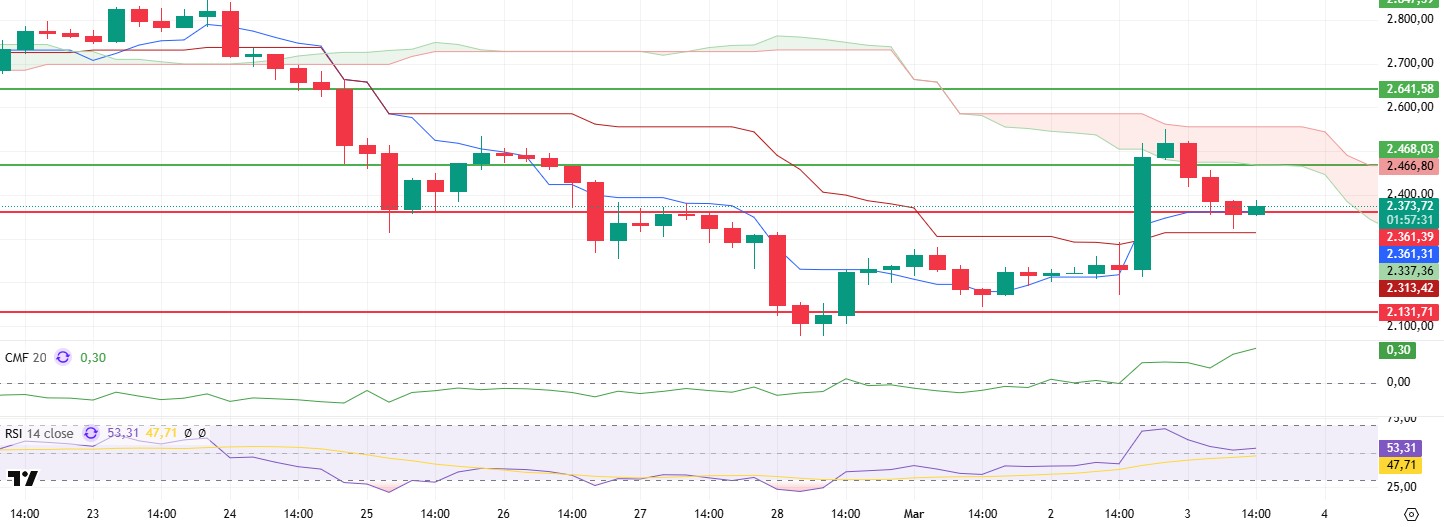
Although ETH experienced a slight pullback during the day and fell below the $2,361 level, it managed to rise above the support level again with strong reaction purchases from this region. The current price action shows that the short-term uptrend is maintained, and the positive structure continues.
Technical indicators continue to generate signals that support market dynamics. Chaikin Money Flow (CMF) indicator rose as high as 0.30, indicating that liquidity inflows continue. However, the negative divergence between price movements and the indicator suggests that there may be limited correction movements in the short term. Relative Strength Index (RSI), on the other hand, has turned upwards again with support from the Based MA, indicating that momentum remains strong and the positive structure is maintained. On the other hand, when the Ichimoku cloud is analyzed, it is seen that the price is still below the cloud level but will be positioned in the next day’s cloud. In addition, maintaining the tenkan level stands out as an important factor supporting the bullish expectation.
Overall, the technical outlook and market news flows continue to support a positive structure for the ETH price. If the $2,361 level is sustained above, bullish movements are likely to gain momentum. However, if this support is lost, the weakening in momentum may deepen and downward movements may accelerate. Therefore, especially in terms of short-term strategies, the protection of the 2,361 level should be followed as a critical threshold.
Supports 2,361 – 2,131- 1,907
Resistances 2,468 – 2,641 – 2,847
XRP/USDT
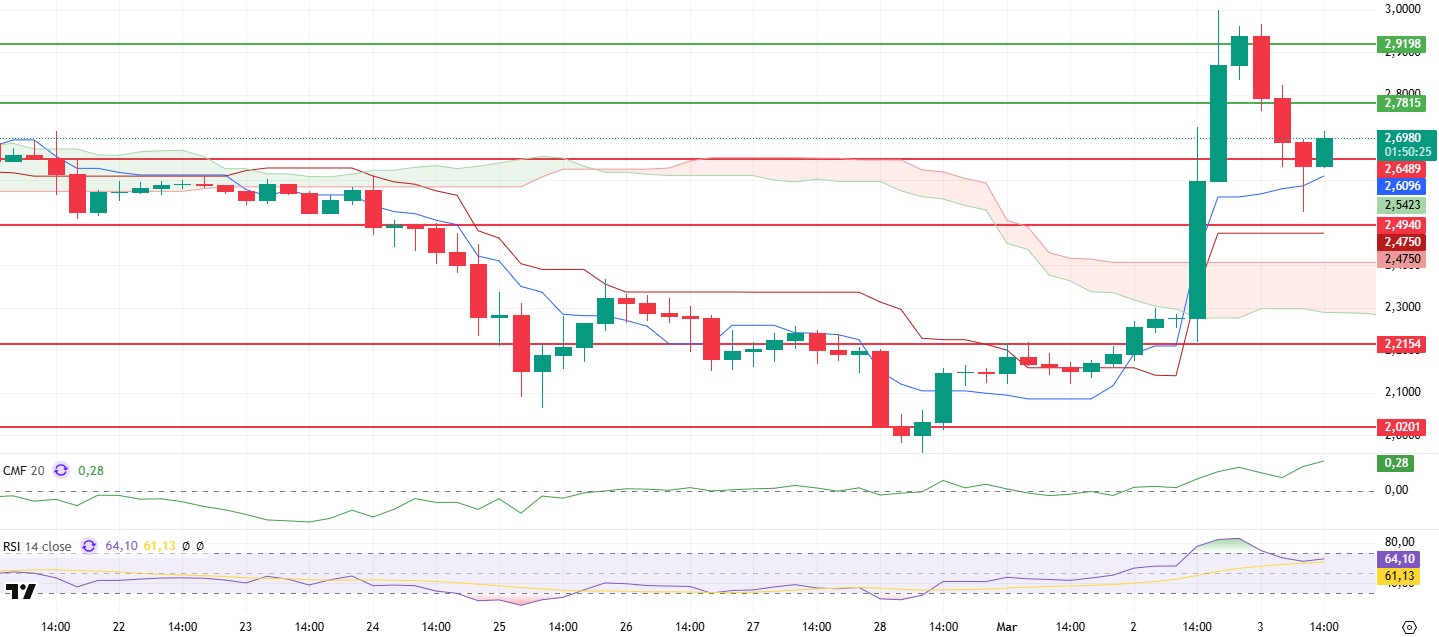
XRP, with the profit sales that came after yesterday’s rise, violated the support of $ 2.64 in the morning hours and fell to $ 2.53, but managed to recover during the day and rise above this support.
Although Chaikin Money Flow (CMF) continues its upward movement in the positive area, its negative divergence with the price requires investors to be cautious. Looking at the Ichimoku indicator, the fact that the price has not lost the kumo cloud, tenkan and kijun levels shows that the positive outlook continues. Momentum indicators also support this.
As a result, closes above the $2.64 support level support the price’s rises to higher resistance levels. However, the break of this level may cause some further retracement with the negative divergence on CMF.
Supports 2.6489 – 2.4940 – 2.2154
Resistances 2.7815 – 2.9198 – 3.1493
SOL/USDT
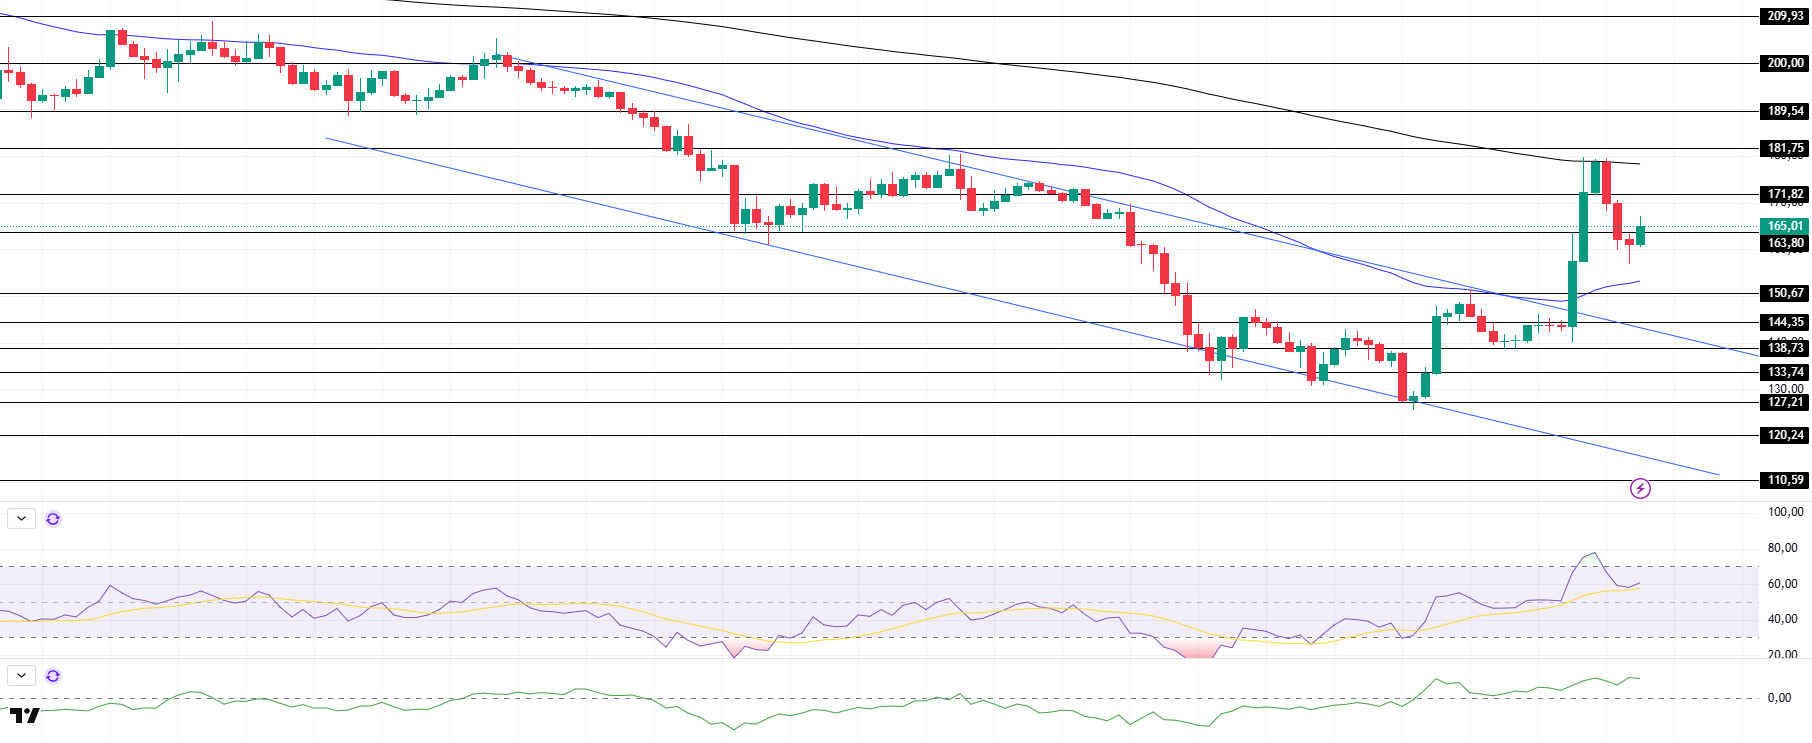
SOL has been slightly bullish since our analysis in the morning. On the 4-hour timeframe, the 50 EMA (Blue Line) continues to be below the 200 EMA (Black Line). This could deepen the decline further in the medium term. At the same time, the price is priced between two moving averages. This suggests that the asset is still deciding which way to go. When we examine the Chaikin Money Flow (CMF)20 indicator, it is in positive territory, but the increase in volume may further increase the money increases. However, the Relative Strength Index (RSI)14 indicator is hovering at the mid-level of the positive zone, losing momentum from the overbought zone. The $ 181.75 level stands out as a very strong resistance point in the rises driven by both the upcoming macroeconomic data and the news in the Solana ecosystem. If it breaks here, the rise may continue. In case of retracements for the opposite reasons or due to profit sales, the support level of 150.67 dollars can be triggered. If the price comes to these support levels, a potential bullish opportunity may arise if momentum increases.
Supports 150.67 – 144.35 – 138.73
Resistances 163.80 – 171.82 – 181.75
DOGE/USDT
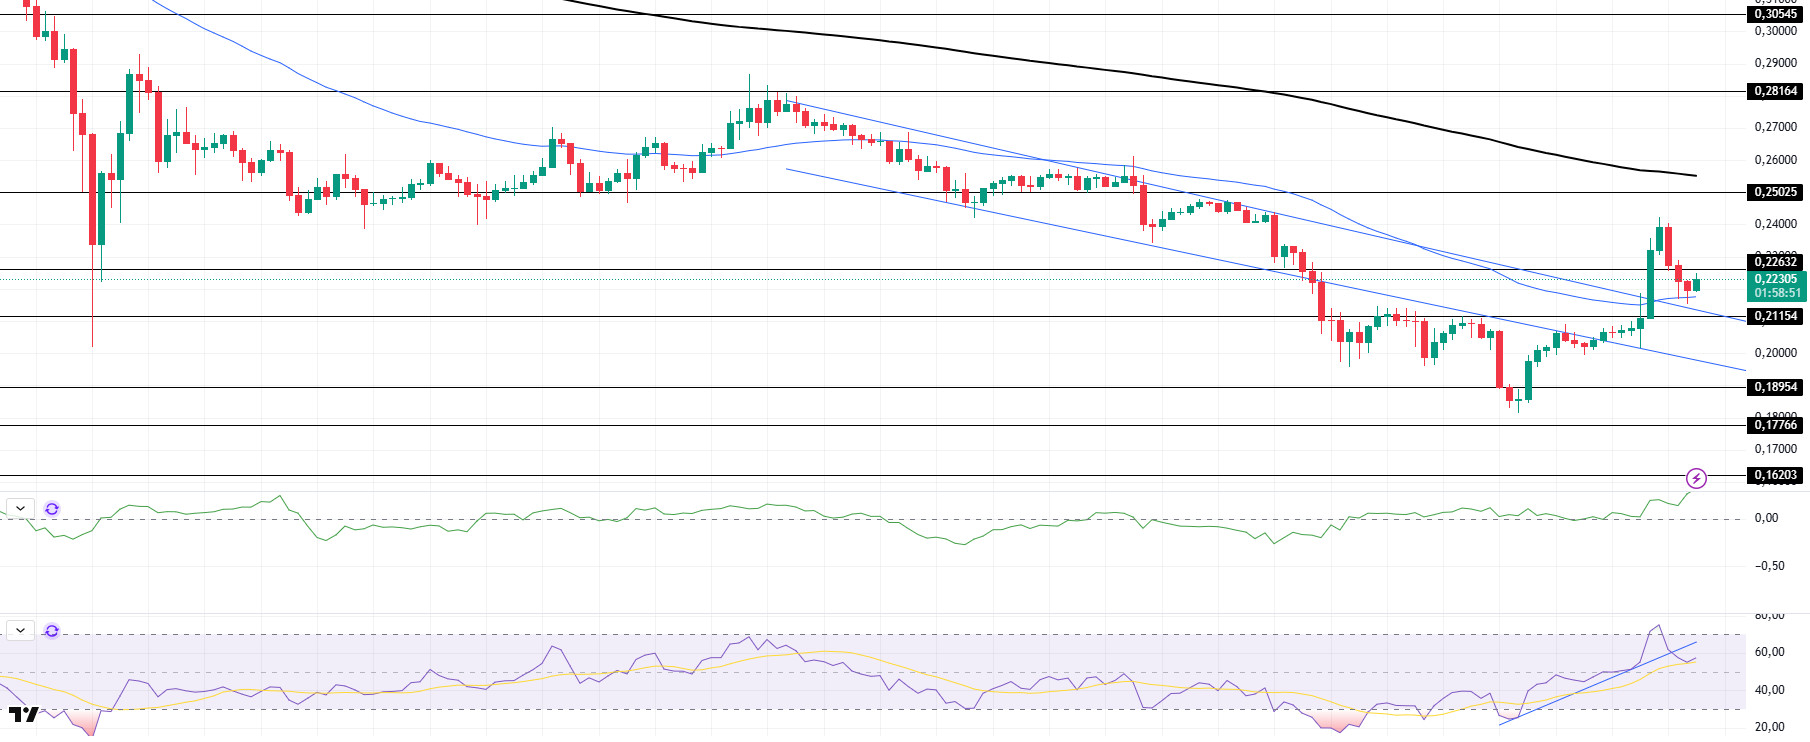
DOGE has held its level since our morning analysis. The price tested the 50 EMA (Blue Line) and the ceiling of the downtrend and was slightly bullish with support. On the 4-hour timeframe, the 50 EMA (Blue Line) is below the 200 EMA (Black Line). This could mean that the decline could deepen further in the medium term. However, the price is hovering between two moving averages. But the difference between the two moving averages, as well as the difference between the price and the 50 EMA, increases the probability that DOGE will rise. The Chaikin Money Flow (CMF)20 indicator is in positive territory. However, the fact that the volume is on the plus side shows us the possibility that money inflows may increase further. On the other hand, Relative Strength Index (RSI)14 is at the middle level of the positive zone, accelerating downward from the overbought level again. However, the RSI has broken the downward uptrend that started on February 28. This downtrend may continue. The level of 0.25025 dollars appears as a very strong resistance level in the rises due to political reasons, macroeconomic data and innovations in the DOGE coin. In case of possible pullbacks due to political, macroeconomic reasons or negativities in the ecosystem, the $0.18954 level, which is the base level of the trend, is an important support. If the price reaches these support levels, a potential bullish opportunity may arise if momentum increases.
Supports 0.21154 – 0.18954 – 0.17766
Resistances 0.22632 – 0.25025 – 0.28164
LEGAL NOTICE
The investment information, comments and recommendations contained herein do not constitute investment advice. Investment advisory services are provided individually by authorized institutions taking into account the risk and return preferences of individuals. The comments and recommendations contained herein are of a general nature. These recommendations may not be suitable for your financial situation and risk and return preferences. Therefore, making an investment decision based solely on the information contained herein may not produce results in line with your expectations.

