
Technical Analysis
BTC/USDT
Michael Saylor shared his list of “21 Rules for Bitcoin”, emphasizing the uniqueness of Bitcoin. Coin Shares reported net outflows of $415 million after 19 weeks of inflows, most of which came from Bitcoin. Institutional investors hold $26.8 billion in spot Bitcoin ETFs, while BlackRock’s IBIT ETF continues to hold the largest share with $16 billion.
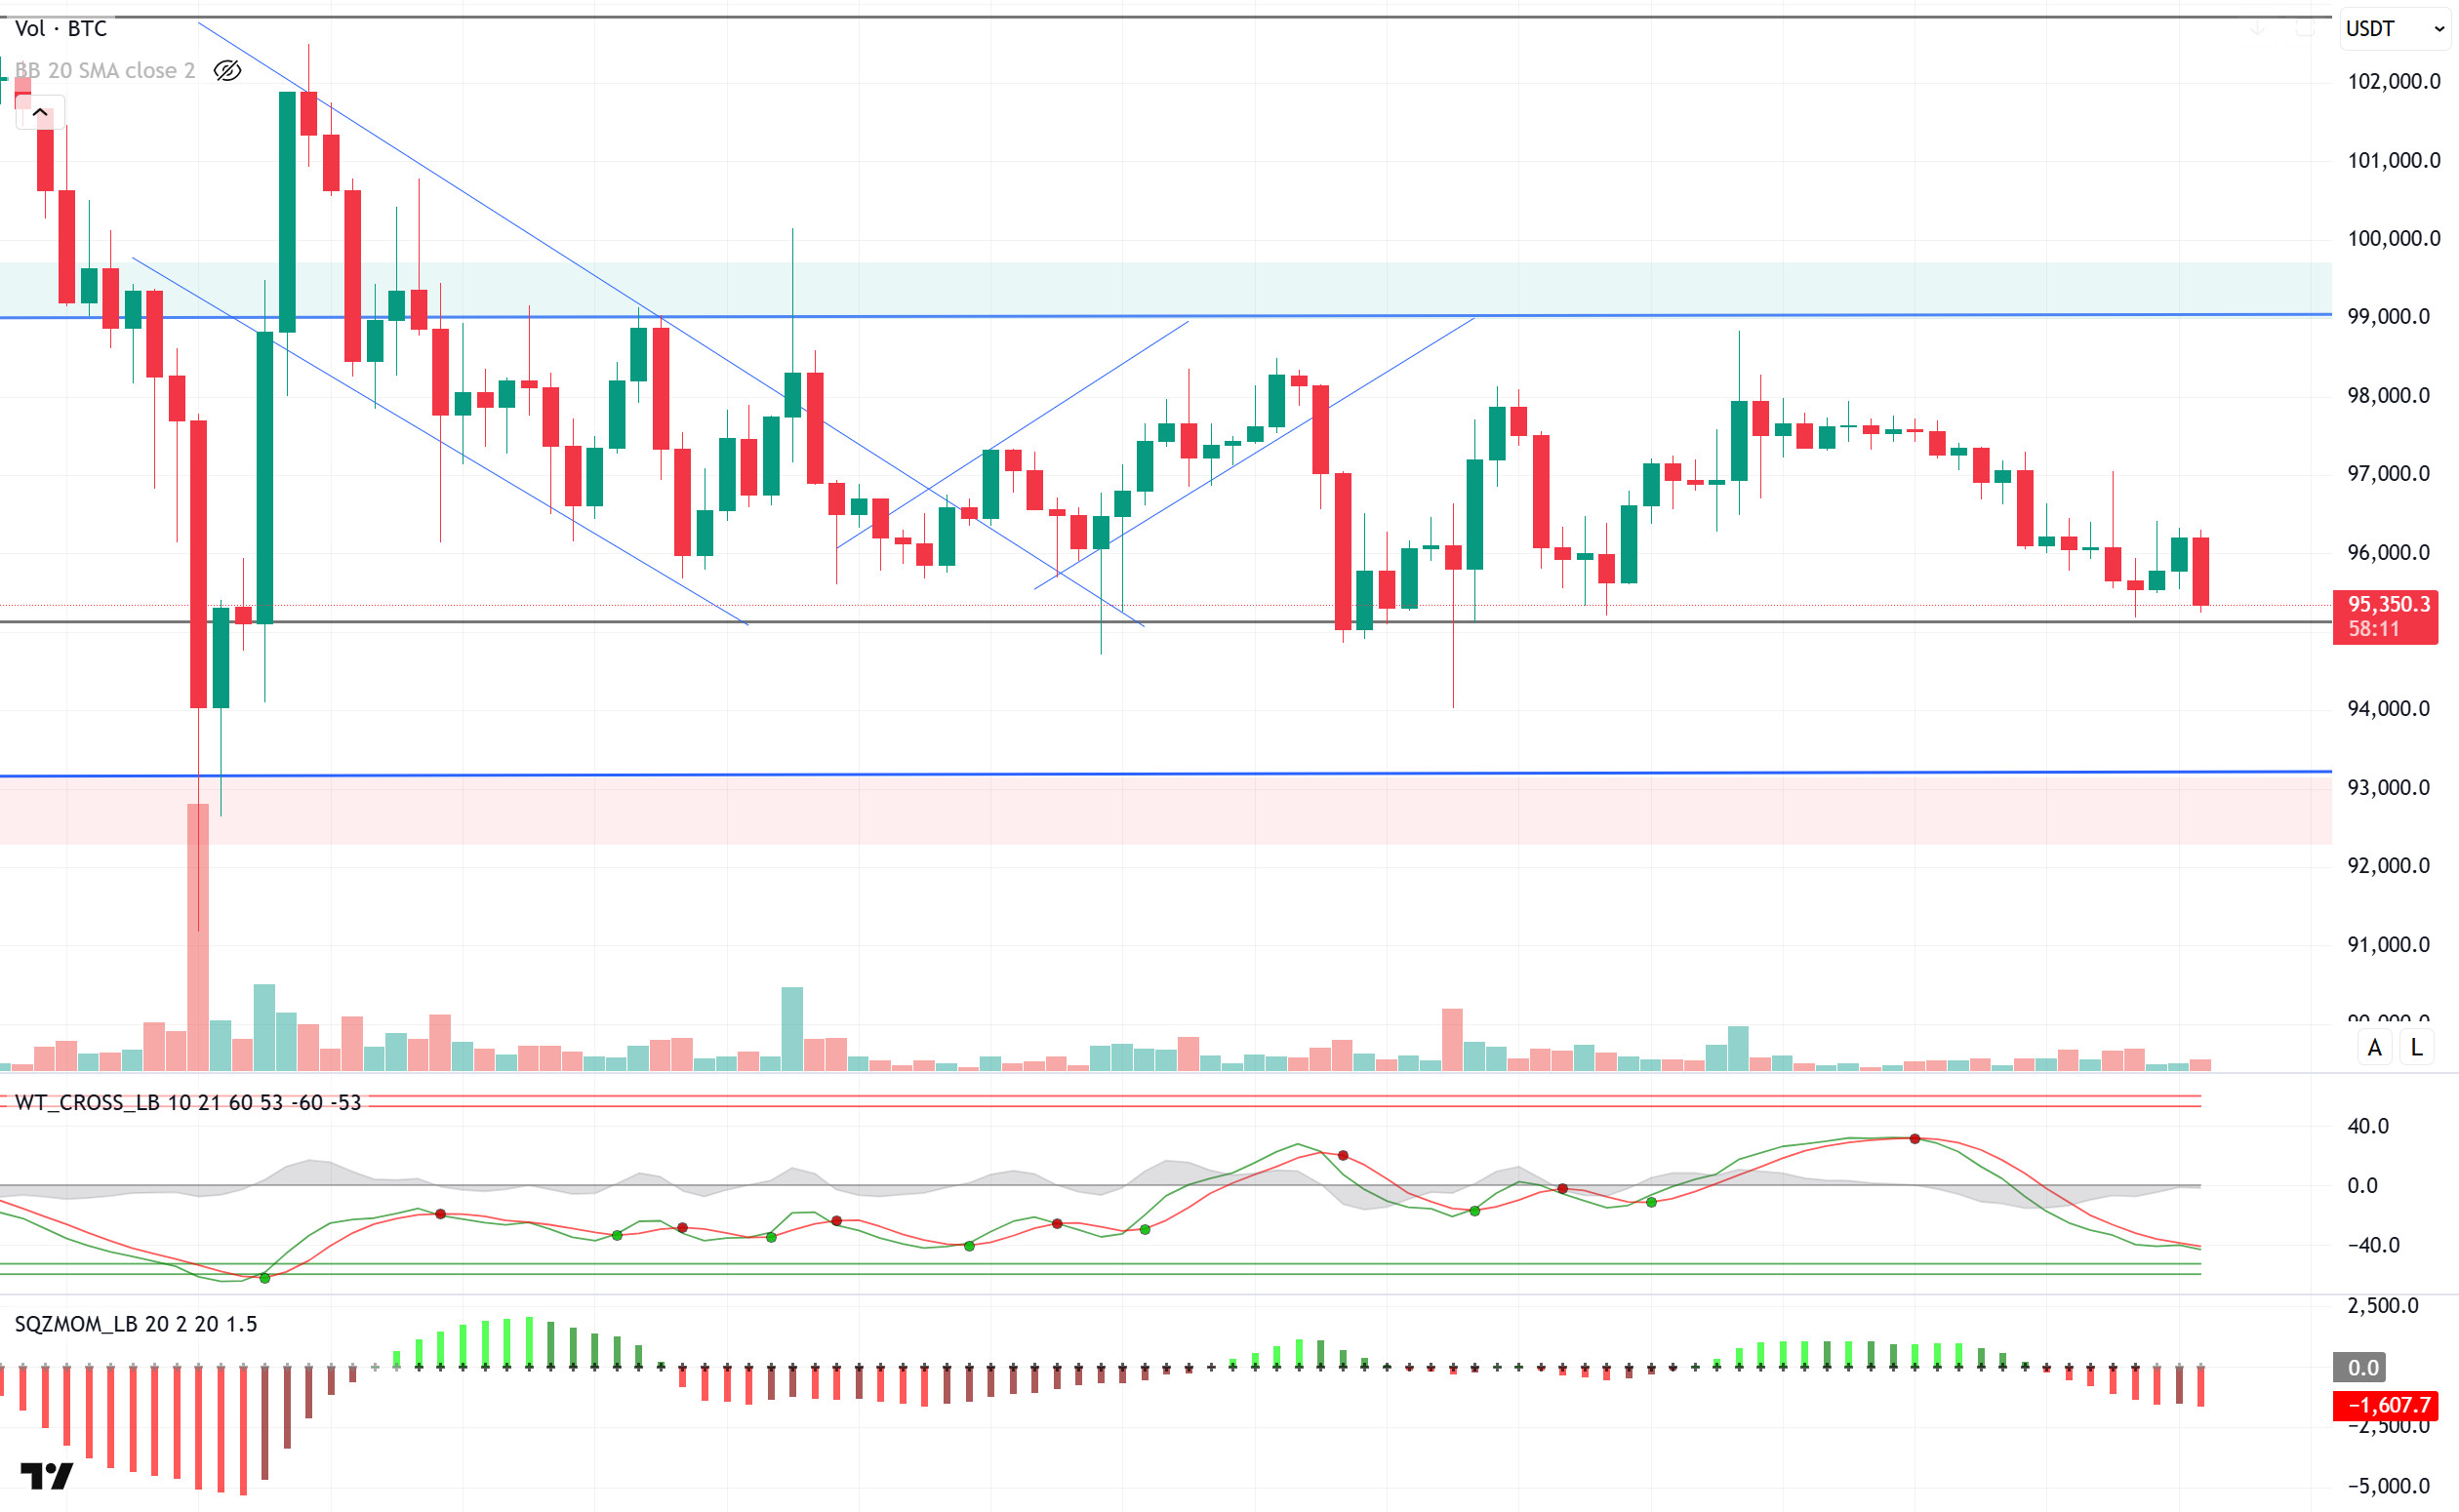
Looking at the technical outlook, BTC price, which has been exhibiting low volatility for a long time at 96,000 levels, is retreating towards the major support level. Currently trading at 95,300, BTC technical oscillators continue to maintain a sell signal near the oversold zone, while momentum indicators continue to weaken. When we look at the daily liquidation heatmap, long trades above 94,000 are noteworthy, while the price is likely to rebound after sagging below the 95,000 level. In case the decline deepens, hourly closures below the 95,000 level will be monitored and the 92,800 level may come to the agenda again. In the event of a possible recovery, the persistence above 95,000 once again gains importance as a critical threshold for staying in the positive zone.
Supports 95,000 – 92,800 – 90,400
Resistances 97,000 – 99,100 -101,400
ETH/USDT
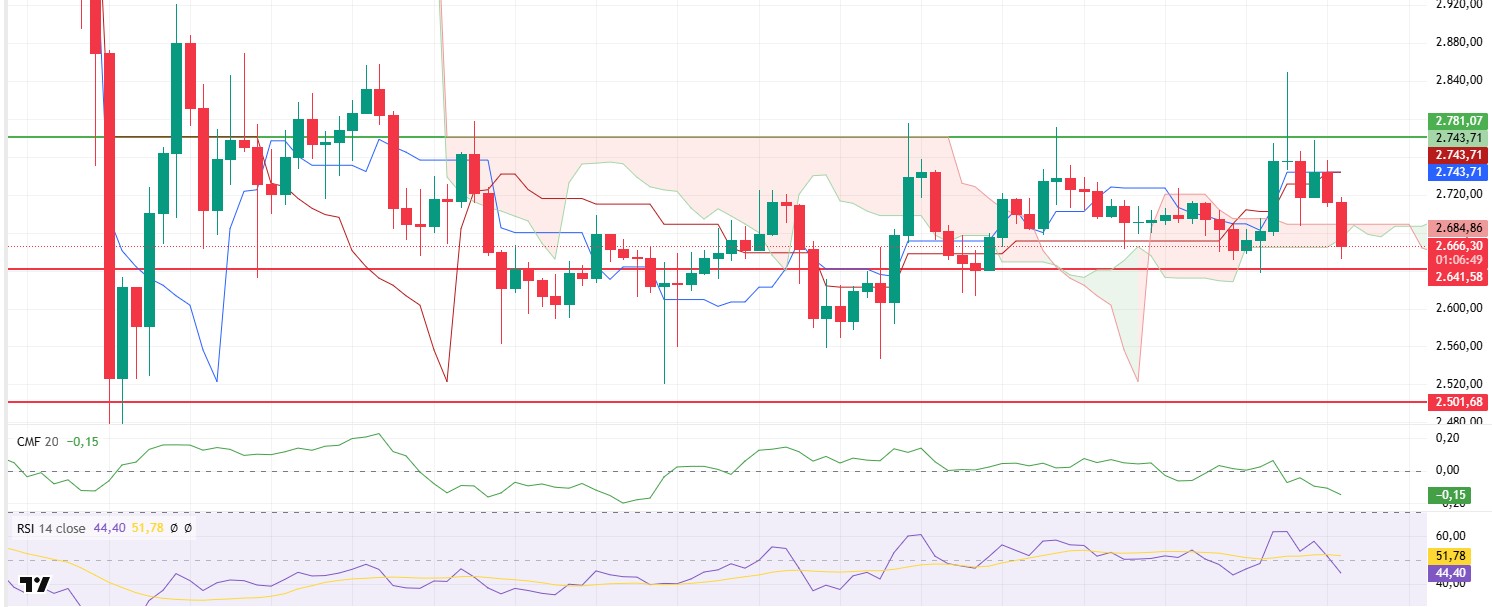
ETH broke through the resistance point at $2,781 yesterday evening and made a rapid rise to $2,850. However, heavy short positions in this region caused the price to quickly retreat back below the $2,781 level. As the selling pressure increased overnight, the price continued its downward trend, falling below the Ichimoku cloud. When the price movements are analyzed, it is once again seen that the $2,781 and $2,641 levels are of critical importance. If the $2,781 level is exceeded, upside momentum can be gained, while breaching the $2,641 level could trigger a deeper correction.
Technical indicators show that the Chaikin Money Flow (CMF) indicator retreated sharply into negative territory with the decline, indicating that liquidity outflows from the market accelerated. However, CMF, which is out of sync with the price action, is in a positive divergence. This indicates that the indicator may exhibit an upward rebound as buying increases during the day. The Relative Strength Index (RSI) indicator, on the other hand, has retreated sharply after yesterday’s sharp decline, indicating that momentum continues to move downwards. It also suggests that selling pressure is still strong and the market remains weak in the short term. Looking at the Ichimoku indicator, the price breaching the kijun, tenkan and kumo cloud levels has created a negative signal. In particular, a break below the cloud suggests that the trend is weakening, and the market is bearish.
If the price continues to remain below the cloud during the day, it may increase the possibility of a pullback towards the $2,641 level. If the $2,641 level is broken, a deeper sell-off could push the price down to the $2,501 level. On the other hand, if the price rises above the Ichimoku cloud again, bullish momentum could be gained and a new move towards the $2,781 level could be observed.
Supports 2,641 – 2,501 – 2,368
Resistances 2,781 – 2,881 – 2,992
XRP/USDT
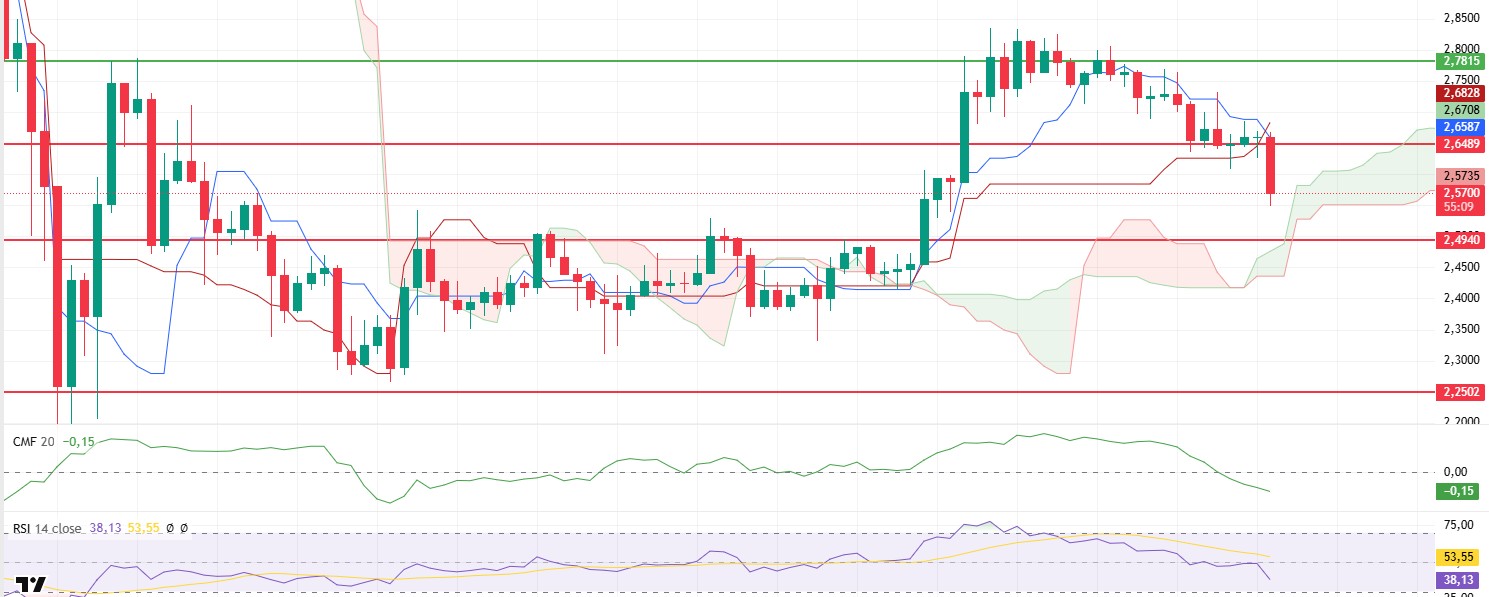
After losing the $2.65 support, XRP fell to $2.55 with a sharp selling pressure. With this decline, there are important signals that weakness continues in technical indicators.
According to the Ichimoku indicator, the downward intersection of the tenkan and kijun lines generates a sell signal, while the price dips below these levels reinforces the negative outlook. This indicates that the trend is weakening and selling pressure may increase. The Chaikin Money Flow (CMF) indicator also fell sharply into negative territory, indicating that liquidity outflows from the market are accelerating. The Relative Strength Index (RSI) indicator also continues its downward movement and confirms that the price is in a bearish trend. This move in the RSI suggests that the market is still under selling pressure and buyer demand is not enough for a strong rebound.
If the selling pressure continues during the day, the $2.49 level stands out as a critical support point. This level could be an important reaction zone as it is both the main support point and the lower boundary of the Ichimoku cloud. Buyers can be expected to step in here and it should be carefully monitored whether the price can hold at this level. On the other hand, the price regaining the $2.65 level can be considered as a signal of recovery in the market. Persistence above this level may weaken the downtrend and pave the way for the start of an upward movement.
Supports 2.4940 – 2.2502 – 2.0201
Resistances 2.6486 – 2.7815 – 2.9379
SOL/USDT
According to CoinGlass data, Solana’s open interest (OI) is increasing but OI-weighted funding ratios remained negative. DEX volume has also decreased by over 24% in the last seven days. At the same time, Solana’s network activity has slowed significantly, with active addresses falling to a five-month low.
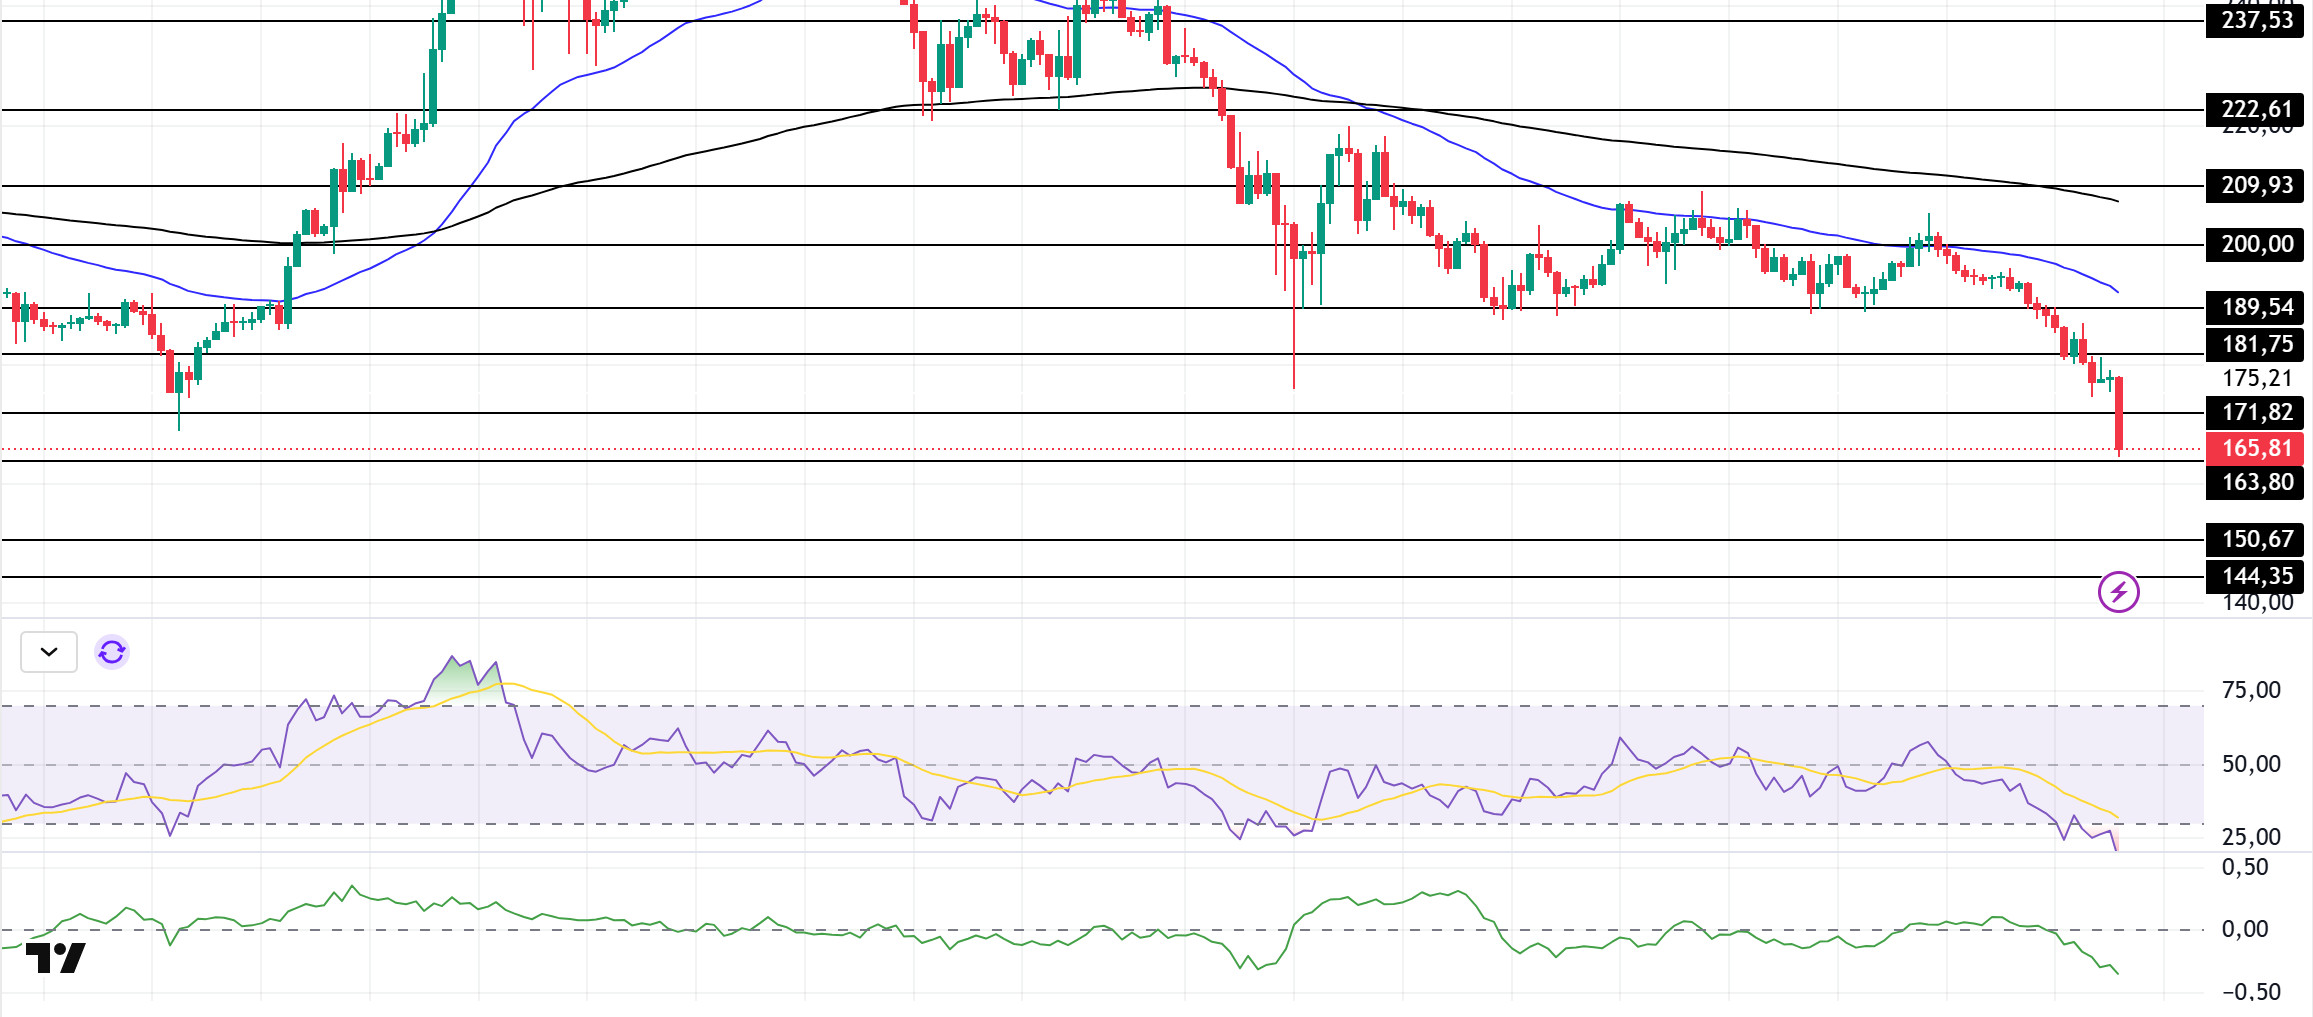
SOL has fallen by around 8.59% in the last 24 hours, keeping pace with the market’s overall decline. On the 4-hour timeframe, the 50 EMA (Blue Line) continues to be below the 200 EMA (Black Line). This could continue to deepen the decline in the medium term. At the same time, the asset continued to hover below both moving averages. When we examine the Chaikin Money Flow (CMF)20 indicator, the increase in volume and its presence in the negative zone indicates that money outflows are increasing and the volume is on the sellers’ side. Although this indicates that sellers are more dominant than buyers, the increase in volume may push the price higher. However, the Relative Strength Index (RSI)14 indicator is in oversold territory. This could initiate a rise. The $200.00 level appears to be a very strong resistance point in the rises driven by both the upcoming macroeconomic data and the news in the Solana ecosystem. If it breaks here, the rise may continue. In case of retracements for the opposite reasons or due to profit sales, the support level of $ 163.80 can be triggered again. If the price reaches these support levels, a potential bullish opportunity may arise if momentum increases.
Supports 163.80 – 150.67 – 144.35
Resistances 171.82 – 181.75 – 189.54
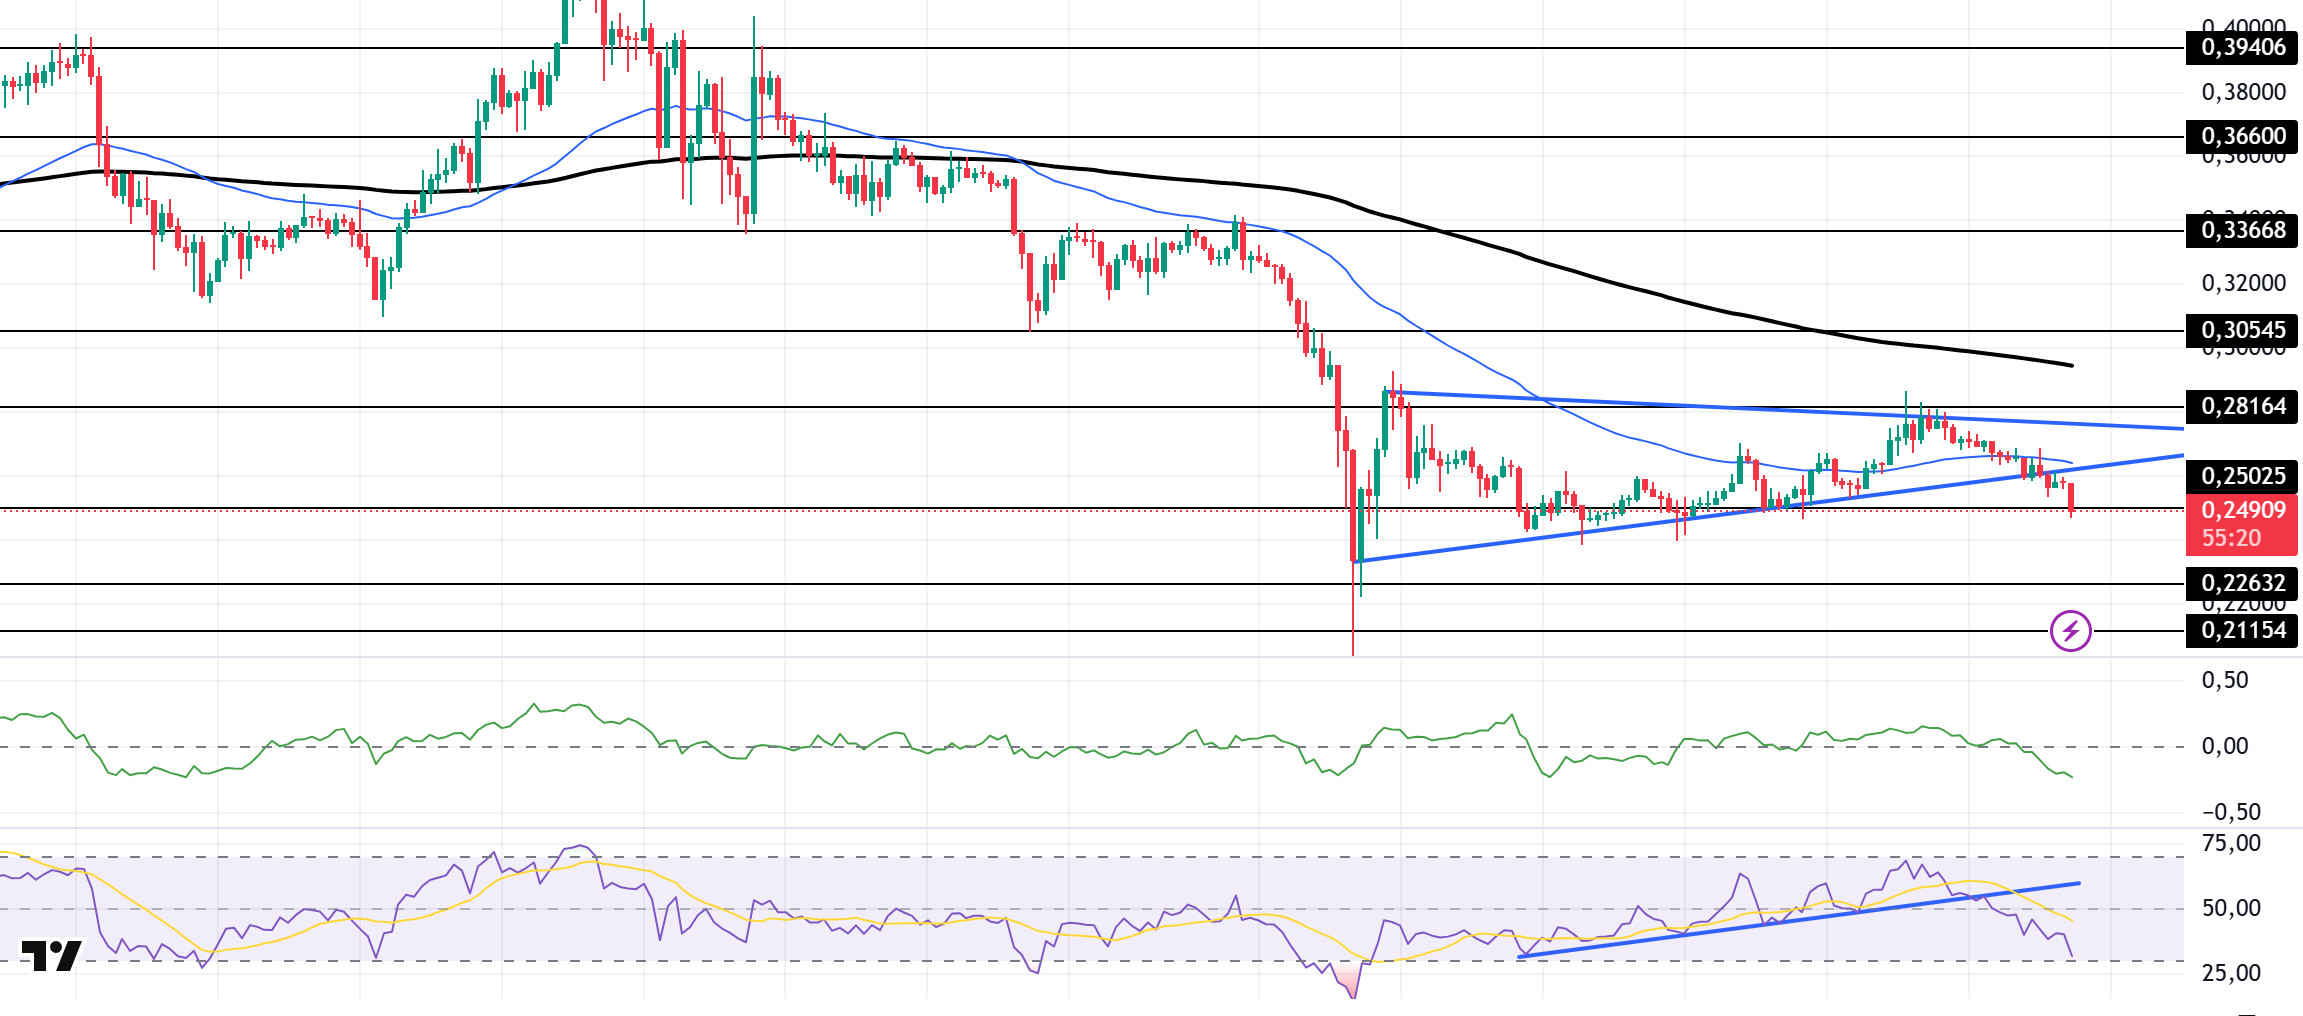
DOGE/USDT
Elon Musk’s DOGE announces SEC audit for fraud, misconduct and waste. Dogecoin’s open interest rose to DOGE 9.38 billion as investors increased their total open positions, according to CoinGlass data. This translates to $2.47 billion in funds deposited by market participants in the last 24 hours
Since our analysis yesterday, DOGE has tested the base of the symmetrical triangle pattern and has broken it to the downside in line with the overall market direction. At the same time, the asset remains below the 50 EMA (Blue Line) and the 200 EMA (Black Line). This could mean that the decline could deepen further in the medium term. The price, however, remains below the two moving averages. However, the larger gap between the two moving averages could further increase the probability of DOGE moving higher. The Chaikin Money Flow (CMF)20 indicator is in negative territory and money outflows have increased. The fact that the volume has increased and CMF is at a negative level shows us that sellers are dominant. At the same time, Relative Strength Index (RSI)14 is in oversold territory and has broken down in the uptrend that started on February 6. The $0.33668 level is a very strong resistance point in the uptrend due to political reasons, macroeconomic data and innovations in the DOGE coin. In case of possible pullbacks due to political, macroeconomic reasons or negativities in the ecosystem, the base level of the trend, the $ 0.22632 level, is an important support. If the price reaches these support levels, a potential bullish opportunity may arise if momentum increases.
Supports 0.25025 – 0.22632 – 0.21154
Resistances 0.28164 – 0.30545 – 0.33668
LEGAL NOTICE
The investment information, comments and recommendations contained herein do not constitute investment advice. Investment advisory services are provided individually by authorized institutions taking into account the risk and return preferences of individuals. The comments and recommendations contained herein are of a general nature. These recommendations may not be suitable for your financial situation and risk and return preferences. Therefore, making an investment decision based solely on the information contained herein may not produce results in line with your expectations.

