
Technical Analysis
BTC/USDT
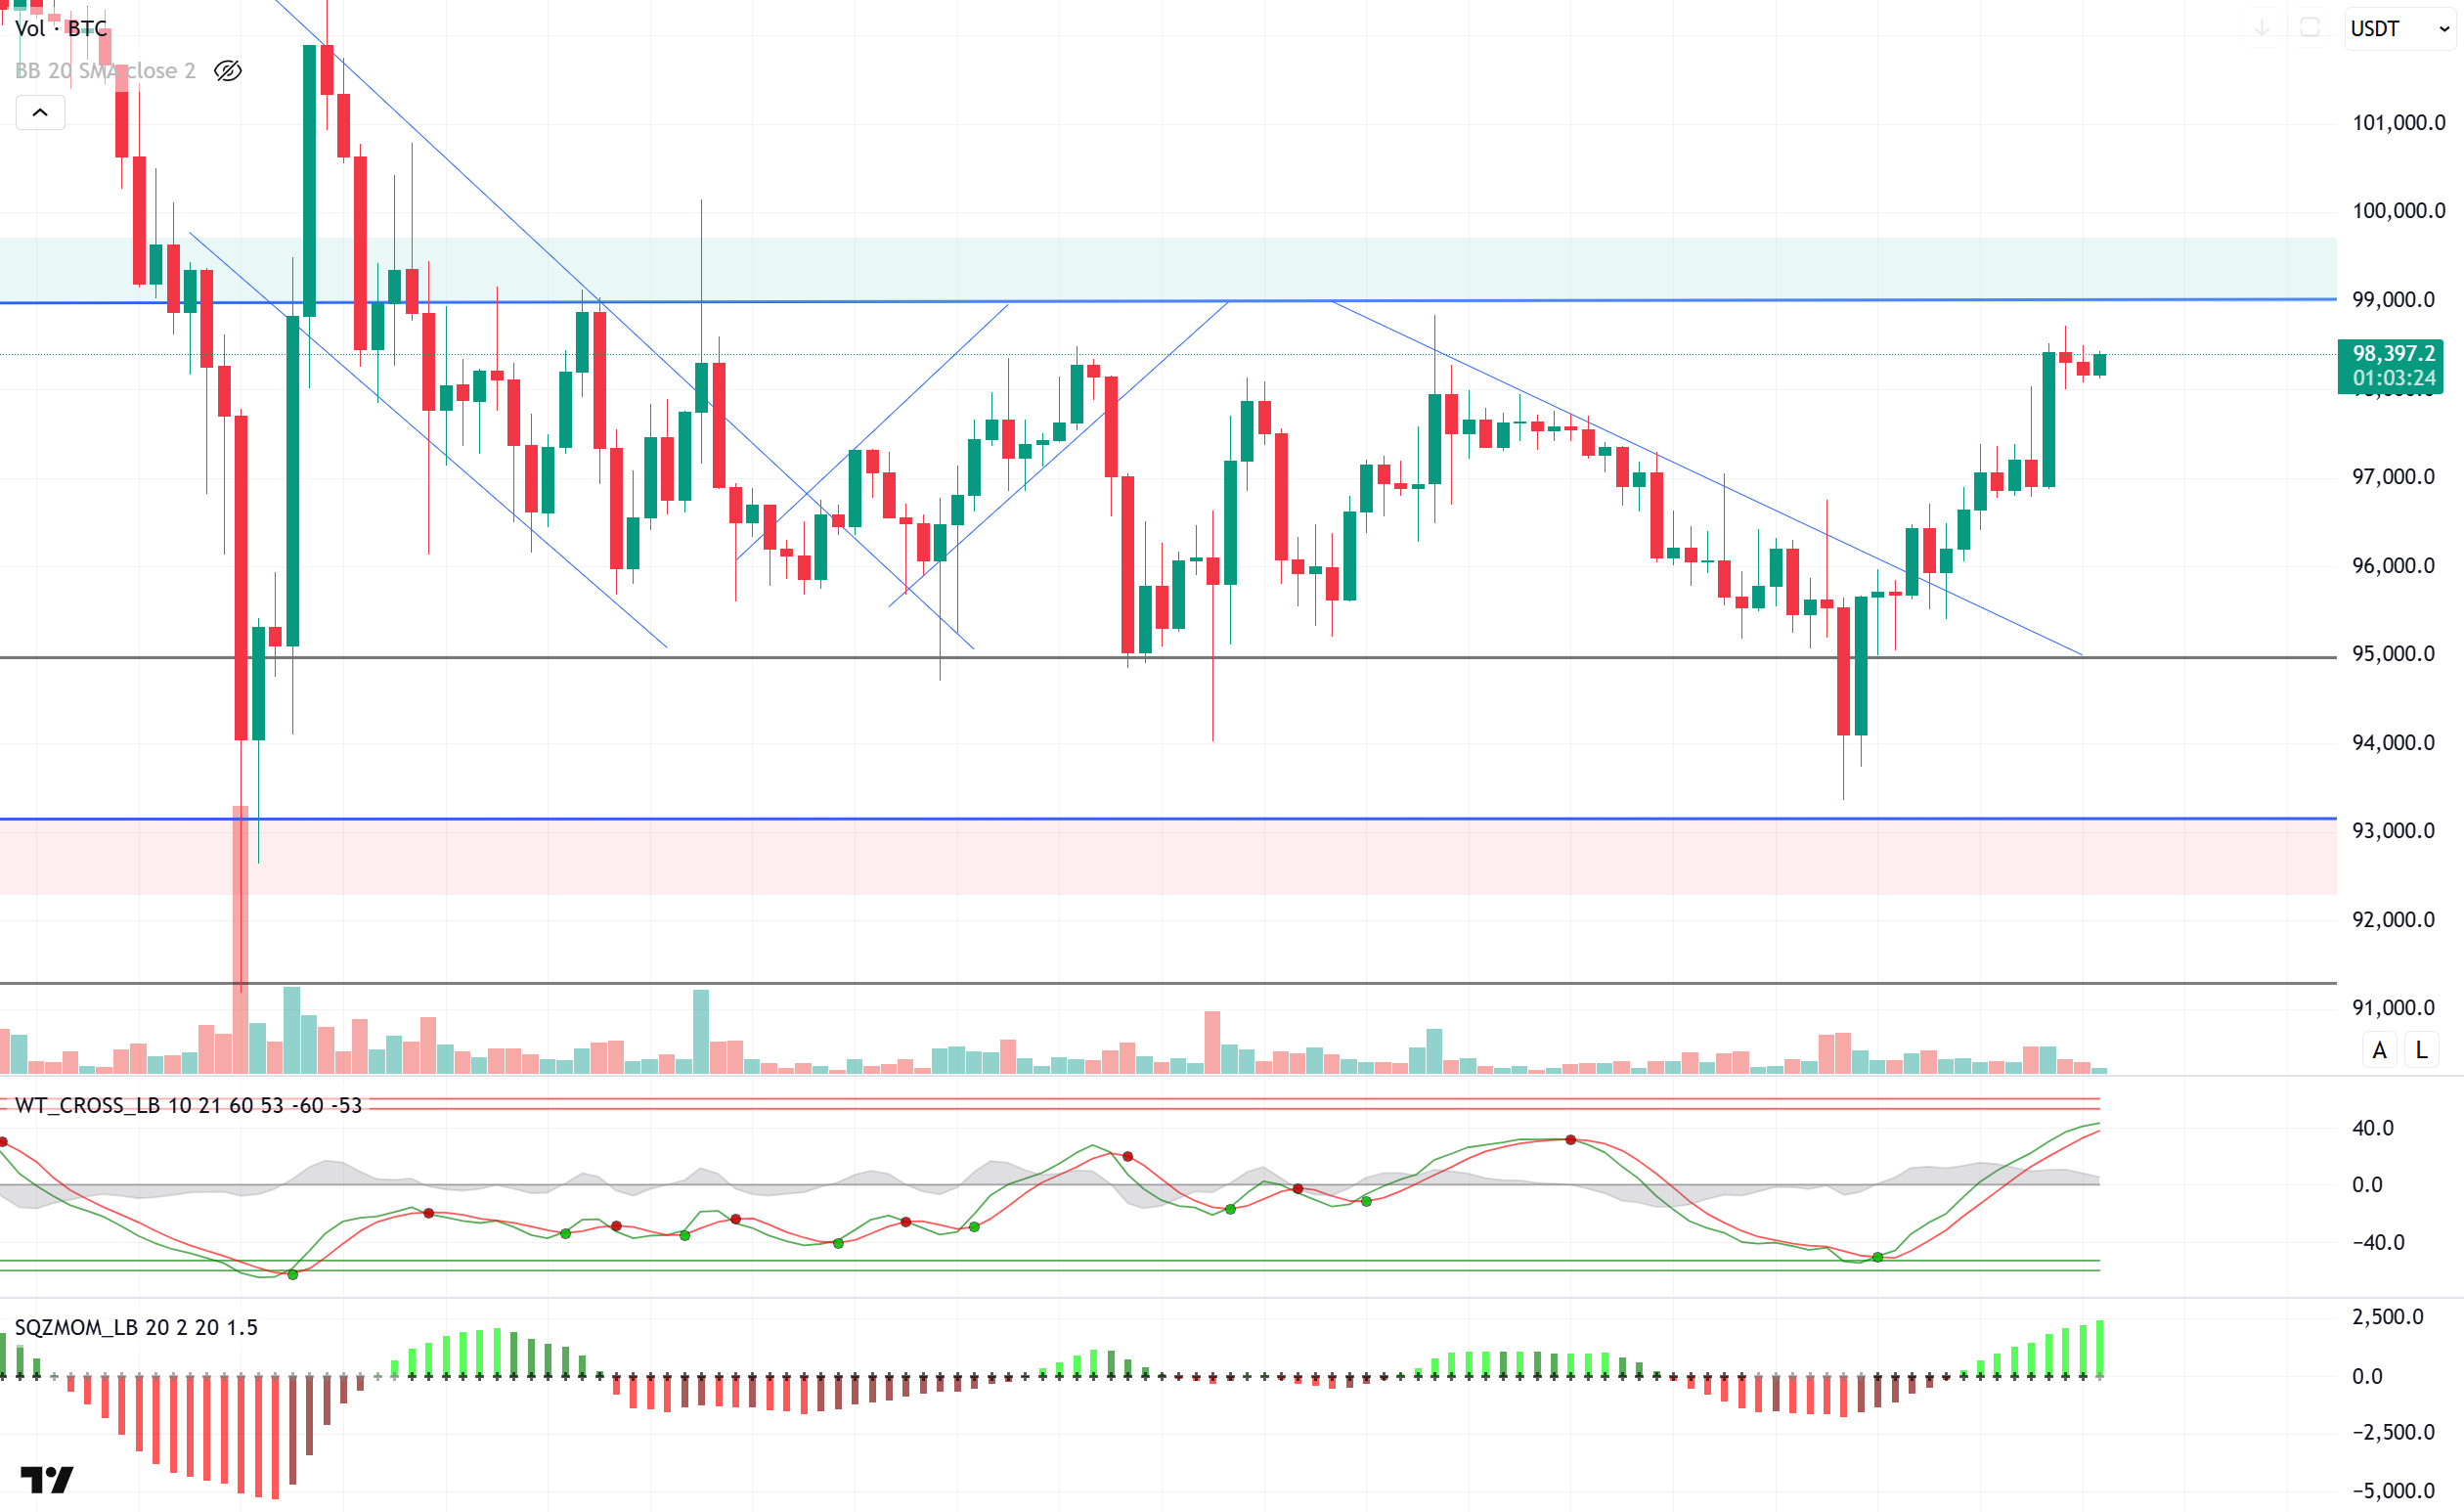
According to Alternative data, the Fear and Greed Index rose sharply today to 55 from 49, with market sentiment moving from neutral to greed territory. This means that the index reached the greed level for the first time since February 3. While this increase in investors’ risk appetite points to potential short-term volatility in the markets, it is not supported by 385M net outflows on the Spot ETF side yesterday, limiting price movements.
Looking at the technical outlook, BTC gained bullish momentum and reached 98,000 levels with a positive change in market sentiment. At the time of writing, BTC is trading at 98,400. At this point, the 99,100 level stands out as a critical psychological and technical threshold. Breaching this level could pave the way for BTC to test six-digit pricing again. The green resistance zone marked on the chart has been rejected 5 times in the last three months but has been successfully breached 3 times. Especially in cases where this level was crossed on strong volume, BTC has been seen to easily overcome the resistance level with a single 4-hour candle. Therefore, supporting the current rise with volume is critical for the persistence of the resistance breakout. When technical oscillators are analyzed, it is seen that they continue to maintain the buy signal despite being in the overbought zone. Momentum indicators remain positive, but the fact that the current rise is not supported by high volume increases the fragility of the trend. Above the 99,000 level, short positions are starting to accumulate. This indicates that the price may face selling pressure as it approaches this region. On the other hand, long positions opened at 96,000 and 97,000 levels could create support zones for BTC on a possible pullback. These levels should be followed as points where the price could regain momentum.
Supports 97,000 – 95,000 – 92,800
Resistances 99,100 -101,400 – 102,800
ETH/USDT
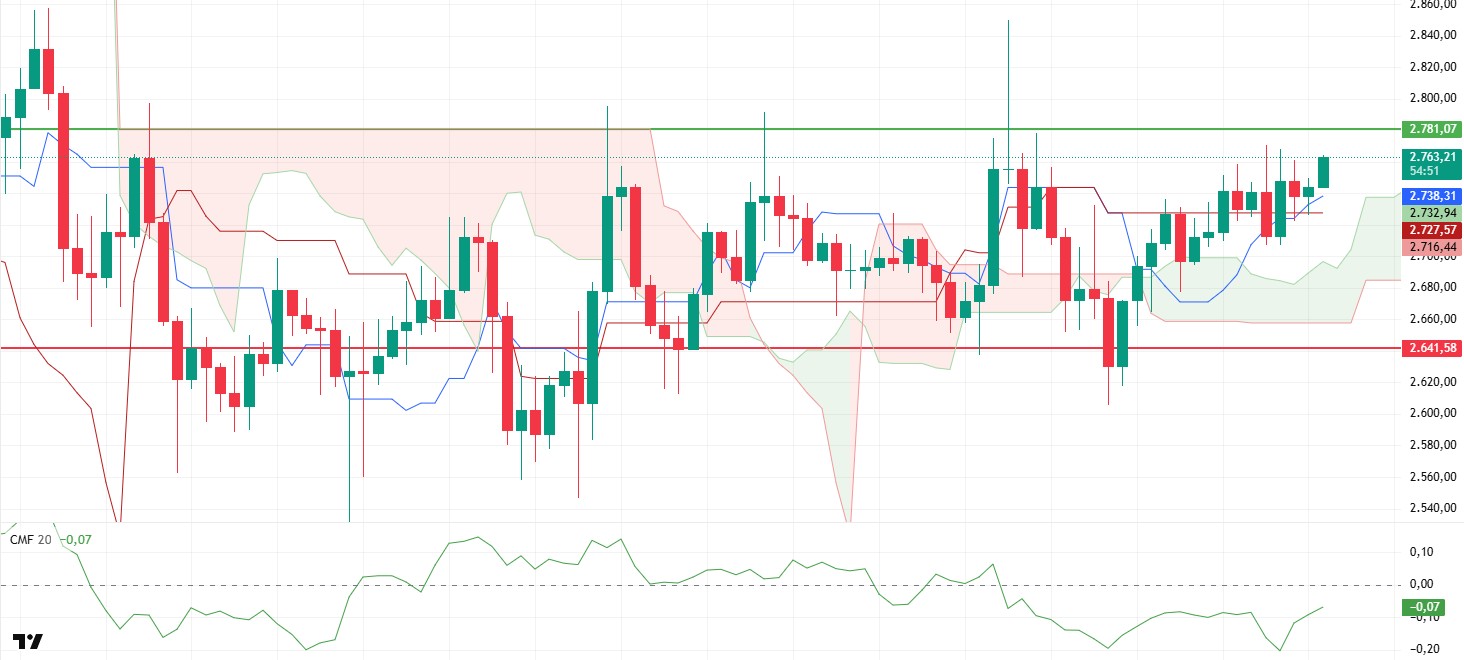
ETH exhibited high volatility yesterday evening, first rising as high as $2,770 and then falling as low as $2,705. With this reaction, the price regained the kijun level of the ichimoku indicator and managed to rise above the $ 2,750 level in the morning hours.
An analysis of the market data reveals that this rise was largely driven by the long positions opened in the futures market. The Cumulative Volume Delta (CVD) data shows that the increase in long trades accompanying the price increase, while the rise in funding rates and the increase in open interest value confirm that this movement is fed by the futures market. However, the spot market has yet to participate strongly in this move. Although the Chaikin Money Flow (CMF) indicator has turned back up, it remains in negative territory. This indicates that there has not been a net inflow of funds into the market yet. However, looking at the ichimoku indicator, the price is above the kijun level and the tenkan level crosses the kijun level upwards, which supports the technical outlook positively.
As a result, if Ichimoku’s positive outlook is accompanied by support from the spot market, the price has the potential to break through the $2,782 level and start an upward trend. However, it will be a decisive factor whether spot support will continue against the selling pressure that may come from this level. A rejection from this level may cause retracements again.
Supports 2,641 – 2,501 – 2,368
Resistances 2,781 – 2,881 – 2,992
XRP/USDT
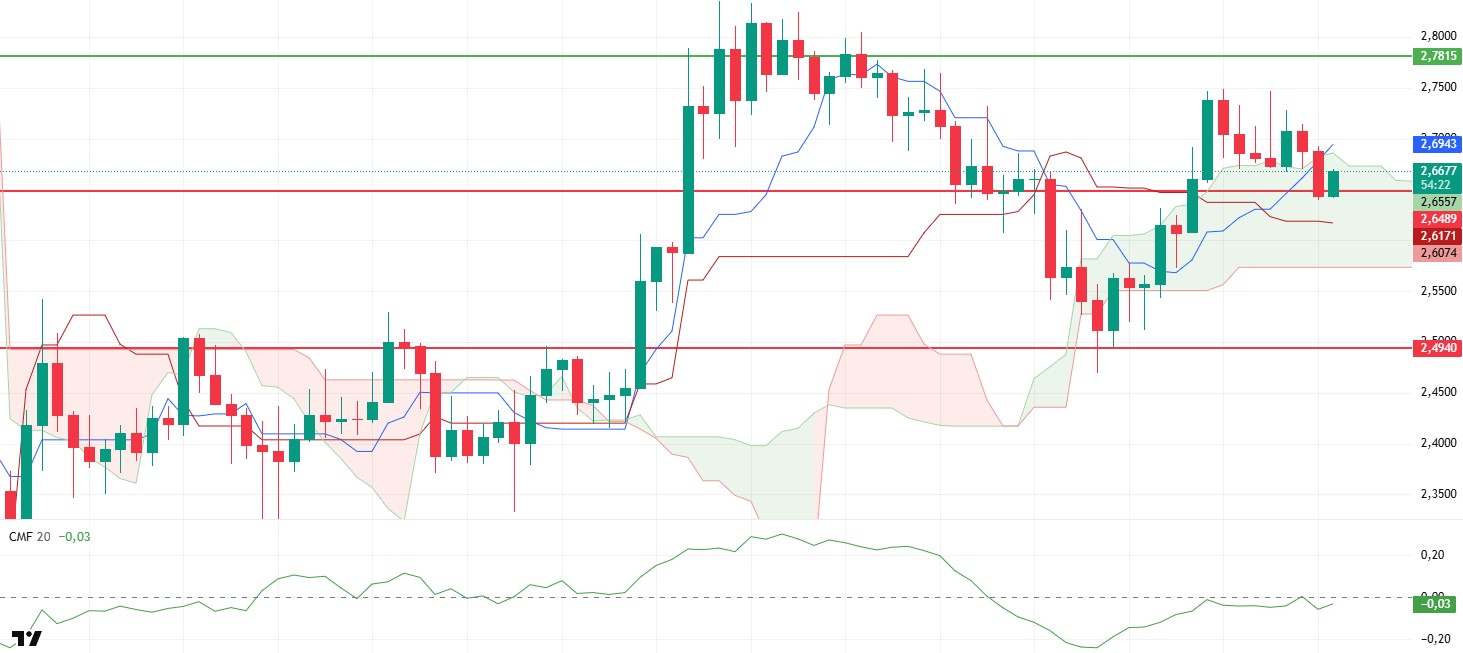
XRP lost the support of the kumo cloud yesterday evening and fell as low as $2.65. As buyers stepped in at this level, the price found support and entered a slight upward trend again. However, when the price movements are analyzed, it is seen that the rise has not yet gained a strong momentum, and it is important to maintain critical levels.
Analyzing the technical indicators, the Chaikin Money Flow (CMF) indicator rejected from the zero line and moved back into negative territory, indicating that selling pressure prevails in this price range. CMF is not attracting enough buyer interest at the moment, suggesting that the price may face difficulties in its upward movement. On the other hand, although the XRP price has returned back into the kumo cloud, the fact that the ichimoku indicator has not yet lost the kijun level can be considered as a positive technical signal. The fact that it remains above the kijun level suggests that the price maintains the potential to gain upside momentum.
As a result, it is critical for XRP to maintain the intermediate support level of $ 2.65 and the kijun level in order to maintain its short-term bullish movement. If these levels are broken down, selling pressure is likely to increase, leading to sharper pullbacks. On the other hand, if the price can hold above these levels, the bullish momentum may strengthen, and higher levels can be targeted with increased buyer interest.
Supports 2.4940 – 2.2502 – 2.0201
Resistances 2.6486 – 2.7815 – 2.9379
SOL/USDT
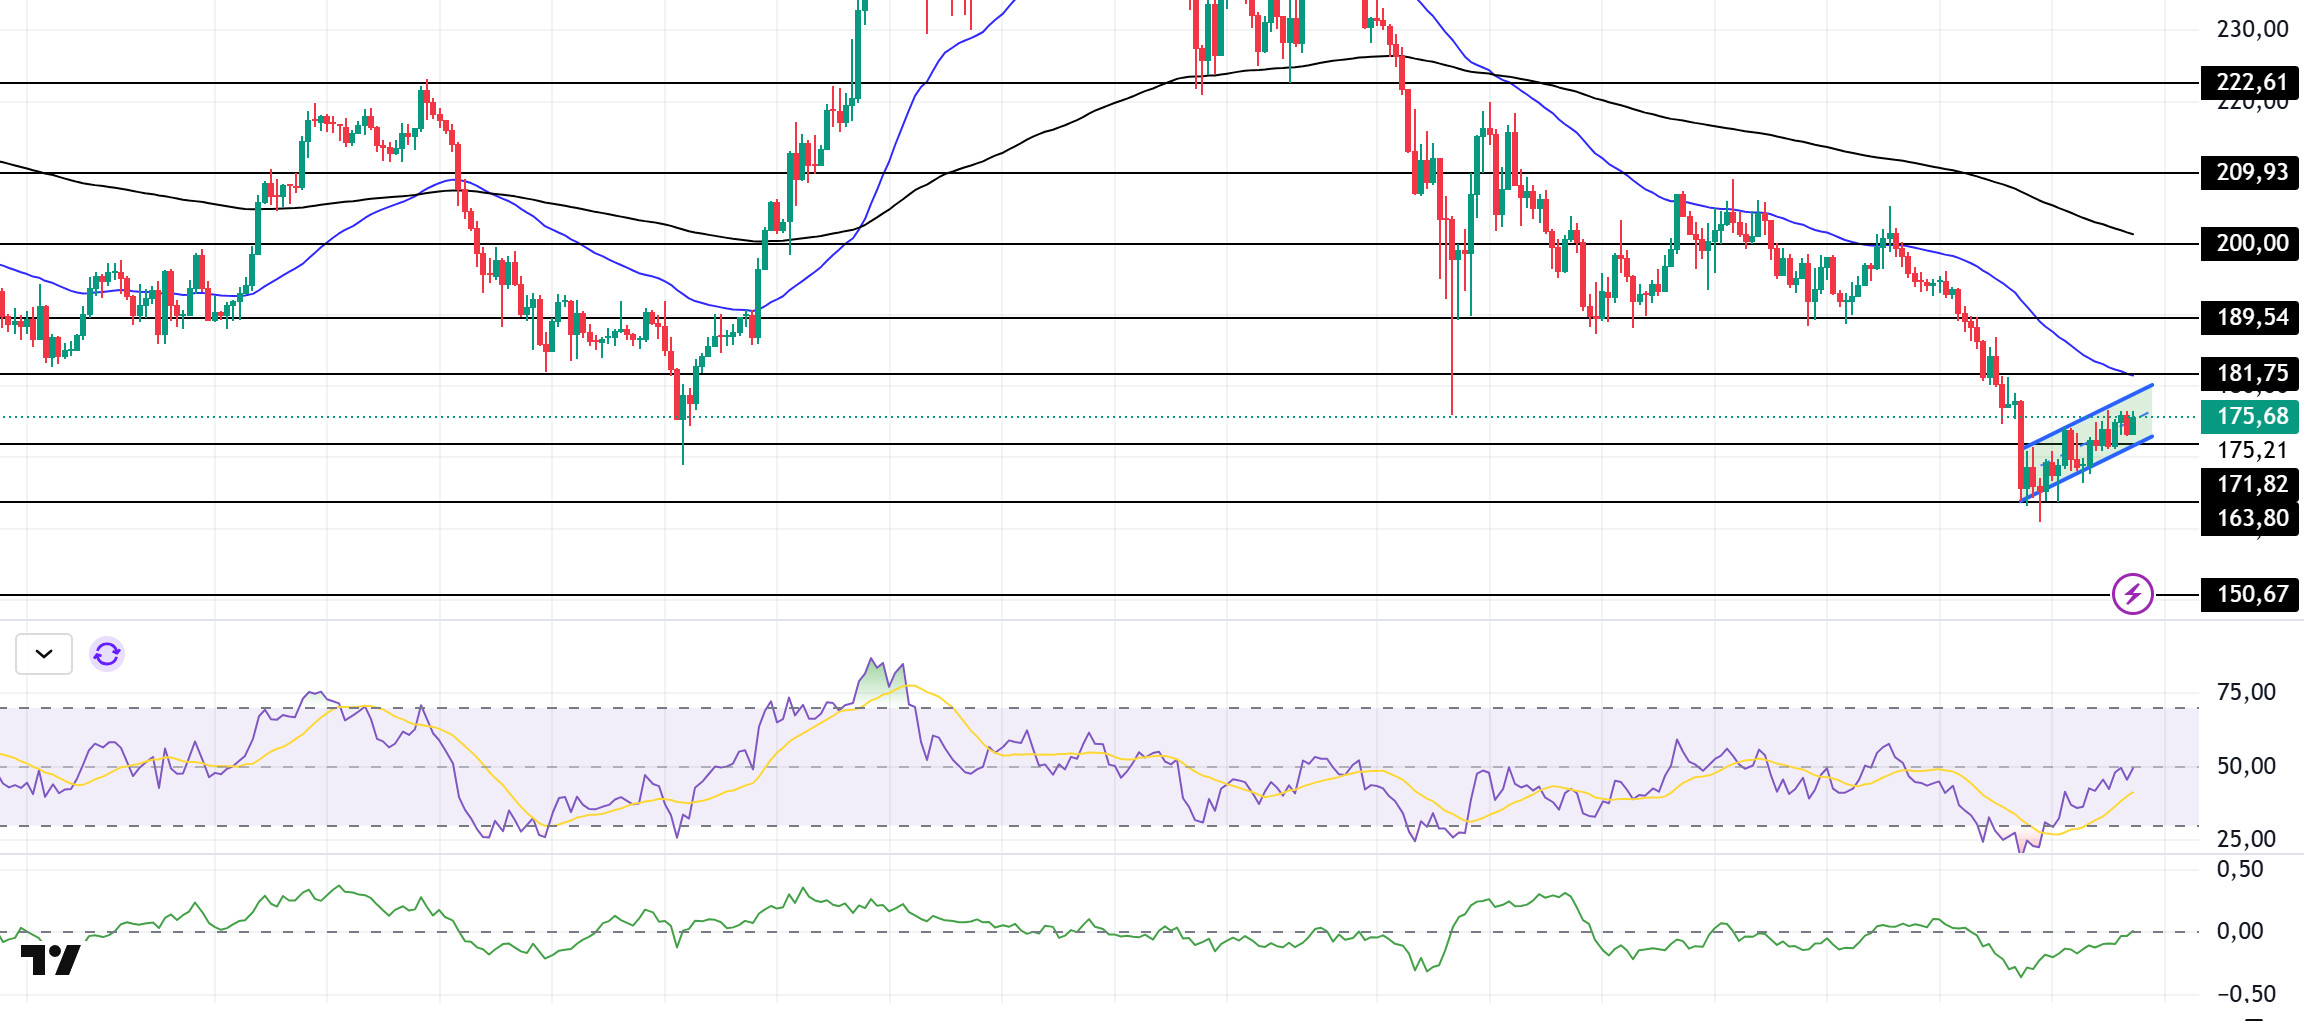
SOL has held its level since our analysis yesterday, continuing to move within the uptrend. On the 4-hour timeframe, the 50 EMA (Blue Line) remains below the 200 EMA (Black Line). This may continue to deepen the decline in the medium term. At the same time, the asset remains below both moving averages. However, the higher level between the two moving averages may move the asset up. When we examine the Chaikin Money Flow (CMF)20 indicator, it is at a neutral level, but the decline in volume may mean that selling pressure is high even though money inflows and outflows are in balance. However, the Relative Strength Index (RSI)14 indicator has risen from oversold territory to neutral. The $ 200.00 level appears to be a very strong resistance point in the rises driven by both the upcoming macroeconomic data and the news in the Solana ecosystem. If it breaks here, the rise may continue. In case of retracements for the opposite reasons or due to profit sales, the support level of $ 163.80 can be triggered again. If the price reaches these support levels, a potential bullish opportunity may arise if momentum increases.
Supports 171.82 – 163.80 – 150.67
Resistances 181.75 – 189.54 – 200.00
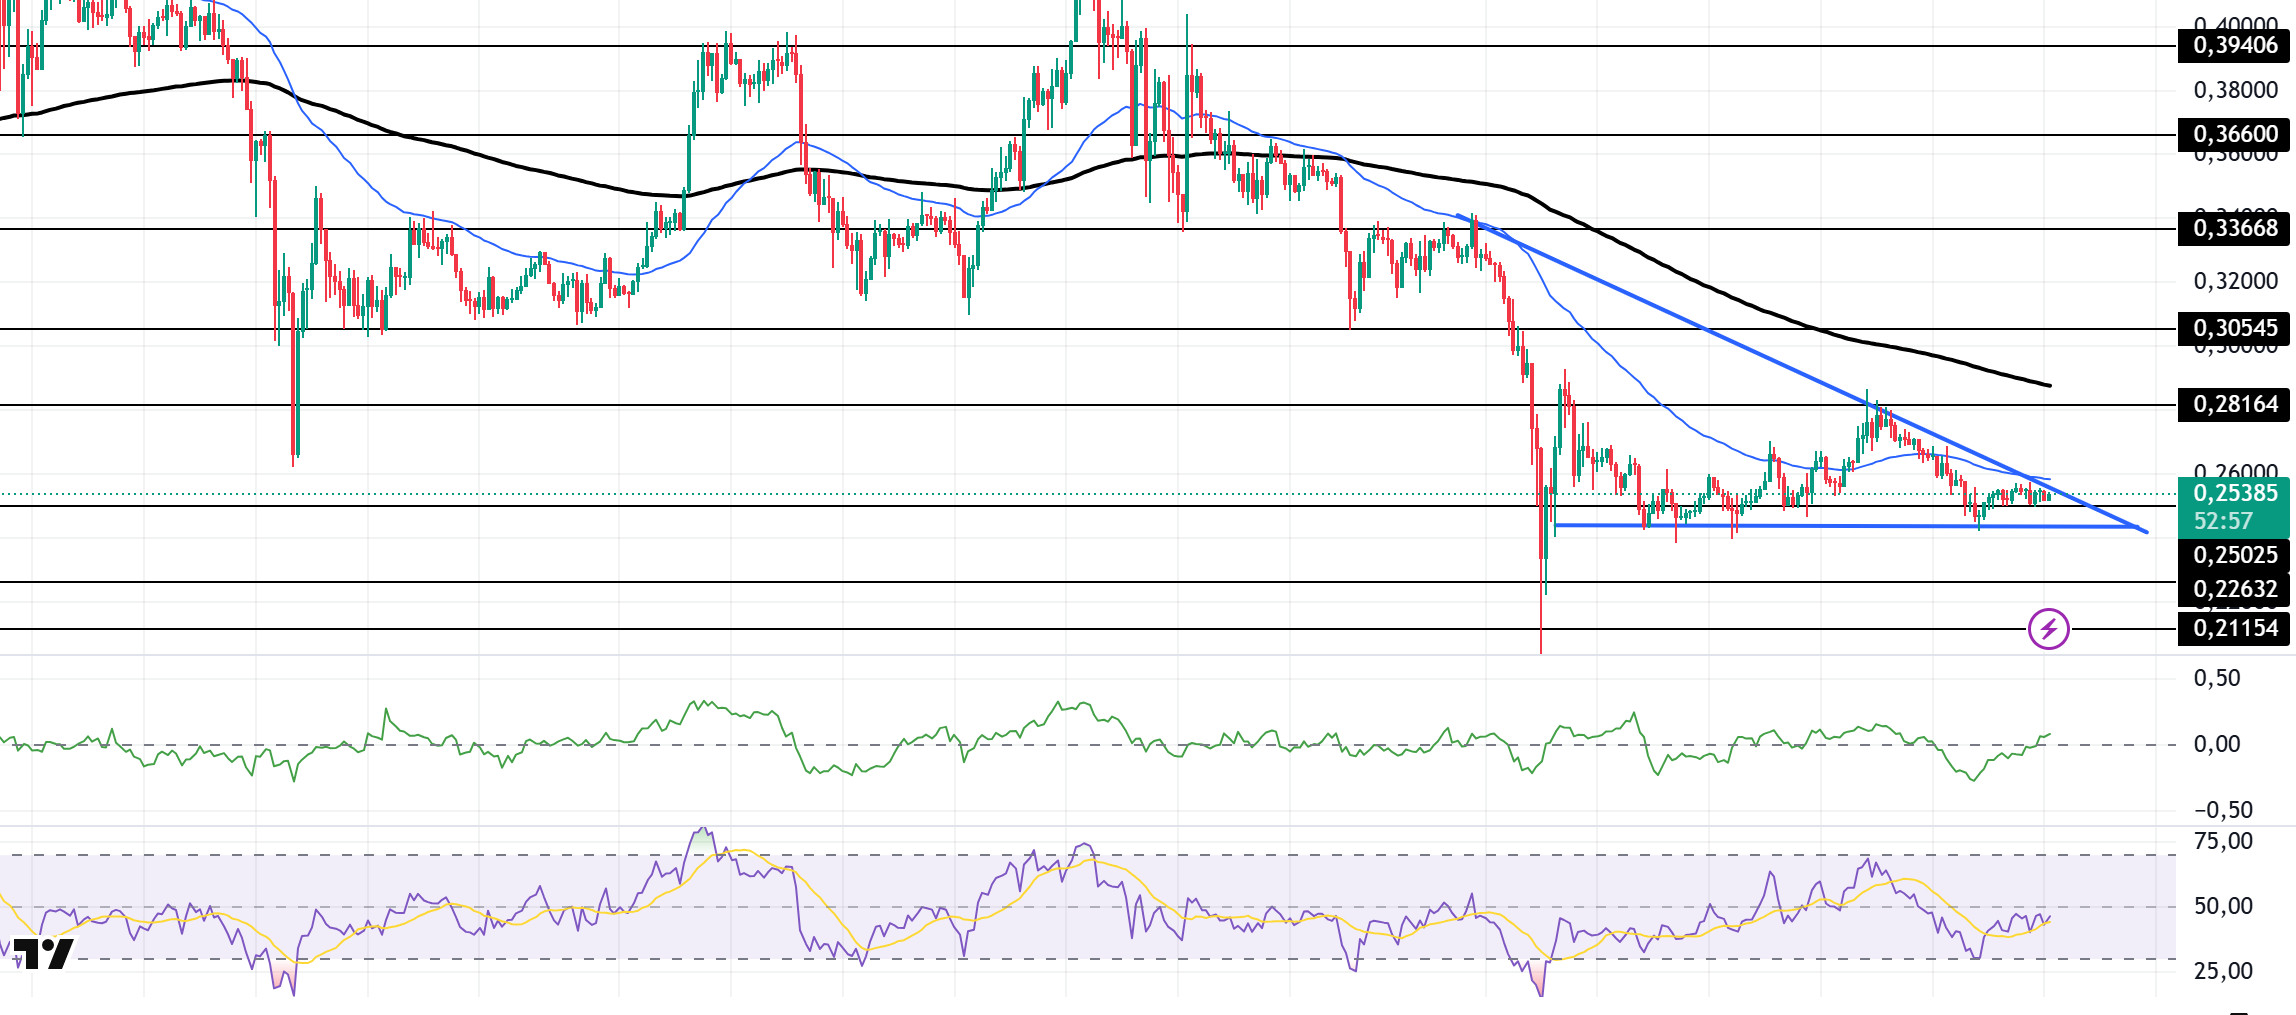
DOGE/USDT
DOGE continues to exhibit sideways movement and is set to test the 50 EMA (Blue Line) as a resistance. At the same time, the asset continued to remain below the 50 EMA (Blue Line) 200 EMA (Black Line) on the 4-hour timeframe. This could mean that the decline could deepen further in the medium term. The price, however, remains below the two moving averages. However, the larger gap between the two moving averages could further increase the probability of DOGE moving higher. The Chaikin Money Flow (CMF)20 indicator is in the positive zone near the neutral level. This means that money inflows are increasing, but the increase in volume shows us that the rise may be strong. At the same time, Relative Strength Index (RSI)14 is in the negative zone near the neutral level. The falling triangle pattern should be followed. If it breaks down, the decline may deepen. The level of 0.33668 dollars appears as a very strong resistance place in the rises due to political reasons, macroeconomic data and innovations in the DOGE coin. In case of possible retracements due to political, macroeconomic reasons or negativities in the ecosystem, the base level of the trend, the $ 0.22632 level, is an important support. If the price reaches these support levels, a potential bullish opportunity may arise if momentum increases.
Supports 0.25025 – 0.22632 – 0.21154
Resistances 0.28164 – 0.30545 – 0.33668
LEGAL NOTICE
The investment information, comments and recommendations contained herein do not constitute investment advice. Investment advisory services are provided individually by authorized institutions taking into account the risk and return preferences of individuals. The comments and recommendations contained herein are of a general nature. These recommendations may not be suitable for your financial situation and risk and return preferences. Therefore, making an investment decision based solely on the information contained herein may not produce results in line with your expectations.

