
TECHNICAL ANALYSIS
BTC/USDT
All eyes in the markets turned to the Fed interest rate decision today. While interest rates are expected to remain unchanged, investors are closely watching for signals about possible future rate cuts due to slowing growth. JPMorgan attributed the decline in crypto markets to macroeconomic risks and uncertainty in stocks, while investors are carefully watching the impact of the Fed’s statements on the markets.
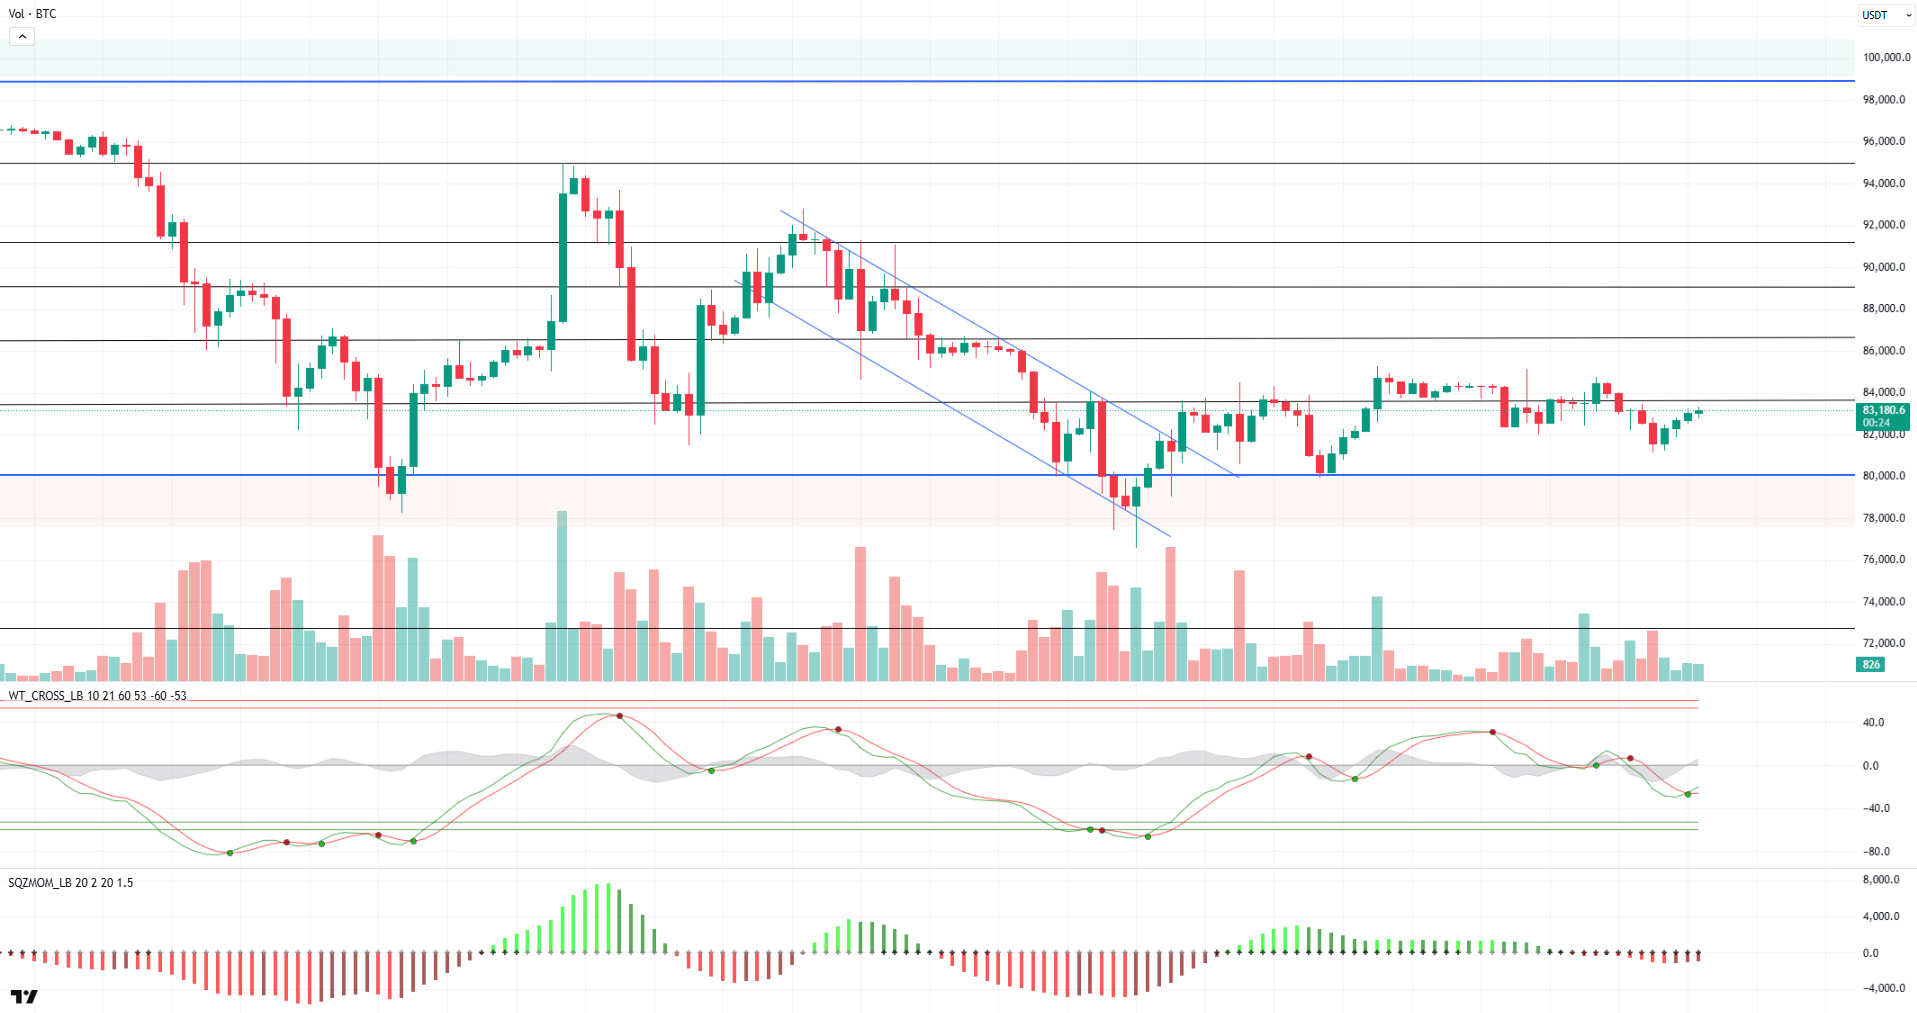
When we look at the technical outlook of BTC, it is seen that the price action, which declined yesterday with a sell signal, has turned its direction up again today and continues to display an indecisive image. In BTC, which is currently trading at 83,300, the Wave Trend Oscillator is giving a buy signal again, while the momentum indicator has remained weak for a long time. Periodically, when technical indicators are analyzed, it is seen that a buy signal is formed on the hourly and 4-hour charts, while a sell signal is maintained on the daily chart. On the liquidation heat map, long trades are concentrated above the 80,000 level, while short accumulation is noticeable above the 85,000 level. This indicates that if the price breaks out, sharp movements may occur. If the upward movement continues, 83,500 stands out as the resistance level. Exceeding this level may increase the upward momentum and pave the way for the price to move towards 85,000 levels. In a possible selling wave, the 80,000 level remains a critical reference point.
Supports 82,400 – 80,000 – 78,000
Resistances 83,500 – 86,500 – 89,000
ETH/USDT
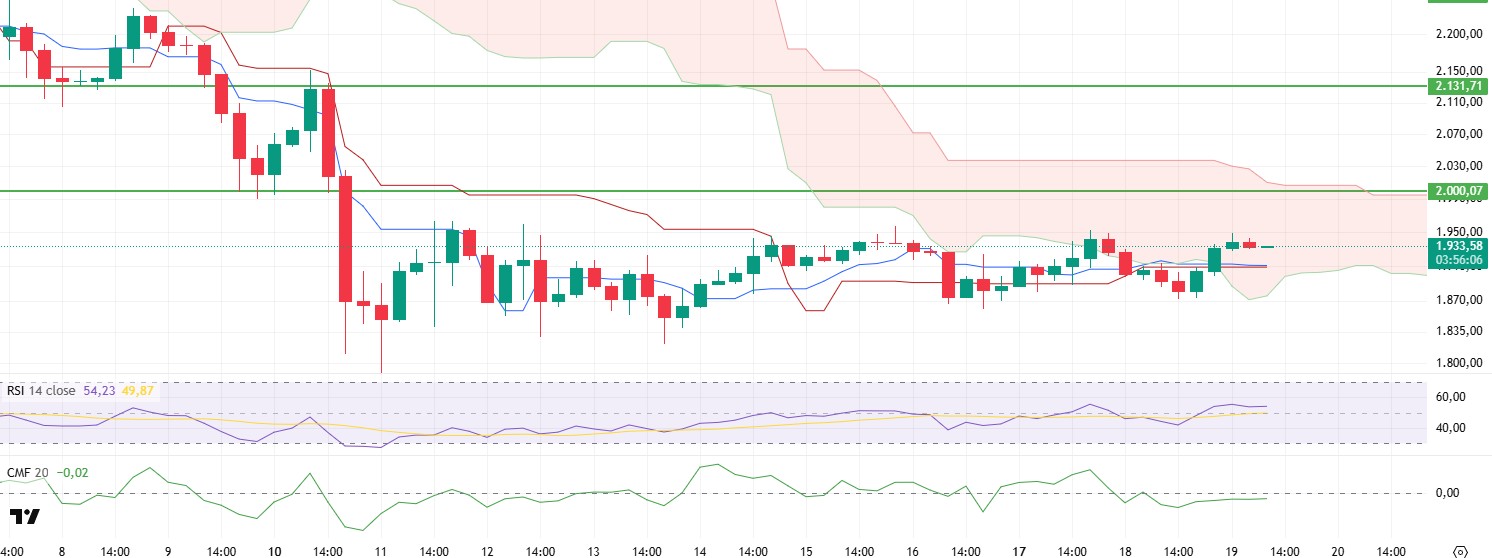
After retreating as low as $1,870 yesterday evening, ETH rebounded from this area and managed to rise above $1,930. While the price action remained sideways in the accumulation area, some technical indicators showed improvements.
Especially on the Ichimoku indicator, the price entering the Kumo cloud boundaries and rising above the tenkan and kijun levels can be considered as a positive signal. It also indicates that the market may gain a stronger bullish momentum. However, the Chaikin Money Flow (CMF) indicator remained flat in line with the price action and the Cumulative Volume Delta (CVD) indicator showed that spot buying remained weak compared to futures, suggesting that the uptrend lacks strong spot support. Momentum and Relative Strength Index (RSI) indicators, on the other hand, are correlated with price action and do not signal any positive or negative divergence. This suggests that the current price action is technically balanced.
In general terms, it seems possible that a rise towards the $2,000 level may be possible during the day in line with the positive signals received from the Ichimoku indicator. However, weak spot demand stands out as a factor that makes it difficult to break this level. If the $2,000 level can be exceeded with strong volume support, the price is likely to enter a more aggressive upward movement.
Supports 1,755 – 1,665 – 1,539
Resistances 2,000 – 2,131 – 2,254
XRP/USDT
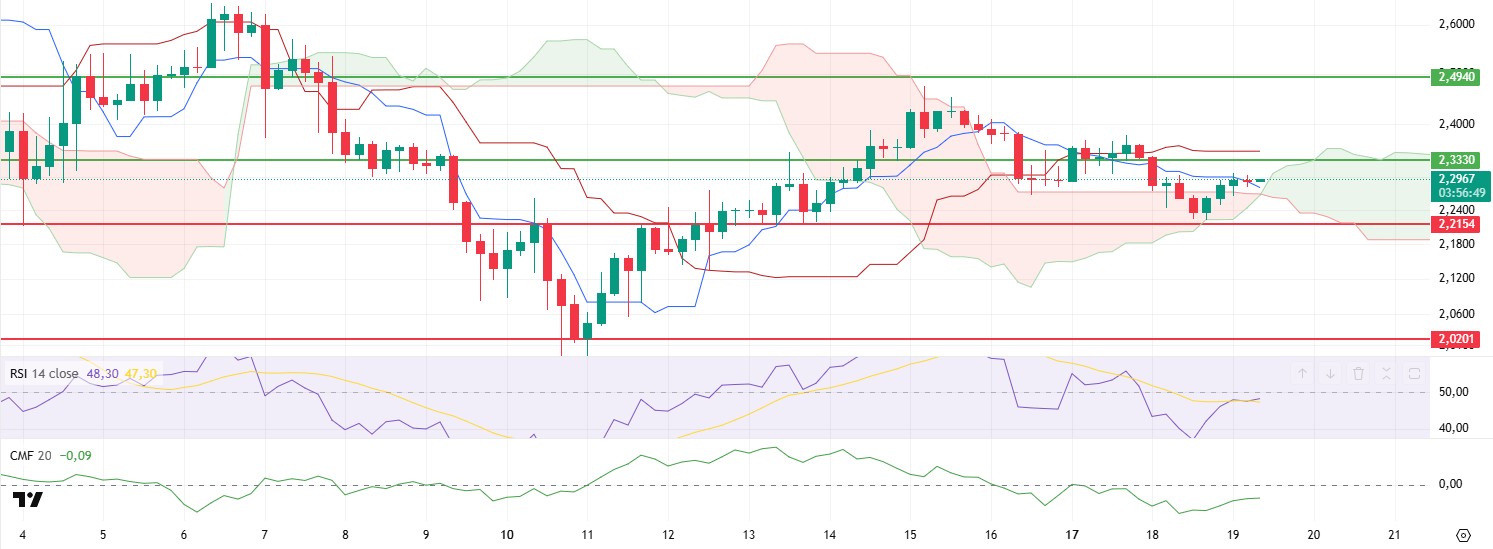
XRP managed to rise up to the tenkan level by getting support from this region as expected after falling to $ 2.21 levels yesterday. With this move, $ 2.33 remains important resistance for XRP, which managed to cross above the kumo cloud boundaries.
Although the Ichimoku indicator rose up to the tenkan level on the cloud, the tenkan level remained below the kijun level, indicating that the negative outlook continues. The Chaikin Money Flow (CMF) indicator, on the other hand, moved upwards below the zero line, indicating that the selling pressure is decreasing. The Relative Strength Index (RSI) indicator continues to rise in tandem with the price action and has managed to cross the based MA line.
As a result, a rise to the $2.33 level is likely to be seen during the day, provided that the price does not violate the kumo cloud. The break of this level may ensure the continuation of the rise. However, a rejection from this region may cause a retracement to $ 2.21 levels.
Supports 2.3330 – 2.2154 – 2.0201
Resistances 2.4940 – 2.8280 – 3.2125
SOL/USDT
SOL ETF approval rates rose to 87% following the debut of the CME SOL Futures. According to Mathew Sigel, head of digital assets research at VanEck, this is ‘one step closer’ to a US spot ETF green light.
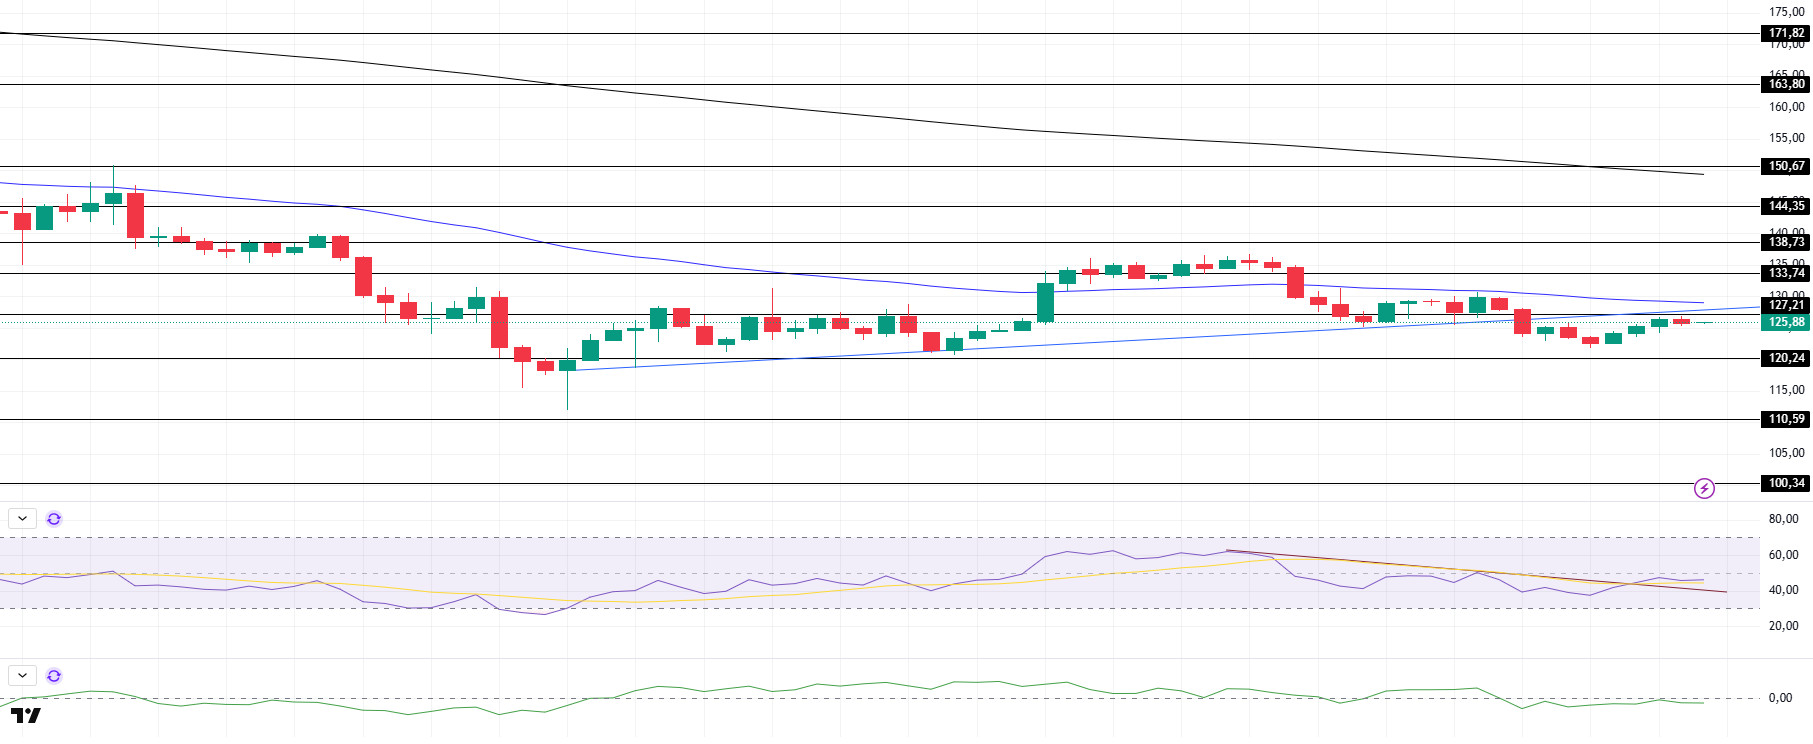
SOL has been slightly bullish since our analysis yesterday. The price is currently preparing to test the 50 EMA (Blue Line) and the bullish channel that started on March 11 as resistance. On the 4-hour timeframe, the 50 EMA (Blue Line) remained below the 200 EMA (Black Line). This could deepen the decline further in the medium term. At the same time, the price is moving below the two moving averages. However, a large gap between the two moving averages may cause the asset to rise. When we examine the Chaikin Money Flow (CMF)20 indicator, it remained in the neutral zone. However, the low 24-hour volume may reduce money inflows and cause the asset to move into the negative zone. However, the Relative Strength Index (RSI)14 indicator is in negative territory but broke the downtrend that started on March 15 upwards. This may cause the asset to rise. The $ 133.74 level stands out as a very strong resistance point in the rises driven by both the upcoming macroeconomic data and the news in the Solana ecosystem. If it breaks here, the rise may continue. In case of pullbacks due to the opposite reasons or profit sales, the support level of 120.24 dollars can be triggered. If the price comes to these support levels, a potential bullish opportunity may arise if momentum increases.
Supports 120.24 – 110.59 – 100.34
Resistances 127.21 – 133.74 – 138.73
DOGE/USDT
Santiment’s on-chain data reveals that wallets with a balance of at least 1 million DOGE have increased by 1.24% since the beginning of February. While the coin’s trading volume fell by 61% in the past week, the coin’s circulating supply increased by 0.86%. This brings its circulating supply to 148.47 billion.
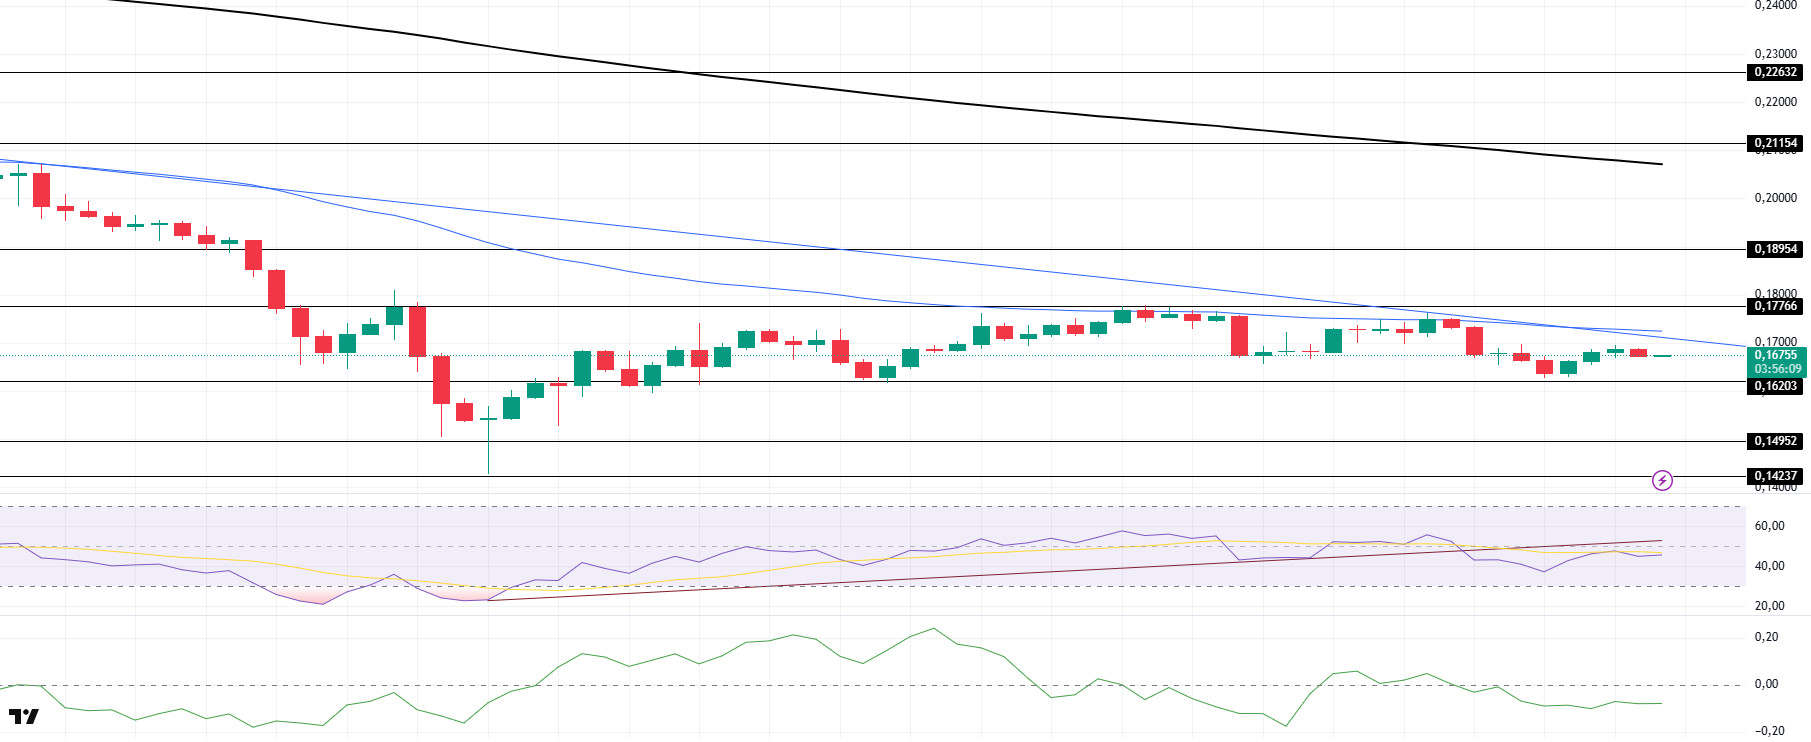
DOGE has been slightly bullish since our analysis yesterday. The asset tested the downtrend that has been in place since March 6 but failed to break it, accelerating the downward movement. At the same time, it encountered resistance at the 50 EMA (Blue Line) here and retreated. On the 4-hour timeframe, the 50 EMA (Blue Line) is below the 200 EMA (Black Line). This could mean that the decline could deepen in the medium term. However, the price is pricing below two moving averages. The larger gap between the two moving averages increases the probability that DOGE will rise. When we analyze the Chaikin Money Flow (CMF)20 indicator, it is in the negative zone. In addition, the negative 24-hour volume may reduce money inflows and cause CMF to fall further. On the other hand, Relative Strength Index (RSI)14 continued to be in negative territory. However, it failed to stay above the uptrend on March 11 and broke the trend downwards. The $0.18954 level stands out as a very strong resistance point in the uptrend due to political reasons, macroeconomic data and innovations in the DOGE coin. In case of possible pullbacks due to political, macroeconomic reasons or negativities in the ecosystem, the $0.14952 level, which is the base level of the trend, is an important support. If the price reaches these support levels, a potential bullish opportunity may arise if momentum increases.
Supports 0.16203 – 0.14952 – 0.14237
Resistances 0.17766 – 0.18954 – 0.21154
LEGAL NOTICE
The investment information, comments and recommendations contained herein do not constitute investment advice. Investment advisory services are provided individually by authorized institutions taking into account the risk and return preferences of individuals. The comments and recommendations contained herein are of a general nature. These recommendations may not be suitable for your financial situation and risk and return preferences. Therefore, making an investment decision based solely on the information contained herein may not produce results in line with your expectations.

