
BTC/USDT
Last week, the most notable headline in global markets was once again the geopolitical tension in the Middle East. Following U.S. and Israeli operations against Iran, supply concerns resurfaced in energy markets. Security issues around the Strait of Hormuz and the near-complete halt in tanker traffic caused volatility in the oil market. Although there were brief pullbacks in oil prices at the start of the week, the overall trend remained upward. Brent crude rose by 1% to $104.13, while West Texas Intermediate (WTI) crude rose by 0.6% to $97.42. U.S. President Donald Trump’s call on certain countries, particularly China, to resume shipping traffic through the Strait of Hormuz created a brief sense of relief in the market; however, increased military activity in the region kept risk perceptions high.
This rise in energy prices continues to put pressure on the global economic outlook. The fact that the Strait of Hormuz is a critical trade route through which approximately one-fifth of the world’s oil supply passes indicates that any developments in the region could directly impact energy prices. While this situation fostered a cautious atmosphere in global markets, limited gains were observed in European stock markets. The Stoxx 600, DAX, and CAC 40 indices rose by approximately 0.1%, while the UK FTSE 100 index gained 0.4%. As rising energy prices and ongoing geopolitical risks created a volatile landscape in risk-sensitive asset markets, increased volatility was also observed in the crypto market.
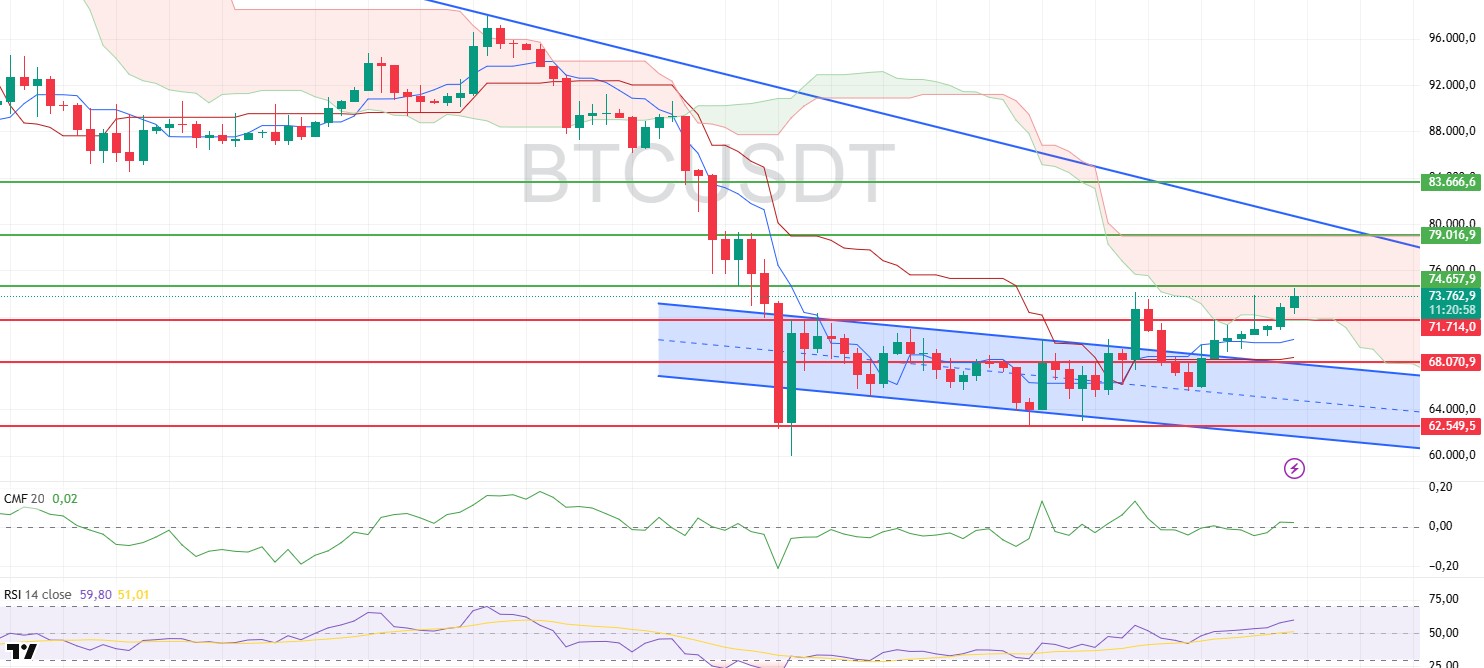
Bitcoin’s price had a technically very strong week. At the start of the week, the price found support at the middle band of the descending channel marked in blue on the chart; with buying pressure from this level, it rose continuously for eight days, climbing all the way to the strong resistance zone at $74,650. As selling pressure kicked in at this level, the price experienced a limited pullback, retreating to around $73,200. The fact that the price achieved such a strong rally in such a short time indicates that buyers remain active in the market, while also revealing that supply remains strong at the resistance zone.
The Chaikin Money Flow (CMF) indicator, however, is not keeping pace with the price movement to the same extent. The indicator is moving sideways around the zero line, indicating that no significant capital inflow occurred during the rally. The lack of liquidity flow accompanying the price movement stands out as a technical signal warranting attention. This structure suggests that the rally was driven primarily by price momentum and that no strong capital support has formed.
The Relative Strength Index (RSI) indicator, however, presents a more positive picture. The indicator continued its upward trend without forming any negative divergence and rose to approximately the 60 level. This movement in the RSI signals that momentum in the market is strengthening and indicates that buyers’ influence on prices is increasing. This strengthening of momentum suggests that upward attempts may continue in the short term.
Upon examining the Ichimoku indicator, a noticeable improvement in the technical outlook is evident. The price breaking above the Kumo and Tenkan levels and then entering the Kumo cloud stands out as a significant technical development. Additionally, the Tenkan line crossing above the Kijun line can be interpreted as a bullish signal. This structure indicates that the short-term technical outlook is beginning to strengthen and that the market’s potential for renewed upward attempts is increasing.
In the overall assessment, the resistance zone at the $74,650 level stands out as the most critical threshold in the short term. If the price breaks above this level, the upward movement could gain momentum, and the $79,000 level could come into focus as the next target. Conversely, the weak appearance of the CMF indicator—suggesting the rally is not backed by strong capital support—does not entirely rule out the risk of a potential pullback. In such a scenario, the likelihood of the price retreating back toward the $68,000 level emerges as a significant risk that the market should monitor closely.
Supports: 71,700 – 68,070 – 62,500
Resistances: 74,657 – 79,016 – 83,666
ETH/USDT
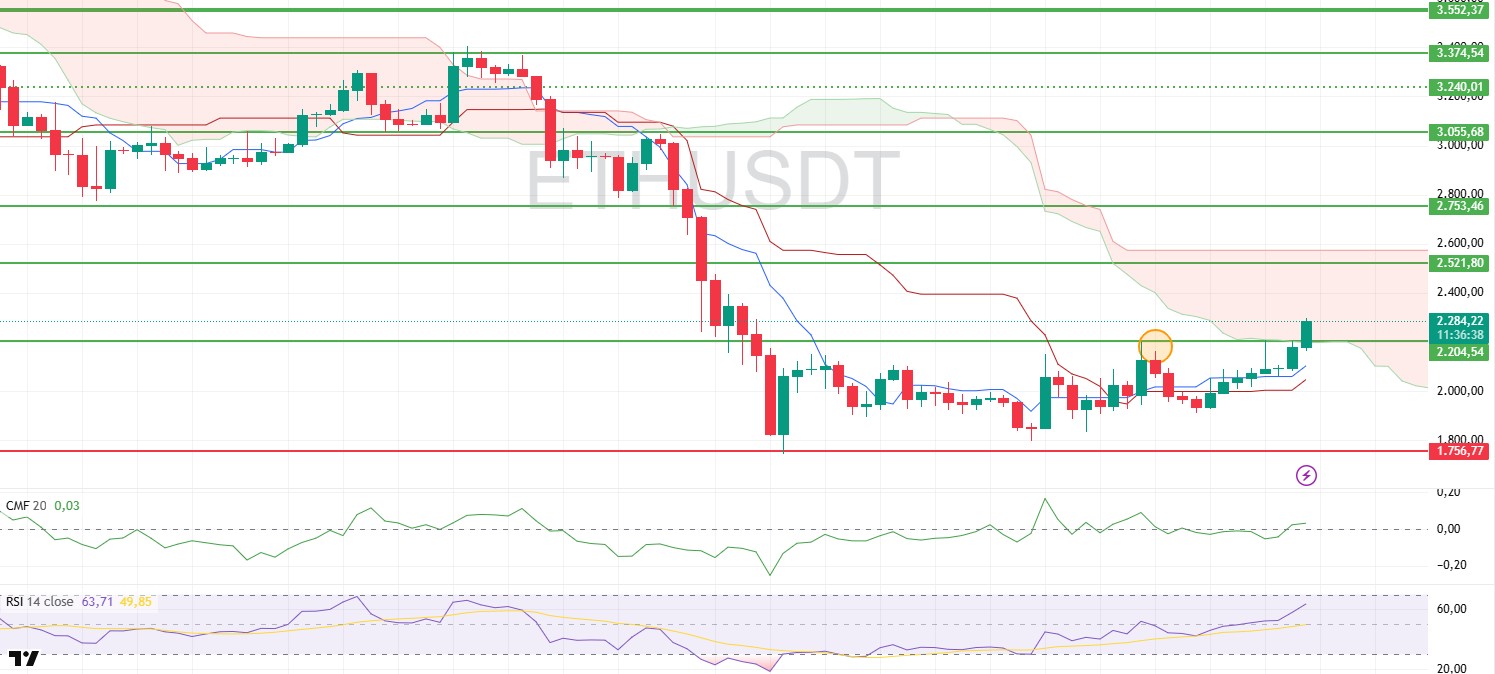
Last week, the Ethereum price demonstrated a strong recovery. Starting the week at the $1,910 level, the price gained upward momentum throughout the week amid increasing buying activity. With the rise accelerating particularly from mid-week, the price climbed to the $2,210 level by Friday, corresponding to the lower band of the Ichimoku cloud. Buying activity over the weekend pushed the price above this level, and ETH managed to rise to $2,293.
One of the notable developments on the fundamental side was a new proposal aimed at making Ethereum’s infrastructure more accessible. Vitalik Buterin, one of Ethereum’s co-founders, shared a proposal aimed at simplifying node setup by consolidating the backend software managing the Beacon Chain and the execution layer under a single unified structure. Currently, validators must install and synchronize two separate software components. Because this process is technically complex, it makes it difficult for individual users to run their own nodes and often directs many users toward third-party service providers. If the proposed structure is implemented, the validator setup process could become simpler, potentially allowing the network to be operated by a broader user base.
The total amount of ETH locked in the Ethereum network continued to rise this week, reaching approximately 38 million. This increase in staked amounts indicates that investors’ long-term confidence remains strong and that a significant portion of the circulating supply remains locked. This structure also stands out as one of the factors contributing to the limited supply-side pressure on the market.
Upon examining technical indicators, it is observed that while the Chaikin Money Flow (CMF) indicator has accompanied the price rise, it has not demonstrated a strong performance. Although the indicator has moved into positive territory, it shows only a very limited rise. This picture reveals that while liquidity entering the market has increased, this increase has not yet translated into a strong capital inflow. Therefore, even if the upward movement continues, the limited nature of capital inflows stands out as a factor requiring attention.
The Relative Strength Index (RSI) indicator, however, presents a stronger picture. The indicator has continued its upward trend without producing any negative divergence, reaching the 64 level. This movement in the RSI signals that market momentum is strengthening and indicates that buyers’ influence on prices is beginning to increase. This strengthening of momentum creates a structure that supports the potential for upward movements to continue in the short term.
On the Ichimoku indicator front, a noticeable improvement in the technical outlook is worth noting. The price breaking above the lower band of the Kumo cloud and the Tenkan line before entering the cloud can be considered a significant development in terms of the trend. Additionally, the Tenkan line crossing above the Kijun line is considered one of the bullish signals from a technical perspective. This structure indicates that the market is beginning to move away from a weak outlook and that buyers are gaining more control over the price.
In the overall assessment, the $2,204 level—corresponding to the lower band of the Ichimoku cloud—stands out as the most critical short-term support level. If the price continues to hold above this level, the upward movement is likely to persist, with the next target potentially being the $2,521 level. Conversely, a break below the $2,204 level could cause the technical outlook to weaken rapidly and lead to a significant increase in selling pressure. Therefore, the $2,204 level is being closely monitored as the most critical threshold for the short-term market direction.
Supports: 2,204 – 1,756 – 1,384
Resistances: 2,521 – 2,753 – 3,055
XRP/USDT
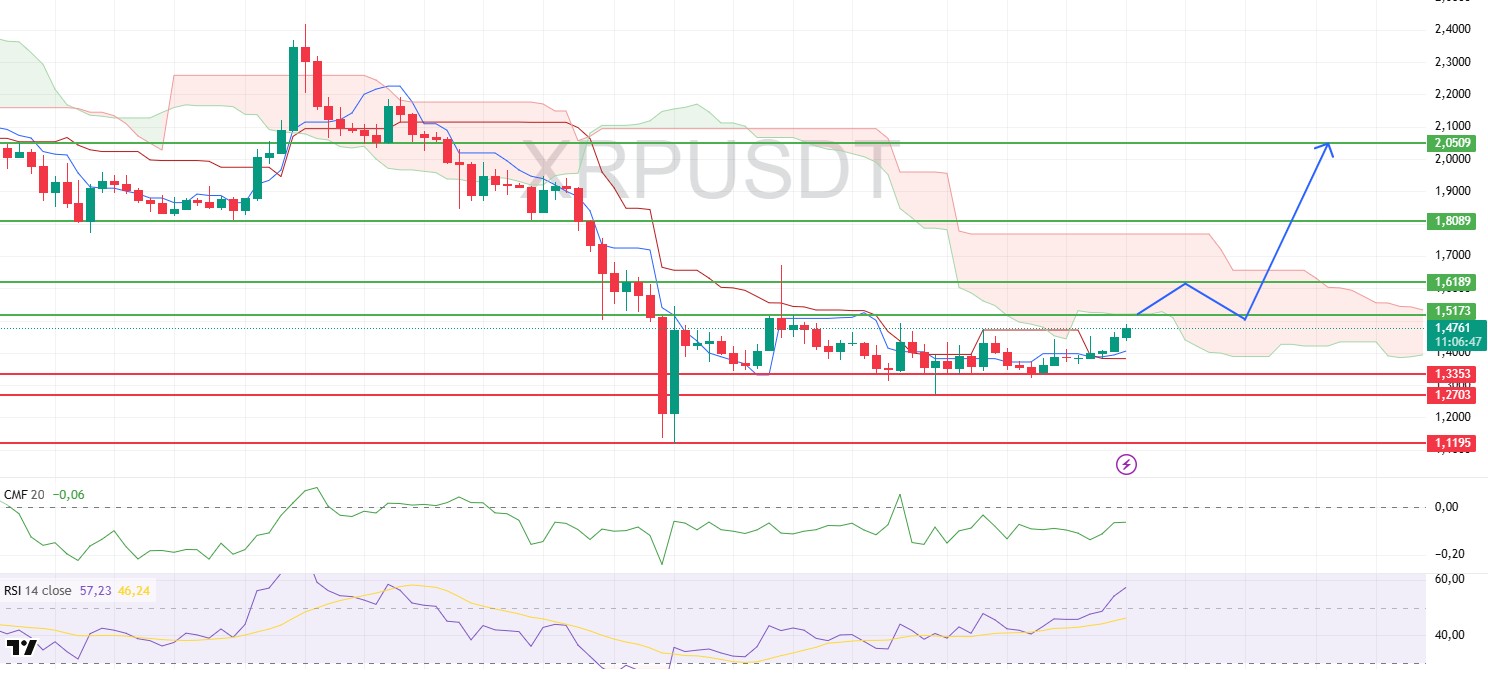
Last week, the XRP price continued its volatile movement within a wide range. At the start of the week, the price began to rise following buying activity at the $1.33 level and reached as high as $1.48. While this movement indicates that the market is finding demand at lower levels, it appears the price has not yet established a strong trend.
On the fundamental side, news that Ripple plans to repurchase up to $750 million in shares from investors and employees drew attention. It is noted that this program could raise the company’s valuation to approximately $50 billion. The company’s acquisitions in the financial infrastructure sector and its plans to obtain a financial services license in Australia indicate that Ripple’s strategy to expand its business scope is continuing.
Upon examining technical indicators, the fact that the Chaikin Money Flow (CMF) indicator remains in negative territory suggests that liquidity entering the market is limited. In contrast, the Relative Strength Index (RSI) has risen above the 50 level, signaling a recovery in momentum and indicating that buyers are regaining strength.
In the Ichimoku indicator, the price breaking above the Tenkan and Kijun levels signals an improvement in the technical outlook, while the Tenkan line crossing above the Kijun line is also viewed as a positive signal. Nevertheless, the price remaining below the lower band of the Kumo cloud at the $1.51 level indicates that a cautious outlook persists regarding the primary trend.
In the short term, a break above the $1.51 level could help the upward movement gain momentum. Conversely, the $1.33 level retains its importance as a key support, and a loss of this level could lead to a resurgence in selling pressure.
Supports: 1.3353 – 1.2703 – 1.1119
Resistances: 1.5173 – 1.6189 – 1.8089
Legal Notice
The investment information, comments, and recommendations contained in this document do not constitute investment advisory services. Investment advisory services are provided by authorized institutions on a personalized basis, taking into account the risk and return preferences of individuals. The comments and recommendations contained in this document are of a general nature. These recommendations may not be suitable for your financial situation and risk and return preferences. Therefore, making an investment decision based solely on the information contained in this document may not result in outcomes that align with your expectations.

