
Darkex Weekly Technical Analysis Report
BTC/USDT
While the US Congress brought the strategic reserve plan for Bitcoin to the agenda with the HR 5166 bill, Trump announced that the second phase of sanctions against Russia was ready and put forward the name of Rick Rieder among the Fed chair candidates. SEC Chairman Paul Atkins said that most tokens are not securities. While Lisa Cook’s dismissal from the Fed was taken to court, the Senate approved Miran’s candidacy. Democratic senators introduced a new crypto bill, while ECB President Lagarde announced that risks in the European economy had balanced out. US Commerce Secretary Lutnick stated that agreements with India and Switzerland were on the agenda. Trump, preparing for his visit to the UK, planned major deals in the technology sector and reiterated his expectation of a significant interest rate cut from the Fed.
On the corporate front, Metaplanet purchased 136 BTC, Strategy purchased 1,955 BTC, and GameStop announced it maintained its 4,710 BTC holdings. Smarter Web Company increased its reserves to 2,470 BTC. In the macro data set, the US PPI came in below expectations at 2.6% annually, while the CPI was 2.9% and the core CPI was 3.1%. Jobless claims in the US came in at 263K, strengthening expectations of a Fed rate cut.
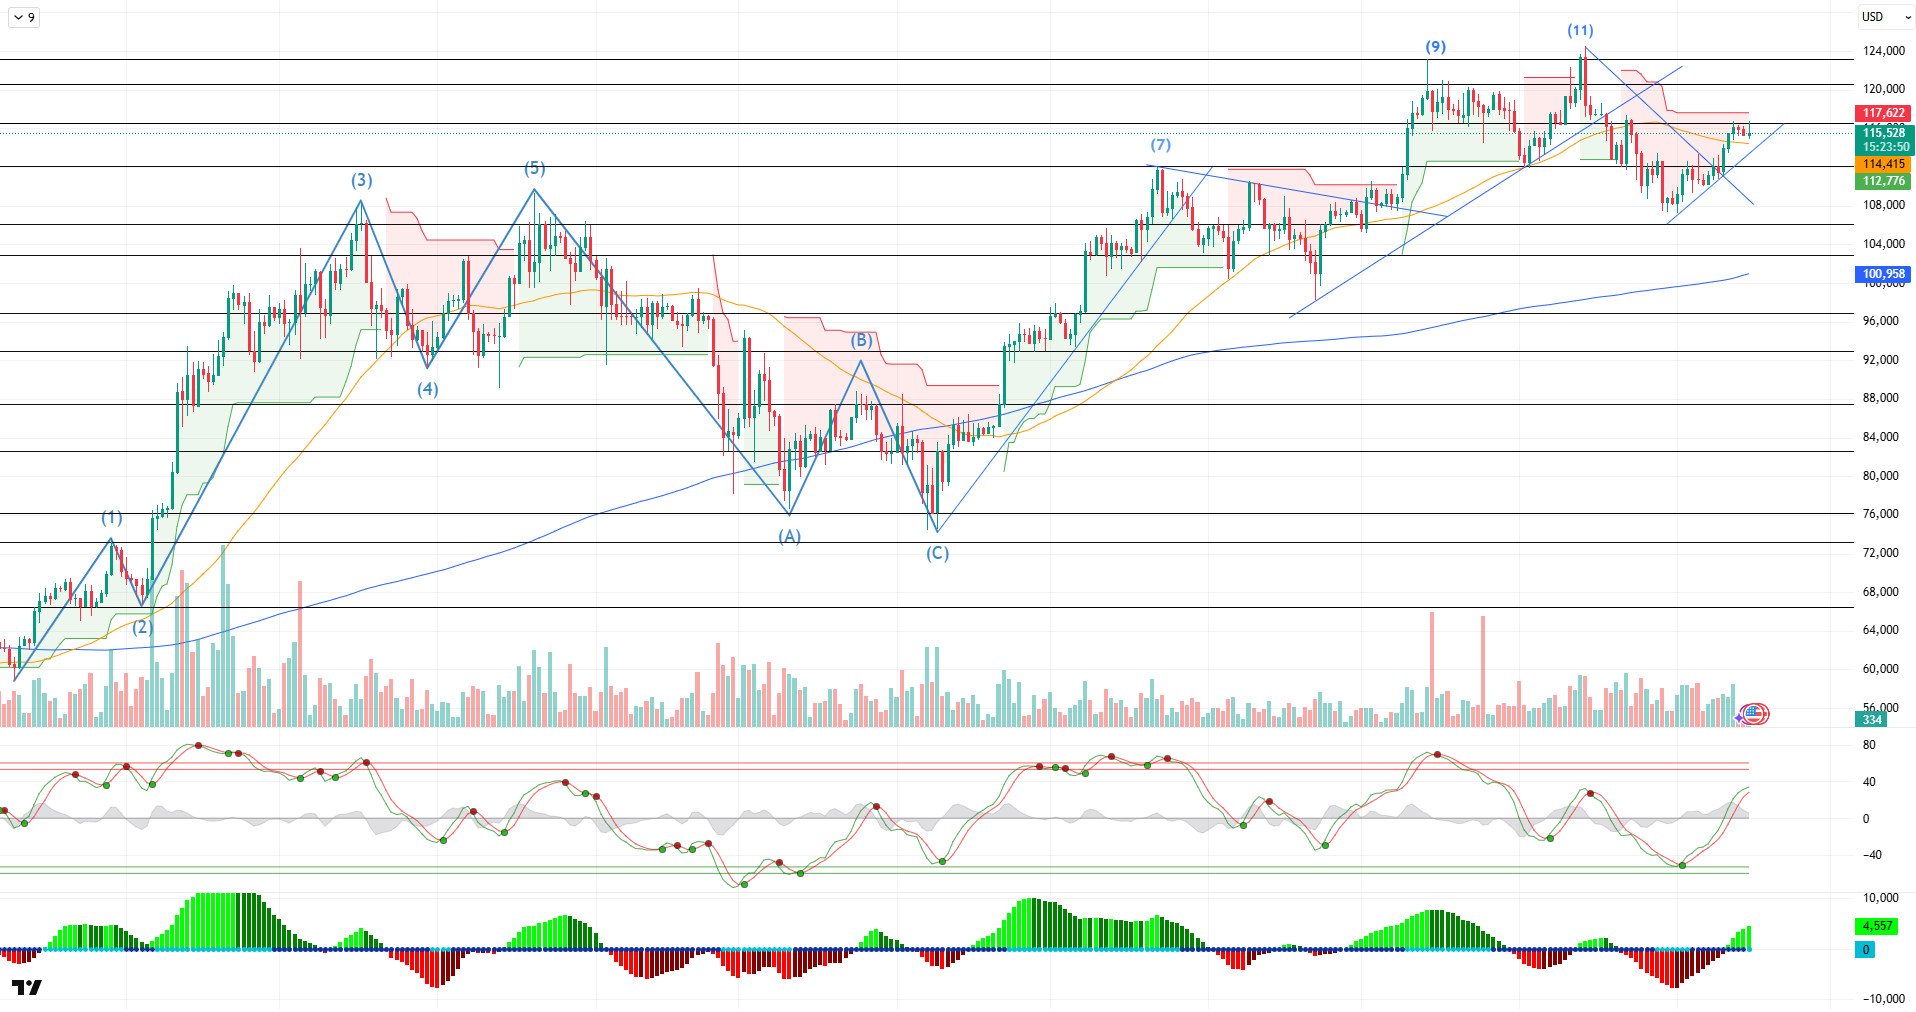
Looking at the daily technical outlook after all these developments, BTC reached the 11th point peak with its golden cross formation and then moved up to the ATH level, reaching 124,000. Then, the price, which entered a downtrend within a major uptrend, fell back to the 107,000 level. After the dip at this level, BTC formed a new uptrend channel and tested the 116,700 level.
Looking at the technical indicators, the Wave Trend (WT) oscillator crossed the middle band of the parallel channel, parallel to the buy signal it gave in the oversold zone on a daily basis, and its tendency towards the overbought zone is observed to be weakening. The Squeeze Momentum indicator (SM) is gaining momentum again in the positive zone. Meanwhile, in moving averages, the golden cross pattern continues as the 50-day SMA crosses above the 200-day SMA.
When examining weekly liquidity data, it is seen that buy-side transactions have recorded intense accumulation. The 112,500 – 113,000 band stands out as an area of high liquidity, while the scarcity of sell-side transactions is noteworthy.
In summary, the optimistic mood that had been lost in recent times due to fundamental developments regained strength ahead of the upcoming meeting, as US macro data was released and expectations of an interest rate cut became almost certain. Following the favorable conditions provided by the technical outlook, the price completed its consolidation within the horizontal band it had been in for a long time and tested the 116,700 level along with the minor upward channel. An examination of liquidity data reveals that sell positions have been liquidated, while buy transactions have gained weight, confirming the upward trend. In the coming period, it will be critical for the price to maintain the upward channel it has formed in order for the rise to be sustainable. Closings above the 115,000 level will be monitored as an important reference point for the continuation of the upward trend. In the event of potential selling pressure, the 113,500 – 113,000 band will be tracked as the first support and liquidity zone.
Supports: 115,000 – 113,000 – 110,000
Resistances: 116,600 – 120,500 – 123,300
ETH/USDT
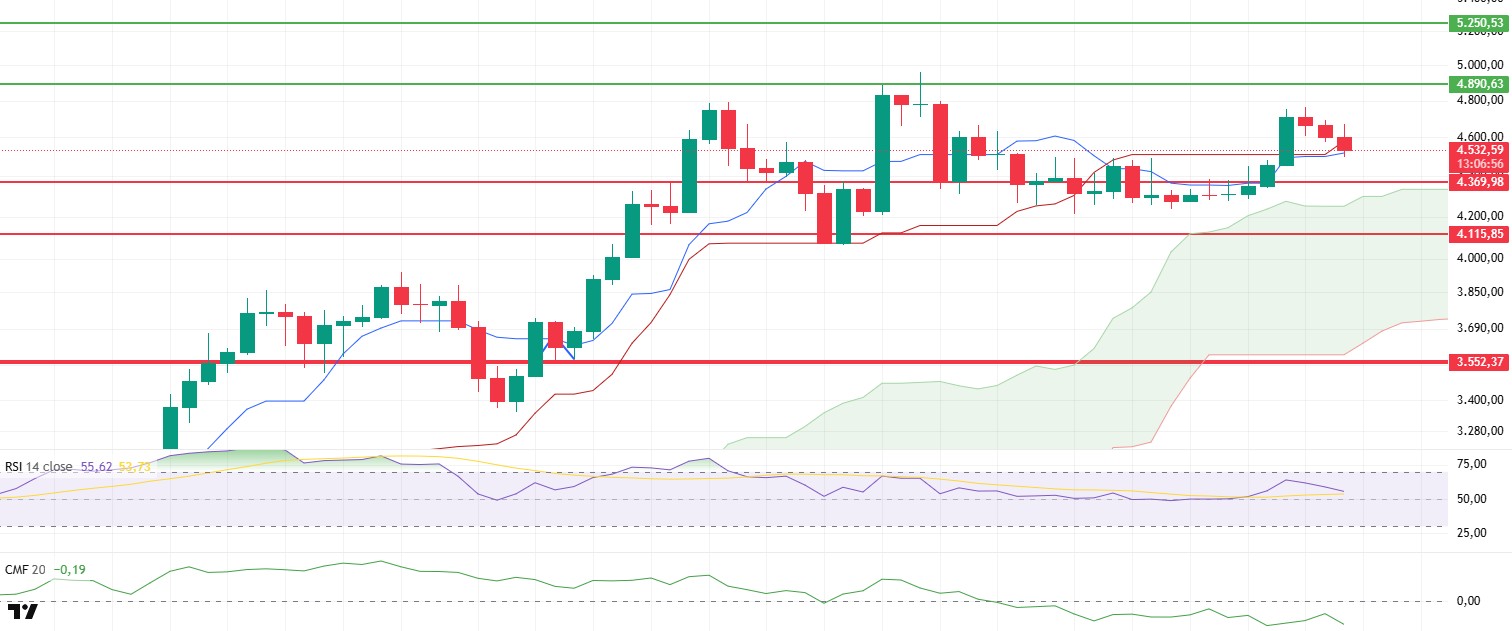
The ETH price showed a strong upward trend last week, rising from $4,300 to $4,767. However, momentum weakened after selling pressure on Saturday, and the price fell to $4,500 after the weekly close. This movement indicates that the market has taken on a more cautious outlook in the short term, while the medium-term trend structure continues to be maintained.
Among the significant developments affecting the market, validator exits stand out. Currently, approximately 2.6 million ETH are waiting in the validator queue for exit, with an average waiting period of 45 days. These unusual exits stem from the SwissBorg security breach that occurred last week. Following this incident, Kiln Finance announced its decision to exit as a validator to protect its assets. In Kiln’s official statement, it was emphasized that the exit process is a precautionary measure to protect the integrity of staked ETH and that the sale of these assets is not intended. Therefore, concerns about additional selling pressure in the market are largely mitigated.
Looking at the technical indicators, the Ichimoku indicator shows that the price has retreated back to the Tenkan and Kijun levels in the daily time frame. Furthermore, the Tenkan level remaining below the Kijun level indicates that short-term selling pressure may continue. However, the price remaining above the kumo cloud confirms that the medium-term trend maintains a positive outlook. This structure shows that the main trend is still upward despite corrections.
The Chaikin Money Flow (CMF) indicator remains in negative territory, indicating continued liquidity outflows from the market. While this suggests buyers remain weaker in the short term, institutional demand and the macroeconomic environment continue to support the medium-term structure.
The Relative Strength Index (RSI) indicator retreated back to the base MA line after the recent rise and approached the 50 level, signaling weak momentum. Although the short-term outlook is negative, the possibility of an upward recovery remains alive if the price manages to hold above the 50 level.
Looking at critical levels, if the price closes below the Tenkan line at the $4,500 level, it is likely that the $4,369 intermediate support level will be retested. If this level holds, the market could maintain its medium-term positive trend, and the price could rise again towards the critical resistance level of $4,890. In the opposite scenario, a break below the $4,369 support level could pave the way for a deeper correction.
The overall outlook indicates that Ethereum is maintaining its positive medium-term trend, but short-term risks are increasing. The absence of selling pressure from validator exits, continued ETF inflows, and strong institutional demand support the price’s upward movement. However, weakness in technical indicators and liquidity outflows suggest that short-term volatility may continue. Whether critical support levels hold in the coming days will be decisive in terms of the market returning to a buyer-dominated structure.
Support levels: 4,369 – 4,115 – 3,552
Resistance levels: 4,890 – 5,250 – 5,550
XRP/USDT
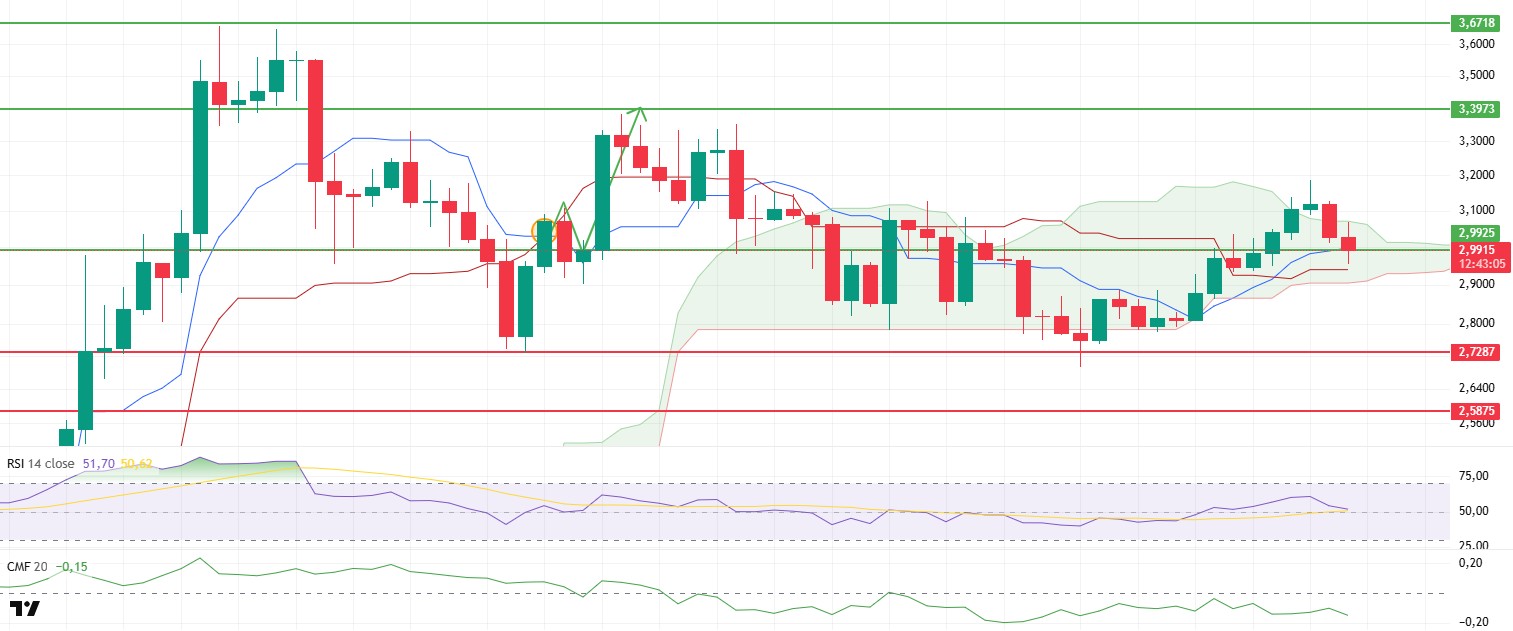
XRP gained strong upward momentum last week, climbing to $3.18. However, increased selling pressure over the weekend caused the price to retreat back to the key support level of $2.99. This movement indicates that buyers have lost strength in the short term and that the market is attempting to stabilize at critical support levels.
On the liquidity side, the Chaikin Money Flow (CMF) indicator remains in negative territory. This outlook signals that capital outflows from the market are continuing and that upward attempts are easily met with selling pressure. The absence of strong liquidity inflows makes it difficult for the price to sustain upward moves.
The Relative Strength Index (RSI) indicator also paints a weak picture. Falling back to its base moving average line, the RSI stands at 50, revealing that momentum remains low. In the short term, this weakness limits the price’s potential for an upward recovery.
The Ichimoku indicator presents a complex picture. Although the price is moving within the boundaries of the Kumo cloud, the Tenkan line crossing above the Kijun line generates a positive signal. This indicates that the price could regain upward momentum if it manages to hold at critical levels.
Looking at critical levels, daily closes above the upper band of the cloud at $3.07 could pave the way for renewed upward momentum. Conversely, a close below the $2.99 support level could trigger sharp selling and lead to a deeper correction. While XRP’s medium-term structure appears supportive overall, both liquidity and momentum are showing weakness in the short term. Therefore, whether the price can hold the $2.99 support level will be critical in determining the direction in the coming days.
Support levels: $2.7287 – $2.5875 – $2.3233
Resistances: 2.9925 – 3.3973 – 3.6718
SOL/USDT
Last week in the Solana ecosystem;
- DeFi Development (DFDV), a Solana treasury company listed on Nasdaq, announced the launch of its “.dfdv” domain name service.
- Swiss crypto platform SwissBorg suffered a $41.5 million SOL hack attack following the compromise of its shared API.
- Canadian Solana Treasury company SOL Strategies began trading on Nasdaq. The Toronto-based blockchain investment company trades under the ticker symbol STKE.
- The SEC delayed the Franklin Spot Solana ETF. Forward Industries completed a $1.65B fundraising to purchase Solana tokens.
- Galaxy Digital purchased $326 million worth of SOL for Multicoin. FTX and Alameda made a $44.9 million repayment on Solana.
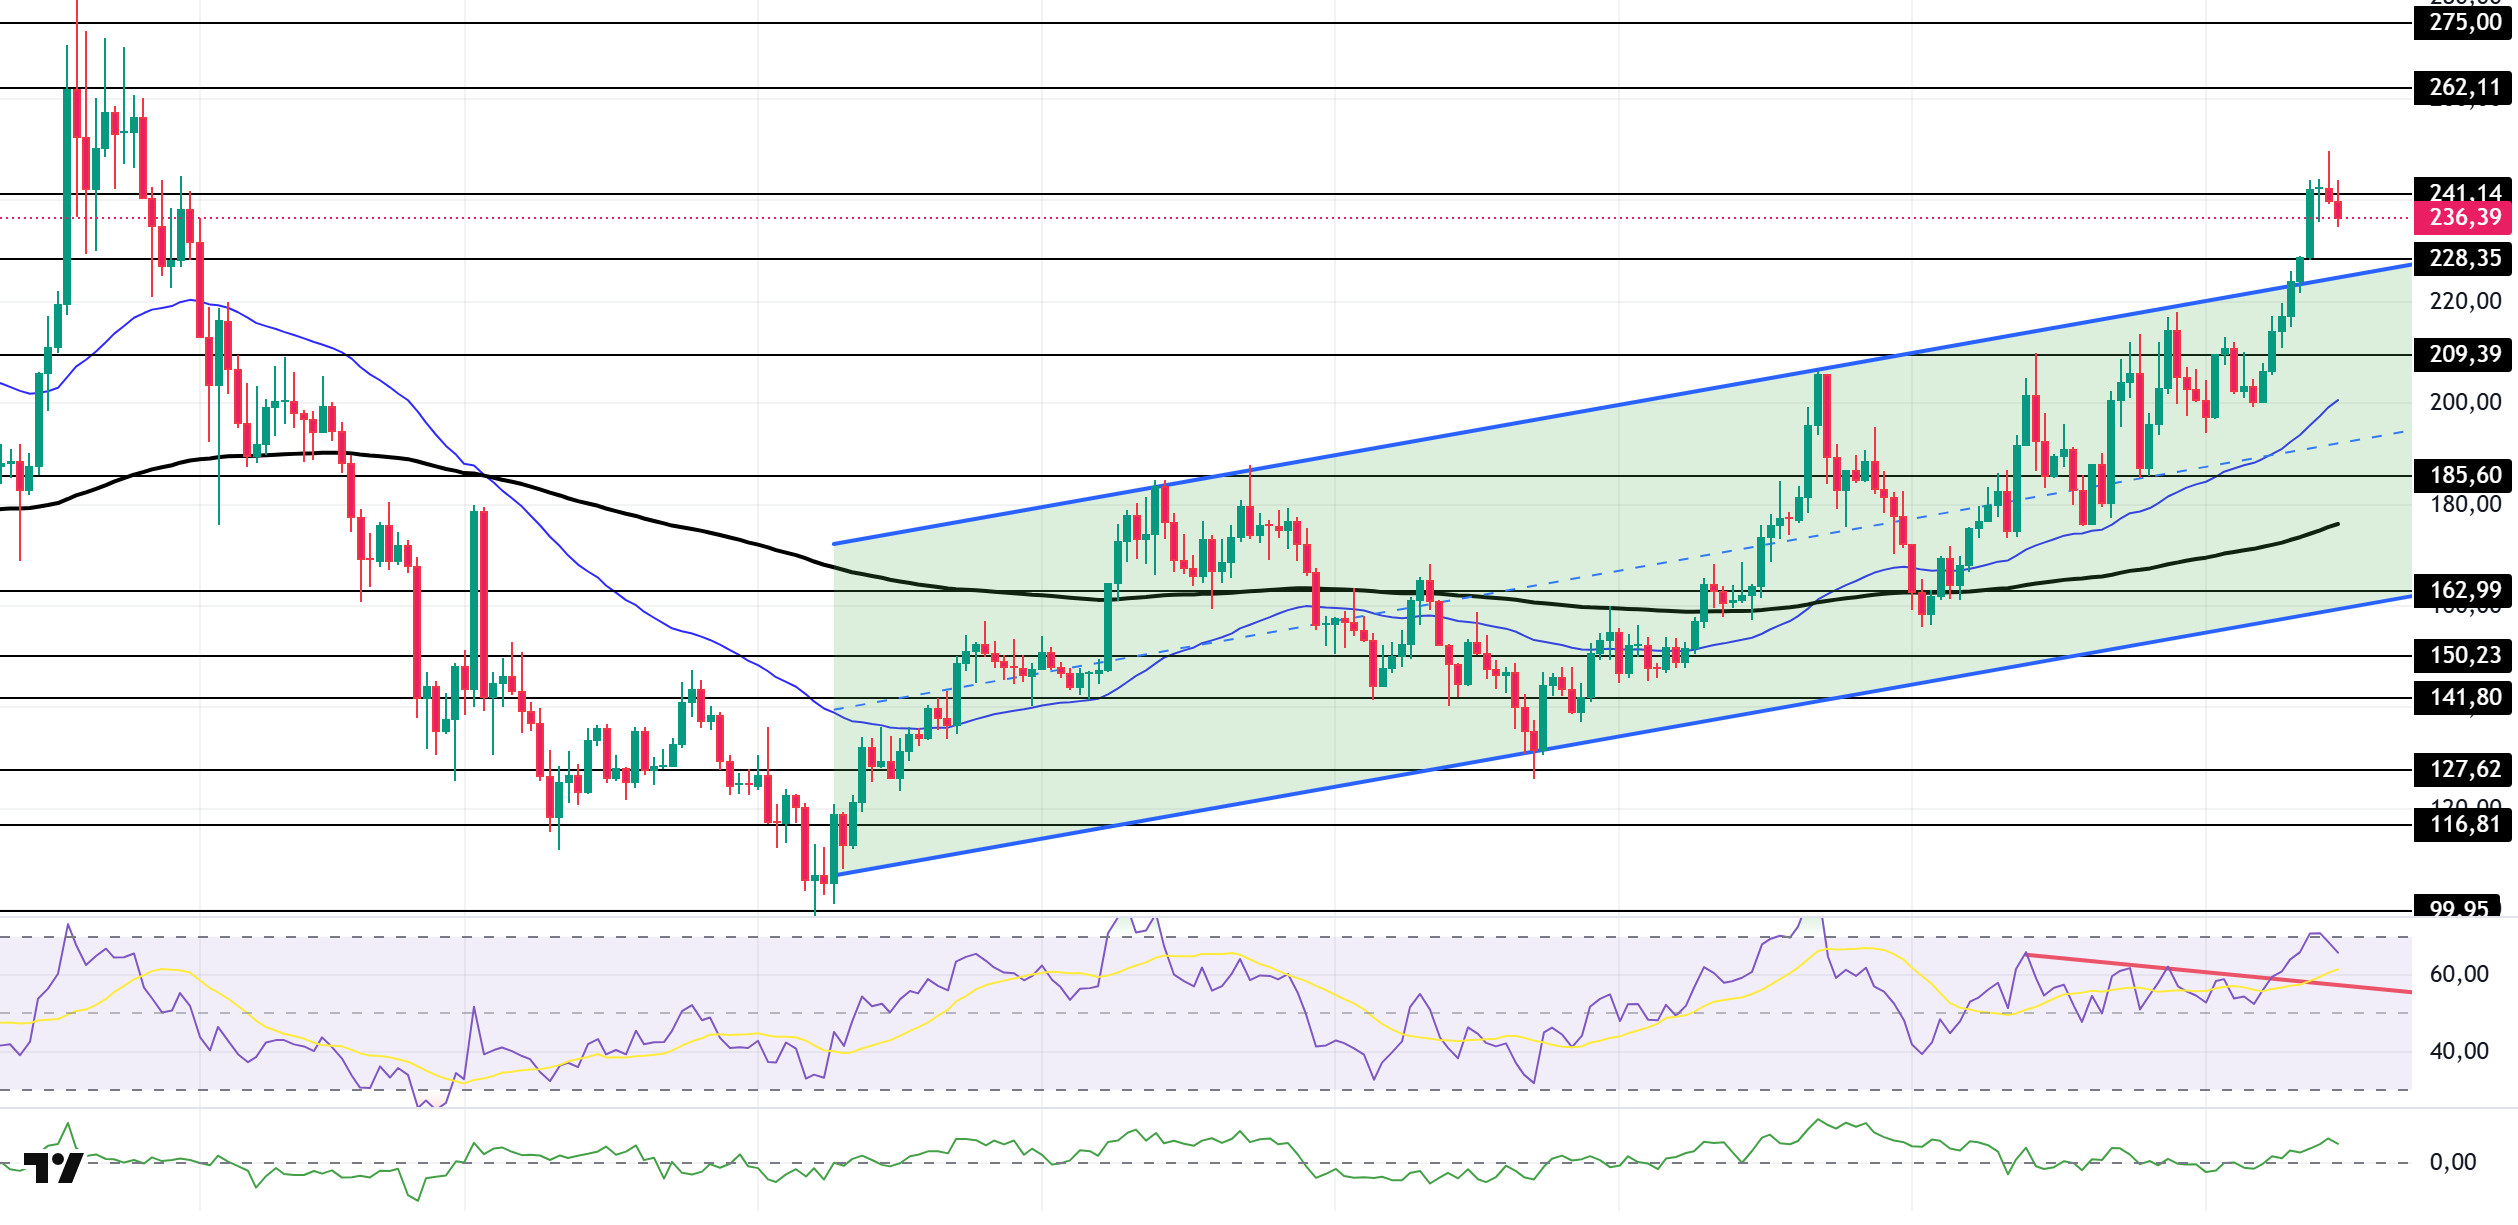
The SOL price showed an approximate 16.6% increase on the daily chart this week. The asset managed to stay above the ceiling level of the rising trend that began on April 9 by breaking it with a strong candle and is currently testing the strong resistance level of $241.14. If it closes above this level, it could continue its upward movement, rise to the $262.11 level seen on January 20, and form a cup pattern. If it experiences a pullback, it could test the peak of the upward trend as support.
The asset is trading above the 50 EMA (Exponential Moving Average – Blue Line) and 200 EMA (Black Line) moving averages, indicating that the asset is in an uptrend. Furthermore, the 50 EMA continuing to remain above the 200 EMA indicates that a “golden cross” formation is continuing from a technical perspective. This shows that the potential for an increase in the medium term continues. On the other hand, the large gap between the two moving averages increases the possibility of a horizontal movement or a decline. The RSI (14) is in the overbought zone. This could trigger profit-taking. At the same time, the indicator has moved into the upper region of the downtrend that began on August 13. This signals an increase in buying pressure. The Chaikin Money Flow (CMF-20) has risen into positive territory; however, a decline in money inflows could push the CMF-20 indicator into negative territory. If macroeconomic data remains positive and developments in the ecosystem continue favorably, the first major resistance level of $262.11 could be retested. Conversely, in the event of potential negative news flow or deterioration in macro data, the $209.39 level could be monitored as a potential buying opportunity.
Supports: 228.35 – 209.39 – 185.60
Resistances: 241.14 – 262.11 – 275.00
DOGE/USDT
- REX Shares and Osprey Funds have applied to US regulators to launch the first exchange-traded fund (ETF) offering direct access to DOGE.
- Thumzup Media raised $50 million to scale up 3,500 Dogecoin mining rigs.
- The SEC has delayed the Bitwise Spot Dogecoin ETF.
- 21Shares filed an amended S-1 form for its DOGECOIN ETF.
- CleanCore Solutions has surpassed the 500 million DOGE threshold by continuing its Dogecoin purchases. The company’s 1 billion DOGE target remains in place.
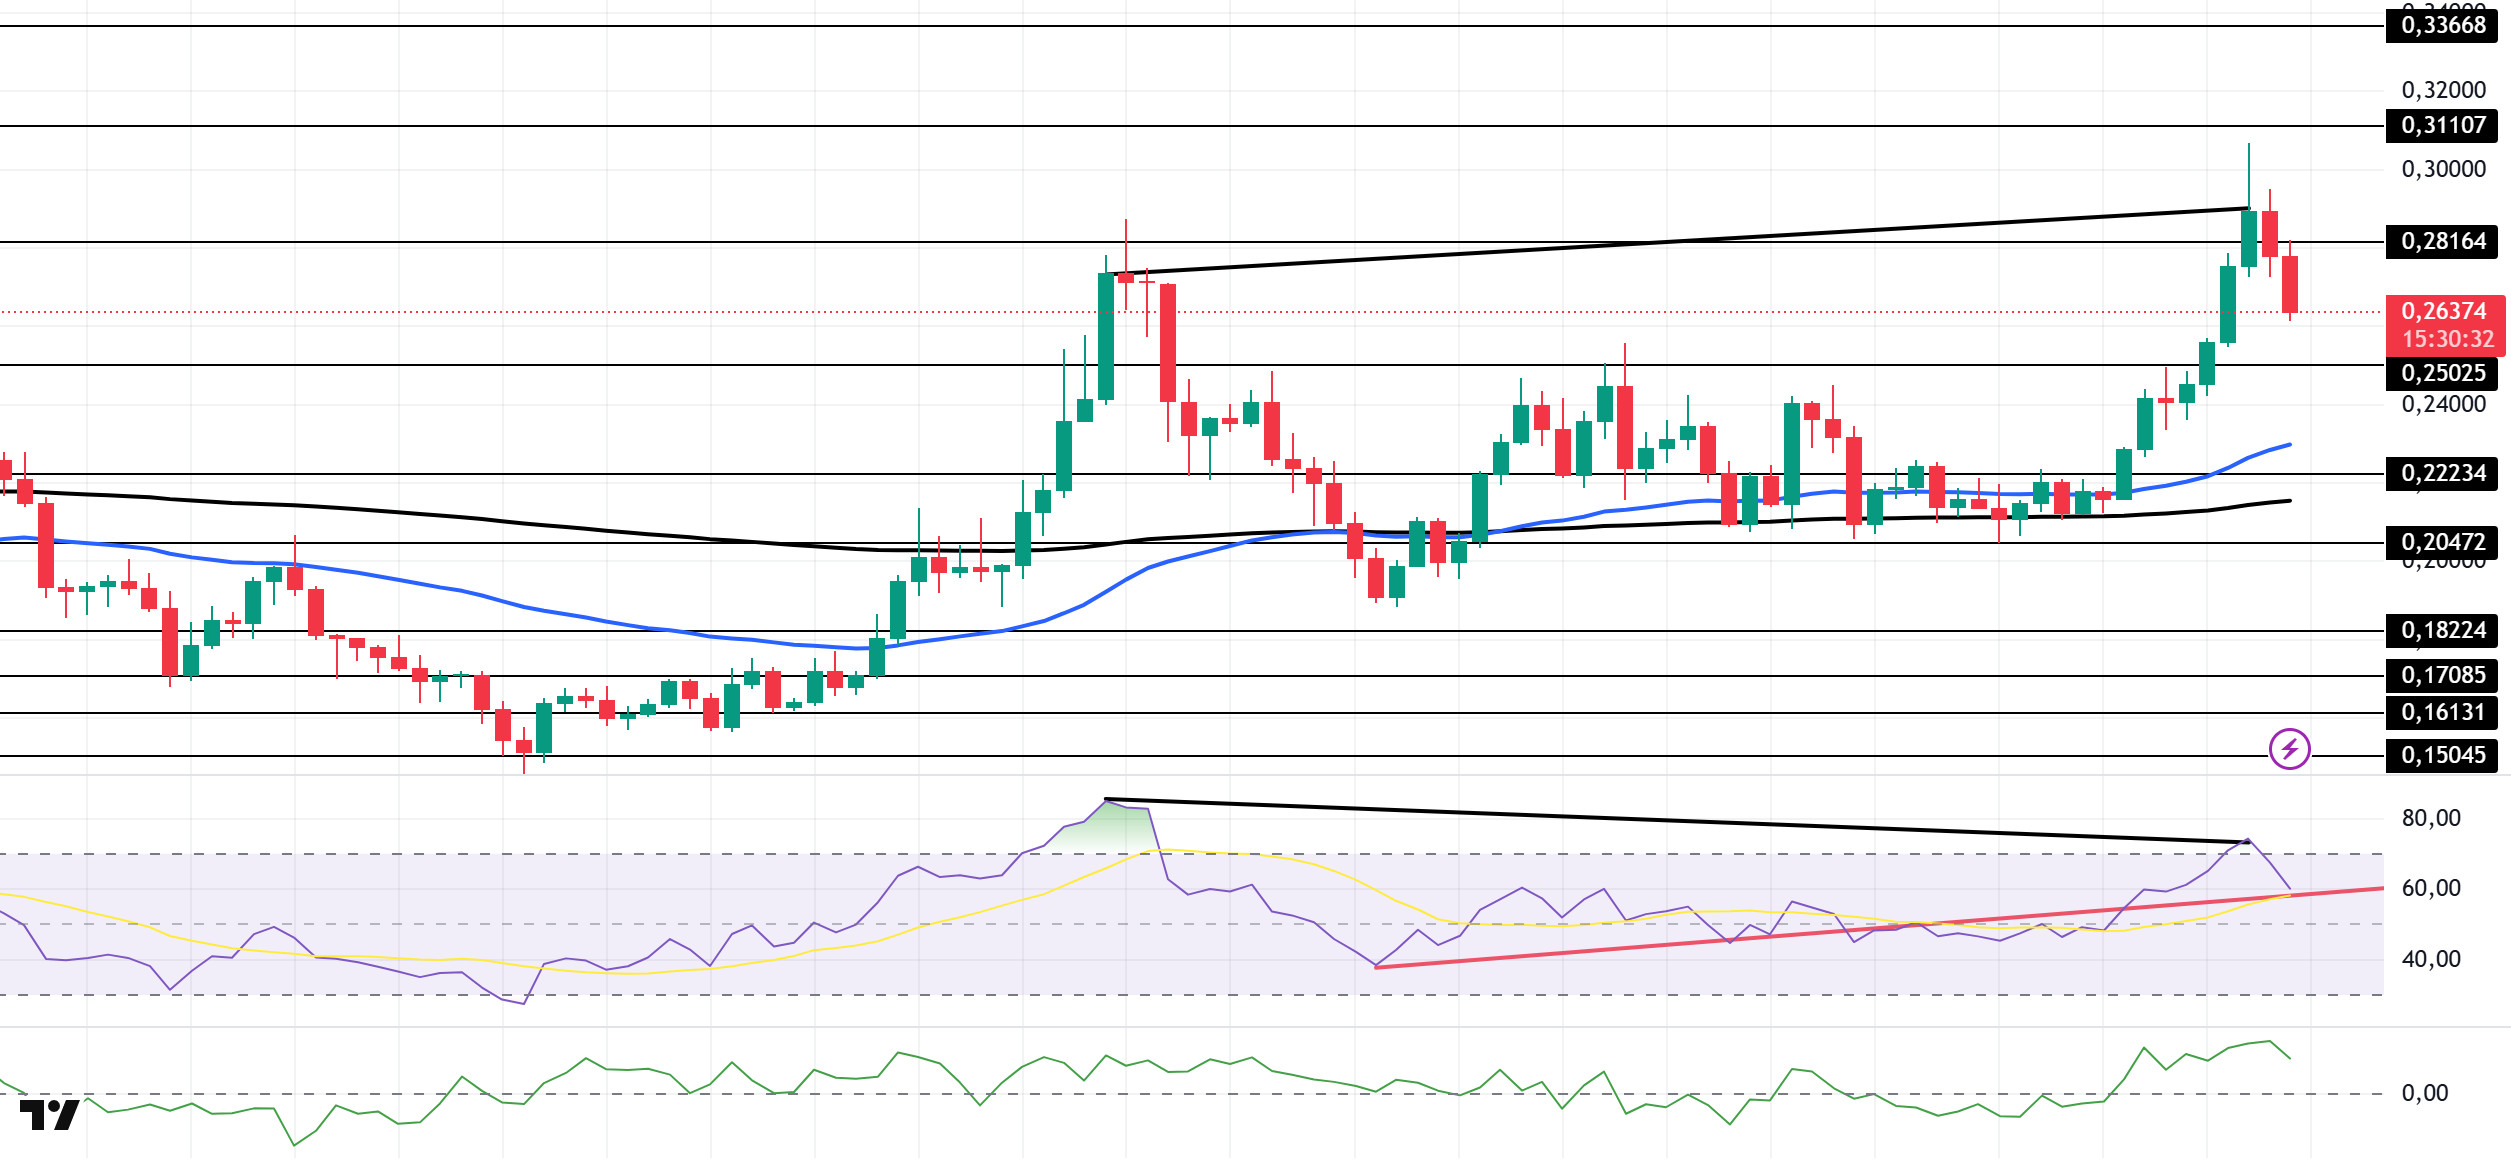
DOGE has risen approximately 27% on the daily chart since last week. Breaking above the strong resistance level of $0.25025, the price continued its upward movement and tested the strong resistance level of $0.31107. The asset then experienced a pullback, indicating profit-taking with an 8% decline. If the uptrend continues, it may retest the $0.31107 level. If the pullback deepens, the $0.25025 level could be monitored.
The asset is trading above the 50 EMA (Blue Line) and 200 EMA (Exponential Moving Average – Black Line) moving averages. This indicates that the asset is in an uptrend. On the other hand, the 50 EMA continues to be above the 200 EMA, indicating that the “golden cross” formation is continuing. This signals that upward pressure may continue in the medium term. The Chaikin Money Flow (CMF–20) indicator remained in positive territory. However, cash inflows continue to decline. This could push CMF-20 into negative territory. Looking at the Relative Strength Index (RSI-14) indicator, it experienced a slight pullback from the overbought zone. On the other hand, it broke the upward trend that had been continuing since August 2. This signaled an increase in buying pressure. However, it is currently testing the trend as support. If it breaks this level, selling pressure may emerge. On the other hand, negative divergence may increase the pullback. In the event of macroeconomic risks or negative news from the ecosystem, the $0.25025 level can be monitored as a strong support. On the other hand, if the upward movement gains strength, the $0.31107 level comes to the fore as the first strong resistance level.
Supports: 0.25025 – 0.22234 – 0.20472
Resistances: 0.28164 – 0.31107 – 0.33668
TRX/USDT
Last week saw a significant development for the cryptocurrency ecosystem. The T3 Financial Crime Unit (a partnership between Tron, Tether, and TRM Labs), which includes Tron, announced that it had identified and frozen over $250 million in illegal cryptocurrency assets globally.
Over the past week, the TRON network generated a total of $54.2 million in revenue, increasing its revenue by $2.9 million compared to the previous week and continuing to be the highest-earning ecosystem among all blockchain networks. Maintaining this momentum is critical to solidifying TRON’s leadership in the DeFi and stablecoin ecosystem.
During the week of September 8–14, 2025, a total of 26.3 million TRX were burned on the TRON network. Despite this, the circulating supply increased by 1.1 million for the first time in a long time. The increase in circulating supply is creating inflationary pressure on TRX. Additionally, the total number of addresses increased by 1.5 million to 332.1 million during the same week.
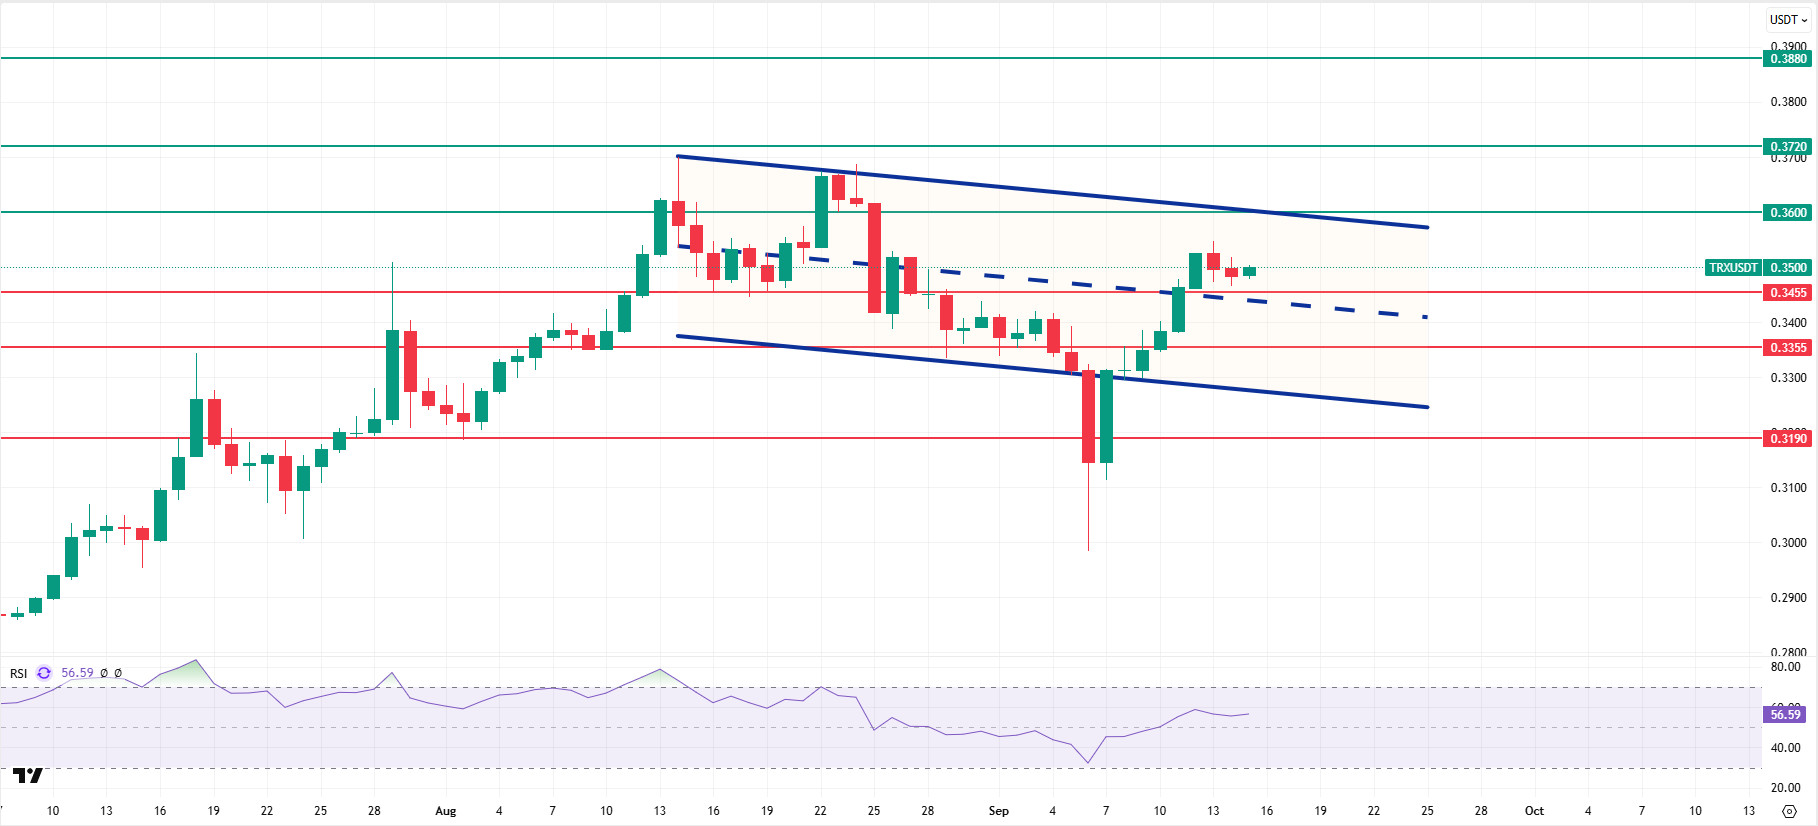
Technically speaking, TRX started the week at 0.3313 and rose approximately 5% throughout the week, closing at 0.3484. Thus, the two-week downward trend ended, and the week was completed with an increase, reaching a market value of $32.9 billion. Currently trading at $0.3500, TRX is close to the middle band of the bearish channel on the daily chart. The Relative Strength Index (RSI) value is also observed to be in the buy zone at 56. Considering its position within the bearish channel and the RSI indicator, the TRX price may rise slightly. This indicates that it may move towards the upper band of the channel. In such a case, it may test the 0.3600 resistance. If it closes above the 0.3600 resistance on a daily basis, it may break the channel upwards and test the 0.3720 resistance. If it fails to close above the 0.3600 resistance level and a bearish atmosphere develops in the market, it may decline due to potential selling pressure from the region in question. In such a scenario, it may test the 0.3455 and 0.3355 support levels in sequence.
The 0.3190 level stands out as a critical support on the daily chart. As long as it remains above this level, the uptrend is expected to continue, but a downward break could increase selling pressure.
Supports 0.3455 – 0.3355 – 0.3190
Resistances 0.3600 – 0.3720 – 0.3880
AVAX/USDT
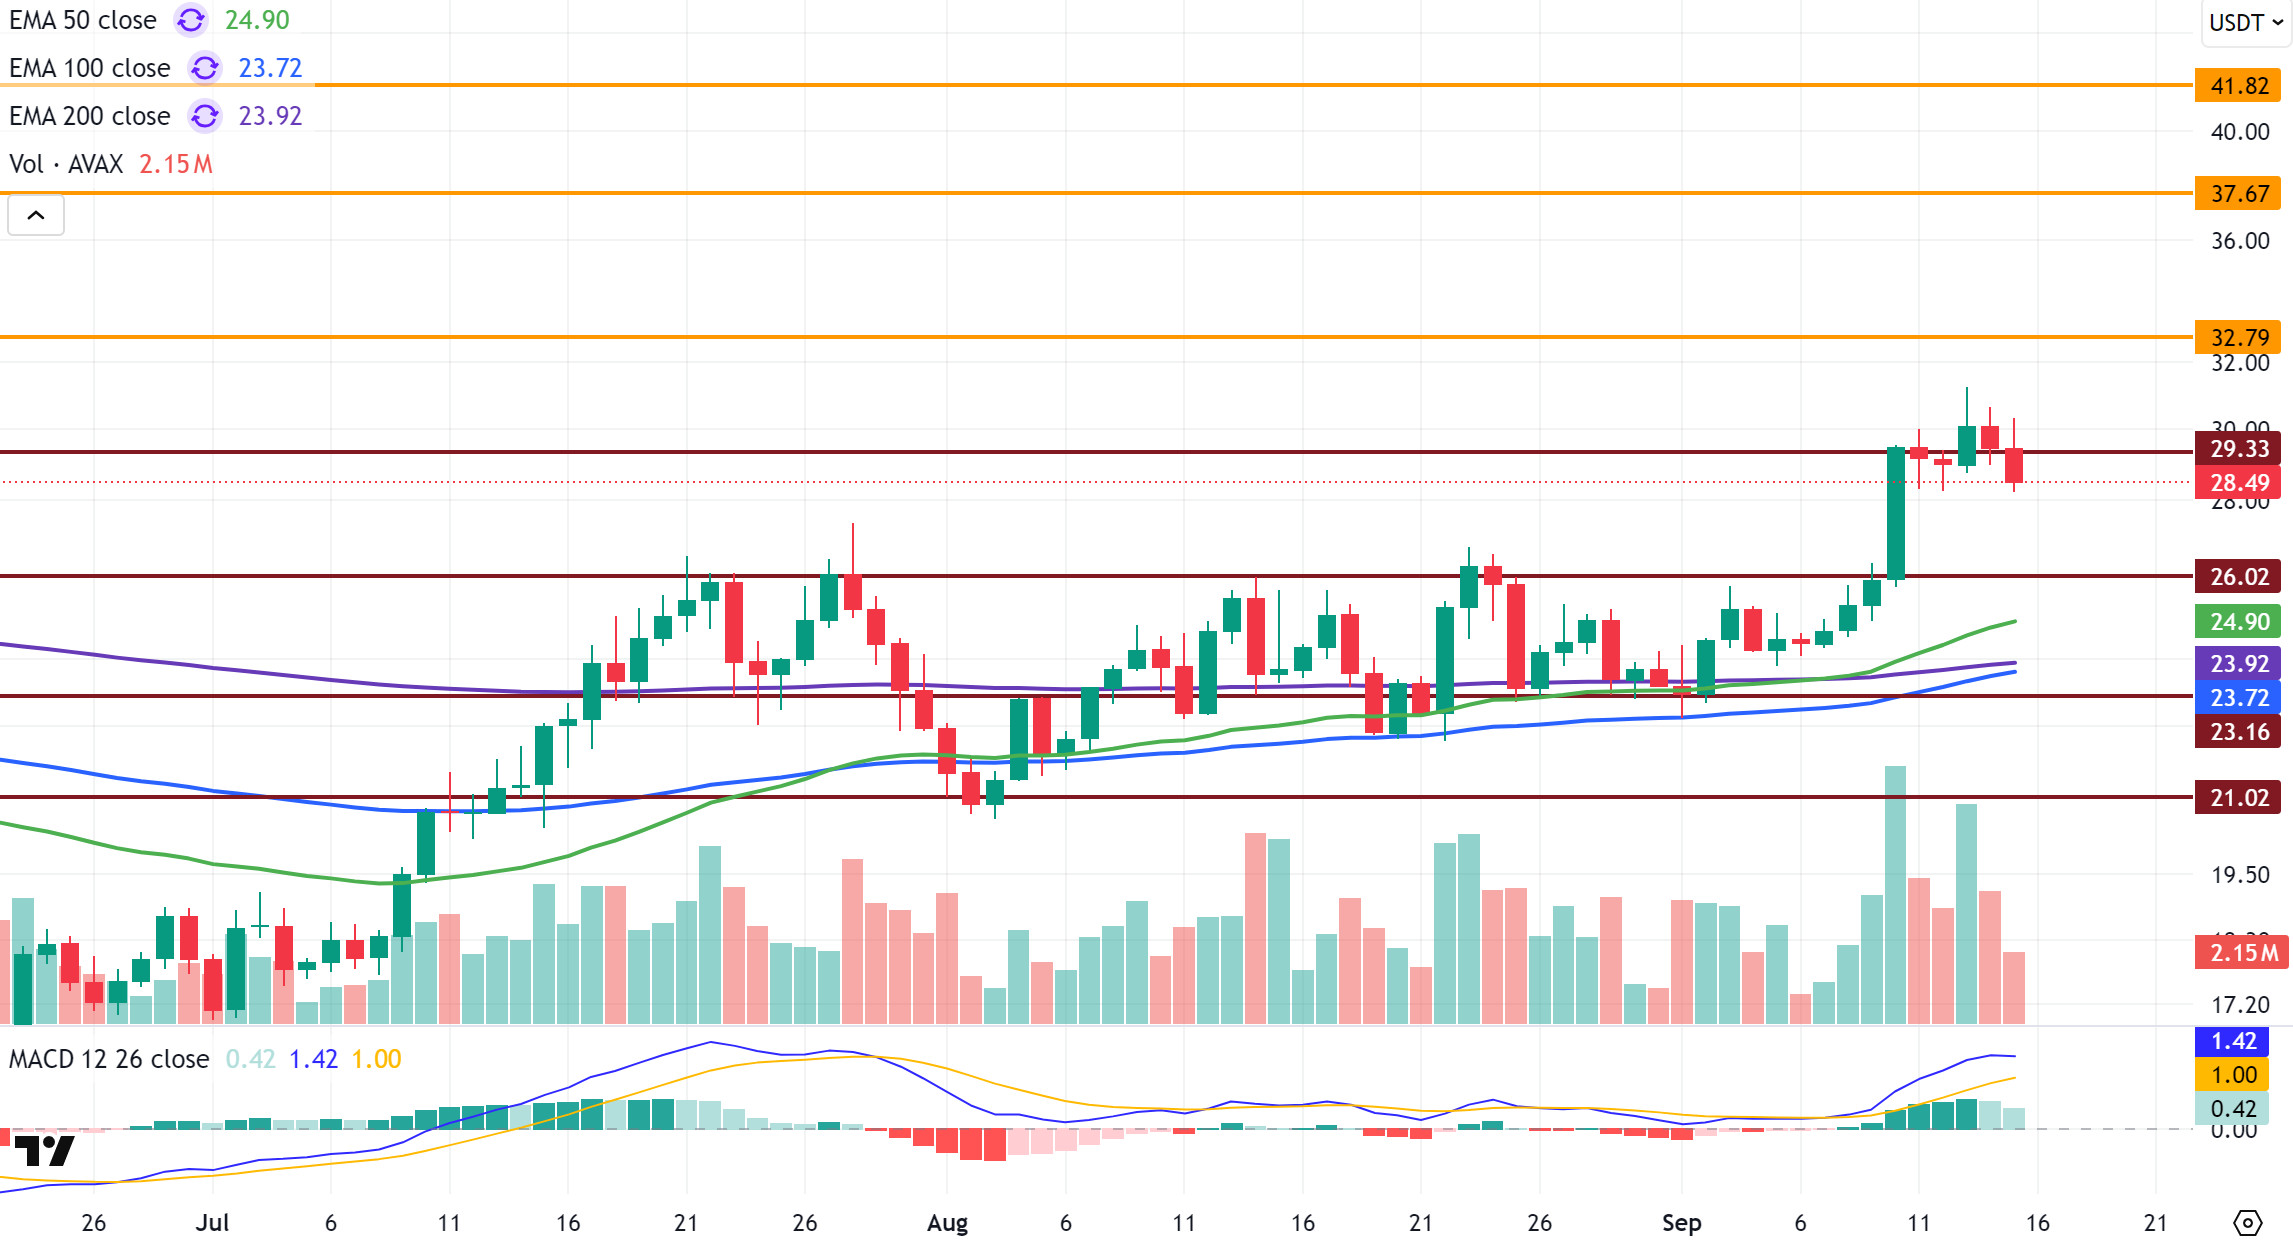
Starting last week at $24.69, AVAX performed strongly throughout the week, gaining approximately 19.3% in value and closing the week at $29.44. The $26.02 resistance level, which had been a critical barrier for a long time, was broken, and it gradually rose above $31. However, AVAX experienced a decline after selling pressure above $31 and closed the week below the $30 level. Maintaining its position above $26 creates a positive outlook in the medium term. Although it continues to trade above the $29 level, the price movement appears to be stuck in a horizontal band for now and is searching for a clear direction. Market sentiment is generally positive. AVAX’s rise above $31 after 6 months has brought the potential of $40-45 back into focus for medium-term targets.
Although the upward momentum has gained speed with the Moving Average Convergence/Divergence (MACD) line crossing above the signal line on the daily chart, it has not yet formed a strong momentum. However, AVAX is trading above critical Exponential Moving Average (EMA) levels, which supports the positive outlook. Although technical indicators support the upside potential, a clear upward momentum has not yet formed. If momentum continues to weaken, selling pressure could increase. In this case, the decline could gain momentum.
If AVAX starts to rise and breaks through the $32.79 resistance level and remains above this level, the rise could accelerate. If the rise continues, the $37.67 and $41.82 levels could come into play. In the opposite scenario, if momentum continues to weaken and selling pressure increases, it could first test the $29.33 support level, followed by the $26.02 level. Closings below these levels could cause AVAX to retreat back to the $23.16 support level. In the overall outlook, AVAX continues to produce positive technical signals as it continues to trade above EMA levels. However, the price currently hovering above $29 on makes the outlook neutral. If strong buying pressure emerges, the upward momentum could resume, and AVAX could accelerate its upward movement.
(EMA50: Green Line, EMA100: Blue Line, EMA200: Purple Line)
Support Levels: 29.33 – 26.02 – 23.16
Resistances: 32.79 – 37.67 – 41.82
SHIB/USDT
This week, the Shiba ecosystem saw intense activity both in the market and in technology and infrastructure. BitMEX’s delisting of SHIB futures contracts due to low liquidity was a development that limited visibility in the derivatives markets and could weaken institutional interest. In contrast, two important topics emerged in the ecosystem’s internal architecture. The audit-completed V2 migration plan for LEASH was announced with a three-phase migration structure. The first phase covers owners and Uniswap V2 and ShibaSwap V1 liquidity providers, the second phase targets Uniswap V3 and ShibaSwap V2 liquidity providers, and the third phase includes a one-to-one swap for Shibarium bridge users. On the Shibarium side, preparations for CCIP (Cross Chain Interoperability Protocol) integration were announced. This step aims to strengthen multi-chain interaction, enabling mutual transactions with networks such as Polygon, Avalanche, and Arbitrum, as well as expanding liquidity and use cases.
In terms of security, a flash loan attempt targeting the Shibarium bridge was detected, and the attacker’s attempt to gain an advantage over 4.6 million BONE was rendered ineffective by the team’s quick intervention. Staking was suspended, 4.6 million BONE were frozen, validator funds were moved to a multi-signature cold wallet, and a key renewal and hardening process was initiated. It was reported that a limited amount of assets moved from the bridge, the relevant amounts were subsequently compensated, and the overall security of the system was maintained. In terms of net impact, the delisting decision creates caution in the short term, while CCIP integration and the LEASH V2 transition have the potential to strengthen the ecosystem’s perception of reliability and resilience in the medium term.
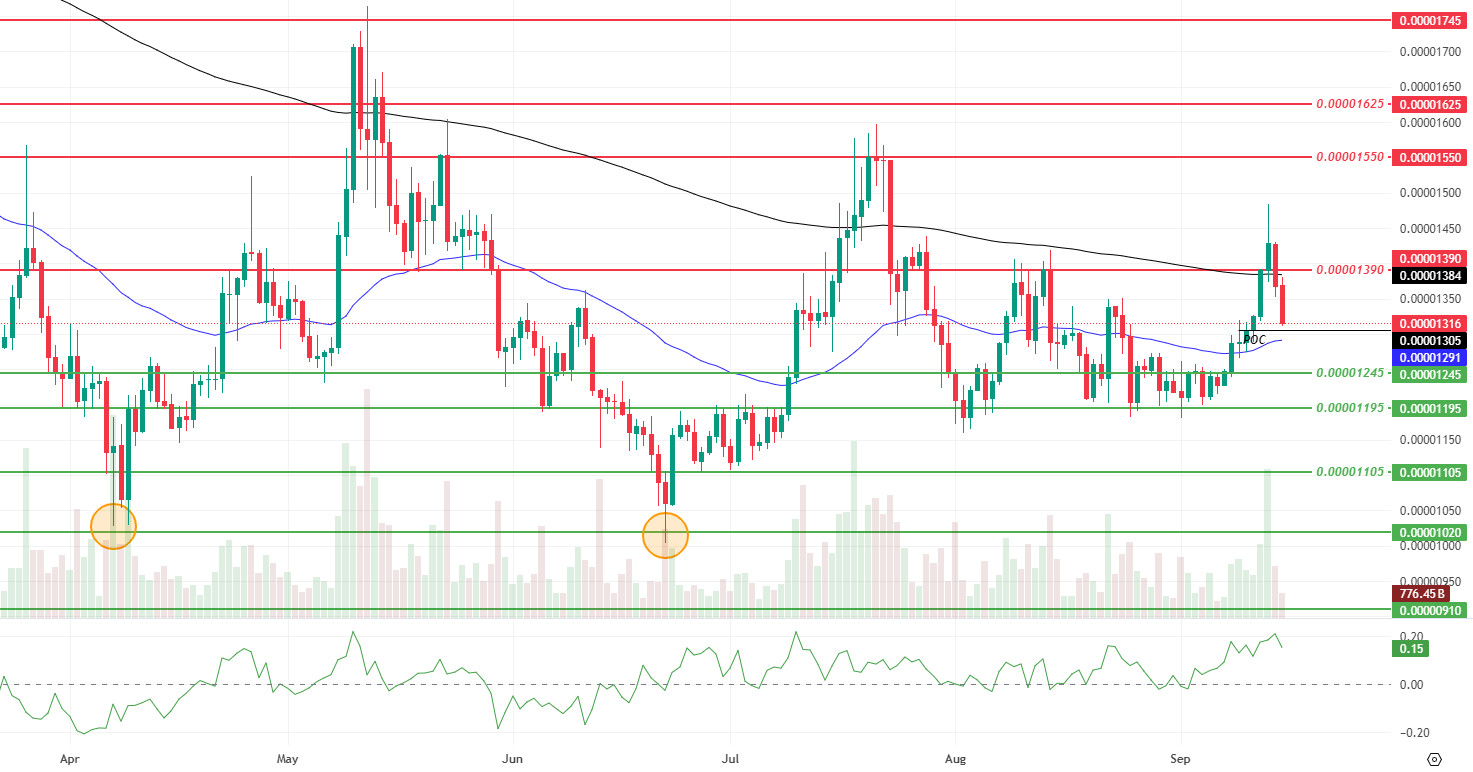
On the technical side, momentum and trading volume maintained their increase this week compared to last week, while the limited increase in volatility kept price behavior under control. Chaikin Money Flow (CMF) is in positive territory and confirms the buyer trend. Following the breakout with a daily close above $0.00001390, the correction deepened and the price is currently trading at $0.00001320 levels. The Point of Control (POC) is at $0.00001305 and the equilibrium axis has shifted to this region. After closing above the 200 Exponential Moving Average (EMA), the pullback has turned into a test of sustainability. For the uptrend to regain momentum, the price must first hold above the POC and then close above $0.00001390 again. If these conditions are met, the path opens towards targets at $0.00001550 and $0.00001625. Otherwise, the risk of a deepening decline towards the $0.00001105 and $0.00001020 regions remains on the agenda, with support levels at $0.00001245 and $0.00001195 being tested below $0.00001305. As long as closes above the POC are maintained, the base scenario remains neutral to positive.
Supports: 0.00001245 – 0.00001195 – 0.00001105
Resistances: 0.00001390 – 0.00001550 – 0.00001625
LTC/USDT
LTC ended last week with a 0.17% increase and started the new week at 115.10. LTC, which lost 3.48% against Bitcoin during the same period, saw its market value rise to approximately $8.8 billion and moved up one spot in the market cap rankings to 20th place. Open positions in futures trading increased by 8.8%; funding rates are trending positively.
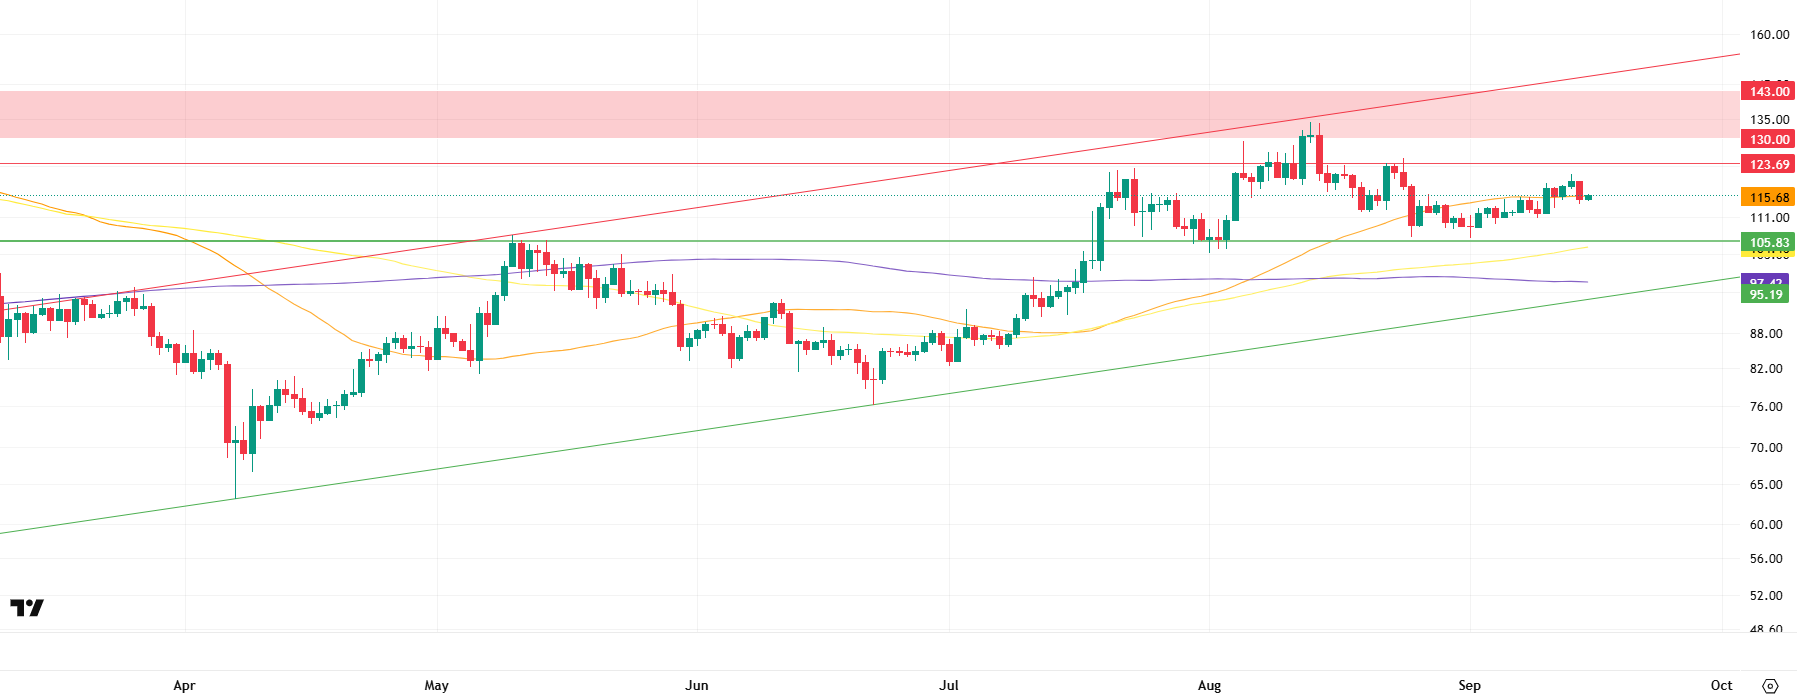
On the technical side, Litecoin is trading above the 100-period (yellow) and 200-period (purple) moving averages, hovering around the 50-period (orange) moving average. The horizontal resistance at the 123.69 level could create intense selling pressure in the short term. If broken, the uptrend is expected to continue towards the 130.00 – 143.00 range. However, the 130.00 level should be monitored as a significant threshold . The 143.00 level is the upper point of the red band and, if broken, could be considered the most critical position for sharp rises.
The current outlook indicates that a clear upward or downward momentum has not yet been established, and the possibility of a pullback remains on the table. In the event of a pullback, the first level to watch will be the 105.83 horizontal support. Below this level, the support zone formed by the 100 and 200-period moving averages comes to the fore; here, the 97.42 level, where the 200-day moving average passes, is considered a stronger reference point. If selling pressure accelerates and intensifies downward, the rising channel lower band at the 95.19 level acts as the last line of defense for the price and stands out as the technical zone where the most attractive buying opportunity could emerge in the short term.
Supports: 105.83 – 97.42 – 95.19
Resistances: 123.69 – 130.00 – 143.00
BNB/USDT
Looking at the key developments this week, the OPEN, LINEA, and HOLO projects in the BNB ecosystem have been listed on Binance Launchpool. These listings are expected to increase demand for BNB, which is used for transaction fees, and reduce the circulating supply through users staking BNB. This situation is expected to have a generally positive effect on the price of BNB.
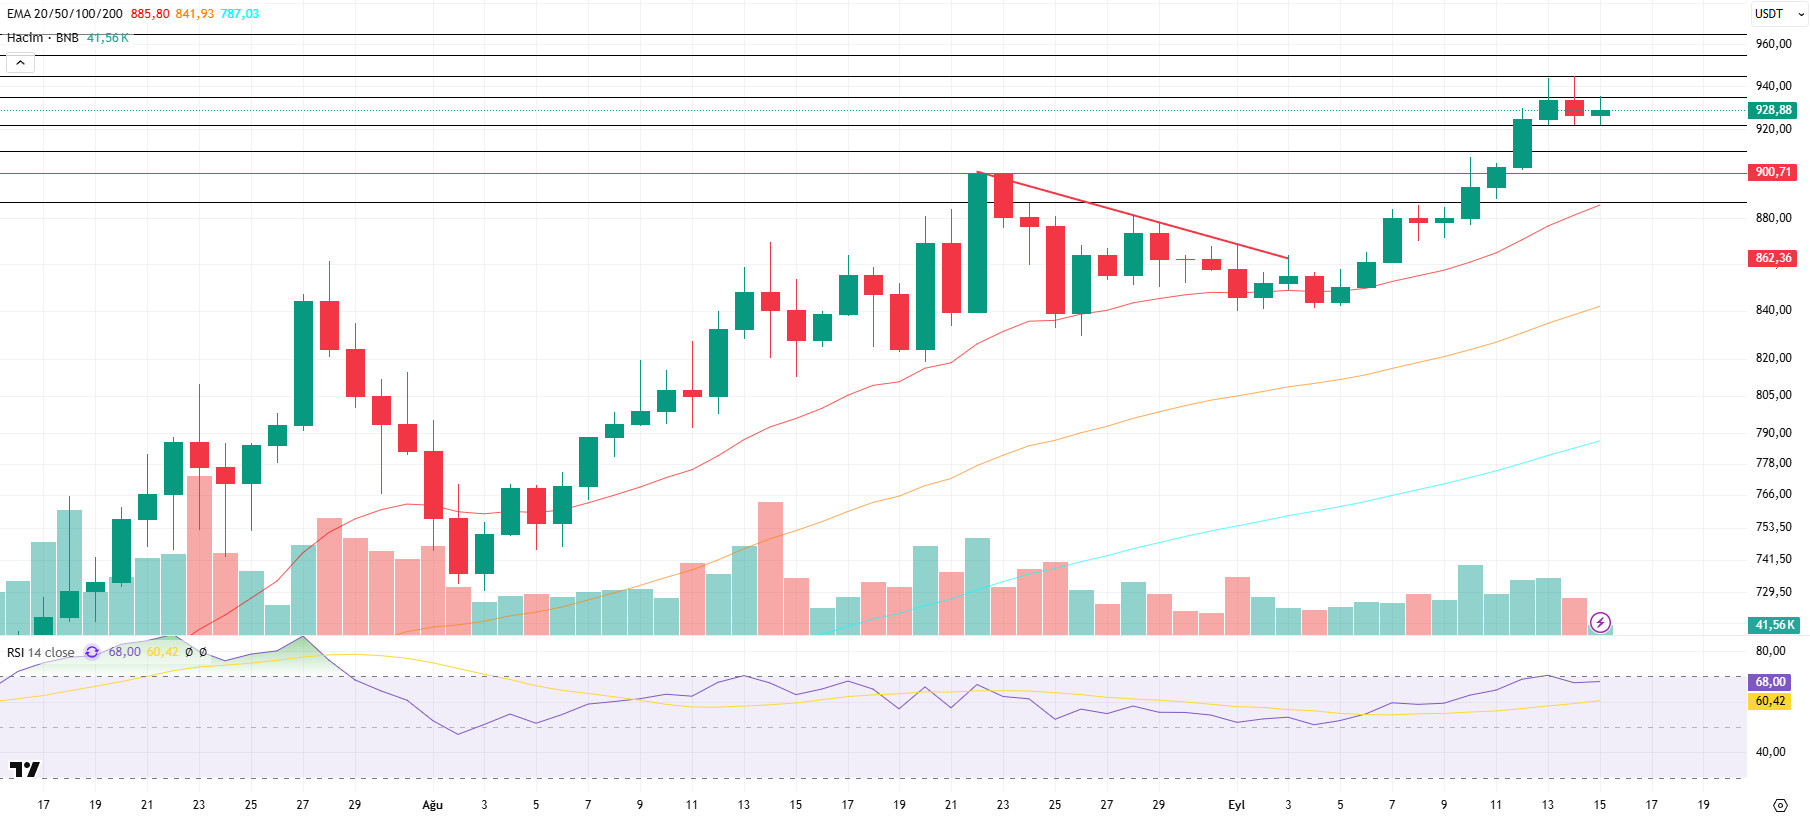
From a technical perspective, BNB/USDT, which ended its correction movement starting from the previous peak level of $900 at the $840 level, continued its rise with strong support from this region and recorded new historical highs. In this context, BNB, which approached the $950 level, experienced a correction down to the $920 level before starting the new week with a positive opening.
Technical indicators for BNB/USDT, currently trading in the $920–935 range, show that the recent increase in trading volume has supported buying. This picture indicates that the positive outlook in the market is gaining strength.
Additionally, the Relative Strength Index (RSI) has risen above the 70 level with the recent increases and remains at these levels despite short-term corrections. This technical structure reveals that positive momentum is strengthening in BNB.
Within the current outlook, if buying appetite is maintained, BNB is expected to test the $935 resistance level in the first stage. If this level is exceeded, the price may move towards the $945 and $955 levels, respectively. On the other hand, if selling pressure increases, the price may retreat back to the $920 support level. If this level is broken downward, the $910 and $900 levels emerge as critical areas to monitor.
Supports: 935 – 945 – 955
Resistances: 920 – 910 – 900
LINK/USDT
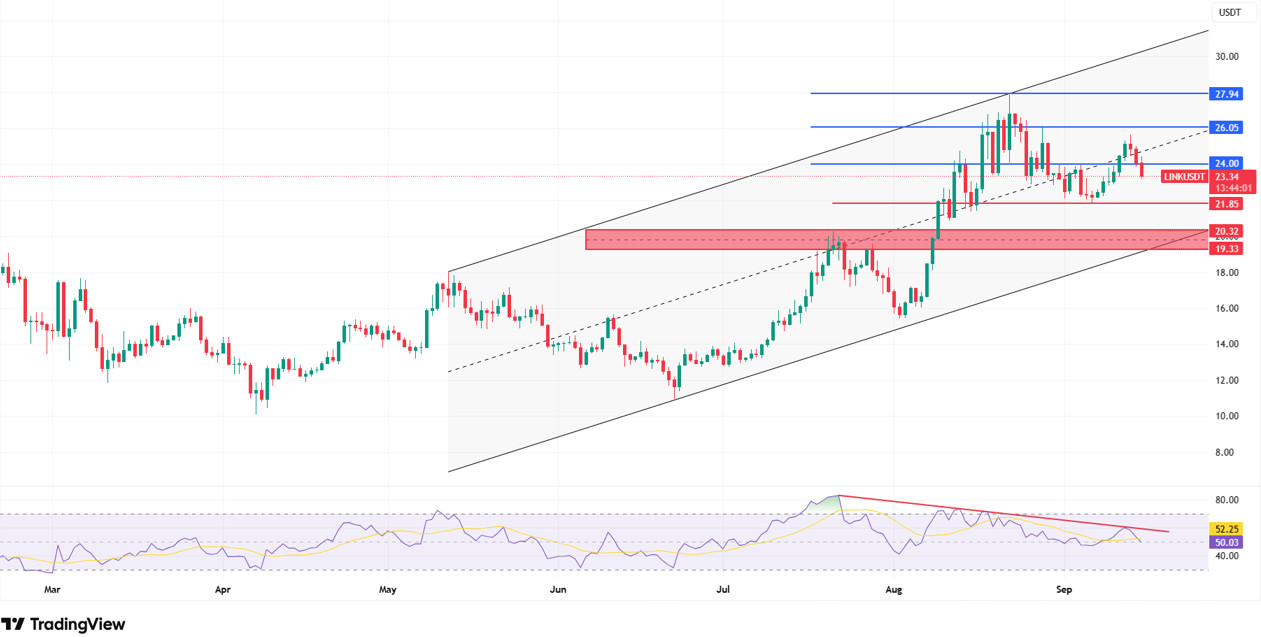
LINK is still within the rising main channel and is priced below the channel’s middle band and our horizontal resistance line at the 24.00 level. We can say that it will be difficult for the upward movement to become permanent without seeing four consecutive 4-hour closes above $24.00 and a daily close supported by volume. If sustainability is achieved above the level we mentioned, our targets could be $26.05 and $27.94, respectively.
In a downward scenario, 21.85 remains the first line of defense. If a 4-hour candle closes below this level, the price has the potential to pull back to the $20.32–19.33 level. This area could act as the strongest demand zone, both as the lower band of the channel and as a horizontal support zone, potentially enabling the price to rebound positively from here.
On the other hand, although the Relative Strength Index (RSI) indicator remains in positive territory at the 50–52 threshold, as indicated by the red line, it shows a downward trend contrary to the upward trend of the price and gives a negative divergence signal. Given that the price has failed to settle at the upper band of the channel and has encountered strong selling below the $24 level, the price could potentially fall to the demand zone of $20.32–$19.33, supported by the , in line with the negative divergence we mentioned. The change we want to see is the RSI breaking above its downward trend (roughly the 55+ zone) and the price holding above 24.00. If both of these occur simultaneously, we can say that the upward scenario is confirmed not only technically but also in terms of momentum. In the event of adverse movements, the price may fall back to the demand zone due to the effect of negative divergence.
Support levels: 21.85 – 20.32 – 19.33
Resistances: 21.85 – 20.32 – 19.33
SUI/USDT
Notable steps were taken in the Sui (SUI) ecosystem this week. Global financial technology company Circle integrated its stablecoin, USDC, into the Sui network. This development increases liquidity on the network, enabling users to have more options in DeFi (Decentralized Finance) applications. Additionally, with the integration of tBTC (tokenized Bitcoin) into Sui, approximately $500 million worth of Bitcoin liquidity can now be transferred to DeFi protocols on Sui. This integration demonstrates that Sui has become an attractive hub not only for Ethereum-based assets but also for Bitcoin holders.
Meanwhile, AMINA Bank, a regulated global bank, has begun offering custody and trading services for SUI tokens. This step is seen as an important sign that Sui is gaining acceptance at the institutional level. Overall, these integrations and institutional supports demonstrate that the Sui network is increasingly becoming a robust ecosystem for both individual investors and institutional actors.
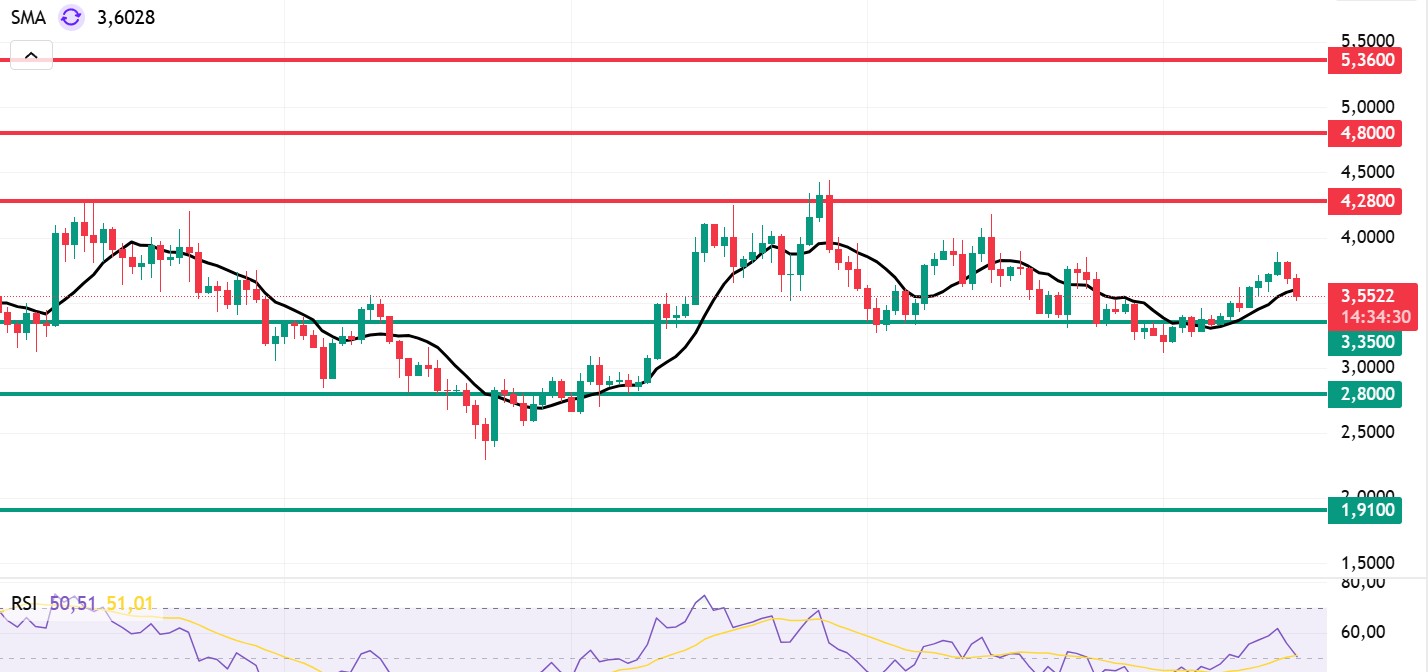
Following recent developments, when we look at Sui’s technical outlook, we see that the price has fallen on a weekly basis to around $3.55, moving sideways, partly due to fundamental developments. The Relative Strength Index (RSI) is currently in the 50.51–51.01 range. This range indicates that the market is trading close to the sell zone; however, if the RSI weakens and falls to the 35.00–40.00 range, it could signal a potential buying point. If the price moves upward, the resistance levels of $4.28, $4.80, and $5.36 can be monitored. However, if the price falls to new lows, it could indicate that selling pressure is intensifying. In this case, the support levels of $3.35, $2.80, and $1.91 come to the fore. Based on the trend line, a pullback to $2.80 appears technically possible. According to Simple Moving Averages (SMA) data, Sui’s average price is currently at $3.60. If the price remains below this level, it indicates that the current upward trend may not continue technically. The downward trend of the SMA also supports this situation.
Support levels: 1.91 – 2.80 – 3.35
Resistances: 4.28 – 4.80 – 5.36
ADA/USDT
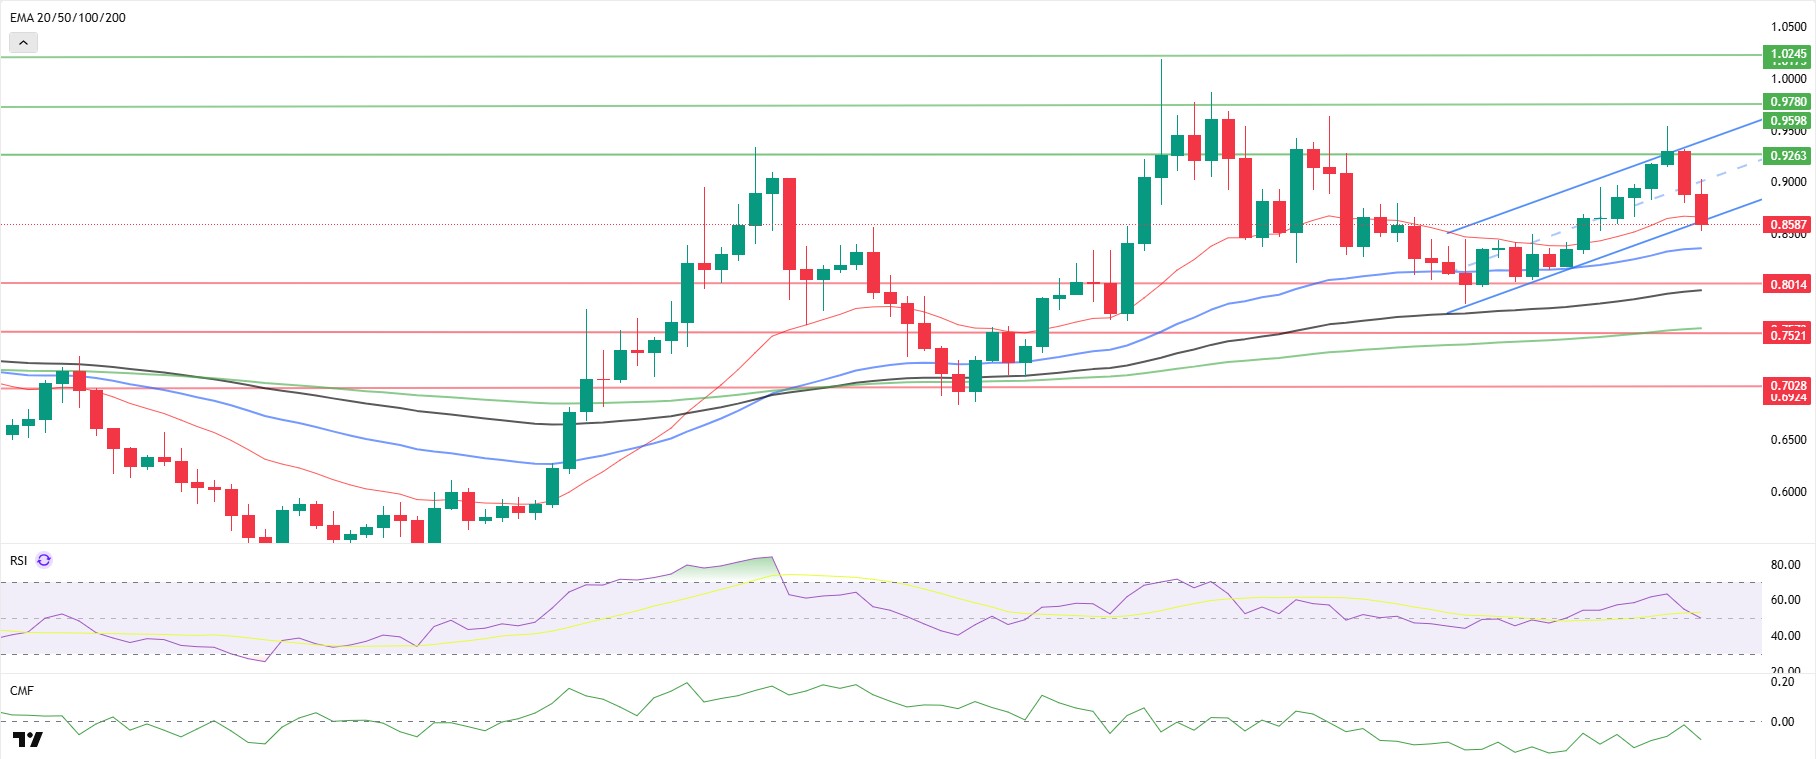
ADA ended last week with a 1.55% increase, starting the new week above the $0.8500 level. Open Interest data rose by approximately 3.67% to around $1.92 billion. Looking at liquidation levels for derivatives data, long positions represent 72% of the market, which may indicate a possibility of an ADA rise in the short term but also increases the risk of liquidation.
Technically, ADA is consolidating near the $0.8900 Fibonacci retracement level and the $0.9500 zone, which is defined as a significant supply area. If there is a confirmed close above $0.8900, the first target could be $0.9500, and if momentum continues, the $1.0245 level could be our first resistance level in the wide band range. The price continues to move within the ascending channel on the daily chart. It is particularly important for the price to close above the 20-day Exponential Moving Average (EMA 20 – Red Line) and (EMA 50 – Blue Line) for the uptrend to continue. The Relative Strength Index (RSI) continues to move near the bullish zone, falling to 49 levels, while the Chaikin Money Flow (CMF-20) fell to -0.11 levels, indicating a potential for selling. The decrease in money inflows may keep the CMF in negative territory, and the uncertainty between the two indicators may signal a selling effect. Macroeconomic data to be released this week or positive news regarding the Cardano ecosystem could bring the $0.9500 level into focus as a strong resistance point for . If the decline begins, the $0.8075 level will be the key support level to watch.
Supports: 0.8075 – 0.7380 – 0.7170
Resistances: 1.1943 – 1.0245 – 0.9500
Legal Notice
The investment information, comments, and recommendations contained in this document do not constitute investment advisory services. Investment advisory services are provided by authorized institutions on a personal basis, taking into account the risk and return preferences of individuals. The comments and recommendations contained in this document are of a general nature. These recommendations may not be suitable for your financial situation and risk and return preferences. Therefore, making an investment decision based solely on the information contained in this document may not result in outcomes that align with your expectations.