
Weekly Technical Analysis Report
BTC/USDT
Last week, hawkish statements from the Fed gained traction, while data delays due to the government shutdown deepened uncertainty surrounding the December meeting. As the US government reopened, the Trump administration sent mixed signals on tariffs, including both retreats and new warnings. Easing tensions on the EU-China trade front and progress in the Nexperia process offered positive signs for the global supply chain. Conversely, rapidly rising tensions on the Japan-China-Taiwan axis emerged as the week’s most critical geopolitical risk.
Looking at the daily technical picture after all these developments, BTC deepened its downtrend from the ATH level of 126,200 points, which it reached with its golden cross pattern, falling to the major uptrend level of 93,000. With the reaction it received from there, the price rose above the 95,000 level, experiencing an 8% loss on a weekly basis and a 12.67% loss on a monthly basis.
Looking at technical indicators, the Wave Trend (WT) oscillator is giving buy/sell signals in the oversold zone on a daily basis, while showing an indecisive picture. The Squeeze Momentum indicator (SM) continues to try to move into positive territory after reaching maximum weakness in the negative zone. In moving averages, the golden cross structure began to weaken as the 50-day SMA crossed above the 200-day SMA.
Looking at weekly liquidation data, the buying level is weakening, while the selling level is gradually intensifying. In this regard, the first selling level is accumulating within the 97,000-98,000 band, while other selling levels are concentrated above the 100,000 level in a fragmented manner.
In summary, with the reopening of the US government, most federal agencies have recalled their staff and begun to gradually resume operations. However, hawkish statements from Fed members continue to suppress expectations of interest rate cuts. Technically, the price appears to be continuing its downward trend, while weekly liquidity data highlights the weight of the selling tier. In the coming period, holding above the 95,000 reference level is of great importance for a new upward movement. Closings above this level will bring a renewed move towards the 100,000 level, while 95,000 remains a critical reference zone in the event of possible selling pressure.
Supports: 95,000 – 92,000 – 90,0000
Resistances: 97,000 – 100,000 – 103,000

ETH/USDT
Ethereum showed a weak performance on the institutional side last week. During the period of November 7–13, 2025, there was a total net outflow of $597 million from Spot Ethereum ETFs. The absence of positive inflows over five trading days and the negative flow series reaching three days revealed a weakening of institutional demand. Strong outflows, particularly from BlackRock ETHA and Grayscale ETHE, showed that the decline in market risk appetite had spread to the institutional level. By the end of the week, the cumulative net inflow of Spot Ethereum ETFs fell to $13.33 billion, and the loss of momentum compared to previous weeks became apparent.
During the same period, on-chain data showed a more balanced picture. Despite the price decline, the Ethereum Total Value Staked increased from 36.103 million ETH to 36.195 million ETH, signaling that long-term investor confidence remains strong. This increase in staking indicates continued confidence in Ethereum’s underlying structure despite price pressure.
Looking at the market structure, Cumulative Volume Delta (CVD) data revealed that the downward pressure came mainly from the futures markets. Increased buying support in the spot markets indicates that not all sales were panic-driven and that long-term investors viewed the decline as an opportunity.
On the liquidity side, the Chaikin Money Flow (CMF) indicator is still in negative territory but has started an upward reversal. The start of liquidity inflows, albeit limited, indicates that the selling momentum is weakening and the market is slowly seeking equilibrium.
On the momentum side, the Relative Strength Index (RSI) remained flat near the oversold zone for most of the week before turning upward. This reversal signals that the groundwork for a short-term upward movement is beginning to form. However, the sustainability of the momentum recovery will depend on the price maintaining critical levels.
The Ichimoku indicator shows that Ethereum is still technically in a weak zone. The price remaining below the Tenkan and Kijun lines of the kumo cloud indicates that a clear trend reversal has not yet occurred. Pricing below the cloud suggests that medium-term pressure continues and that upward attempts may be limited.
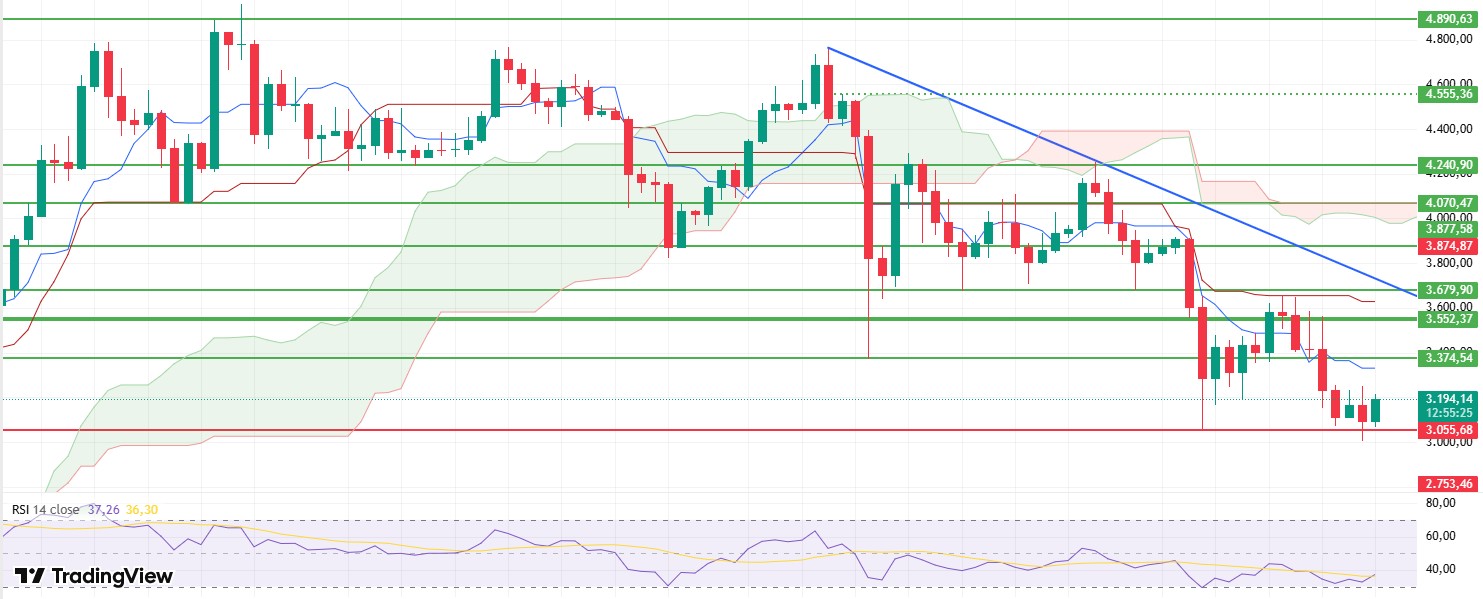
Considering the overall technical picture, it is crucial that the ETH price does not lose its $3,055 support level during the week. If it stays above this level, the price is likely to retest the $3,374 region first and move towards higher resistance levels if it breaks through. However, daily closes below the $3,055 level could disrupt the positive structure and lead to deeper selling pressure.
Supports: 3,055 – 2,753 – 2,520
Resistances: 3,374 – 3,552 – 3,679
XRP/USDT
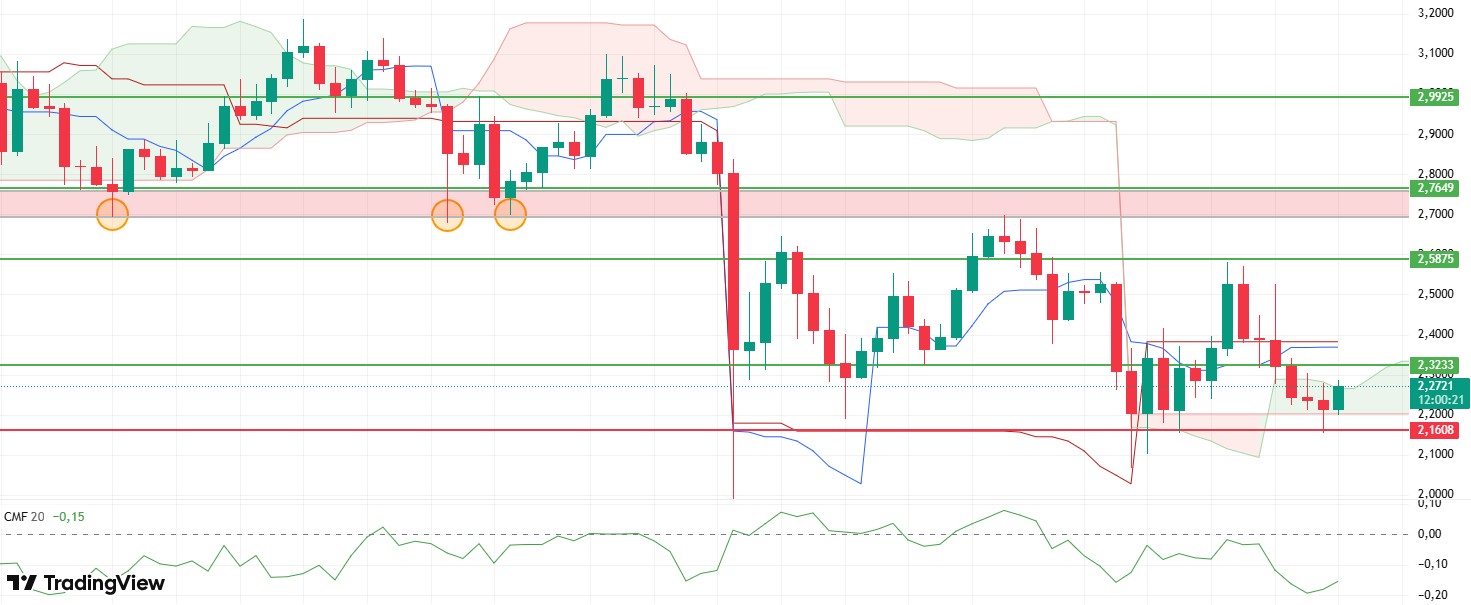
After being rejected from the strong resistance at the $2.58 level last week, the XRP price entered a short-term weakening phase and retreated to the $2.16 support zone amid selling pressure. Reactionary buying from this level at the beginning of the week managed to push the price back above $2.27, and short-term stabilization signals emerged.
Data flow on the liquidity side indicates that the outlook has not completely deteriorated. Although the Chaikin Money Flow (CMF) indicator continues to trade in negative territory, its upward trend is noteworthy. This structure reveals that, albeit limited, liquidity inflows on the buy side are continuing and buyers are reappearing in areas where selling has intensified.
The Relative Strength Index (RSI) indicator also presents a parallel picture to the structure seen in Ethereum. After moving sideways just above the oversold zone and then starting to move upward, the RSI signals that short-term momentum is beginning to recover and buyers are gaining strength.
The Ichimoku indicator continues to be one of the main guides determining the medium-term technical structure of the price. The price maintaining the lower band of the kumo cloud indicates that the overall structure has not yet deteriorated and that the medium-term positive outlook continues. Conversely, the price remaining below the Tenkan and Kijun levels indicates that the trend reversal is not yet complete. Although the price may react, it needs to close above these levels to gain strong momentum.
The overall technical picture shows that the upside potential has not completely disappeared. As long as the $2.16 support level holds for the rest of the week, the price can be expected to head back towards the intermediate resistance zone at $2.32. If this level is breached, the possibility of retesting the $2.58 region will increase. Conversely, if the $2.16 level is lost, selling pressure is likely to deepen, and lower support areas may come into play.
Supports: 2.1608 – 1.9077 – 1.6189
Resistances: 2.3233 – 2.5875 – 2.7649
SOL/USDT
Last week in the Solana ecosystem:
- Bitwise’s Solana Staking ETF now offers options trading and provides derivatives to institutional investors just two weeks after the fund’s launch.
- Grayscale launched options trading for the Solana Trust ETF (GSOL) with 0% commission and a 7% stake reward.
- Alameda unlocked $30 million worth of tokens, equivalent to 193,000 SOL.
- The Bolivian government tested a blockchain solution on Solana during the second round of elections, using TuVotoSeguro to create tamper-proof, time-stamped records of ballot photos.
- The Solana company listed on Nasdaq plans to tokenize its shares through Superstate.
- Solana-focused Upexi approved a $50 million share buyback as digital asset treasuries turn to buybacks.
- VanEck filed an 8-A form indicating that its Solana spot ETF will be launched soon.
- The USDC Treasury minted $250 million in USDC on Solana.
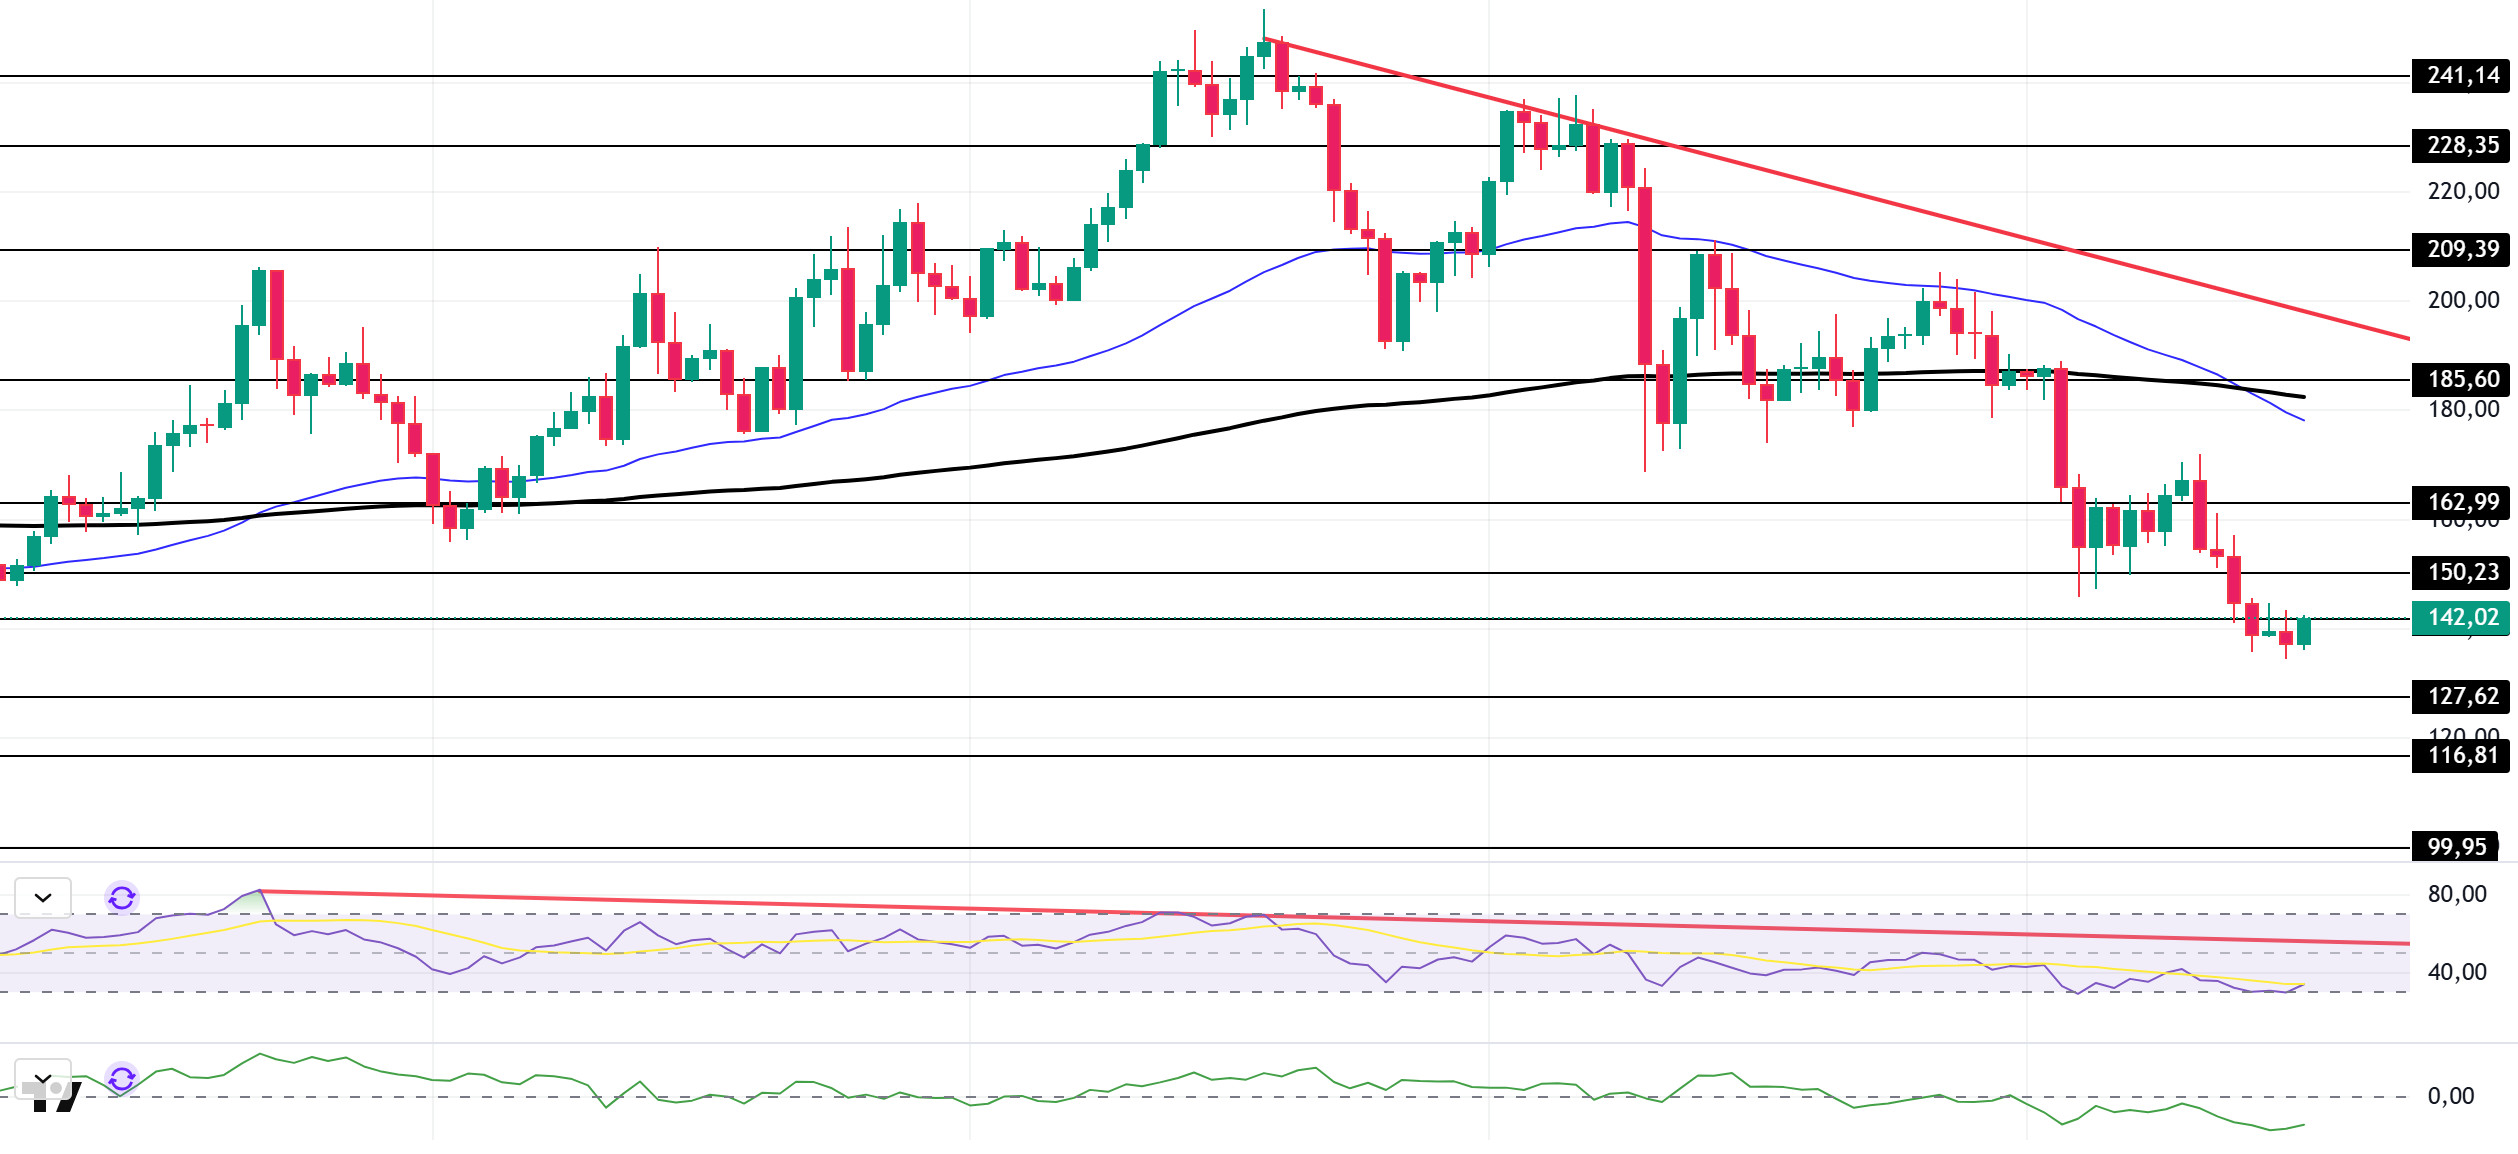
The SOL price experienced a pullback on the daily chart this week. The asset remained in the lower region of the downtrend that began on September 18. The price tested the 200 EMA (Black Line) moving average and the strong support level of $185.60 as support but failed to hold there, deepening its decline. It then tested the strong resistance level at $162.99 but failed to hold above this level, continuing its decline. Currently testing the $141.80 level, the price may continue to decline if it fails to break above this level. If an uptrend begins, it may test the 50 EMA (Blue Line) moving average as resistance.
The asset is trading below its 50 EMA (Exponential Moving Average – Blue Line) and 200 EMA (Black Line) moving averages; this indicates that the asset is trending downward. Additionally, the 50 EMA has crossed below the 200 EMA. This signals the start of a technical “dead cross” formation, indicating increased downside potential in the medium term. The RSI (14) has fallen to the oversold zone. At the same time, the indicator has remained below the downward trend line that began on July 22. These factors indicate increased selling pressure. The Chaikin Money Flow (CMF-20) remains in negative territory. At the same time, increased capital outflows could push the CMF-20 indicator deeper into negative territory. If macroeconomic data remains positive and developments in the ecosystem continue to be favorable, the first major resistance level of $162.99 could be retested. Conversely, in the event of potential negative news flow or deterioration in macro data, the $116.81 level could be monitored as a potential buying opportunity.
Supports: 127.62 – 116.81 – 99.95
Resistances: 141.80 – 150.23 – 162.99
DOGE/USDT
Poain BlockEnergy Inc. (“Poain”) has launched an AI Smart Staking program to help DOGE holders diversify their income streams.
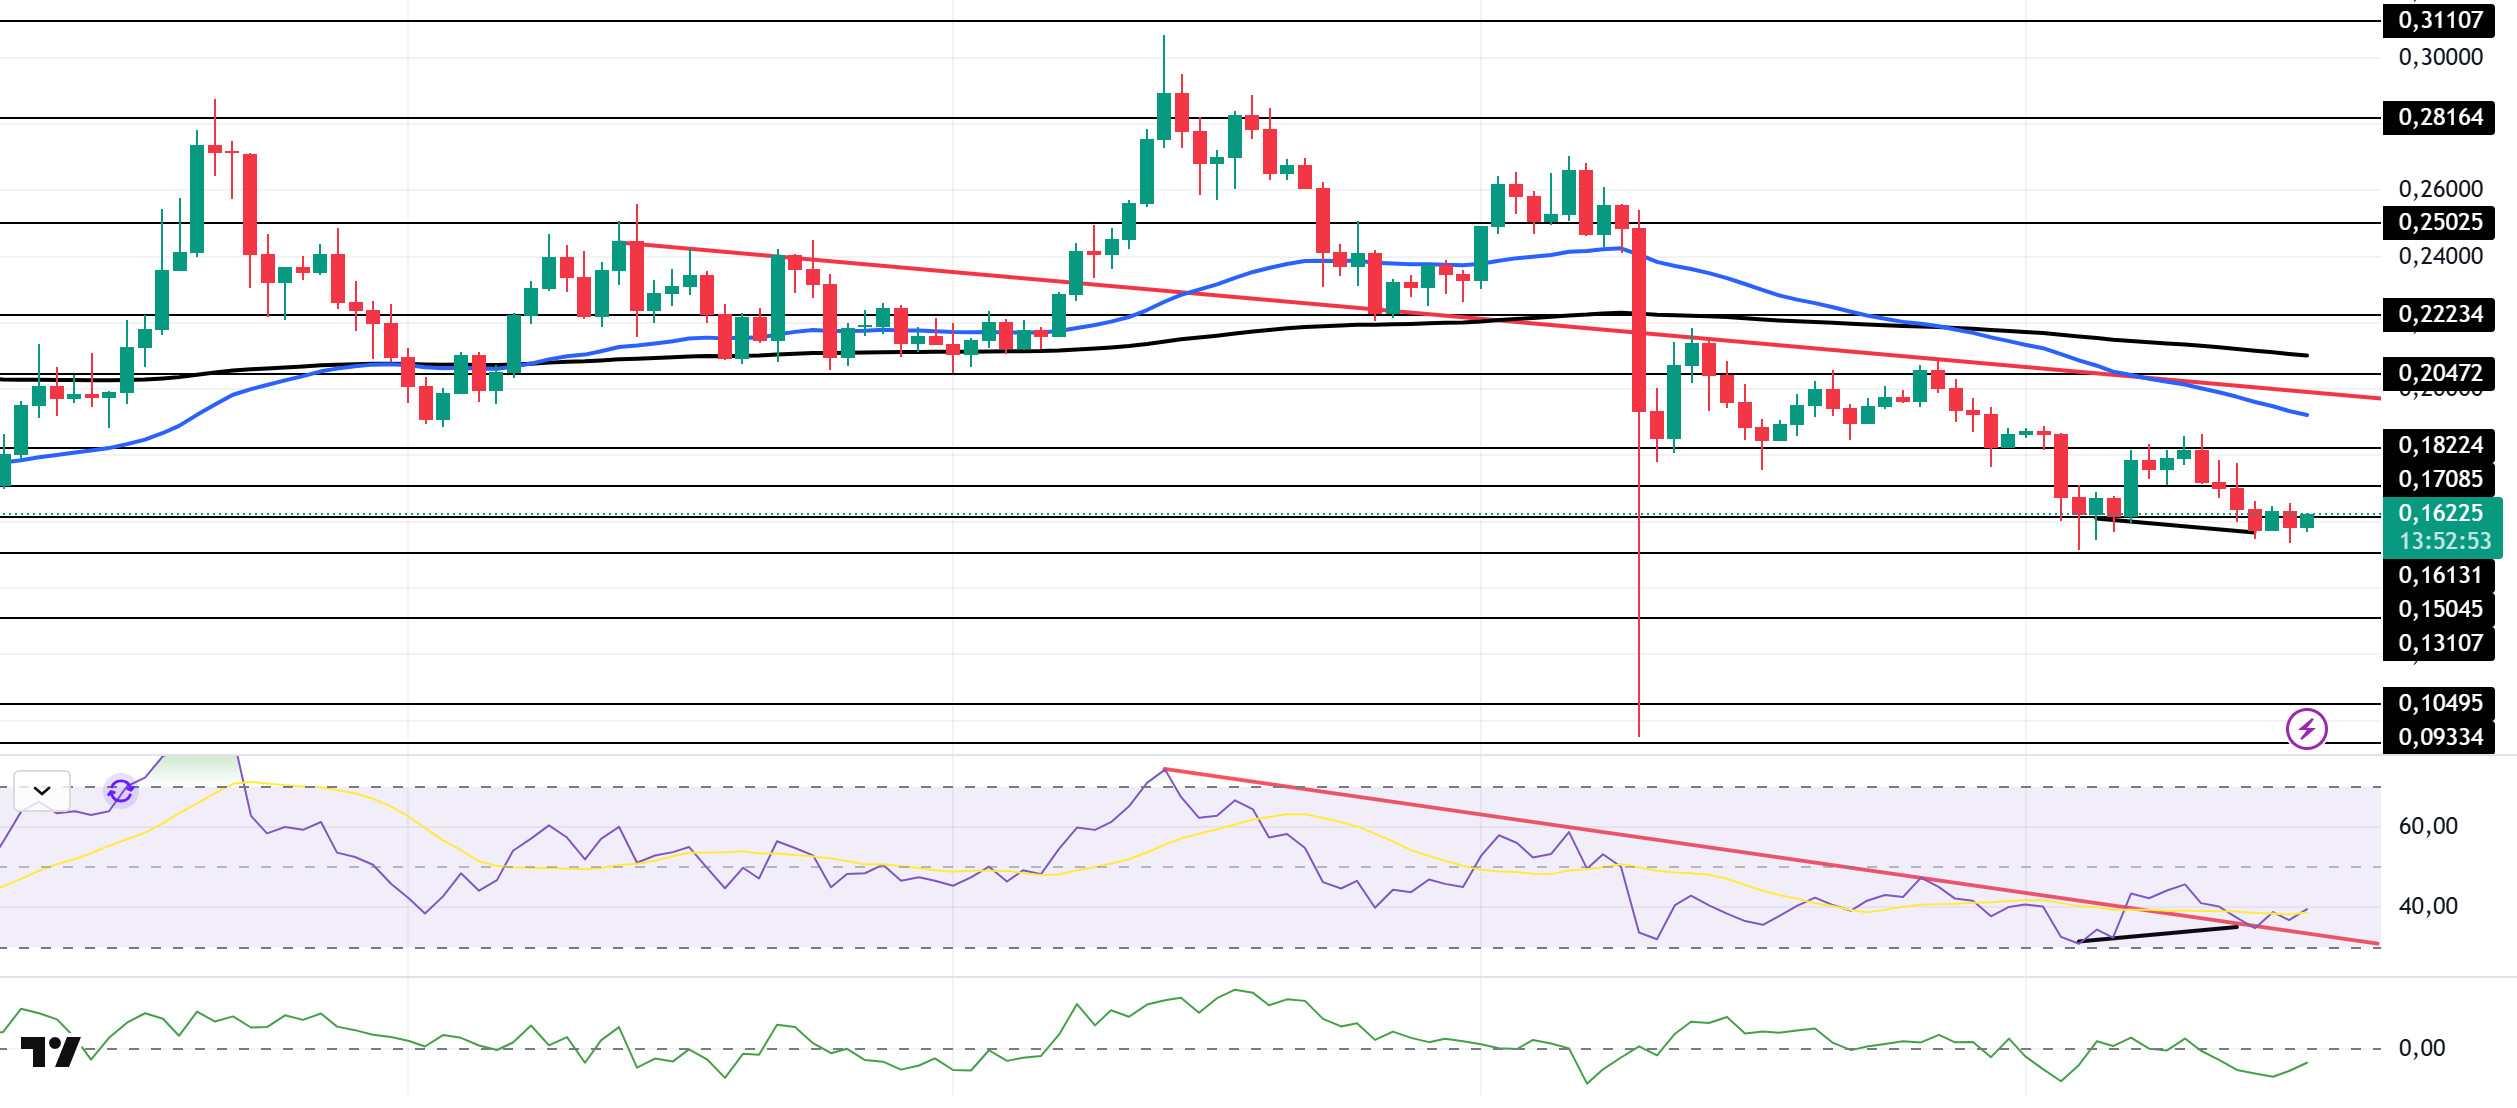
DOGE has been declining on the daily chart since last week. The price tested the strong support level of $0.18224 for the third time, then tested this level as resistance but failed to break through, deepening the pullback to . Currently testing the $0.17085 level as resistance, the price could test the 50 EMA (Blue Line) moving average as resistance if it gains upward momentum. If the pullback continues, the $0.13107 level could act as support.
The asset continued to trade below the 50 EMA (Blue Line) and 200 EMA (Exponential Moving Average – Black Line) moving averages. This indicates that the asset is in a downward trend. On the other hand, the 50 EMA moving average being below the 200 EMA moving average shows us that the “dead cross” formation is continuing. This also indicates that the asset has an increased potential to lose value at this moment. The Chaikin Money Flow (CMF–20) indicator has moved into negative territory. Money inflows continue to decline. This could push the CMF-20 deeper into negative territory. Looking at the Relative Strength Index (RSI-14) indicator, it remained in the middle of the negative zone. At the same time, it moved into the upper zone of the downtrend that has been ongoing since September 13. This indicates that buying pressure could build. In the event of macroeconomic risks or negative news from the ecosystem, the $0.13107 level can be monitored as strong support. On the other hand, if the upward movement gains strength, the $0.18224 level comes to the fore as the first strong resistance level.
Supports: 0.16131 – 0.15045 – 0.13107
Resistances: 0.17085 – 0.18224 – 0.20472
AVAX/USDT
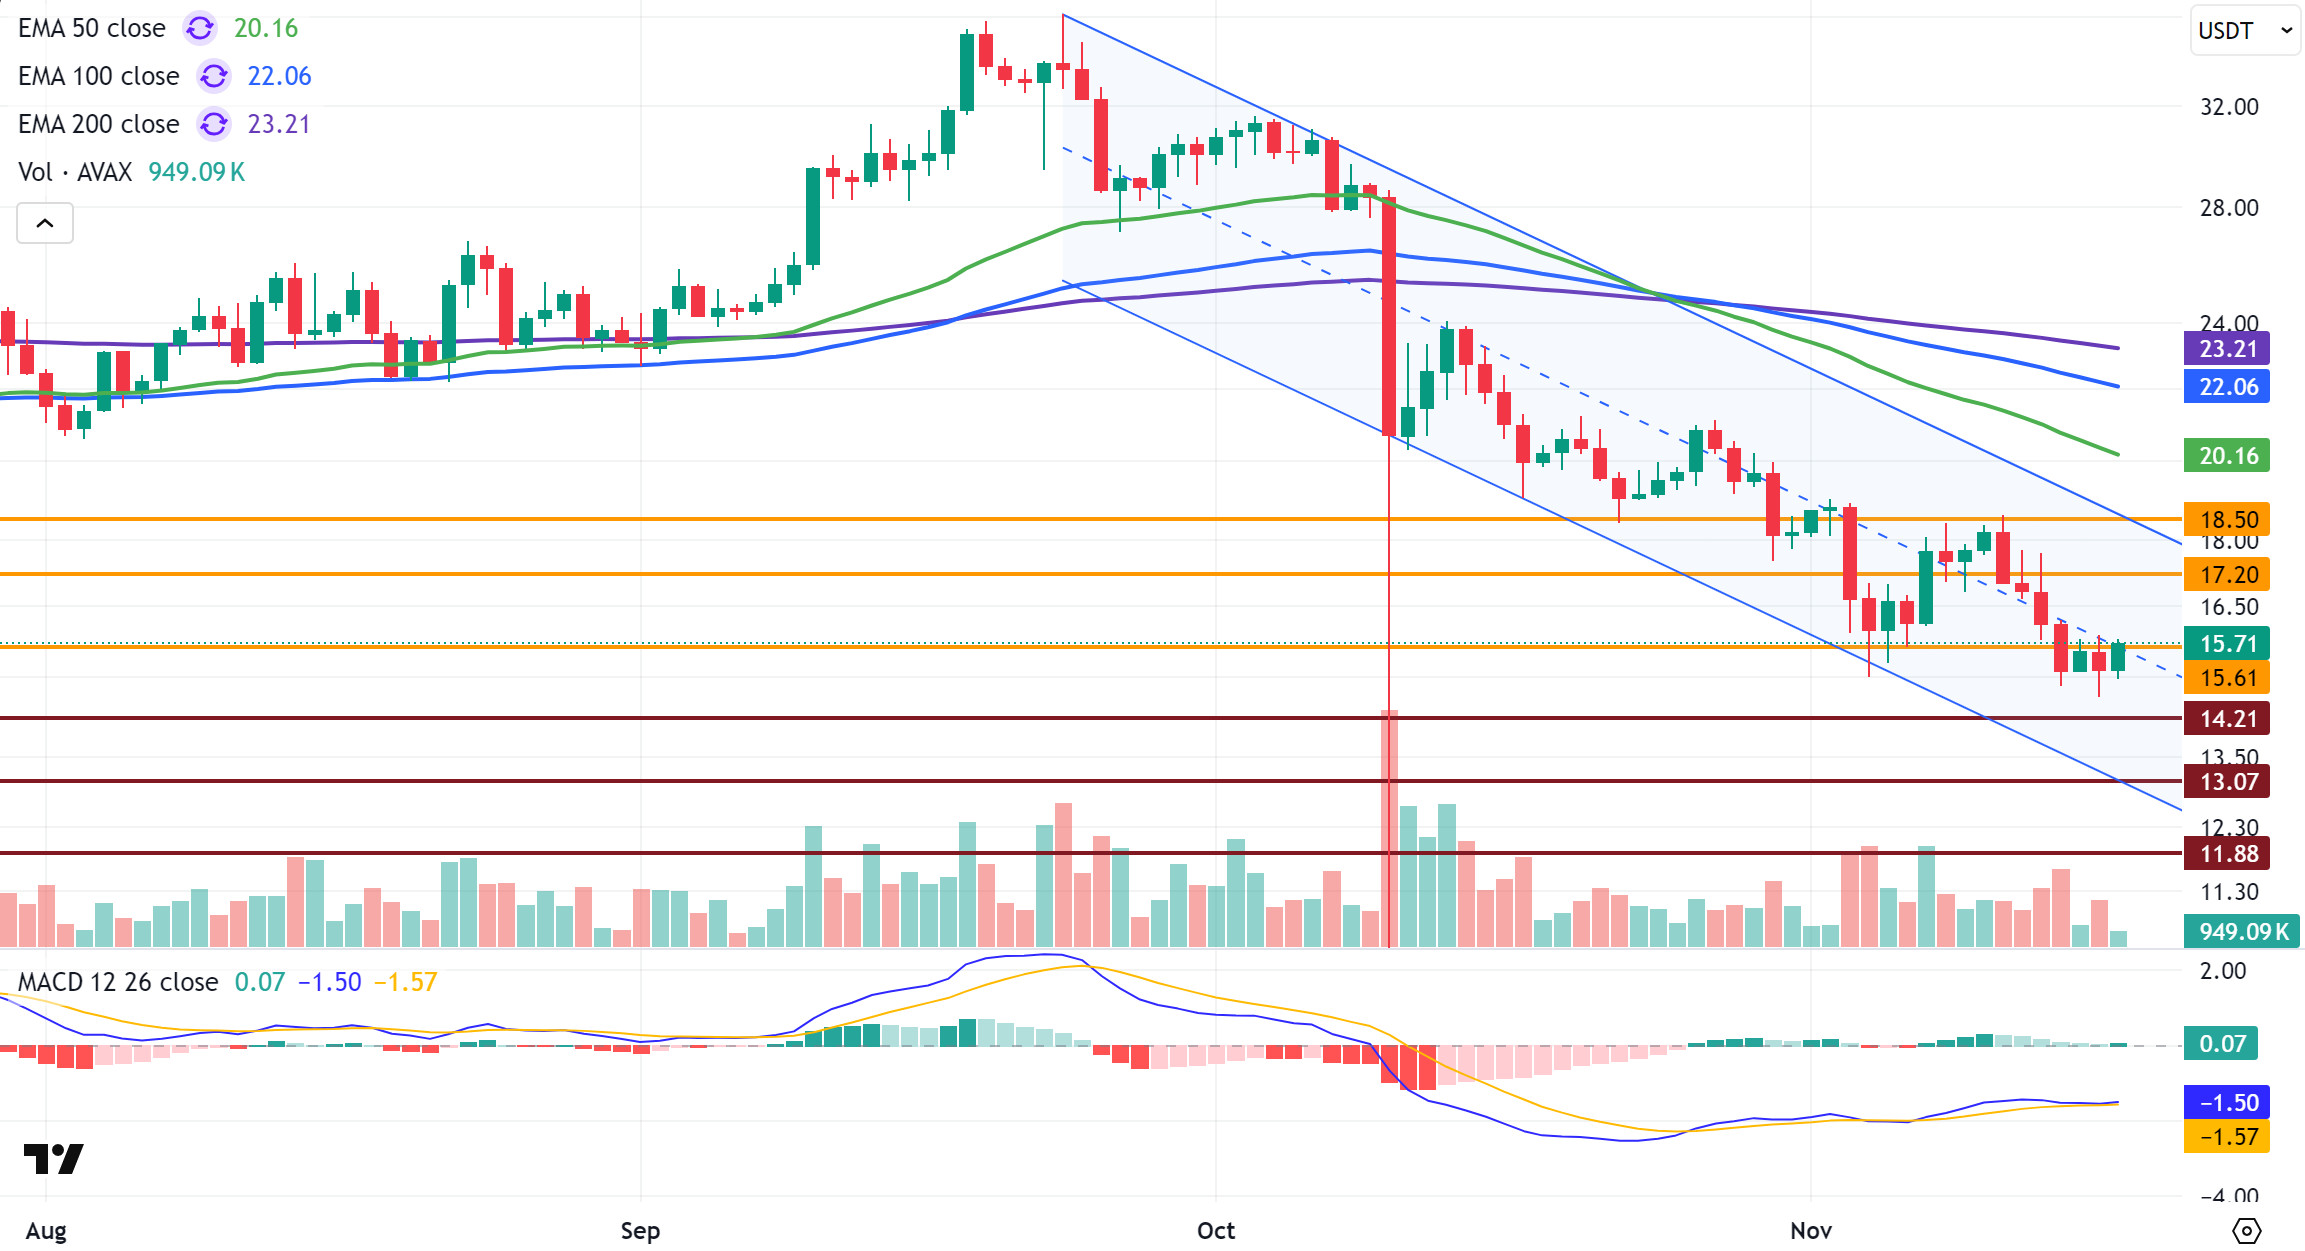
AVAX started last week at $17.77 and experienced a 14.75% loss in value during the week under strong selling pressure. Unable to maintain its position above the $18.50 resistance level in the early days of the week, AVAX declined with selling pressure from this region. Continuing its decline, AVAX fell below the $17.20 level, gaining momentum and falling to $14.62 during the week. The weekly close was at $15.15. Thus, AVAX fell below both the $17.20 and $15.61 support levels, presenting a technically weak outlook. Although AVAX tested the $15.61 level on the first day of the new week, signaling a slight recovery, it has not yet managed to maintain stability above this level. The ongoing lack of volume and weak buying interest in the cryptocurrency market, known as ” ,” is limiting AVAX’s recovery potential. Although there have been positive developments on the ecosystem side, this has not provided a meaningful positive contribution to the price in the short term.
On the daily chart, the Moving Average Convergence/Divergence (MACD) line is just above the signal line, but momentum remains weak. The MACD line is moving in negative territory and is flat. This outlook indicates that a trend reversal has not yet been confirmed. Although the MACD outlook is neutral, the convergence between the lines indicates that a possible breakout could be decisive in terms of direction. If the MACD moves into positive territory, upward momentum could gain strength and the likelihood of resistance levels being broken could increase. Otherwise, momentum could remain weak and, with increased selling pressure in resistance zones, the price could fall again. AVAX is still trading below all critical Exponential Moving Average (EMA) levels. These levels have formed a strong resistance band by converging above the price. This structure indicates that the trend remains in negative territory. Furthermore, the price moving further away from these levels confirms that selling pressure is strengthening and that the market does not yet have sufficient momentum for a recovery.
In the technical outlook, the $15.61 level is the first important resistance for AVAX in the short term. If this level is broken and sustained, AVAX could test the $17.20 and $18.50 levels in its rise. The $18.50 level remains the strongest resistance in the short term. If AVAX fails to break through this resistance zone in an upward movement, it may face renewed selling pressure. Conversely, in a decline, the $14.21 level is the first support zone for AVAX. Closings below this level could increase selling pressure, and AVAX could retreat to the $13.07 and $11.88 support zones in a continued decline. In the overall picture, momentum on the MACD side is weak and neutral, while the EMA structure remains in negative territory. This indicates that AVAX is under pressure in the short term. Unless it stays above $15.61 and trading volume increases, recovery attempts may remain limited. However, if the price rises above $17, a rebound towards the upper band of the bearish channel may occur.
(EMA50: Green Line, EMA100: Blue Line, EMA200: Purple Line)
Supports: 14.21 – 13.07 – 11.88
Resistances: 15.61 – 17.20 – 18.50
SHIB/USDT
This week, the Shiba Inu ecosystem reshaped itself around supply management regulations and DeFi volume movements, while L2 usage and price reactions remained relatively cautious. The burn channel accelerated significantly in supply discipline, removing over 800 million SHIB from circulation in the last seven days, and the weekly pace reached its highest levels in recent months with a single address burning over 600 million tokens. During the same period, accumulation signals strengthened in both whale wallets and off-exchange addresses, while net exchange outflows in the hundreds of billions around November 15–16 fueled the narrative of “moving to cold wallets instead of selling.”
On the DeFi side, the total value locked on Shibarium rose more than twice from its November lows, with TVL increases in major protocols, particularly ShibaSwap and WoofSwap, drawing attention. However, daily transaction counts in L2 activity exhibited a volatile pattern with short-lived spikes followed by sharp declines, maintaining the fragility in the efficiency of the transfer mechanism spanning from BONE fees to SHIB burns. The week’s strongest narrative came from the regulatory front: SHIB’s green list status in Japan and the proposed 20% flat tax regime for this basket symbolically brought the token closer to the same trusted category as Bitcoin and Ethereum, while providing a framework that strengthened the perception of a legal foundation for mid-term institutional and retail demand. Meanwhile, a teaser for a new product shared by the team, labeled “wallet-friendly and fully SHIB-identity” and branded as Bitget Wallet, reminded us that the ecosystem continues to build new layers focused on wallets and use cases despite price pressure, combining this accumulation and regulation theme with product-side expectations.
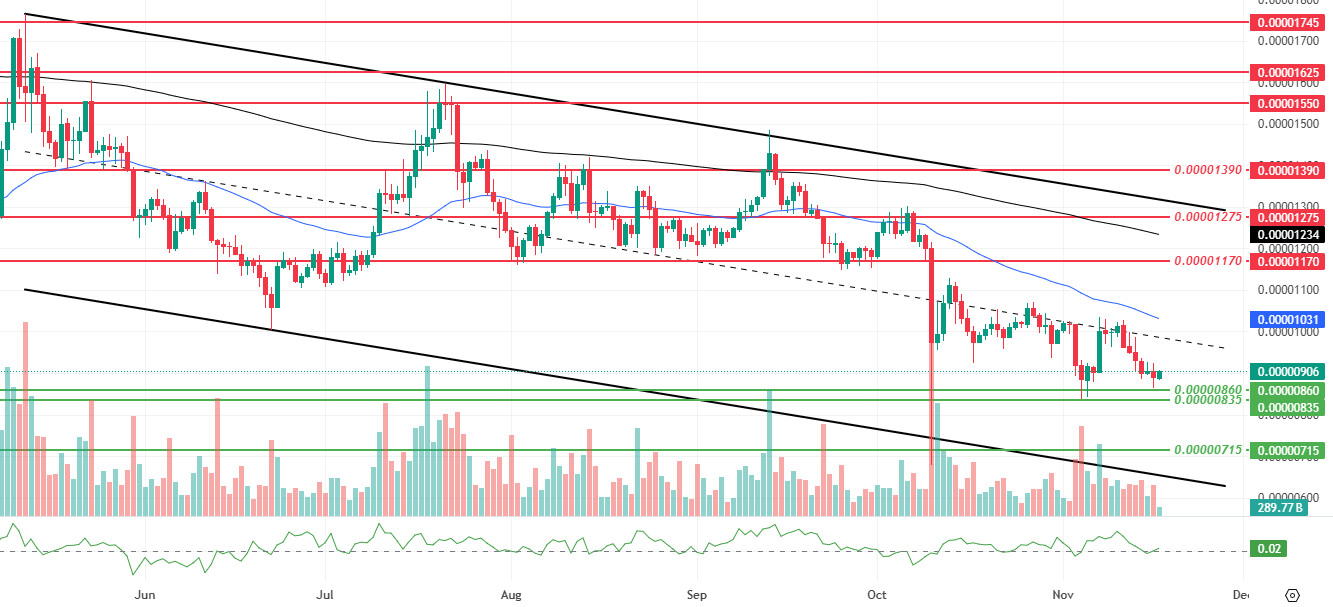
This week’s technical outlook shows that pressure remains on sellers, with broken support levels and a weakening trend structure. The price breaking below the $0.00000960 and $0.00000910 support levels weakens the possibility of short-term horizontal stabilization while confirming the downward trend within the falling channel. Decreases in volume, momentum, and volatility suggest that sales are continuing more as a “drift” rather than becoming aggressive, and that attempts at a rebound are limited for now. The price’s failure to break above the middle band of the descending channel and its continued trading below the 50-day Exponential Moving Average (EMA) and 200-day EMA ( ) indicates that there is no clear reversal signal in the main trend yet. However, the Chaikin Money Flow (CMF) indicator remaining in positive territory suggests that, despite selling pressure, liquidity has not completely dried up on-chain and spot, and selective entries are continuing.
From an upward movement perspective, $0.00001170 stands out as the first significant threshold; Closing above this level and subsequently retaking the $0.00001275 and $0.00001390 resistance levels with increasing volume could carry the rebound towards the upper band of the descending channel and pave the way for a recovery approaching the EMA 50 and EMA 200. In this scenario, the nature of the movement could evolve from being “just a short-term short squeeze” to a stronger correction structure. Below, failure to hold the $0.00000860 support could accelerate the decline and pave the way for a test of the $0.00000835 band; below this level, $0.00000715 could act as a broader and more medium-term support. In summary, while the price continues to trade below the EMA 50 and EMA 200, the broken support levels and weakening volume structure indicate that upward attempts are still corrective in nature; a sustained change in direction requires both a recovery in volume and volatility and a clear break above the descending channel structure. (EMA200: Black line, EMA50: Blue line)
Supports 0.00000860 – 0.00000835 – 0.00000715
Resistances 0.00001170 – 0.00001275 – 0.00001390
LTC/USDT
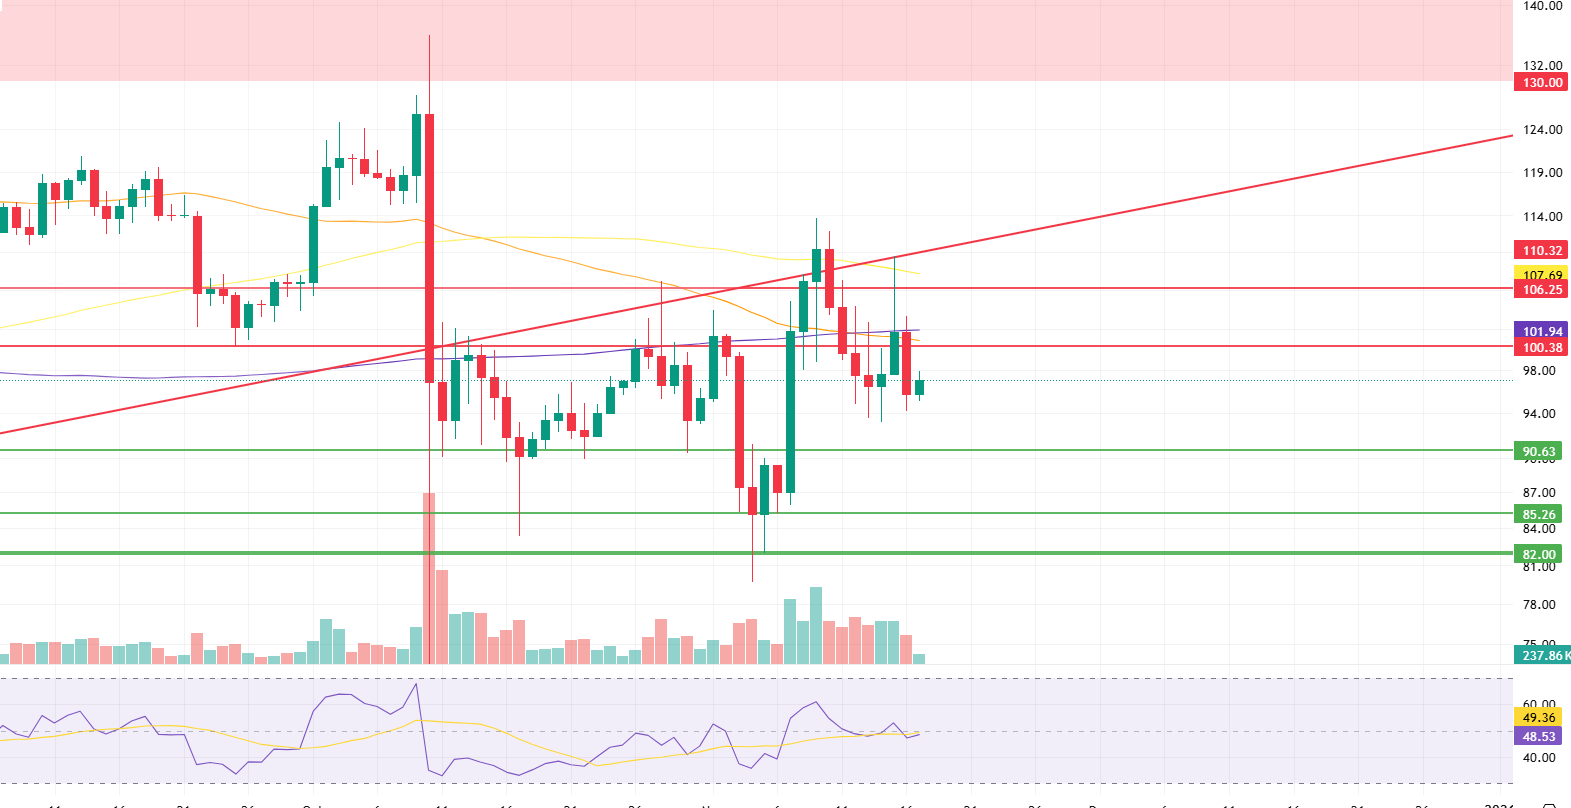
Litecoin (LTC) ended last week with a sharp 13.16% decline, starting the new week at $95.79. LTC also recorded a 3.51% loss against Bitcoin during the same period, experiencing a negative period in terms of market value and reaching a total market value of approximately $8.2 billion. With this rise, Litecoin dropped one place in the global cryptocurrency ranking to 19th place. On the futures side, the total open interest increased by approximately 11% compared to last week. Most of this increase stems from the rise in short positions opened during this period. On the other hand, the fact that funding rates are partially trending towards negative territory indicates that market participants generally expect a decline.
From a technical perspective, the Litecoin price continues to remain below the 100-period (yellow line), 50-period (orange), and 200-period (purple) moving averages. This outlook indicates that the price is generally trending negatively in both the short and long term. When examining the chart formation, it is observed that LTC is still trading just below the rising trend resistance. The sharp decline last week clearly reversed this trend downward, making it easy to say that the outlook has turned completely negative. However, the possibility of upward reactions is still on the table. If these reactions occur, the horizontal resistance level currently at $100.38 is technically a critical level. Sustained closes above this zone could turn Litecoin’s outlook positive in the short term and enable the price to enter a bullish pattern targeting $106.25. In particular, a break above the rising trend line at $110.32 would create a whole new scenario where the negative outlook could turn positive.
The first minor support level in downward price movements stands out at $90.63. This area can be considered the first line of defense where short-term buyers could re-enter, as it is an area where the price has reacted several times in the past when coming both from below and above. If this support is broken, the second and stronger support zone that could limit the decline is the $85.26 level. In a deeper pullback scenario, the $82.00 level stands out as a critical support area on the weekly chart. This zone coincides with the bottom levels and can be considered an area where a possible bounce could be expected.
Supports: 90.63 – 85.26 – 82.00
Resistances: 100.38 – 106.25 – 100.32
BNB/USDT
This week, the ALLO project, part of the BNB ecosystem, was listed on Binance Launchpool. This listing is expected to increase demand for BNB, which is used for transaction fees, and reduce the circulating supply through users staking BNB. These dynamics are expected to have a positive impact on the BNB price in the medium term.
From a technical perspective, the correction that began after the all-time high (ATH) resulted in a pullback to the $900 support zone identified in previous technical analyses. After seeking support above these levels for a while, the asset ended its downward momentum with the new candlestick formations that followed and turned its direction upward again. With this rise, the price gained positive momentum up to the descending trend line.
Currently, the BNB/USDT pair presents a positive picture, but it is facing selling pressure below the descending trend line and appears to be searching for direction.
Technical indicators for BNB, currently trading in the $900–940 range, suggest that the low trading volume seen recently is limiting the positive outlook. Current volume levels are not considered strong enough to break the downtrend. Additionally, the Relative Strength Index (RSI) indicator is seen trading at relatively low levels due to weak momentum.
According to the technical picture, if buying appetite is maintained and market momentum recovers, BNB is expected to break above the downward trend line in the first stage. If this trend breaks upward and remains at this level, the price is likely to retest the $940 resistance level. If this level is exceeded, the price could technically rise to $975 and $1,000 levels.
On the other hand, if selling pressure increases again, the price is expected to test the $900 support level. If this level is broken downward, the price may retreat to the $860 and $830 support zones, respectively.
Supports: 900 – 860 – 830
Resistances: 940 – 975 – 1,000

LINK/USDT
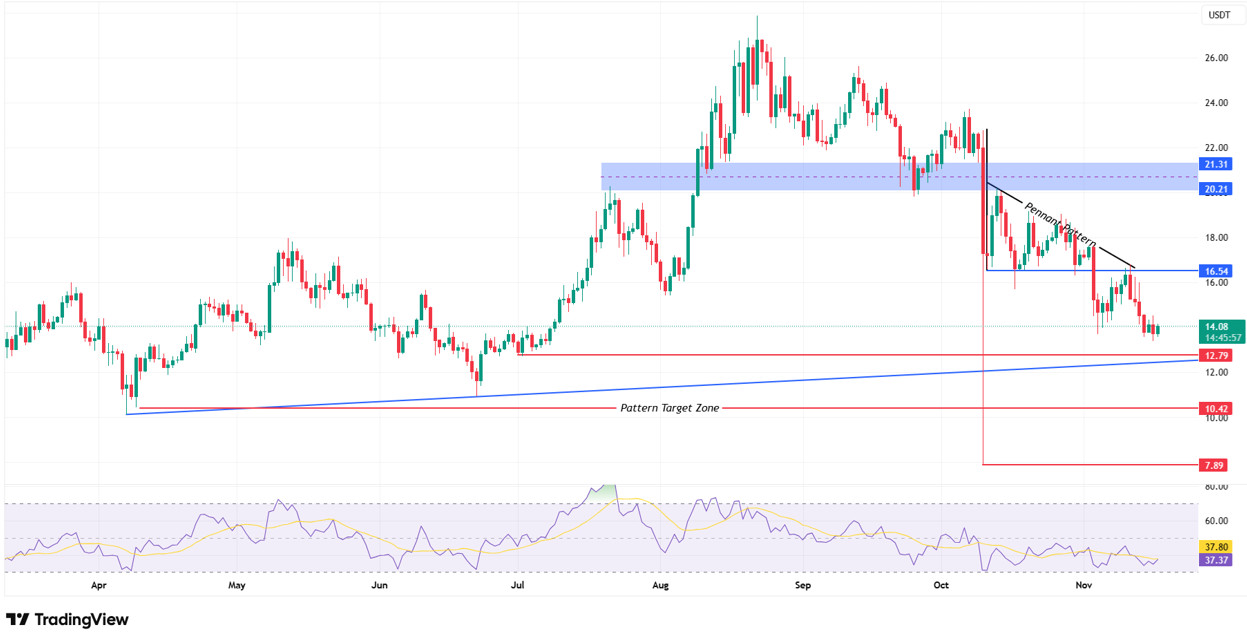
On November 3, Link broke below the $16.54 level, completing a technical breakout in a bearish flag formation. Although the price attempted to move back up afterwards, this reaction failed to break above the $16.54 level, remaining merely a breakout confirmation and facing strong selling pressure.
Looking at the current picture, we see that the price is approaching the main trend line that began in April. The $12.80 level stands out as an important demand area, both because it intersects with this trend line and because it has acted as horizontal support in the past. Strong buying in this area could push the price back towards the $16.54 level. However, if the price fails to break above this area, the upside could remain limited, and the current downtrend structure could be preserved. In such a scenario, the price could technically pull back towards our flag formation target of $10.42.
In this context, the $12.79 region is a decisive threshold in terms of price behavior. As it is both the contact point of the main trend line and a region where past demand has clustered, we can say that the short-to-medium-term direction will be shaped by the price reaction at this level. If buyers gain strength in this region, it could balance the negative structure formed by the flag breakout for a while and gradually push the price back to the $16.54 band.
In the other scenario, a break below the $12.79 support would strongly confirm that the trend is weakening. In this case, the price could enter a deeper correction process towards the $10.42 level, in line with the formation target. Aggressive selling towards the $10.42 level should not be overlooked, especially since this region coincides with the formation’s measurement target and is an accumulation area that has historically held high liquidity.
On the momentum side, the Relative Strength Index (RSI) trading below the neutral zone is causing upward reaction movements to remain weak. This outlook indicates that selling pressure may increase as the price approaches resistance levels. If the RSI rises above the 45–50 band again, it could be seen as a sign of strength in the short term. However, the current position shows that there isn’t enough momentum yet for a trend reversal.
Supports: 12.79 – 10.42 – 7.89
Resistances: 16.54 – 20.21 – 21.31
SUI/USDT
This week, the Sui (SUI) ecosystem attracted attention with significant developments despite the declines in the crypto market. First, a “corporate-level custody service” agreement for the SUI token with Crypto.com was announced. This collaboration is considered a critical step, especially due to the need for secure custody infrastructure among institutional investors.
Additionally, the Sui Foundation shared Q3 2025 ecosystem data. According to the report, SUI’s circulating market value increased by approximately 23% during the quarter, rising to $11.63 billion. Transaction fees on the network decreased by 11%. Furthermore, staking rates were observed to be quite high, with a significant portion of the circulating supply being staked. This indicates that SUI is being held by long-term users.
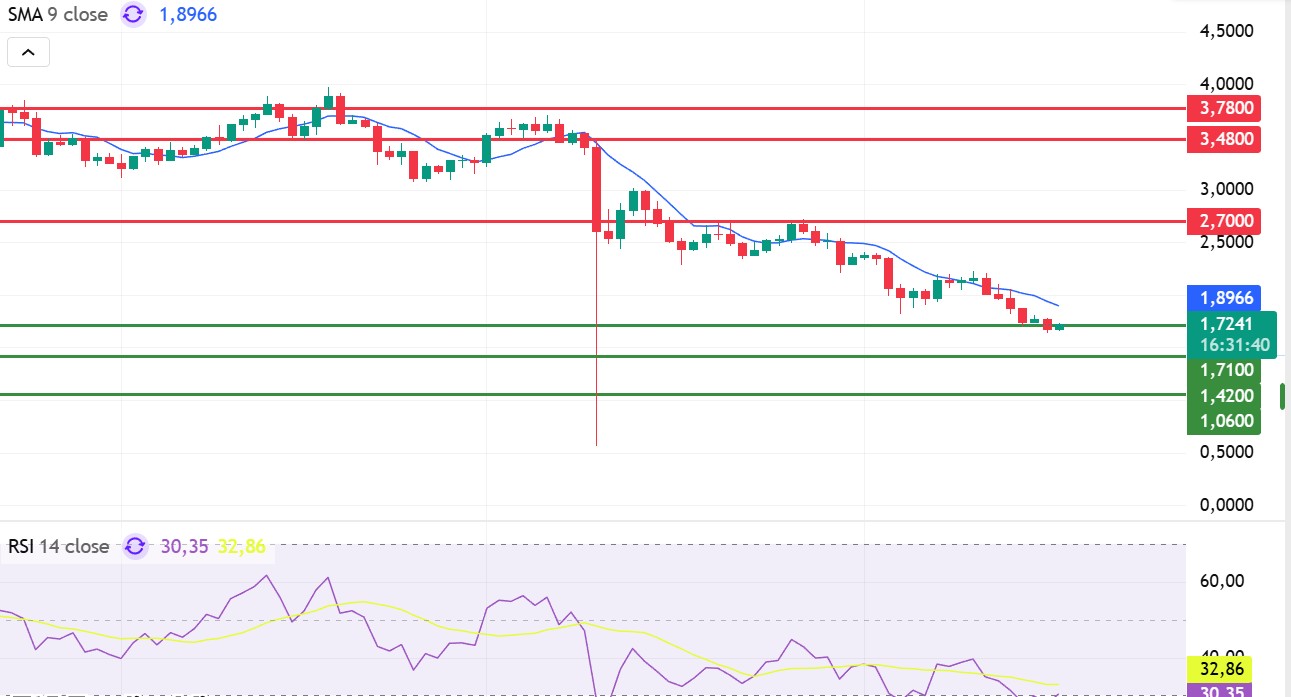
Following recent developments, when we look at Sui’s technical outlook, we see that the price has been moving sideways at around $2.66 on a weekly basis, influenced by fundamental developments. The Relative Strength Index (RSI) is currently in the 32.86 – 30.00 range. This range indicates that the market is trading close to the buy zone; a drop in the RSI to the 35.00 – 30.35 range could signal a potential buying point. If the price moves upward, the $2.70, $3.48, and $3.78 levels can be monitored as resistance points. However, if the price falls to new lows, it could indicate that selling pressure is intensifying. In this case, the $1.71, $1.42, and $1.06 levels stand out as support zones. Based on the trend line, a pullback to $1.71 appears technically possible. According to Simple Moving Averages (SMA) data, Sui’s average price is currently at $1.89. If the price remains below this level, it could signal that the current uptrend may not continue technically.
Supports: 1.06 – 1.42 – 1.71
Resistances: 2.70 – 3.48 – 3.78
ADA/USDT
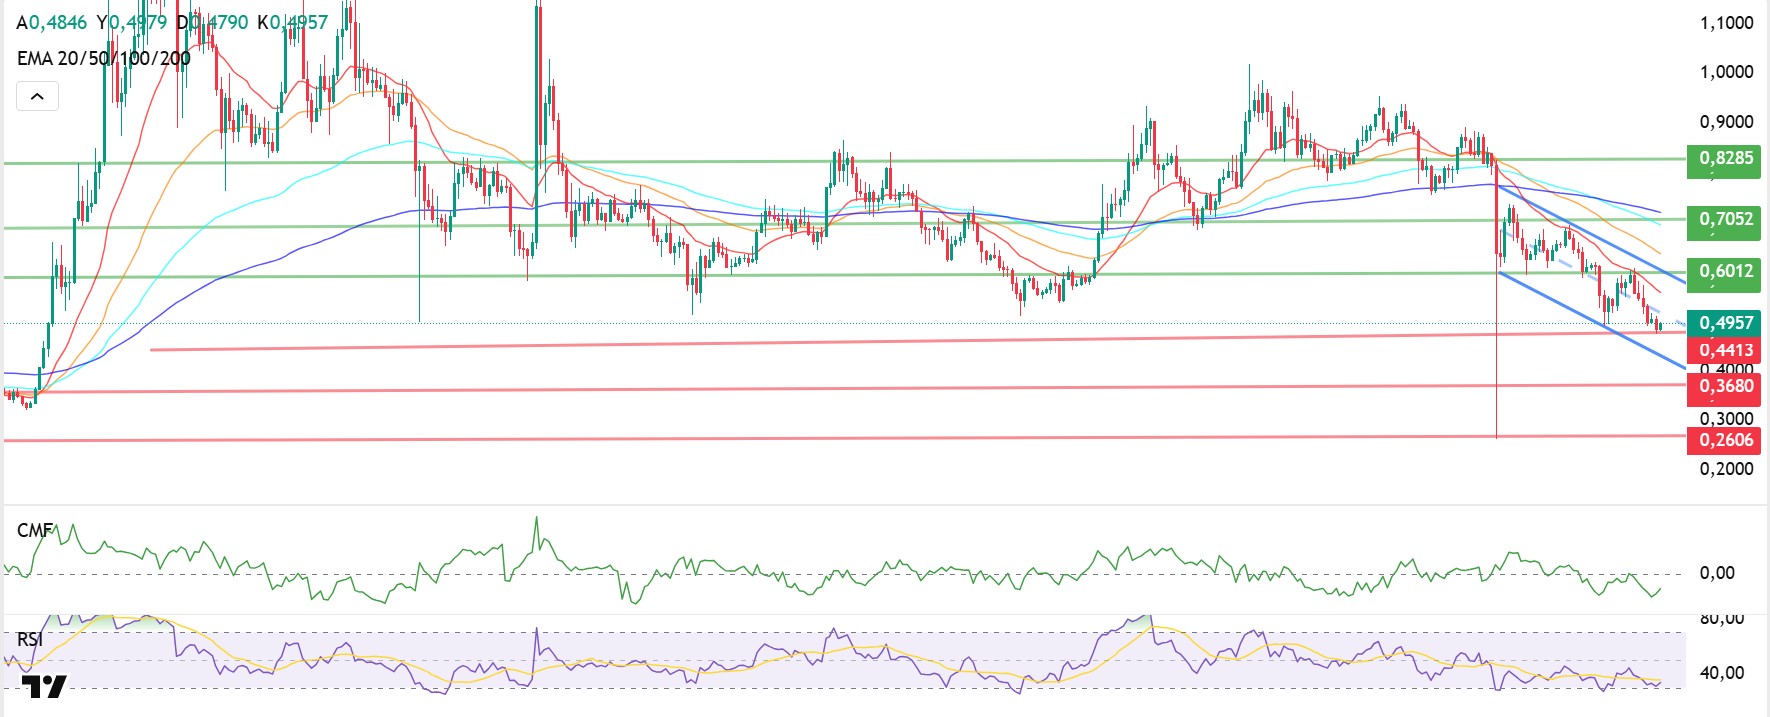
Since last week, the ADA price has fallen by 15%, dropping to the first support level of $0.4750.
Looking at wallet activity, this week saw sales from wallets holding between 100,000 and 1 million ADA. This points to potential bearish sentiment among institutional and high-net-worth investors. In a transaction first recorded by blockchain detective ZachXBT, 14.4 million Cardano (ADA) tokens worth $6.9 million were exchanged for $847,695 worth of Anzens (USDA) stablecoin, resulting in a loss of approximately $6.05 million. On the ADA liquidation map, short positions stand at $93 million, while long positions have reached $24 million. It needs approximately a 1% move to reach the first major short position liquidations at the $0.5100 level. Short positions are trading at approximately four times the leverage ratio of long positions. This situation, along with position liquidations, may indicate an increase in selling pressure on ADA’s price.
Technically speaking, ADA, which has been in a downtrend since last week, could end its falling channel if it pulls back from the $0.5055 level. If it closes above this level, the $0.5957 level could be monitored as the first resistance point. If the price breaks above the 20-day Exponential Moving Average (EMA 20 – Red Line) level, it is expected to close above the 50-day Exponential Moving Average (EMA 50 – Blue Line). If the price falls as a result of macroeconomic data expected to be announced this week and statements made by FED members, the first support point at the $0.4413 level can be monitored. If it closes below this level, the $0.3680 level can be monitored. The Relative Strength Index (RSI) continues in the sell zone, falling to 36, while the Chaikin Money Flow (CMF-20) remains at -0.10 levels, signaling limited money inflows.
Supports: 0.4413 – 0.3680 – 0.2606
Resistances: 0.8285 – 0.7052 – 0.6012
Legal Not’ce
The investment information, comments, and recommendations contained in this document do not constitute investment advisory services. Investment advisory services are provided by authorized institutions on a personal basis, taking into account the risk and return preferences of individuals. The comments and recommendations contained in this document are of a general nature. These recommendations may not be suitable for your financial situation and risk and return preferences. Therefore, making an investment decision based solely on the information contained in this document may not result in outcomes that align with your expectations.