
Weekly Technical Analysis Report November 24 – December 01, 2025
BTC/USDT
Fed minutes and official statements pointed to deep divisions over a December rate cut, while the data gap caused by the government shutdown further complicated the decision set by postponing CPI and employment calendars. Although the end of the shutdown brought relief on the growth front, Trump’s Supreme Court process regarding tariffs and the emphasis on a possible “Plan B” kept the trade risk premium high. On the crypto front, retail investor sales and ETF-driven outflows brought deep selling pressure.
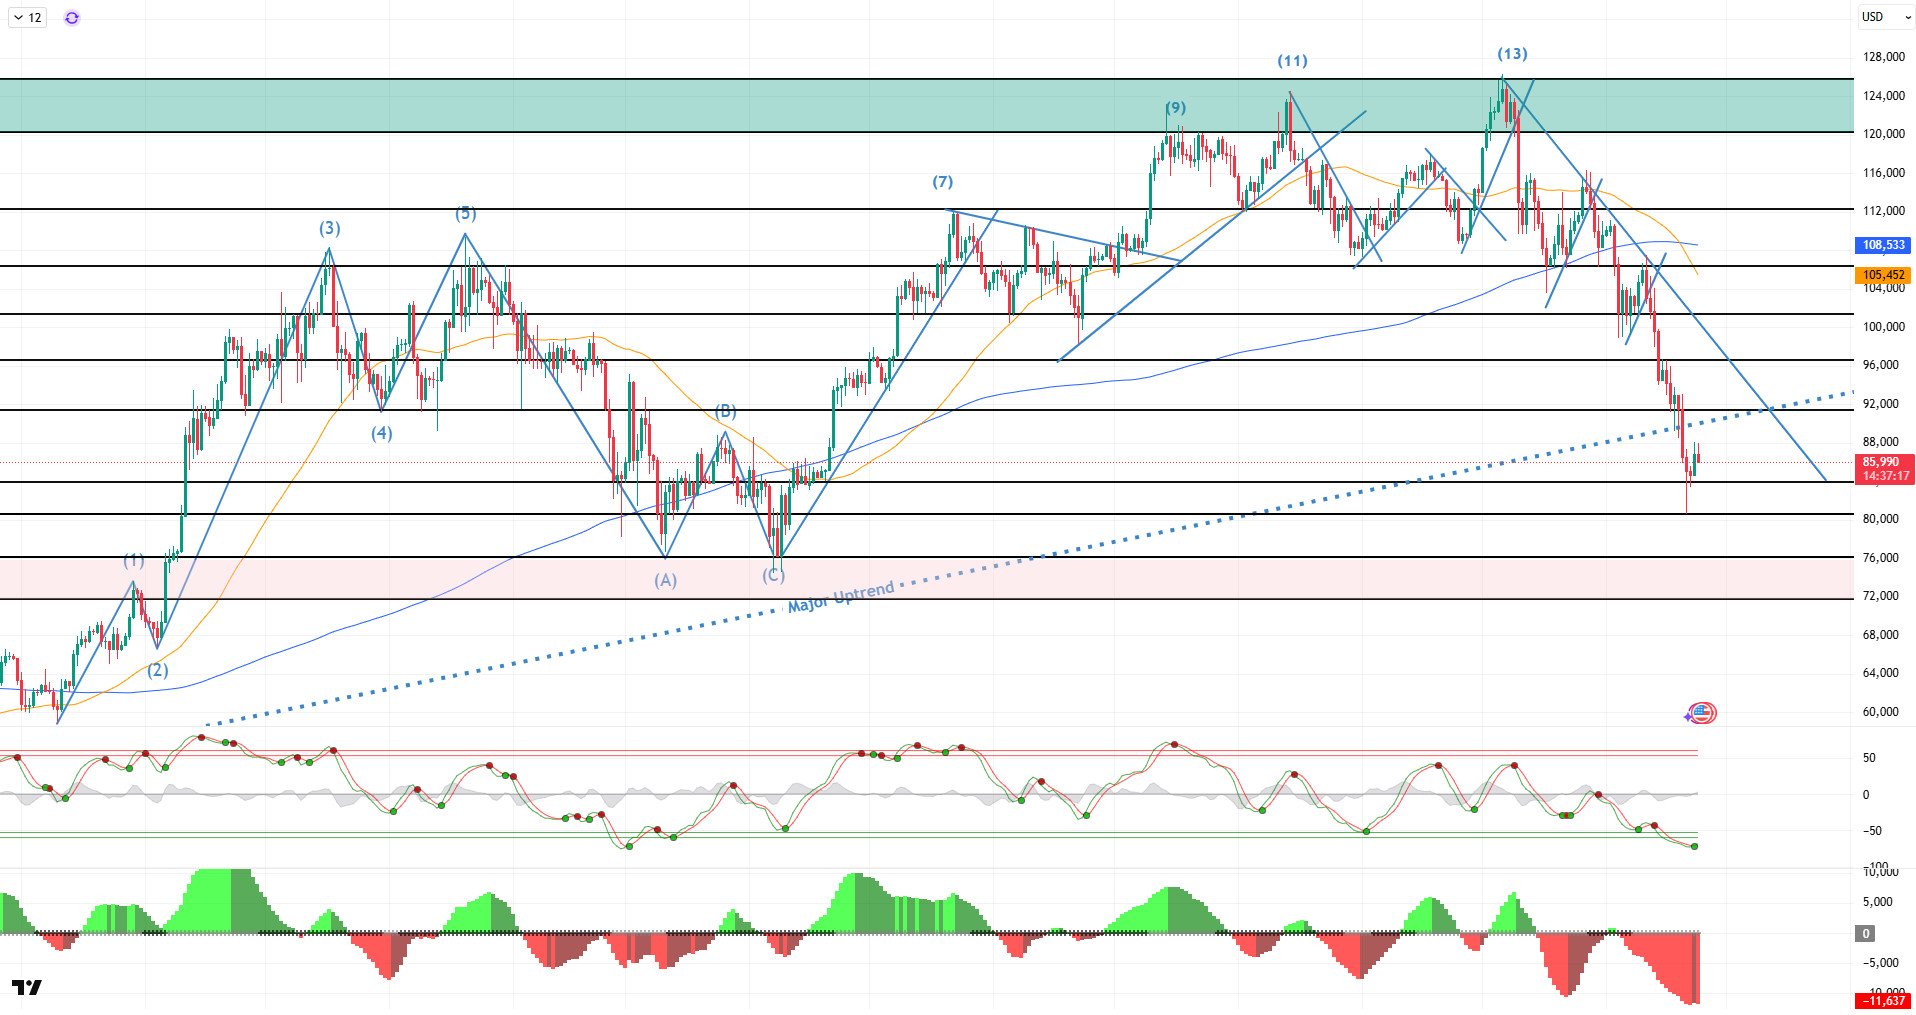
Looking at the daily technical picture after all these developments, BTC deepened its downtrend from the ATH level of 126,200 points, which it reached with its golden cross pattern, falling to 80,500 points. Having lost 36% of its value since its ATH, BTC recorded a decline more than three times greater than the corrections it made after previous ATH tests. At the time of writing, it continues to trade at the 86,600 level below the daily major trend.
Looking at technical indicators, the Wave Trend (WT) oscillator is seen giving a buy signal as it falls below the oversold zone on the daily chart. The Squeeze Momentum indicator (SM) continues to attempt to move into positive territory after reaching maximum weakness in the negative zone. In moving averages, the golden cross pattern that began on May 17 is seen to have been lost as the 50-day SMA crossed above the 200-day SMA.
Looking at weekly liquidation data, the buying level is weakening, while the selling level is gradually intensifying. In this regard, the first selling level stands out at 88,000, while accumulation continues within the 97,000-98,000 band.
In summary, the pullback in BTC was driven by factors such as changing expectations for interest rate cuts, profit-taking by whales, the decline in technology stocks, retail outflows from ETFs, and the US government shutdown. The rebound gained momentum with Fed members expressing more optimistic views on further rate cuts. Technically, the price rebounded from a new low of 80,500. Liquidity data indicates that sell-heavy positions continue to dominate. For the rally to be sustainable going forward, the price will need to reclaim the 90,000 reference level, and if the rally continues, six-figure levels will be targeted. In the event of a potential new wave of selling pressure, a break below 85,000 would bring us to the 80,000 reference area.
Supports: 85,000 – 83,800 – 80,000
Resistances: 90,000 – 95,000 – 100,000
ETH/USDT
Last week, the Ethereum market showed a weak performance due to strong outflows on the institutional side and sharp price fluctuations. During the period of November 14–20, 2025, a total of $733.8 million in net outflows occurred from Spot Ethereum ETFs, with not a single day seeing positive inflows. The negative flow series reaching eight trading days revealed that one of the weakest periods of the year was being experienced. The highest outflows coming through BlackRock ETHA and Fidelity FETH showed that institutional investors’ risk aversion tendency had increased significantly. While the total net inflow into spot Ethereum ETFs fell to $12.595 billion, the price of ETH dropped from $3,229 to $2,831 during the same period, losing 12.34% of its value, and the price decline accelerated in tandem with ETF outflows.
On the ecosystem side, BitMine’s announcement of the “Made in America Validator Network” (MAVAN) project drew attention. The company announced that it has launched a pilot phase with three infrastructure providers to stake its ETH reserves and plans to launch MAVAN in the first quarter of 2026. This initiative can be seen as a positive signal focused on long-term staking and demonstrates continued institutional confidence in Ethereum’s PoS ecosystem.
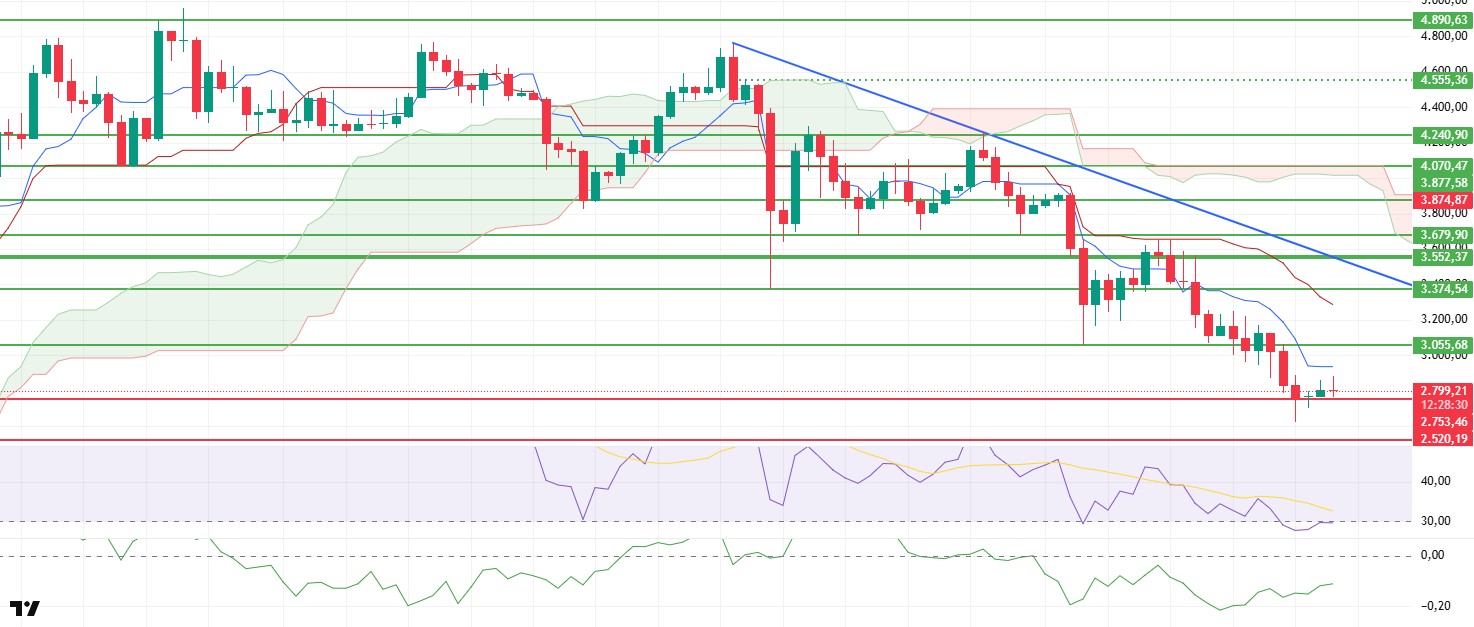
On the price front, ETH fell to $2,620 under heavy selling pressure after breaking through the critical $3,055 support level last week. The rebound from this level pushed the price back up to $2,800, but the market structure still appears weak. CVD data shows that the downward trend has stopped and spot sales have leveled off. While this may indicate that the downtrend is coming to an end, there are still insufficient signals for a strong uptrend to begin.
On the liquidity side, the Chaikin Money Flow (CMF) indicator has been declining since November 10, but as of November 15, it signaled an upward reversal. However, the indicator remaining in negative territory indicates that liquidity inflows have not yet reached the strength needed to support an uptrend. The RSI indicator is moving horizontally at the oversold threshold , indicating that momentum remains weak but also that the groundwork for a potential recovery is being laid.
The Ichimoku indicator maintains a generally weak outlook as the price remains below the Tenkan, Kijun, and Kumo cloud. Since there has been no clear break in the trend direction, the likelihood of upward movements remaining limited is high.
The overall outlook indicates that Ethereum’s downward trend has begun to slow somewhat, but the market remains fragile. Looking ahead to next week, a rapid recovery could begin if the ETH price regains the $3,055 level. Conversely, losing the $2,753 level stands out as the strongest warning sign that selling pressure could intensify again. In this context, the Ethereum market is likely to follow a more horizontal and cautious course in the short term.
Supports: 2,753 – 2,520 – 2,375
Resistances: 3,055 – 3,374 – 3,552
XRP/USDT
Last week saw notable activity in the XRP market, both in terms of price movements and ecosystem developments. One of the most significant headlines was the launch of a new spot XRP ETF on Thursday under the ticker symbol “XRP.” This product, which Bitwise has been working on for some time, stands out as one of the first steps toward a spot XRP ETF in the US. Bitwise CIO Matt Hougan’s description of XRP as an attractive asset with “high trading volume, low operating costs, and a strong community” demonstrated continued institutional interest in XRP.
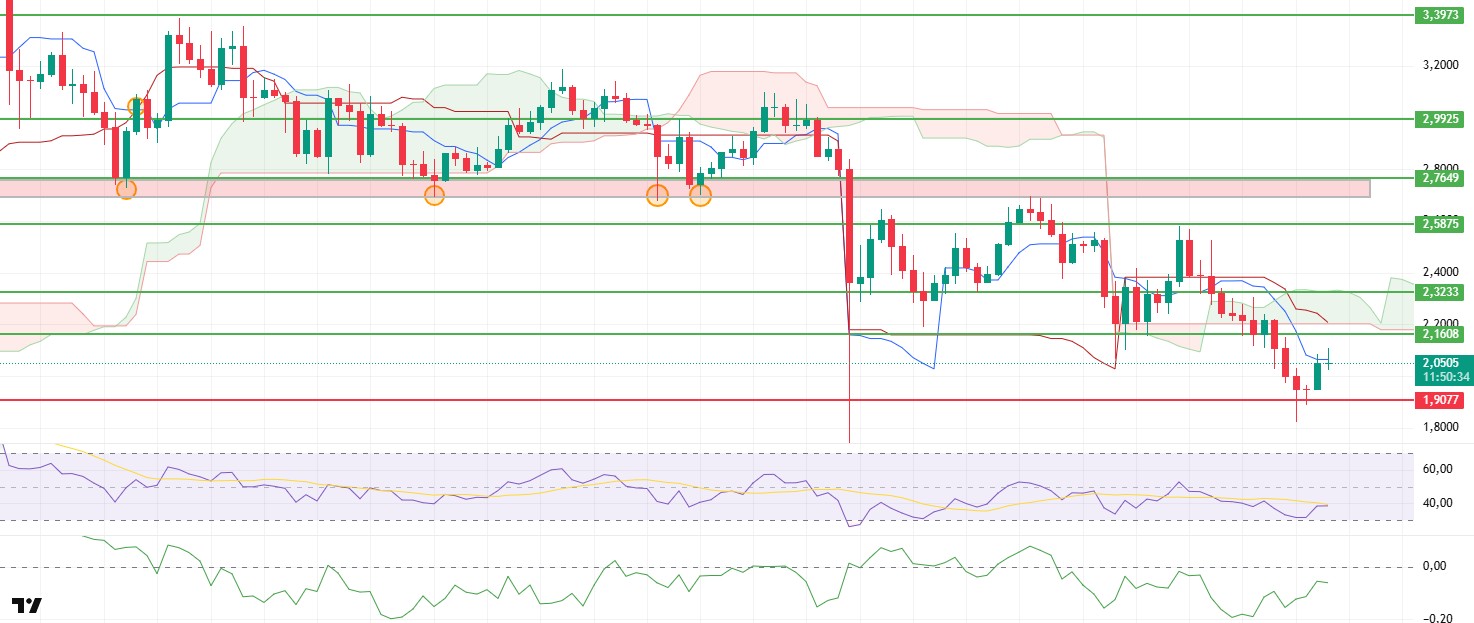
On the price front, XRP fell sharply to $1.81 last week after breaking below the lower band of the Kumo cloud. Strong buying pressure from this area pushed the price back up to $2.05. This rebound indicates that selling pressure has weakened in the short term and that the price is attempting an upward move, drawing strength from the support zone.
On the liquidity side, the Chaikin Money Flow (CMF) indicator had fallen into negative territory with the recent declines, but as the price found support, the CMF moved closer to the zero line again, indicating a strengthening of liquidity inflows. This structure signals that buyers are starting to return to the market more clearly.
The Relative Strength Index (RSI) indicator also moved upward after finding support at the oversold threshold and confirmed the recovery in momentum by not showing a negative divergence. This outlook indicates that buyers started the week stronger and that the short-term upside potential remains intact.
When examining the Ichimoku indicator, it is seen that the price is still trading below the kumo cloud. The medium-term trend has not fully turned positive, but the price rising to the Tenkan level is an important signal indicating that short-term volatility may continue. For the trend reversal to be confirmed, settling above the cloud remains critically important.
The overall outlook indicates that the recovery trend is strengthening and that the improvement in indicators is supporting the price. Next week, the XRP price is expected to rise towards the $2.16 level. If this level is broken, the upward movement could gain further momentum. On the downside, the $1.90 level should be monitored as a critical support.
Supports: 1.9077 – 1.6189 – 1.2195
Resistances: 2.1608 – 2.3233 – 2.5875
SOL/USDT
In the Solana ecosystem;
- The Solana ETF has started trading on Nasdaq.
- Fidelity announced that it will soon launch the Solana Spot ETF by filing Form 8-A.
- VanEck launched a zero-commission Solana Staking ETF.
- 21Shares has launched its Spot Solana ETF.
- Solflare and Mastercard have launched Solana’s first self-custody bank card.
- A centralized exchange will acquire the Solana-based DEX Vector.
- The Solana Foundation proposed increasing Solana’s deflation rate from -15% to -30% to support value appreciation.
- Wormhole Labs introduced the ‘Sunrise’ network gateway to bring MON and other assets to Solana.
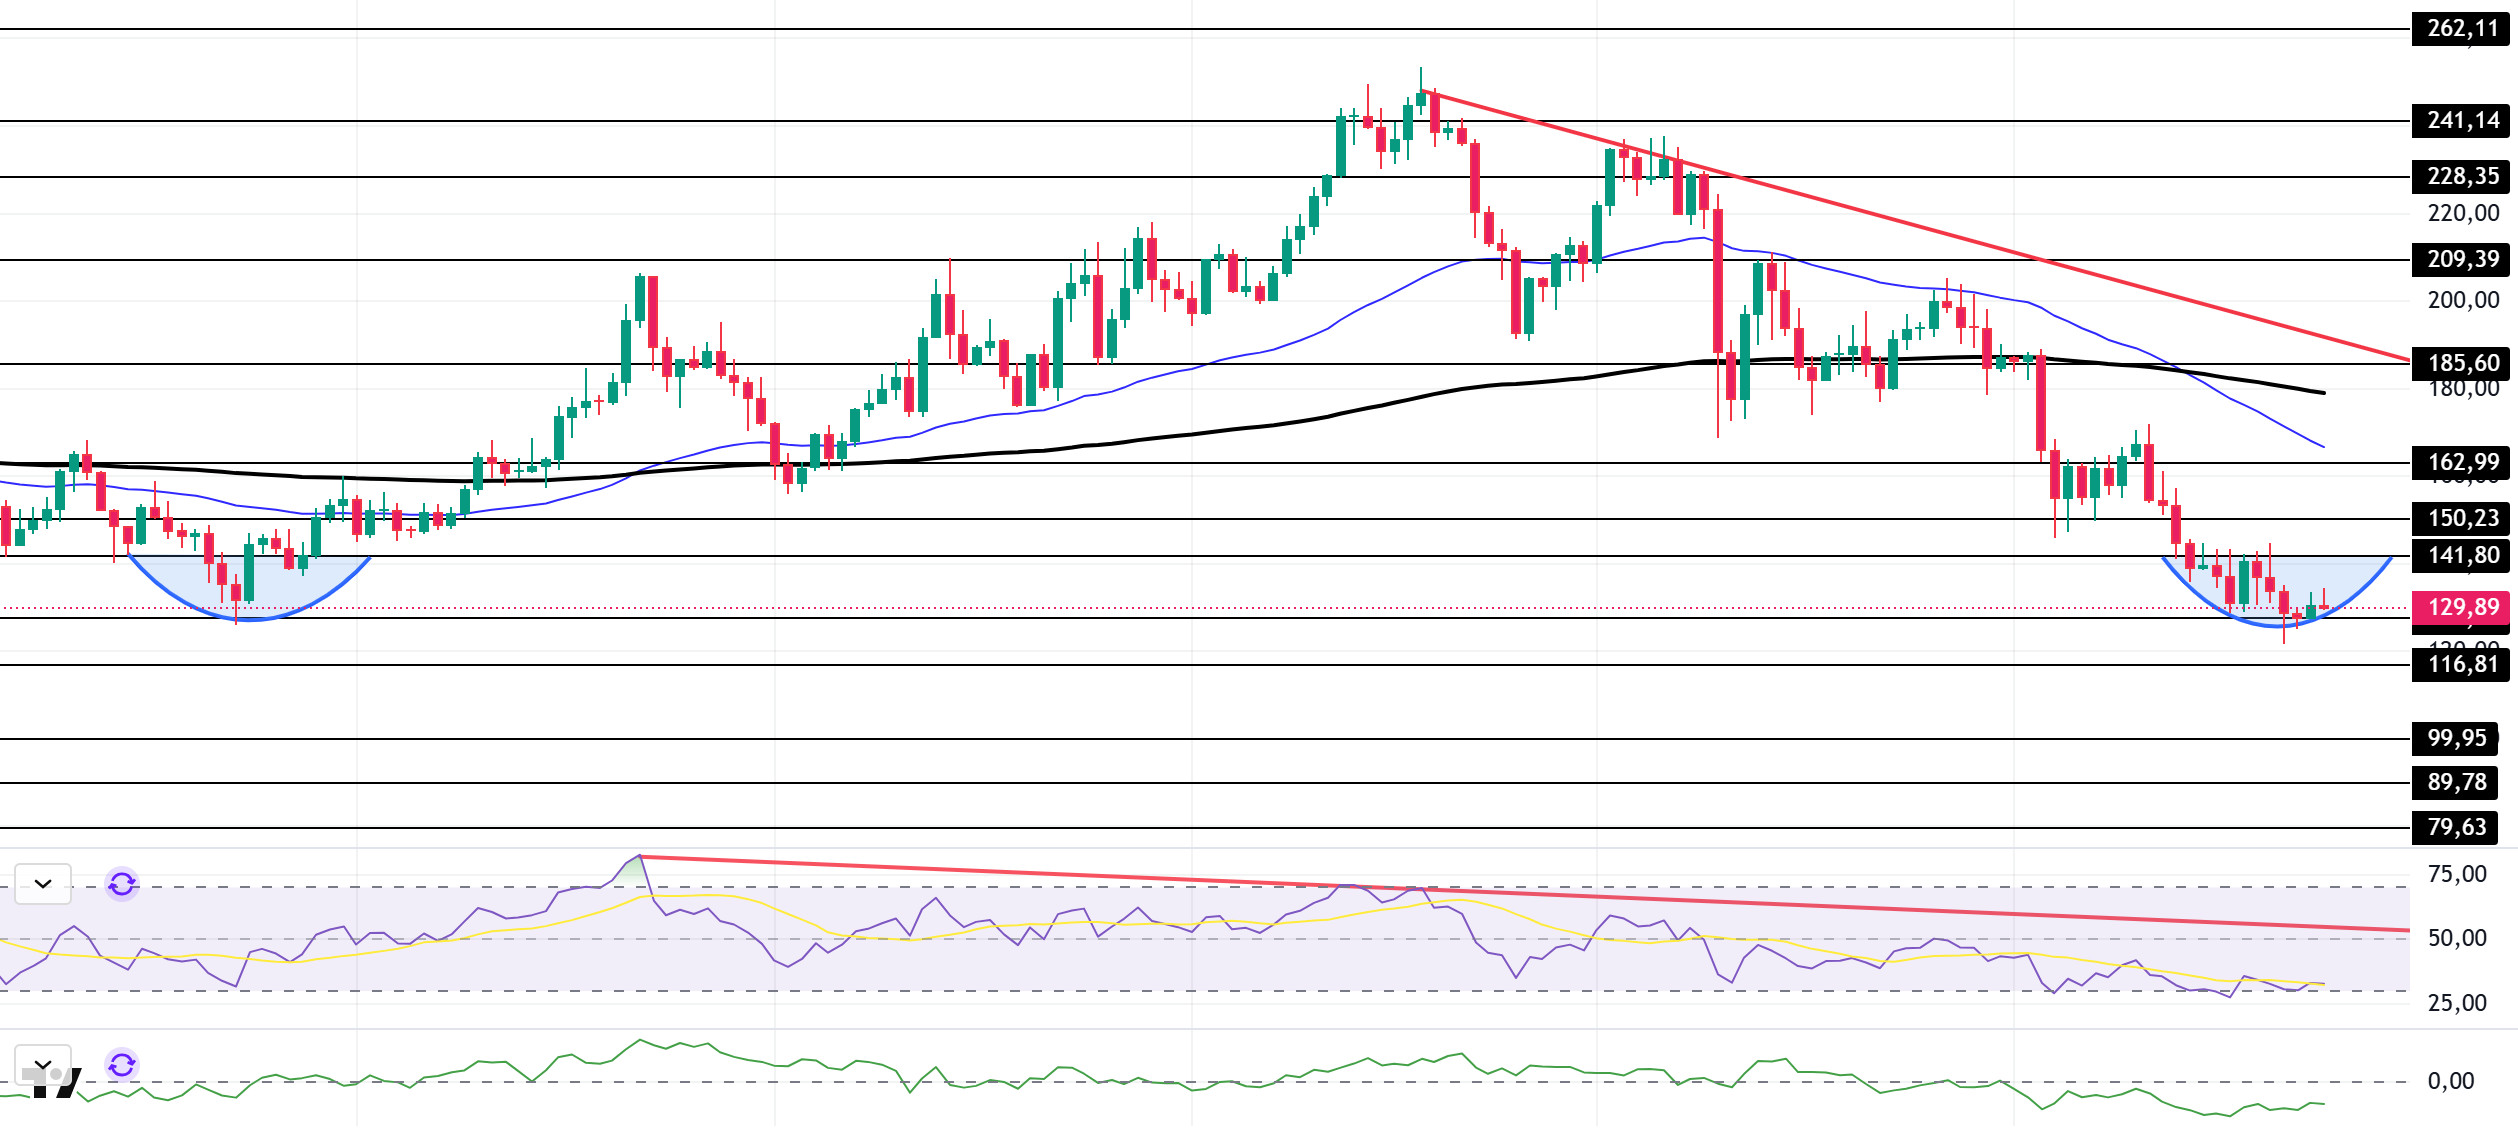
The SOL price experienced a pullback on the daily chart this week. The asset remained in the lower region of the downtrend that began on September 18. Testing the strong support level of $150.23, the price failed to hold and deepened its decline. It then tested the strong resistance level at $127.62 and gained momentum from there, showing an upward trend. Currently, with a double bottom formation on the chart, if the upward trend begins, it may test the 50 EMA (Blue Line) moving average as resistance. In case of a pullback, the $99.95 level should be monitored.
The asset is trading below the 50 EMA (Exponential Moving Average – Blue Line) and 200 EMA (Black Line) moving averages, indicating that the asset is trending downward. Furthermore, the 50 EMA has crossed below the 200 EMA. This signals the continuation of a technical “dead cross” formation, indicating increased downside potential in the medium term. The RSI (14) has fallen to the oversold zone. At the same time, the indicator has remained below the downward trend line that began on July 22. These factors indicate increased selling pressure. The Chaikin Money Flow (CMF-20) remains in negative territory. At the same time, increased outflows could push the CMF-20 indicator deeper into negative territory. On the other hand, there is a positive divergence. If macroeconomic data remains positive and developments in the ecosystem continue to be favorable, the first major resistance level at $162.99 could be retested. Conversely, in the event of potential negative news flow or deterioration in macro data, the $99.95 level could be monitored as a potential buying opportunity.
Supports: 127.62 – 116.81 – 99.95
Resistances: 141.80 – 150.23 – 162.99
DOGE/USDT
- Grayscale has filed an S-1 registration statement with the SEC for its Dogecoin Trust ETF. Grayscale’s Dogecoin ETF is expected to launch today.
- 21Shares’ Dogecoin ETF has received listing approval on Nasdaq.
- The U.S. Government Efficiency Department (DOGE) was shut down under the Trump administration.
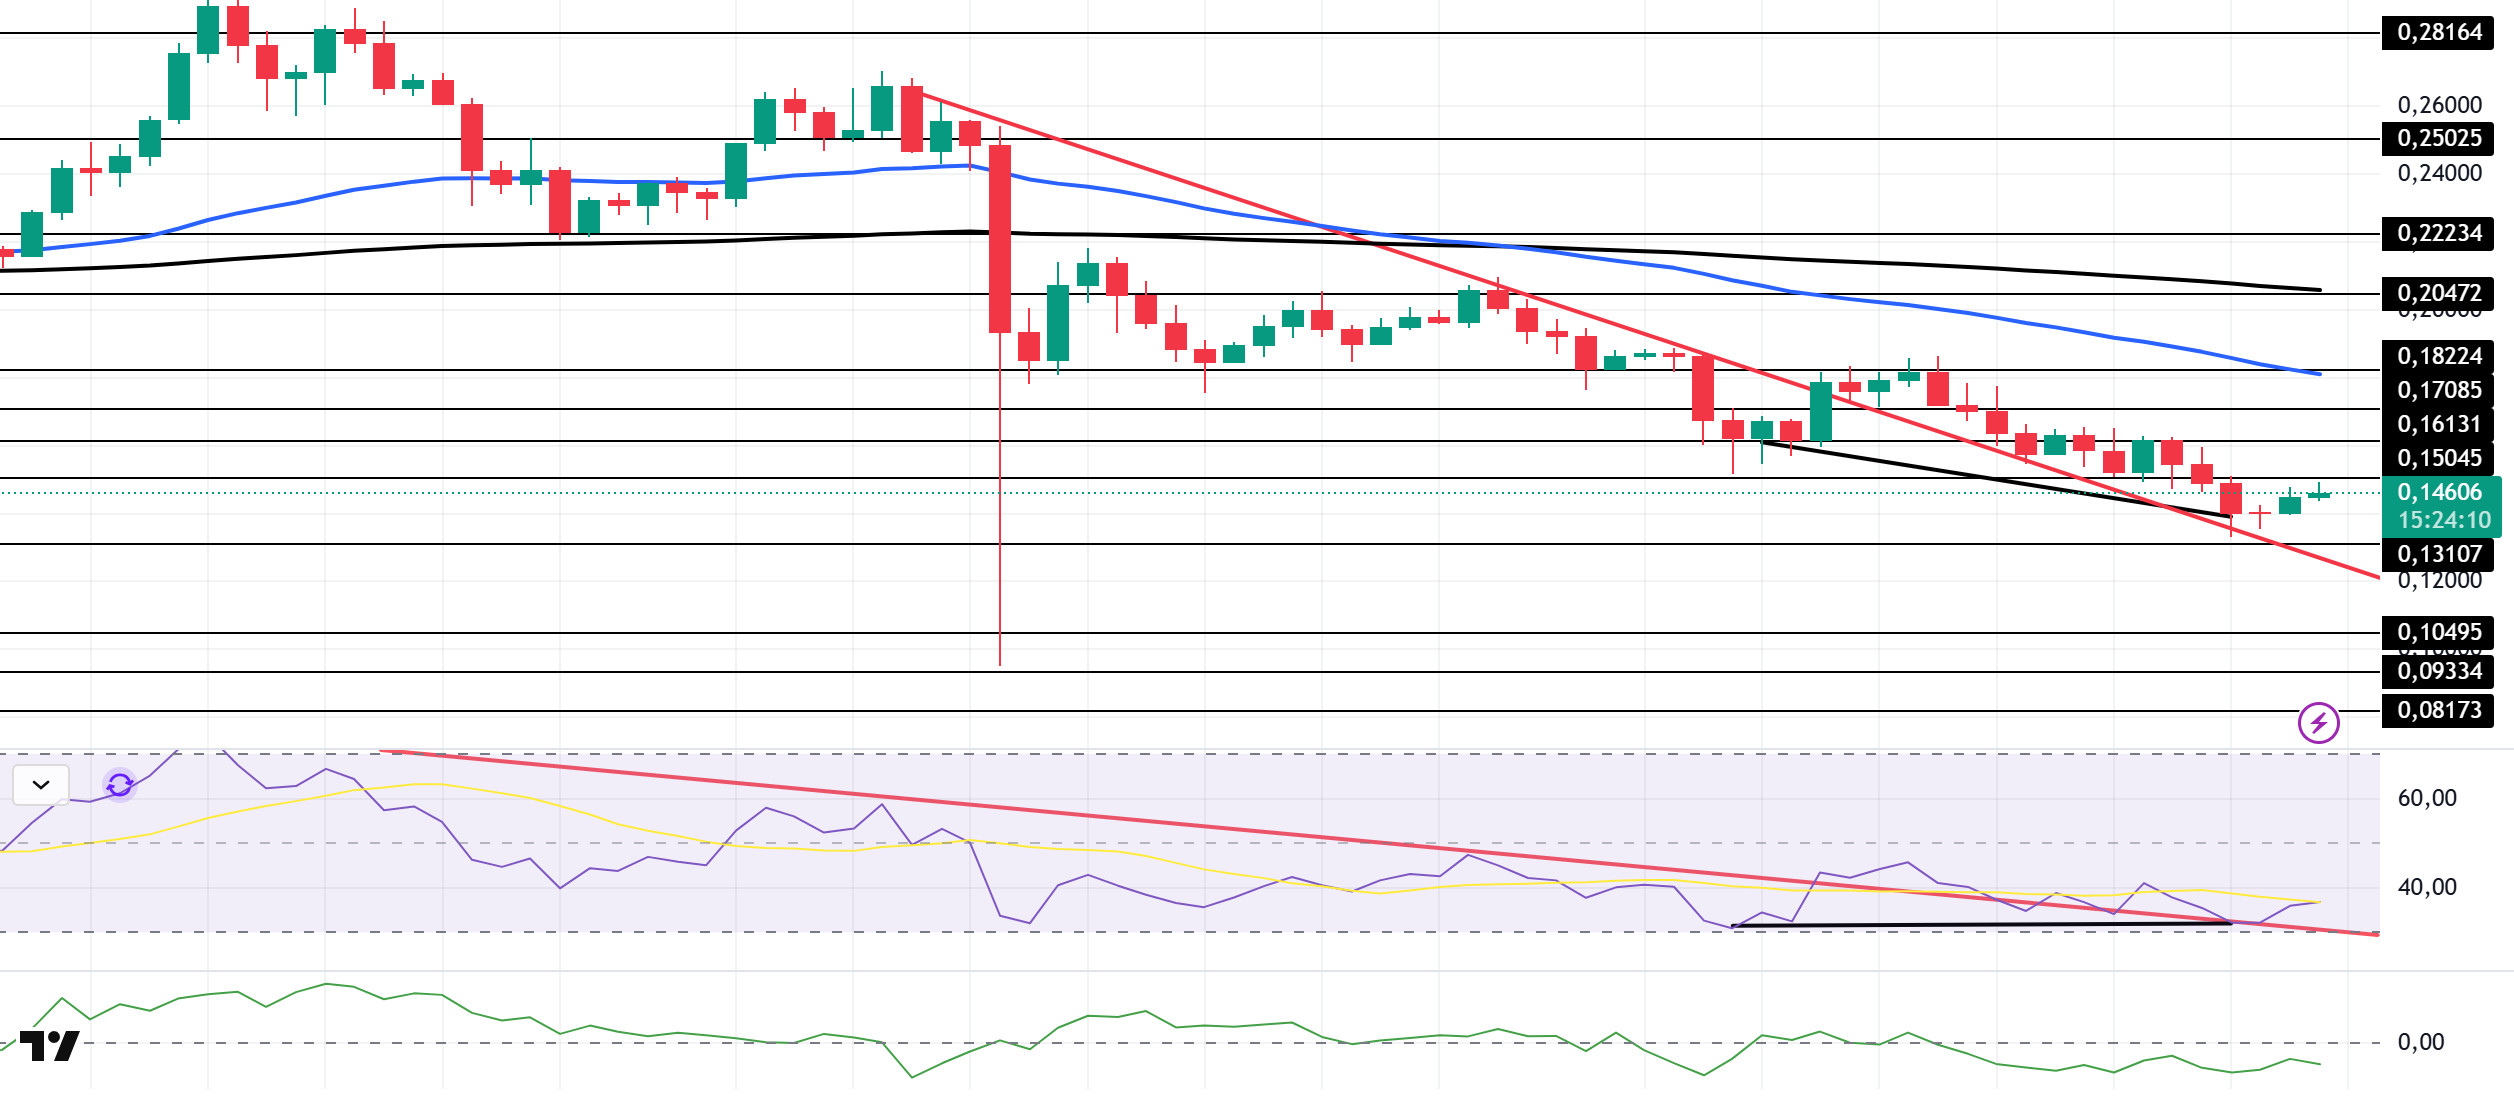
On the daily chart, DOGE has been declining since last week. The asset remained above the downtrend line that began on October 7. Testing the strong support level of $0.15045, the price broke below this level, deepening its pullback. Finding support at the $0.13107 level, the price is currently testing the downtrend line as support. If the uptrend continues, it may test the 50 EMA (Blue Line) moving average as resistance. If the pullback continues, the $0.13107 level may act as support again.
The asset continued to trade below the 50 EMA (Blue Line) and 200 EMA (Exponential Moving Average – Black Line) moving averages. This indicates that the asset is in a downward trend. On the other hand, the 50 EMA moving average being below the 200 EMA moving average shows us that the “dead cross” formation is continuing. This also indicates that the asset has the potential to lose value at this moment. The Chaikin Money Flow (CMF–20) indicator remained in negative territory. Money inflows continue to decline. This could push the CMF-20 deeper into negative territory. Looking at the Relative Strength Index (RSI-14) indicator, it rose to the middle of the negative zone. At the same time, it continued to remain in the upper zone, supported by the declining trend that has been ongoing since September 13. This indicates that buying pressure could build. In the event of macroeconomic risks or negative news from the ecosystem, the $0.13107 level can be monitored as a strong support. On the other hand, if the upward movement gains strength, the $0.17085 level comes to the fore as the first strong resistance level.
Supports: 0.13107 – 0.10495 – 0.09334
Resistances: 0.15045 – 0.16131 – 0.17085
TRX/USDT
Tron founder Justin Sun announced last week via his social media account that TRX can now be staked through the Nansen platform. Considering the integration’s capacity to support the total staking volume on the network, it can be said that it offers a positive contribution from a technical standpoint. Additionally, the total amount of TRX staked across all platforms currently stands at 45.4 million, representing 47.96% of the circulating supply.
Last week, the TRON network generated a total of $45.1 million in revenue, continuing to be the highest-earning ecosystem among all blockchain networks. TRON’s stable performance on the revenue side stands out as an important dynamic that reinforces the network’s strength in the DeFi and stablecoin markets.
During the week of November 17-23, 2025, a total of 22.5 million TRX were burned on the TRON network. Despite this, the circulating supply increased by 4.9 million. The increase in circulating supply creates an inflationary effect on TRX. This development may create slight supply pressure on the TRX price in the short term, but if the burn trend continues, a balance may be seen in the medium term. Additionally, the total number of addresses also increased by 1.6 million to 347.6 million during the same week.
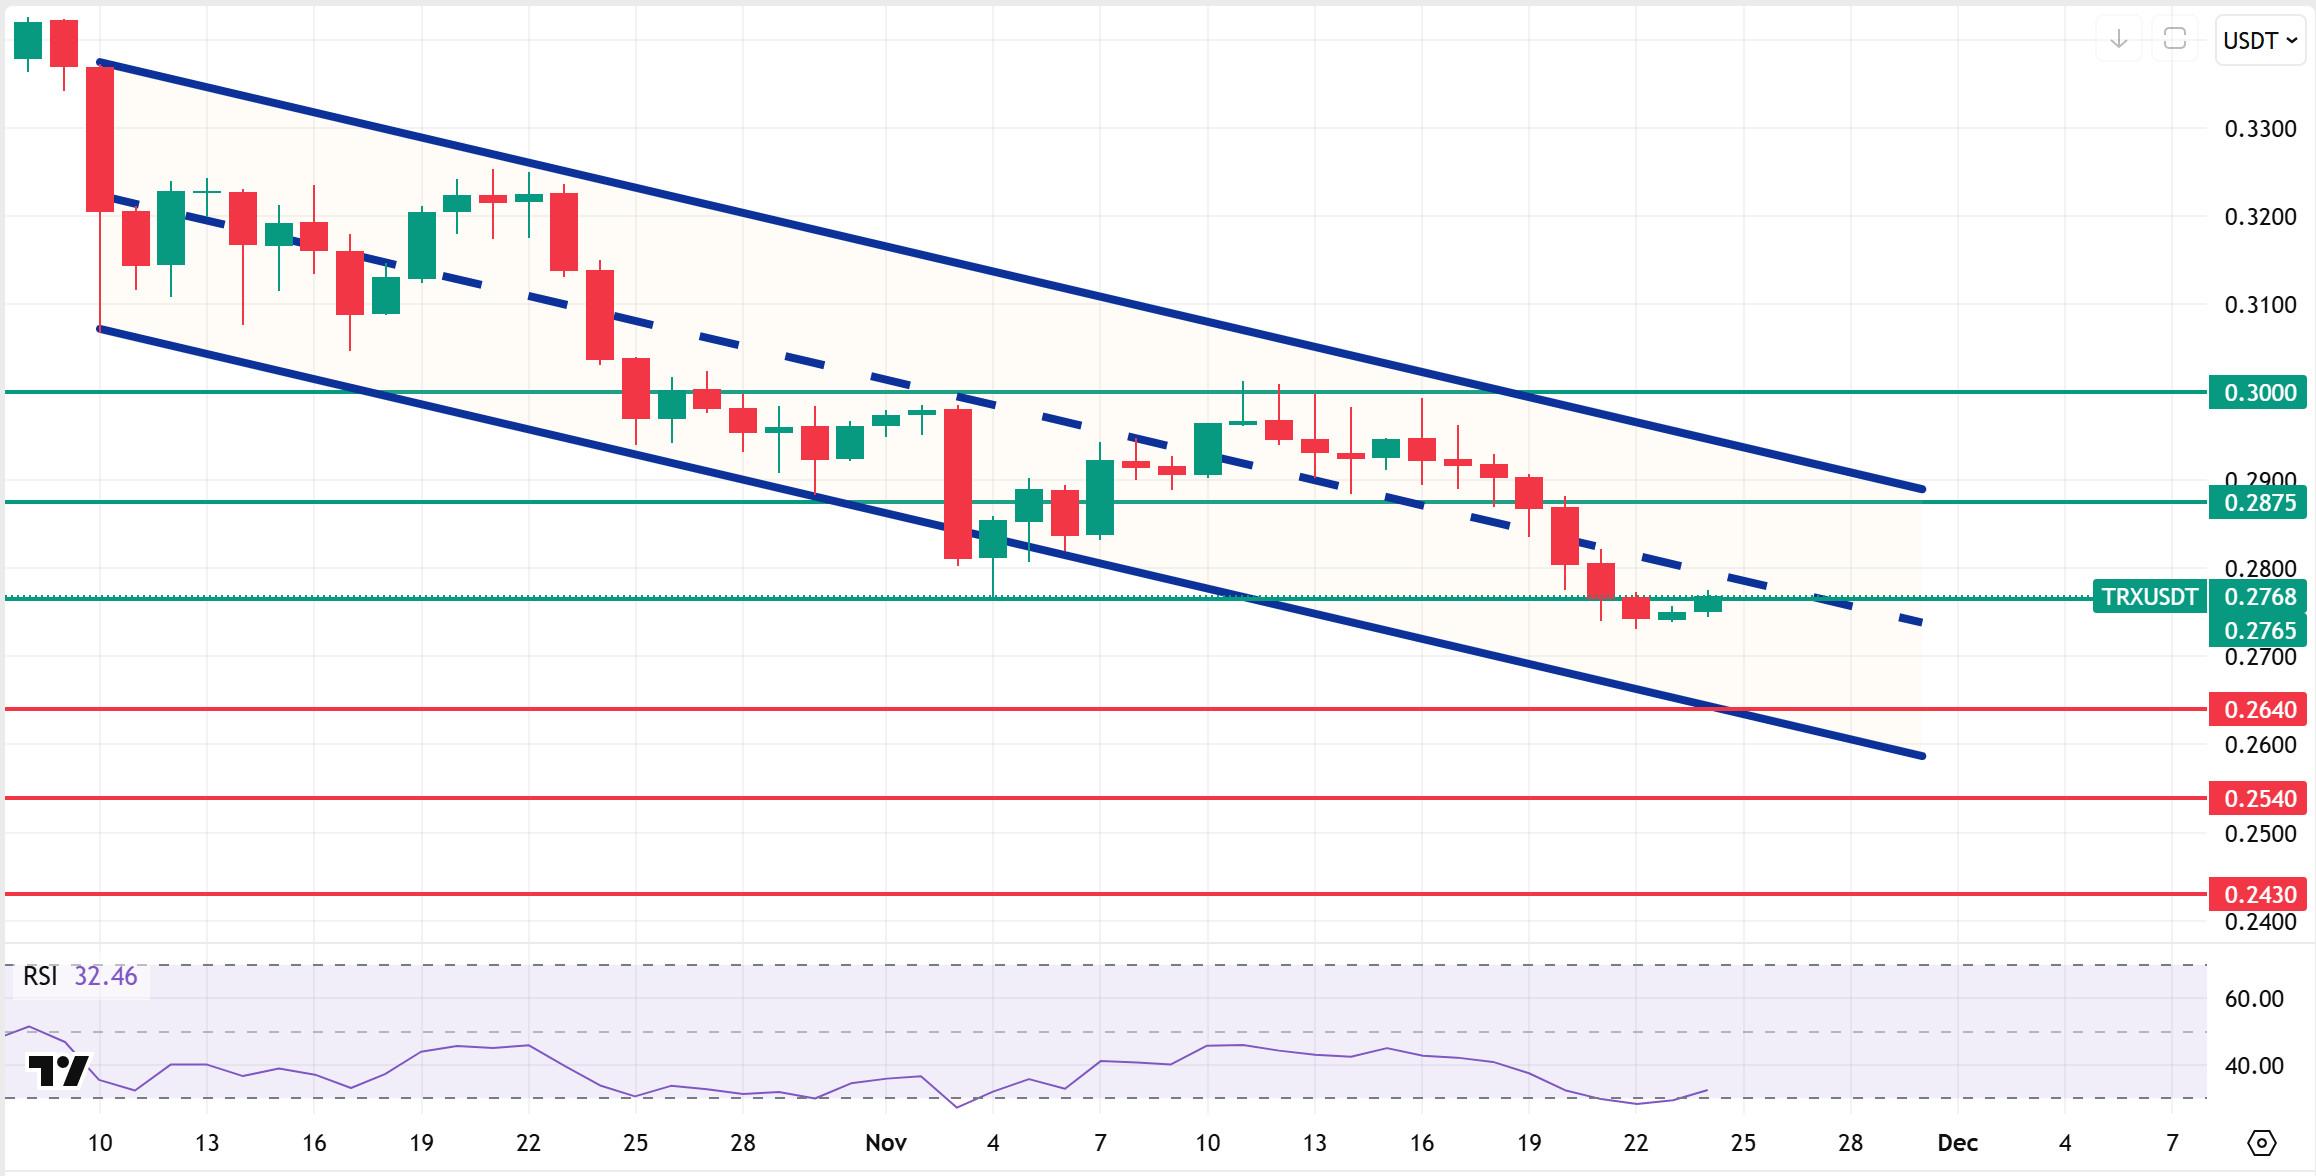
Technically speaking, TRX started last week at 0.2924 and closed the week at 0.2750, losing approximately 6% in value throughout the week. Thus, TRON ended last week with a decline, and its market value reached $26 billion. Currently trading at 0.2768, TRX is in the middle band of the bearish channel on the daily chart and is attempting to break above the 0.2765 resistance level. The Relative Strength Index (RSI) value is observed to be very close to the oversold zone at 32. Considering its position within the bearish channel and the RSI indicator, the TRX price may be expected to rise. This indicates that it may want to move towards the upper band of the channel. In such a case, it may test the 0.2765 and 0.2875 resistance levels in sequence. If it closes above the 0.2875 resistance level on a daily basis, it may test the 0.3000 resistance level. If it fails to close above the 0.2765 resistance level on a daily basis and selling pressure increases in the market, it may decline due to potential selling from this area. In such a case, it may test the 0.2640 support level. The 0.2430 level is being monitored as a critical support point on the daily chart. Staying above this level could maintain the upward trend, while closes below it could lead to increased selling pressure and deeper downward price movements.
Supports: 0.2640 – 0.2540 – 0.2430
Resistances: 0.2765 – 0.2875 – 0.3000
AVAX/USDT
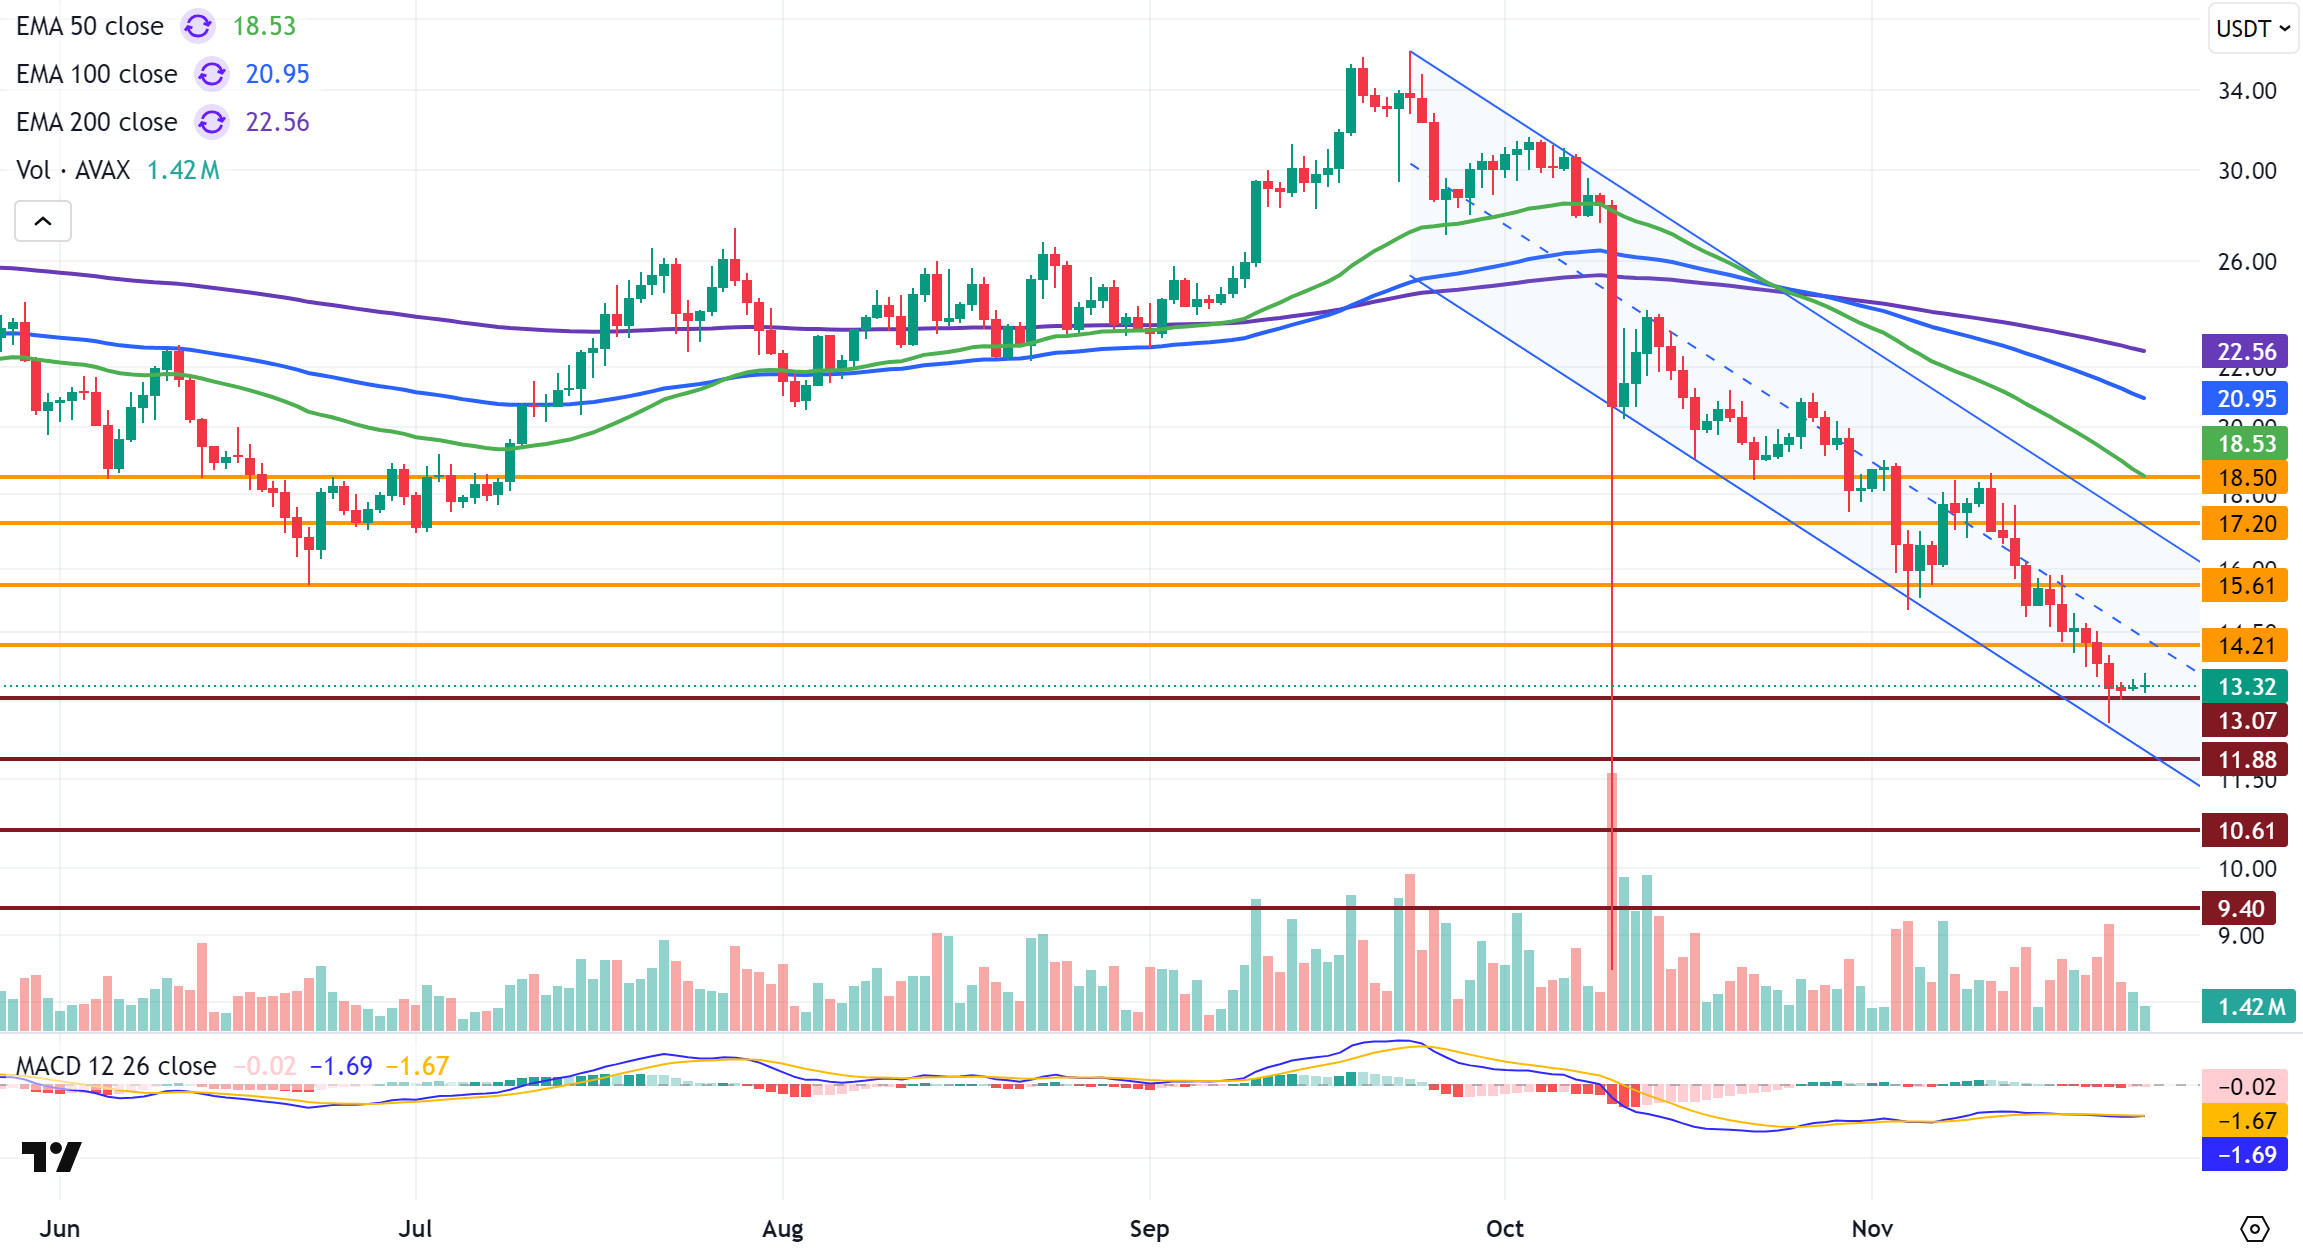
AVAX started last week at $15.15 and lost approximately 12.40% of its value during the week under the influence of selling pressure. Testing the $15.61 resistance level on the first day of last week, AVAX fell again due to selling pressure in this region. During the decline, AVAX tested the $14.21 support level first, followed by the $13.07 support level, continuing to move within a bearish channel. Throughout the week, it approached the lower band of the channel, falling to $12.57. AVAX experienced a slight recovery with rebound buying from the lower channel region, closing the week at $13.27. The price’s sideways movement within a narrow range over the past three days indicates that the overall market’s low volume and uncertainty are also affecting AVAX. Although there have been positive developments in the Avalanche ecosystem, these developments have not provided a meaningful positive contribution to the price under current market conditions.
On the daily chart, the Moving Average Convergence/Divergence (MACD) line remains below the signal line and is trending sideways. The MACD staying in negative territory indicates that the trend reversal has not yet been confirmed. The proximity between the lines suggests that a potential breakout could cause sharp directional changes in the short term. For momentum to strengthen, the MACD needs to move into positive territory. Otherwise, selling pressure at resistance levels could limit the upside again. AVAX continues to trade below all critical Exponential Moving Average (EMA) levels. The dense positioning of these levels above the price creates a strong resistance band and confirms that the trend remains in negative territory. Furthermore, the price beginning to move away from EMA levels indicates that selling pressure is being maintained. The price’s failure to move above the channel midline within the bearish channel also increases the likelihood of limited upward movement in the short term.
In the technical outlook, the $14.21 level is the first important resistance for AVAX in the short term. If this level is broken and sustained, AVAX could test the $15.61 and $17.20 levels respectively. The $18.50 level remains the strongest major resistance in the short term. Breaking this level during an upward movement is critical for gaining upward momentum . Otherwise, selling pressure in resistance zones could push the price down again. Conversely, the $13.07 level stands out as the first support zone in AVAX’s decline. If there are closes below this level, selling pressure could increase. AVAX’s decline could deepen towards the $11.88 and $10.61 support zones. In the overall picture, the MACD being in negative territory and the price trading below EMA levels indicates that the trend remains negative in the short term. Unless it manages to stay above $14.21, AVAX’s recovery efforts are likely to remain limited.
(EMA50: Green Line, EMA100: Blue Line, EMA200: Purple Line)
Supports: 13.07 – 11.88 – 10.61
Resistances: 14.21 – 15.61 – 17.20
SHIB/USDT
The Shiba Inu ecosystem has recently experienced a series of developments that have strengthened its position both in terms of regulation and in terms of products and infrastructure, despite price pressure. In Japan, Shiba Inu’s inclusion in the Green List maintained by the Japan Virtual Currency Exchange Association (JVCEA) has brought the token into the same compliance band as Bitcoin and Ethereum, facilitating listing on local exchanges and positioning Shiba Inu not just as a community-focused meme token, but also as an asset taken seriously in regulated markets. While the Financial Services Agency’s framework to potentially reduce crypto gains tax from approximately 55% to 20% is under discussion, the potential tax advantage for assets on the Green List has also become an important part of the Shiba Inu story.
In parallel, Coinbase, a major US-based exchange, has begun the process of launching regulated futures products for Shiba Inu that can be traded around the clock, making SHIB a more visible and accessible instrument in institutional derivatives markets. Within the same narrative, the Shiba Inu ETP product currently trading in Europe, along with Grayscale’s inclusion of Shiba Inu among spot ETF-eligible assets in its reports and its increased mention in basket-type ETF plans, demonstrated the ecosystem’s maturation around ETF expectations. On the infrastructure side, the plan to shut down old RPC endpoints on the Shibarium network and distribute traffic to new providers emphasized the transition to a more resilient and distributed architecture. The Shiba Inu card announced with Bitget Wallet paved the way for the use of ecosystem tokens in daily spending. During the same period, sharp increases in burn rates and fraud warnings from the team also stood out, thus presenting a more institutional framework advancing simultaneously in regulation, institutional products, network infrastructure, and security, despite Shiba Inu price fluctuations.
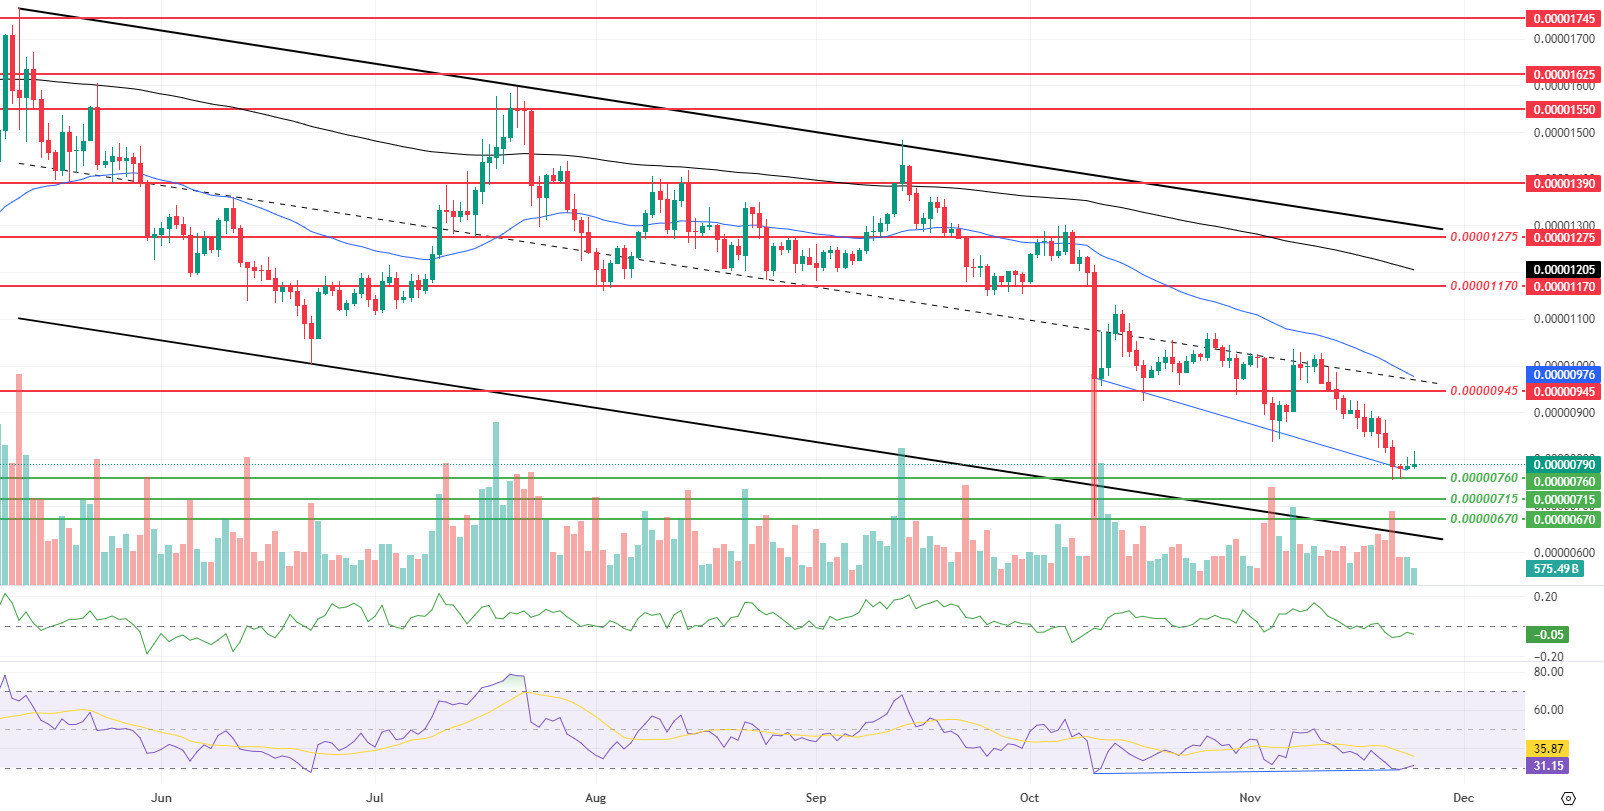
This week’s technical outlook indicates that the weakening trend structure, along with broken support levels, remains intact, and pressure still favors sellers. The price rebounding from the $0.00000760 region after losing the $0.00000860 and $0.00000835 support levels indicates a search for a new equilibrium in a lower band within the descending channel. Decreases in volume, momentum, and volatility suggest that sales are continuing to “drift” rather than becoming aggressive, and that attempts at a rebound are limited for now. The price moving towards the lower band of the descending channel and continuing to trade below the 50-period and 200-period Exponential Moving Averages (EMA) reveals that there is no clear reversal signal in the main trend yet, while the Chaikin Money Flow (CMF) indicator remaining in negative territory points to a weaker liquidity environment on the chain and spot side compared to the previous week. However, the positive divergence (Blue Line) between the price and the Relative Strength Index (RSI) oscillator implies that the downward pressure is gradually losing momentum and that the potential for a rebound within the current structure is strengthening. In the short term, the price around $0.00000790 indicates an area where this rebound potential is being tested around the lower band of the descending channel.
In terms of upward attempts, the $0.00000945 level remains the first critical threshold, If there are sustained closes above this level, followed by a retest of the $0.00001170 and $0.00001275 resistance levels with increasing volume, the rebound could shift towards the upper band of the descending channel, bringing a more meaningful recovery scenario approaching the EMA 50 and EMA 200 periods into focus. In this case, the nature of the movement could evolve from being merely a short-term short squeeze to a stronger correction structure. On the downside, $0.00000760 stands out as the first important support level. A drop below this level could accelerate the decline, paving the way for tests of the $0.00000715 and $0.00000670 levels. Particularly, if the CMF indicator deepens into negative territory and the price remains below these supports, the current structure will be interpreted as a weakening pullback phase within the main downtrend. Conversely, if the positive divergence on the RSI side is maintained and the price manages to hold above $0.00000760, the assessment that a gradual rebound process starting around the lower band of the descending channel remains on the agenda comes to the fore. (EMA200: Black line, EMA50: Blue line)
Supports: 0.00000760 – 0.00000715 – 0.00000670
Resistances: 0.00000945 – 0.00001170 – 0.00001275
LTC/USDT
Litecoin (LTC) closed the past week with a sharp 13.26% decline against USDT, entering the new week at $83.34. During the same period, LTC also fell 5.81% against Bitcoin, experiencing a negative period in terms of market value, with its total market value dropping to approximately $6.38 billion. Despite this decline, Litecoin maintained its 19th position in the global cryptocurrency market cap rankings. On the futures side, the total open interest decreased by 12% on a weekly basis. A significant portion of this decrease may be due to positions being liquidated. Additionally, funding rates approaching negative territory indicate that the general sentiment among market participants is bearish.
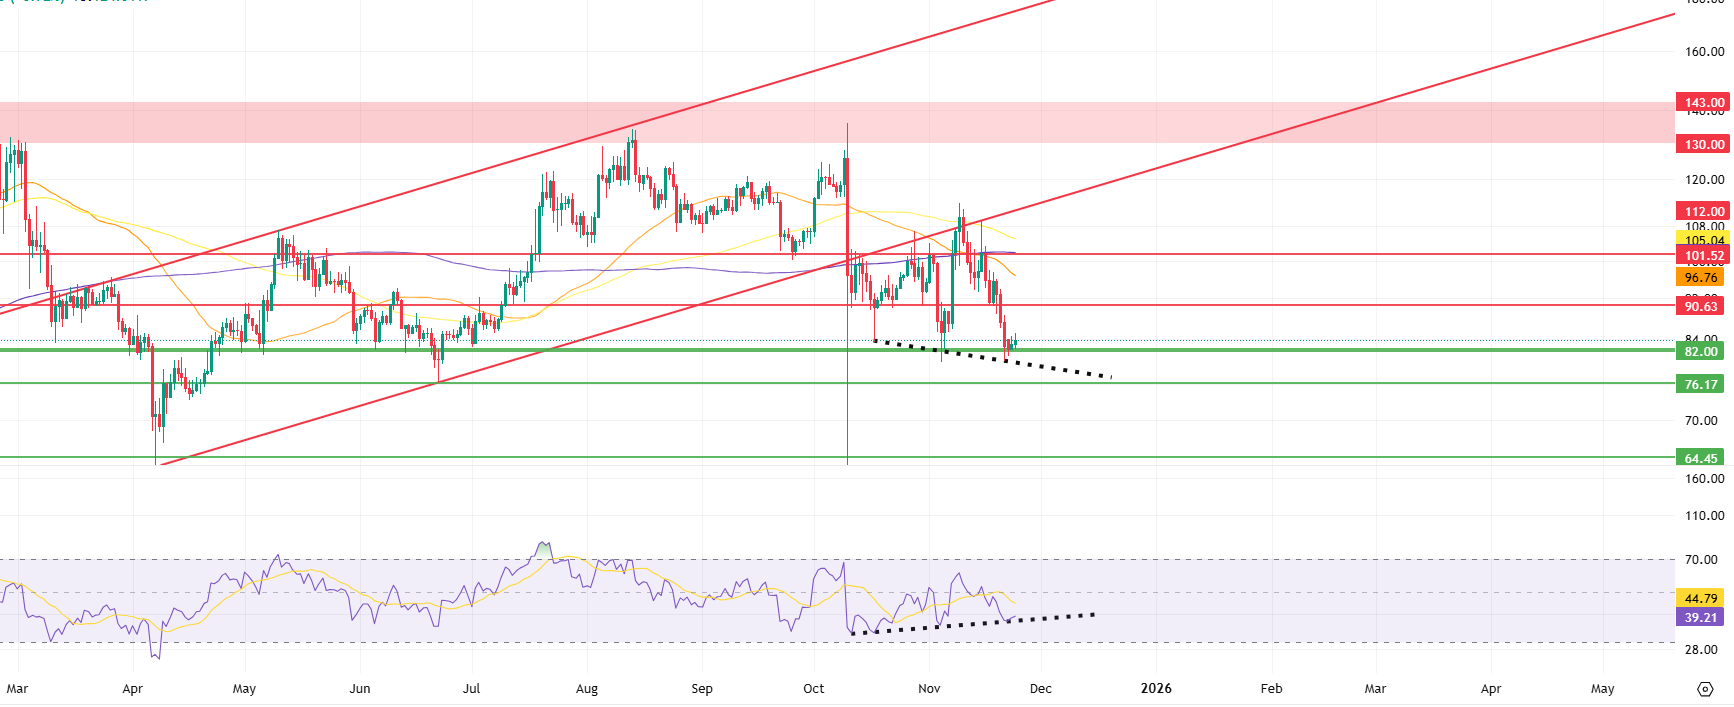
From a technical perspective, the Litecoin price continues to remain below the 100-period (yellow line), 50-period (orange), and 200-period (purple) moving averages. This structure indicates that selling pressure dominates both the short and long-term outlook. Furthermore, the price has not yet managed to close above the rising trend. Following last week’s sharp decline, the prevailing market anxiety is also causing selling positions to outweigh buying positions. On the other hand, a noteworthy situation on the chart is that, in addition to the price forming lower lows for some time, we see momentum rising in the Relative Strength Index (RSI) indicator at the opposite low levels. This situation is called “Bullish Divergence” or “Positive Divergence” and is interpreted as follows: even though the price reaches new lows, the rise in the RSI indicates that the selling pressure causing the price decline is decreasing. In other words, the rate of decline is slowing down. Therefore, it serves as an early warning that the current downtrend may end and an uptrend may begin. It can generally be considered a buying opportunity.
If buying reactions are observed with this structure, the rise is expected to be limited by the horizontal resistance at the $90.63 level in the first stage. This point forms a critical zone where the movement could lose momentum from a technical perspective. However, if the price manages to close above this level consistently, Litecoin’s short-term outlook could turn positive and support the price’s transition to an upward pattern targeting $101.52 ( ). Additionally, a break above the rising trend line at $112.00 could completely reverse the current negative structure and pave the way for a much stronger positive scenario.
In line with expectations, if the downward price movement continues, the $82.00 level stands out as the first important support. The fact that the price has rebounded from this region multiple times in the past creates the first line of defense where short-term buyers could re-enter. If this level is broken downward, the $76.17 level will come into focus as a stronger support that could limit the decline. In a deeper pullback scenario, the $64.45 level, which is the last line of defense, stands out as a critical stopping point.
Supports: 82.00 – 76.17 – 64.45
Resistances: 90.63 – 101.52 – 112.00
BNB/USDT
The BNB ecosystem report published this week points to significant changes compared to the previous week. According to the report, there has been a notable increase in the number of users, particularly on the BSC side; the number of daily active users rose from approximately 2,332,057 to 2,529,913, indicating strengthened participation in the ecosystem. On the opBNB side, there has been a more limited increase from 2,126,070 to 2,191,071. In contrast, there has been a significant decline in the number of transactions specifically on BSC: The number of transactions has fallen from approximately 137.8 million to 118.1 million, indicating that user behavior may have shifted towards higher-value transactions or that the usage model has changed. Transaction numbers on opBNB remained largely stable, hovering between 29.6 million and 29.4 million. The increase in transaction volume from $59.4 billion to $62.8 billion indicates that the flow of value on the network has strengthened in parallel with the increase in user participation. On the other hand, the decline in TVL from $12.167 billion to $11.6 billion reveals that the tendency for assets to be locked up for long periods has weakened, despite the increase in activity.
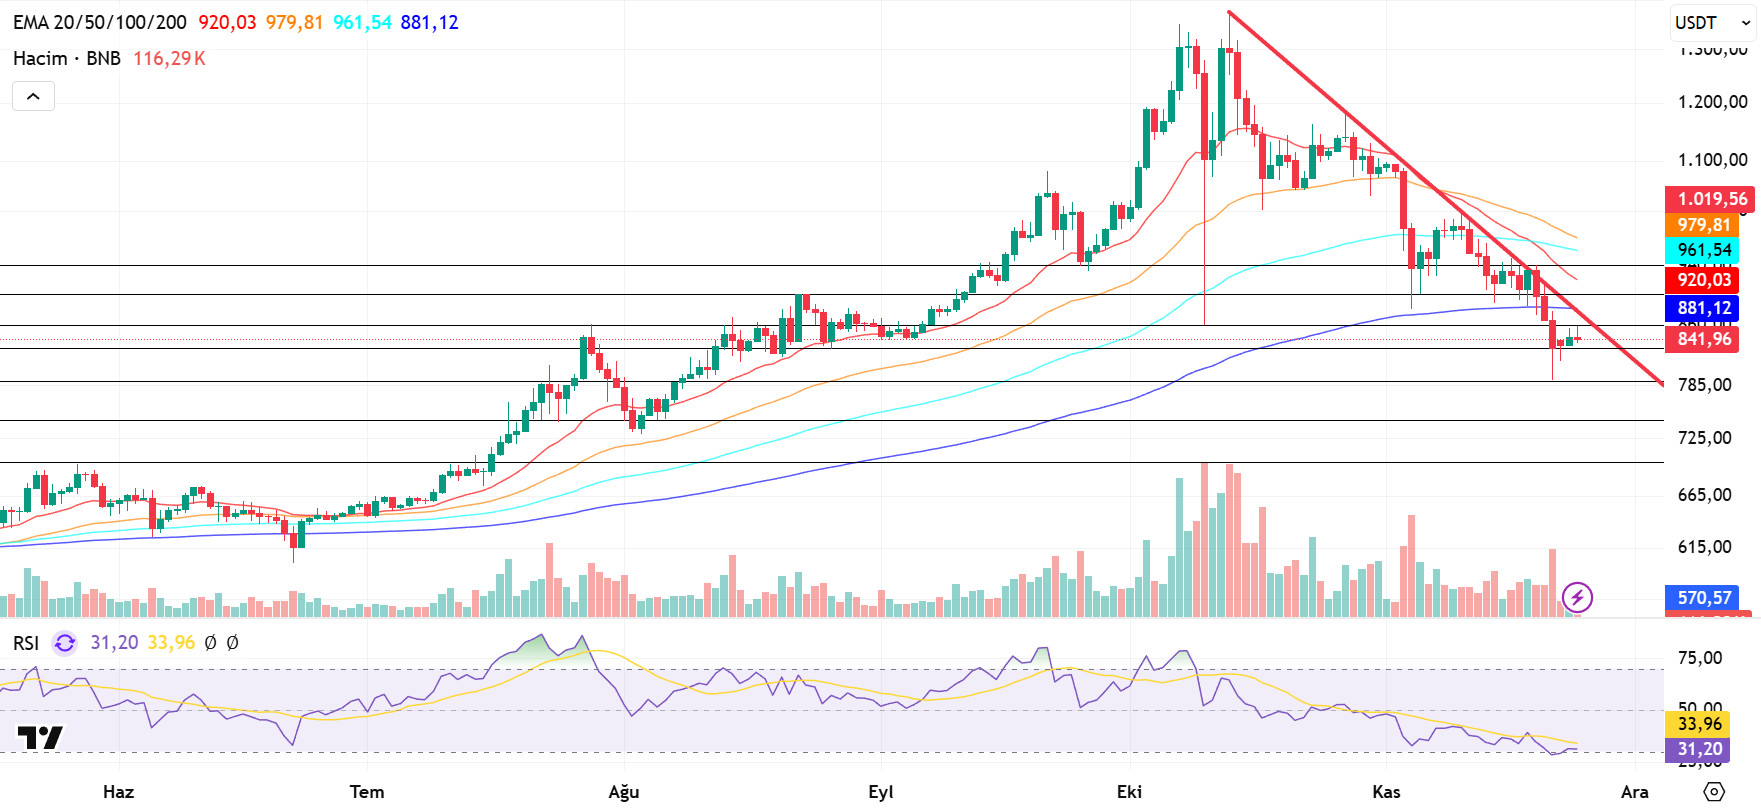
From a technical perspective, the correction that began after the all-time high (ATH) resulted in a pullback to the $790 support zone identified in previous analyses. After seeking support at these levels for a while, BNB ended its downward momentum with the resulting candle- s and turned its direction upward again. With this recovery, the price gained positive momentum up to the descending trend line.
Currently, the BNB/USDT pair presents a positive picture, but the search for direction continues due to selling pressure encountered below the descending trend line.
Technical indicators for BNB, currently trading in the $830–860 range, show that the low trading volume in recent periods has limited the positive outlook. Current volume levels are not considered strong enough to break the downtrend. Additionally, the Relative Strength Index (RSI) indicator is observed to be moving at relatively low levels, parallel to the weakness in momentum.
According to the technical picture, if buying appetite is maintained and market momentum recovers, BNB is expected to retest the $860 resistance level in the first stage. If this level is exceeded, it appears likely that the price will rise above the downward trend line. If the trend breaks upward and remains at this level, it is technically possible for the price to rise to $900 and $940 levels, respectively.
Conversely, if selling pressure increases again, the price is expected to test the $830 support level. If this level is broken, a pullback to the $790 and $745 support zones could come into play.
Supports: 830 – 790 – 745
Resistances: 860 – 900 – 940
LINK/USDT
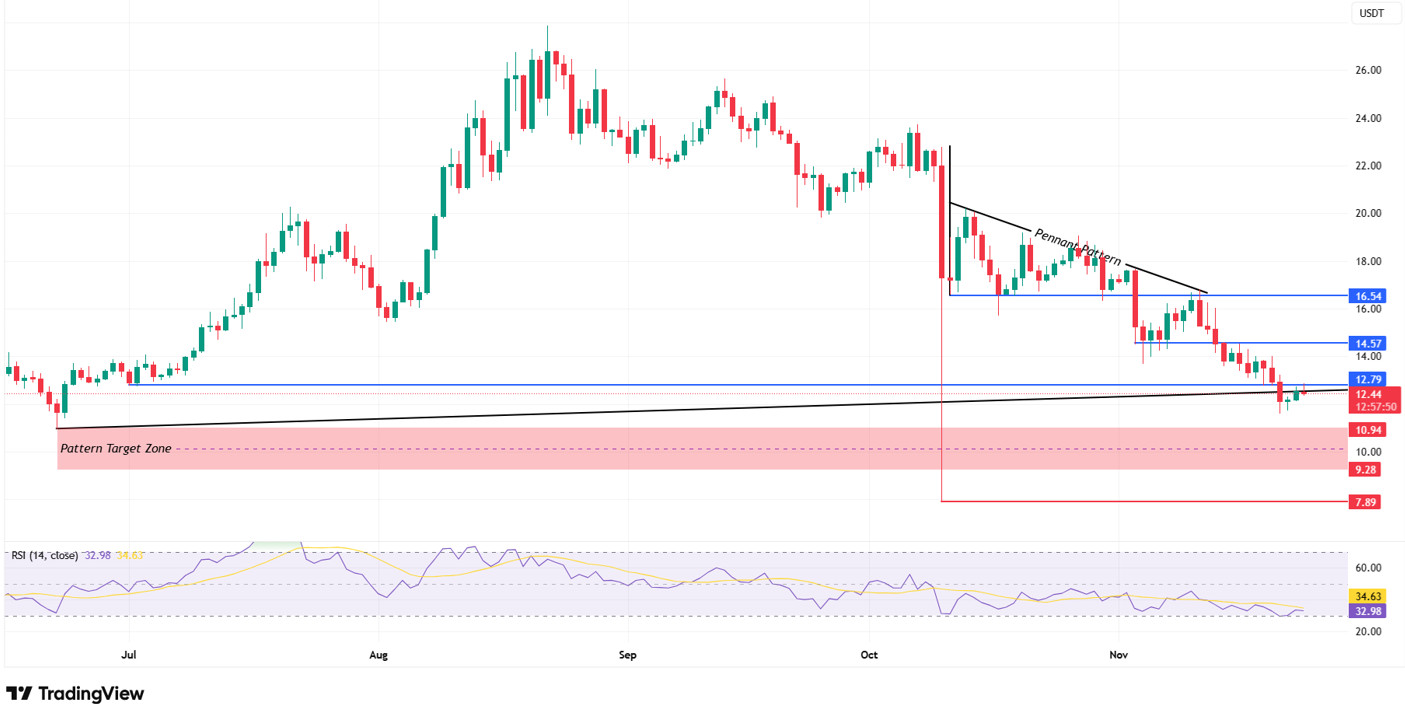
Looking at Link’s current technical outlook, we have reached the critical threshold of $12.79 that we highlighted last week. We also noted that the price reaction at this level would be decisive in determining the direction. In the current chart structure, we see that the reaction from this region has been quite limited and that the price has formed a horizontal squeeze at the lower part of the resistance band. The fact that the main trend line is only touched by wicks shows that buyers are not strong enough in this region.
In particular, the inability of the demand zone in the $12.44–12.79 range to generate a strong reaction suggests that the downward structure is still dominant and that reaction rallies are being viewed as selling opportunities. This outlook also supports the validity of the possibility of a pullback towards the technically targeted measurement zone with the breakout of the flag formation. If the price fails to settle above the $12.79 level, it is highly likely that rallies will remain limited and the current downward structure will be preserved. In such a scenario, the price could increase the likelihood of a deeper correction towards the formation target of $10.94–9.28.
In upward scenarios, the $12.79 level can be considered the most critical first threshold, as it is both a horizontal resistance area and our trend resistance. Sustained movement above this level could strengthen the trend, increase buy positions, and pull the price up to our next level at $14.57. However, for our positive upward scenario to gain traction, our formation structure must break down, and we need to see pricing above the $16.54 level.
On the momentum side, the Relative Strength Index (RSI) is trading below the neutral zone, causing upward reaction movements to remain weak. The RSI’s inability to rise above the 45–50 band indicates that buyers are not gaining strength in the short term and that selling pressure increases as resistance levels are approached. When we evaluate the overall technical outlook and the RSI, the current position shows that sufficient momentum for a trend reversal has not yet been established.
Supports: 10.94 – 9.28 – 7.89
Resistances: 12.79 – 14.57 – 16.54
SUI/USDT
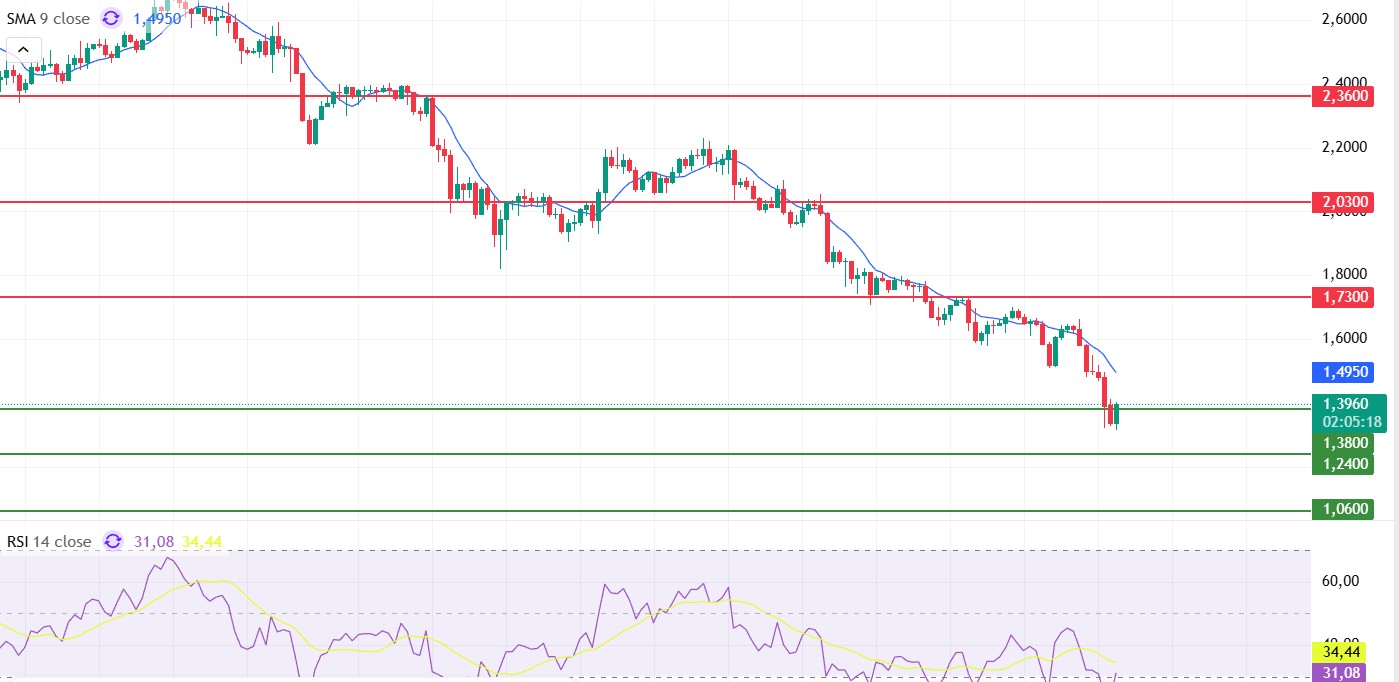
Looking at Sui’s technical outlook, we see that the price has been moving sideways around the $1.39 level on a 4-hour basis, influenced by fundamental developments. The Relative Strength Index (RSI) is currently in the range of 34.44 – 31.08. This range indicates that the market is trading close to the buy zone; a drop in the RSI to the 35.00 – 25.00 range could signal a potential buying point. If the price moves upward, the $1.73, $2.03, and $2.36 levels can be monitored as resistance points. However, if the price falls to new lows, it could indicate that selling pressure is intensifying. In this case, the $1.36, $1.24, and $1.06 levels stand out as support zones. Based on the trend line, a pullback to $1.06 appears technically possible. According to Simple Moving Averages (SMA) data, Sui’s average price is currently at $1.49. If the price remains below this level, it could signal that the current uptrend may not continue technically.
Supports: 1.06 – 1.24 – 1.38
Resistances: 1.73 – 2.03 – 2.36
ADA/USDT
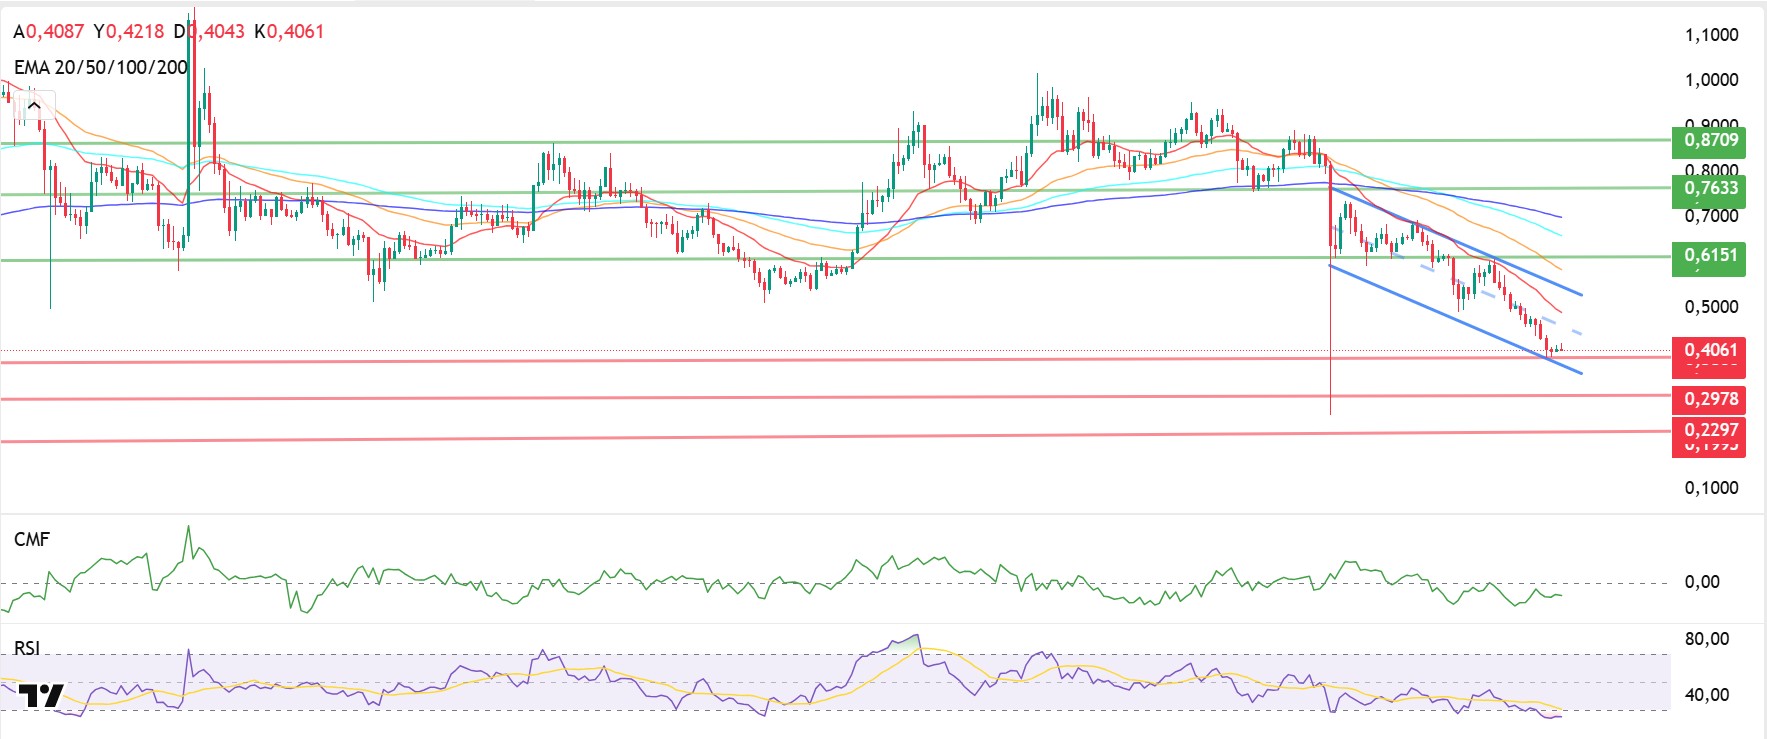
Since last week, the ADA price has dropped by 17%, falling to $0.4073. Cardano experienced a blockchain split on November 21 after a developer exploited a deserialization error created by artificial intelligence. The split lasted approximately 24 hours and caused exchanges such as Coinbase to halt ADA trading. The network stabilized within a few hours after Input Output Global (IOG) distributed the fix. Hoskinson published a report titled “Myths and Facts” addressing claims of a network crash during the split. The audit confirmed there were no protocol errors. During this period, the ADA price broke below the first strong support level of 0.4918 and tested the 0.3880 level. With the pullback movement it received from this level, it continues within the downtrend channel.
Technically, the ADA price is trading quite far from the 20-day and 50-day Exponential Moving Averages (EMA 20 – Red Line) (EMA 50 – Orange Line). The resistance point of the downtrend, at the $0.5270 , indicates that ADA buyers are willing to buy at higher prices and that buying pressure is increasing over time. A retest of this zone could play a critical role in completing the downtrend channel. If the price breaks above the 20-day Exponential Moving Average (EMA 20 – Red Line) level, it is expected to close above the 50-day Exponential Moving Average (EMA 50 – Blue Line). If it closes in this region, the major resistance point at the $0.6151 level could be targeted. The Relative Strength Index (RSI) continues in the oversold zone at 24 levels, while the Chaikin Money Flow (CMF-20) remains at -0.06 levels, indicating that the price is trading in the sell zone. If the price falls as a result of the macroeconomic data expected to be announced this week and the statements to be made by US President Trump, the important levels we will follow are $0.2978 and $0.2297.
Supports: 0.3692 – 0.2978 – 0.2297
Resistances 0.8709 – 0.7633 – 0.6151
Legal Notice
The investment information, comments, and recommendations contained in this document do not constitute investment advisory services. Investment advisory services are provided by authorized institutions on a personal basis, taking into account the risk and return preferences of individuals. The comments and recommendations contained in this document are of a general nature. These recommendations may not be suitable for your financial situation and risk and return preferences. Therefore, making an investment decision based solely on the information contained in this document may not result in outcomes that align with your expectations.

