
September 01-08, 2025 – Weekly Technical Analysis Report
BTC/USDT
Switzerland announced that it will suspend shipments of US goods starting August 26. US President Donald Trump made assessments regarding contacts with Russia, Ukraine, China, South Korea, and Europe, while also dismissing Fed member Lisa Cook. The US second quarter GDP data was announced at 3.3%, exceeding expectations, while core PCE was 2.9%. The US Court of Appeals ruled Trump’s global tariffs illegal; Trump, however, announced that all tariffs would remain in effect. Strategy and Metaplanet continue to purchase Bitcoin every week. Fed members continue to discuss expectations for interest rate cuts.
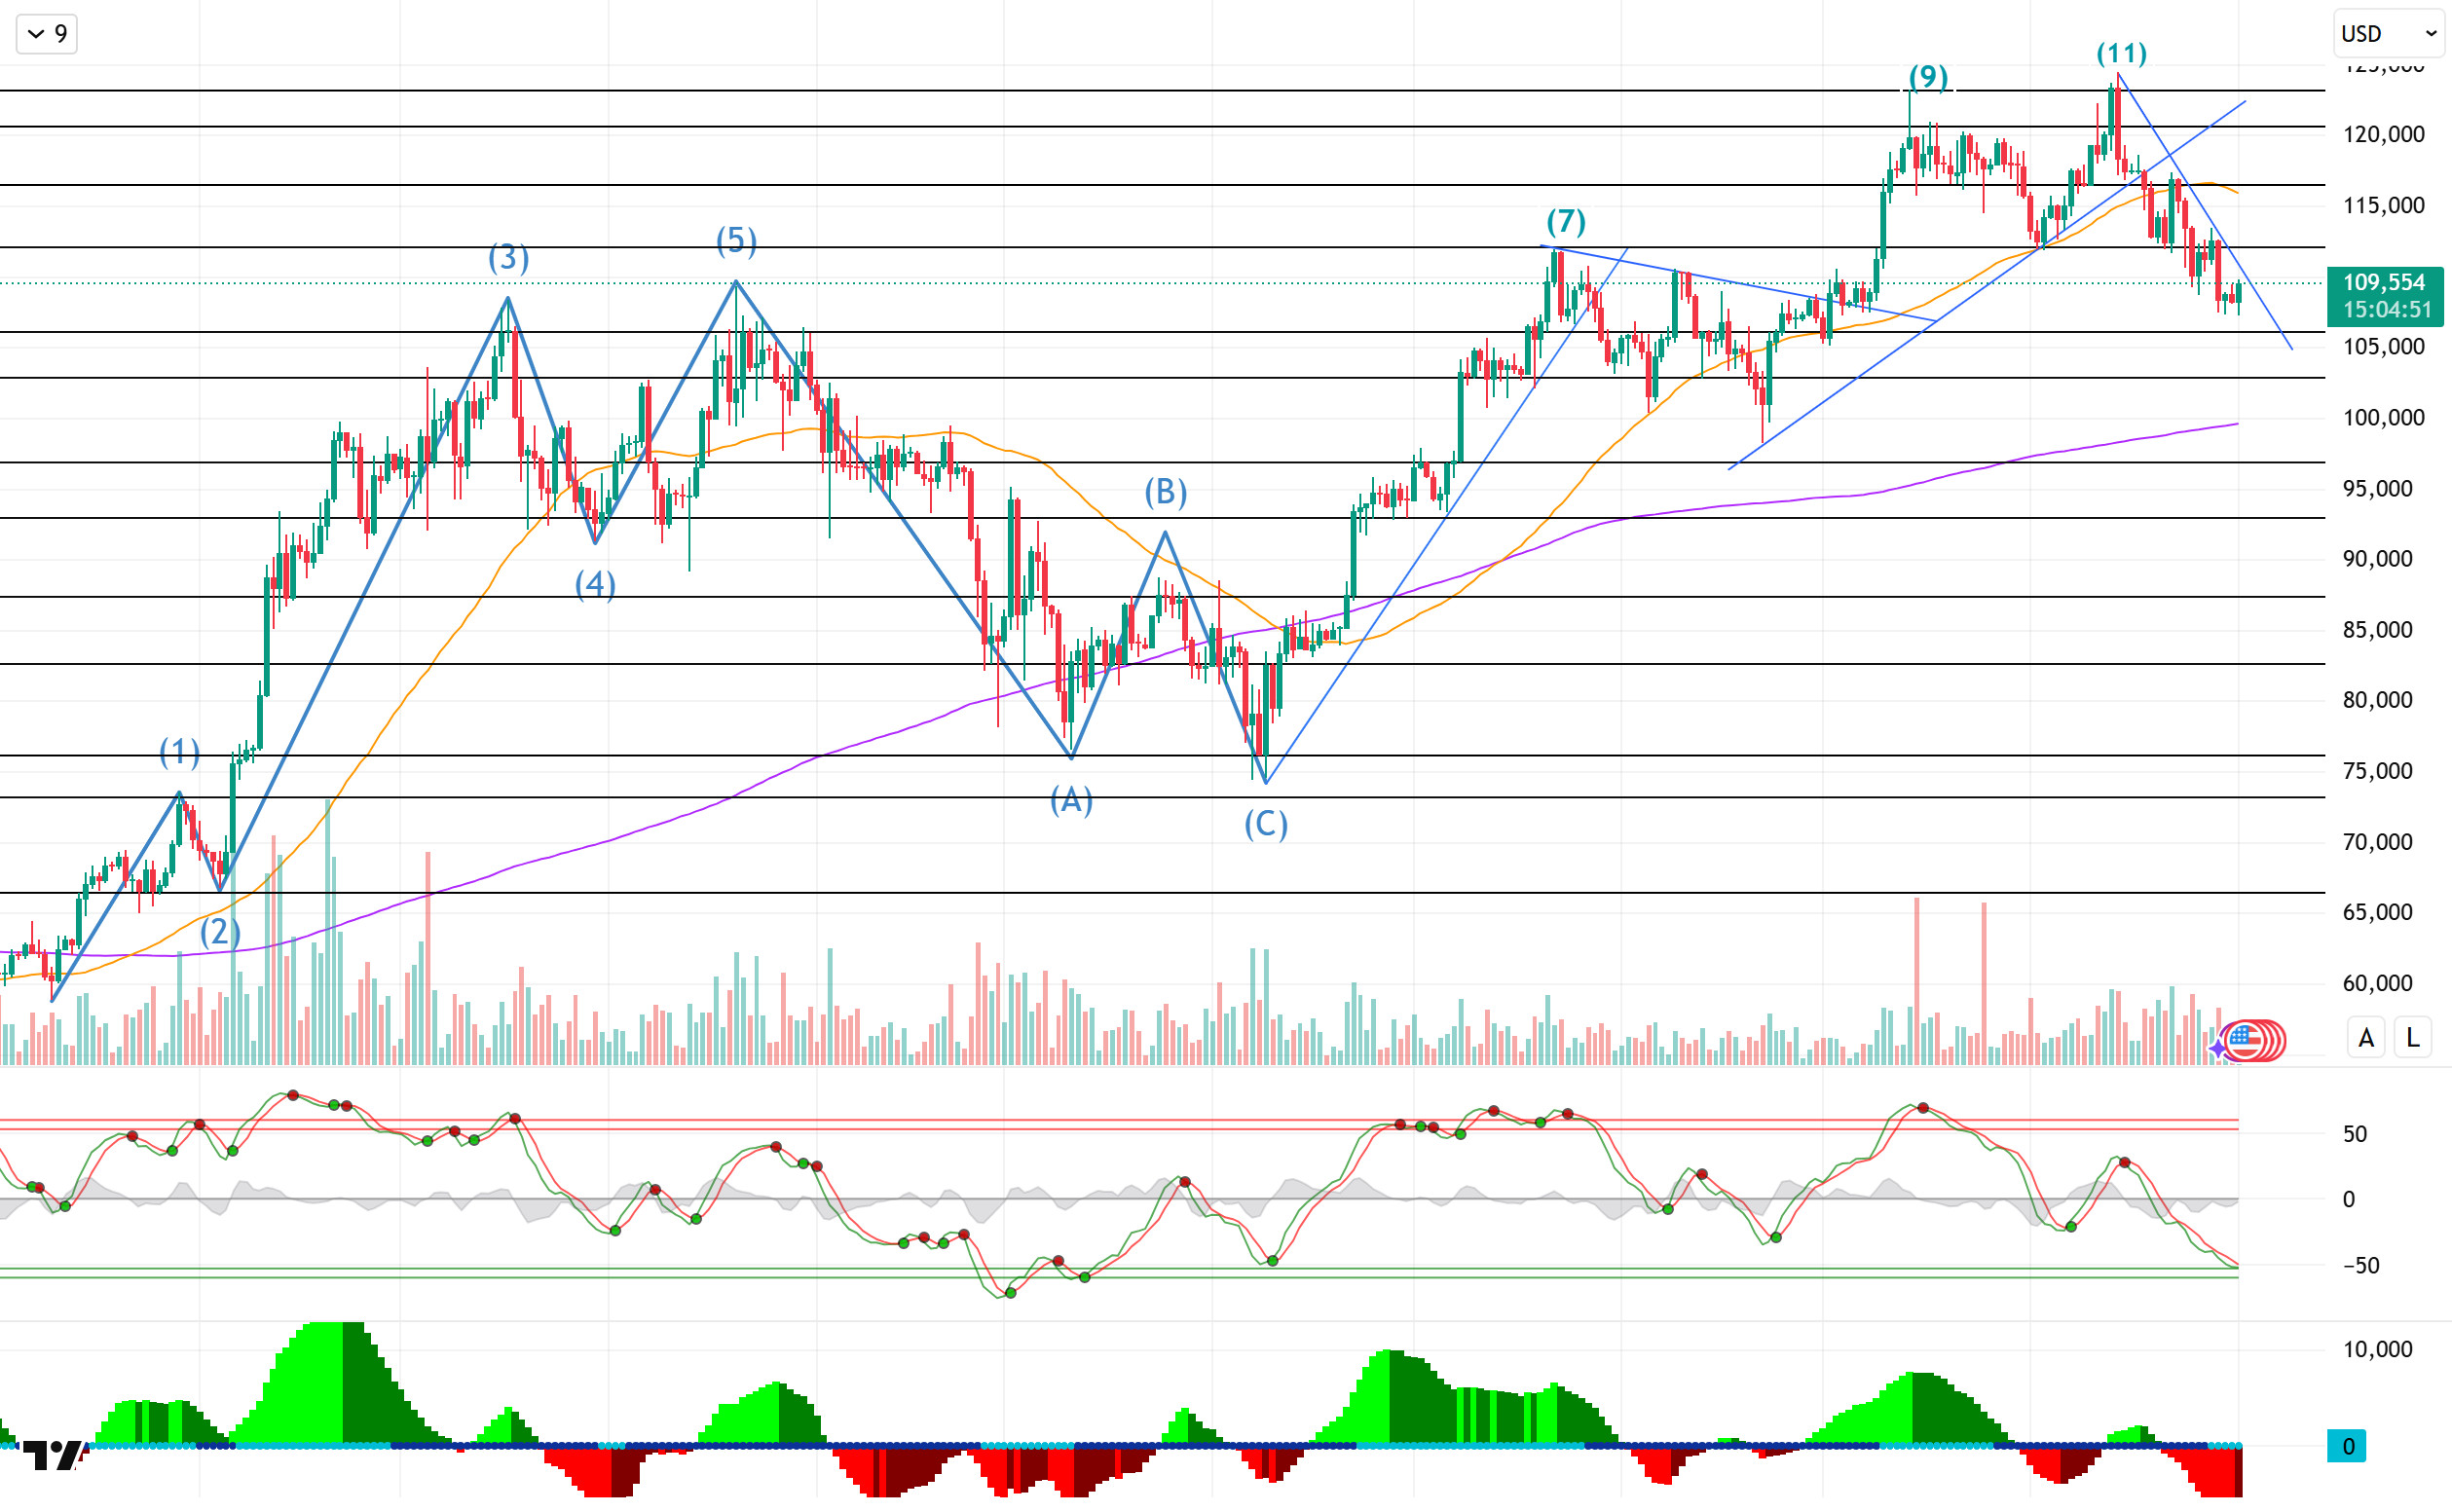
Looking at the daily technical outlook following all these developments, BTC reached the 11th point peak with its golden cross formation and then moved up to the ATH level, reaching 124,000. Then, the price, which entered a downtrend within a major uptrend, fell back to the 107,000 level. BTC, which started the week at 109,400, is preparing to close the week with a 3.42% decline.
Looking at technical indicators, the WT oscillator has reached the oversold zone on the daily chart. The Squeeze Momentum indicator (SM) is poised to gain strength within the negative zone. Meanwhile, in moving averages, the golden cross pattern continues as the 50-day SMA crosses above the 200-day SMA.
When examining weekly liquidity data, it can be seen that with the recent rise, the selling level above 109,000 has been liquidated, while another selling level around 114,000 has provided accumulation. The buying level, while not intense, is accumulating around the 107,000 level.
In summary, fundamental developments have put pressure on the price. The technical structure is trying to prepare the ground for an uptrend and help the price gain momentum. In liquidity data, sell positions above 114,000 stand out as the target area. While the price has moved away from the peak level it reached at the 11th point, there is a lack of catalysts to push it back above the ATH level. If fundamental developments accompany technical and liquidity data, we can expect the price to regain momentum with a breakout of the downward trend.In this context, 112,000 and 115,000 stand out as reference zones, and exceeding these levels could trigger upward price movements. In the event of a possible new selling pressure, we will follow the 105,000 reference support point.
Supports: 105,000 – 102,500 – 99,000
Resistances: 112,000 – 115,000 – 120,000
ETH/USDT
Ethereum has experienced a remarkable process since August 19, influenced by both macroeconomic developments and institutional demand. The Fed’s statements supporting expectations of interest rate cuts and soft economic data from the US boosted risk appetite, positively impacting crypto markets. During this period, the continued pace of institutional purchases of Ethereum contributed to the price remaining strong. Notably, the SEC’s reclassification of ETH as a “utility token,” the expansion of ETF structures, the introduction of staking-supported products, and ETF net inflows reaching $4 billion in August alone were noteworthy. BlackRock’s $3.31 billion inflow into its ETHA fund and approximately 70 publicly traded companies adding more than 4 million ETH to their portfolios strengthened institutional confidence. During this period, companies such as SharpLink Gaming also increased their Ethereum holdings, demonstrating the depth of institutional demand.
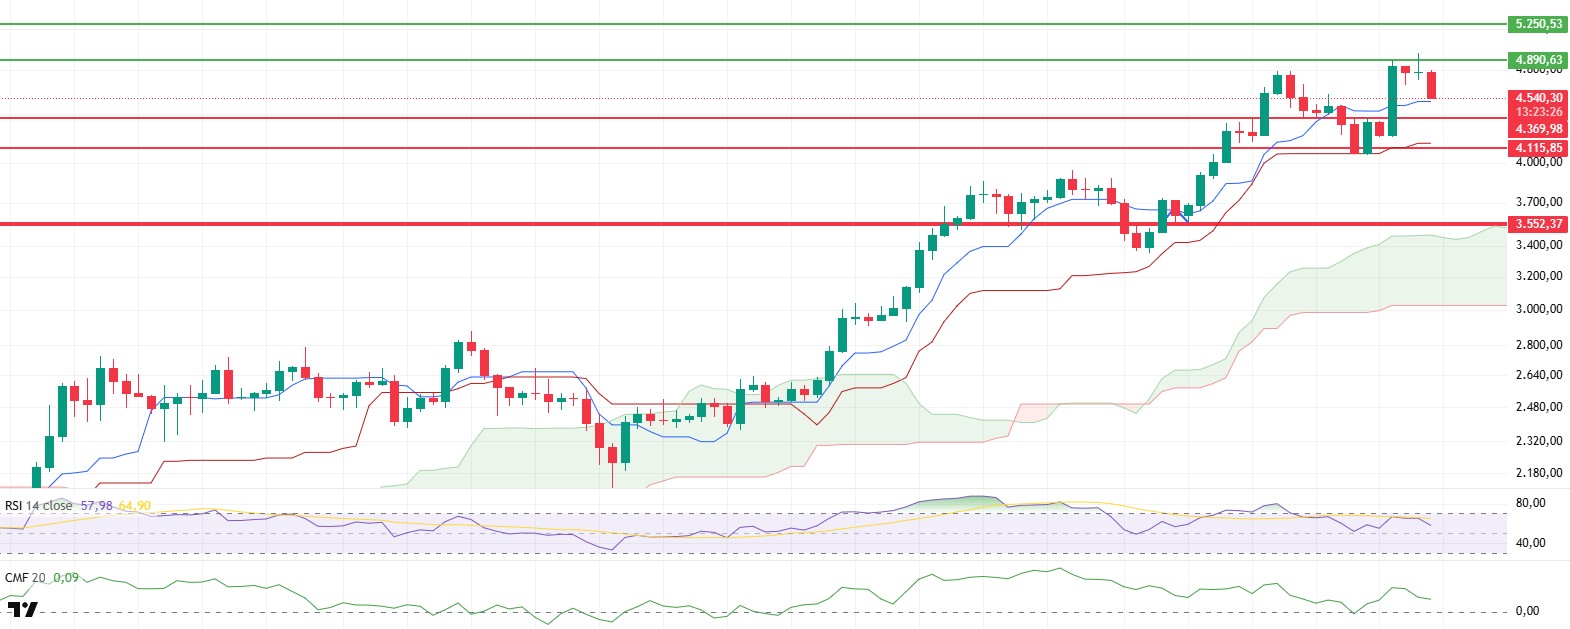
Looking at price movements, the sharp correction that began after reaching an all-time high of $4,956 stands out. First, with the break of the tenkan level, the price quickly fell back to the kijun support at $4,250. Although strong rebound buying from this point pushed the price up to $4,500, increased selling pressure on Sunday led to another pullback. This pullback became more pronounced with heavy selling early Sunday morning, indicating increased short-term volatility and market participants becoming more cautious.
Technical indicators clearly reflect this period of weakness. The Chaikin Money Flow (CMF) shifted from positive to negative territory, signaling a decline in market liquidity and increased selling pressure. The Relative Strength Index (RSI) broke down from the overbought zone, while the decline in momentum indicators confirms a slowdown in upward momentum. However, the overall trend structure remains intact. As the price continues to stay above the kumo cloud, this keeps the structure positive in the medium term. The upward slope of the kumo cloud increases the likelihood of the price finding support in potential declines . On the other hand, the break below the tenkan level creates a fragile short-term structure, increasing the risk of a short-term pullback.
Looking at critical levels, the $4,369 level maintains its position as an intermediate support. A downward break of this level could pull the price towards the $4,115 main support zone. In upward movements, the $4,890 level stands out as the most critical resistance, and breaking through this region could make testing new record levels possible. To remain strong in the medium term, the price needs to regain the tenkan level, the RSI and momentum indicators need to recover, and the CMF needs to return to positive territory.
The overall outlook shows that Ethereum maintains its positive medium-term structure, but short-term risks are increasing. Continued institutional buying, strong ETF inflows, and a supportive macroeconomic environment provide the necessary ground for the price to regain momentum. However, the weak performance of technical indicators and the decline in liquidity flow point to the possibility of continued volatility in the short term. Therefore, whether support levels can be maintained and whether the market can return to a buyer-dominated structure will be decisive in the coming days.
Support levels: 4,369 – 4,115 – 3,552
Resistance levels: 4,890 – 5,250 – 5,550
XRP/USDT
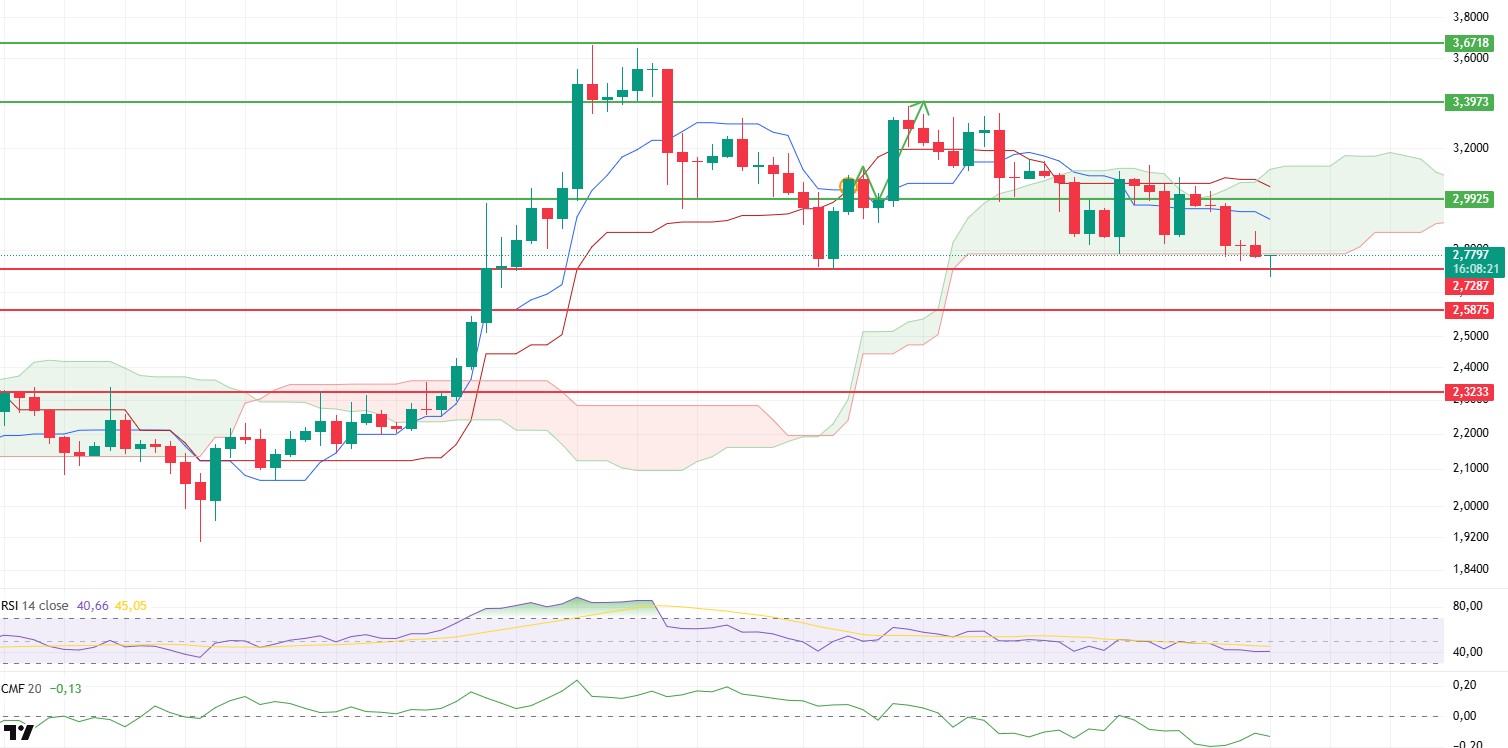
Japanese financial giant SBI’s new partnerships with USDC issuer Circle, XRP developer Ripple, and Web3-focused Startale stand out as a positive development for the XRP ecosystem in the medium to long term. While these agreements have the potential to increase institutional adoption, there has not yet been a corresponding reflection in the price. After losing its $2.99 support level during the week, XRP fell to $2.72 amid increased selling pressure. Buying interest from this area remained quite weak, and the price failed to regain upward momentum.
On the technical side, looking at the Ichimoku indicator, the price breaking below the lower band of the Kumo cloud indicates that selling pressure remains strong. Furthermore, the Tenkan line remaining below the Kijun level confirms that short-term momentum is in the hands of sellers. The tenkan line’s failure to curve upward and the price’s inability to hold above the kijun level indicate that rebound rallies may remain limited for now.
The Relative Strength Index (RSI) indicator also maintains its weak outlook. Unable to rise above the base moving average line, the RSI continues its downward trend and clearly shows the weakness in price movement. Furthermore, since the RSI has not yet entered the oversold zone, it is possible to say that the short-term downside risk continues. This situation increases the likelihood of triggering a deeper wave of selling.
On the liquidity side, the Chaikin Money Flow (CMF) indicator remains in negative territory. This indicates that liquidity outflows from the market are intensifying and that selling pressure quickly kicks in during upward attempts. Unless liquidity inflows regain strength, the likelihood of recoveries being sustainable appears quite low.
In the short term, if the price fails to rise above $2.99, downward movements are likely to continue. In particular, if the price remains below the $2.72 support level, it could pave the way for the price to retreat first to $2.65 and then to $2.58. Conversely, if a strong buying wave emerges and the price clearly breaks above the $2.99 level, an upward recovery process could begin. In this scenario, the $3.08, then $3.22, and finally $3.39 levels could be targeted again. In conclusion, although the fundamental news flow is positive in the long term, the technical outlook continues to be negative for now. Unless a permanent reversal signal is seen on the chart, it can be said that the risks remain on the downside and confirmation should be awaited for new buy positions.
Support levels: 2.7287 – 2.5875 – 2.3233
Resistances: 2.9925 – 3.3973 – 3.6718
SOL/USDT
Last week in the Solana ecosystem:
- VanEck filed an S-1 application for the JitoSOL ETF.
- A hacker who stole over $300 million from users of a centralized exchange purchased 38,126 Solana worth $7.95 million at $209 each.
- Galaxy, Jump, and Multicoin raised $1 billion in funding for Solana purchases.
- Sharps Technology announced a $400 million investment plan for Solana.
- Pantera Capital set a target of $1.25 billion to support the Solana treasury initiative.
- Play Solana will launch its handheld gaming device in October.
- Over 99% of the votes cast for Solana’s Alpenglow protocol were in favor.
- DeFi Development Corp. increased its Solana holdings by 29% with a $77 million purchase and now holds 1.83 million SOL worth $371 million.
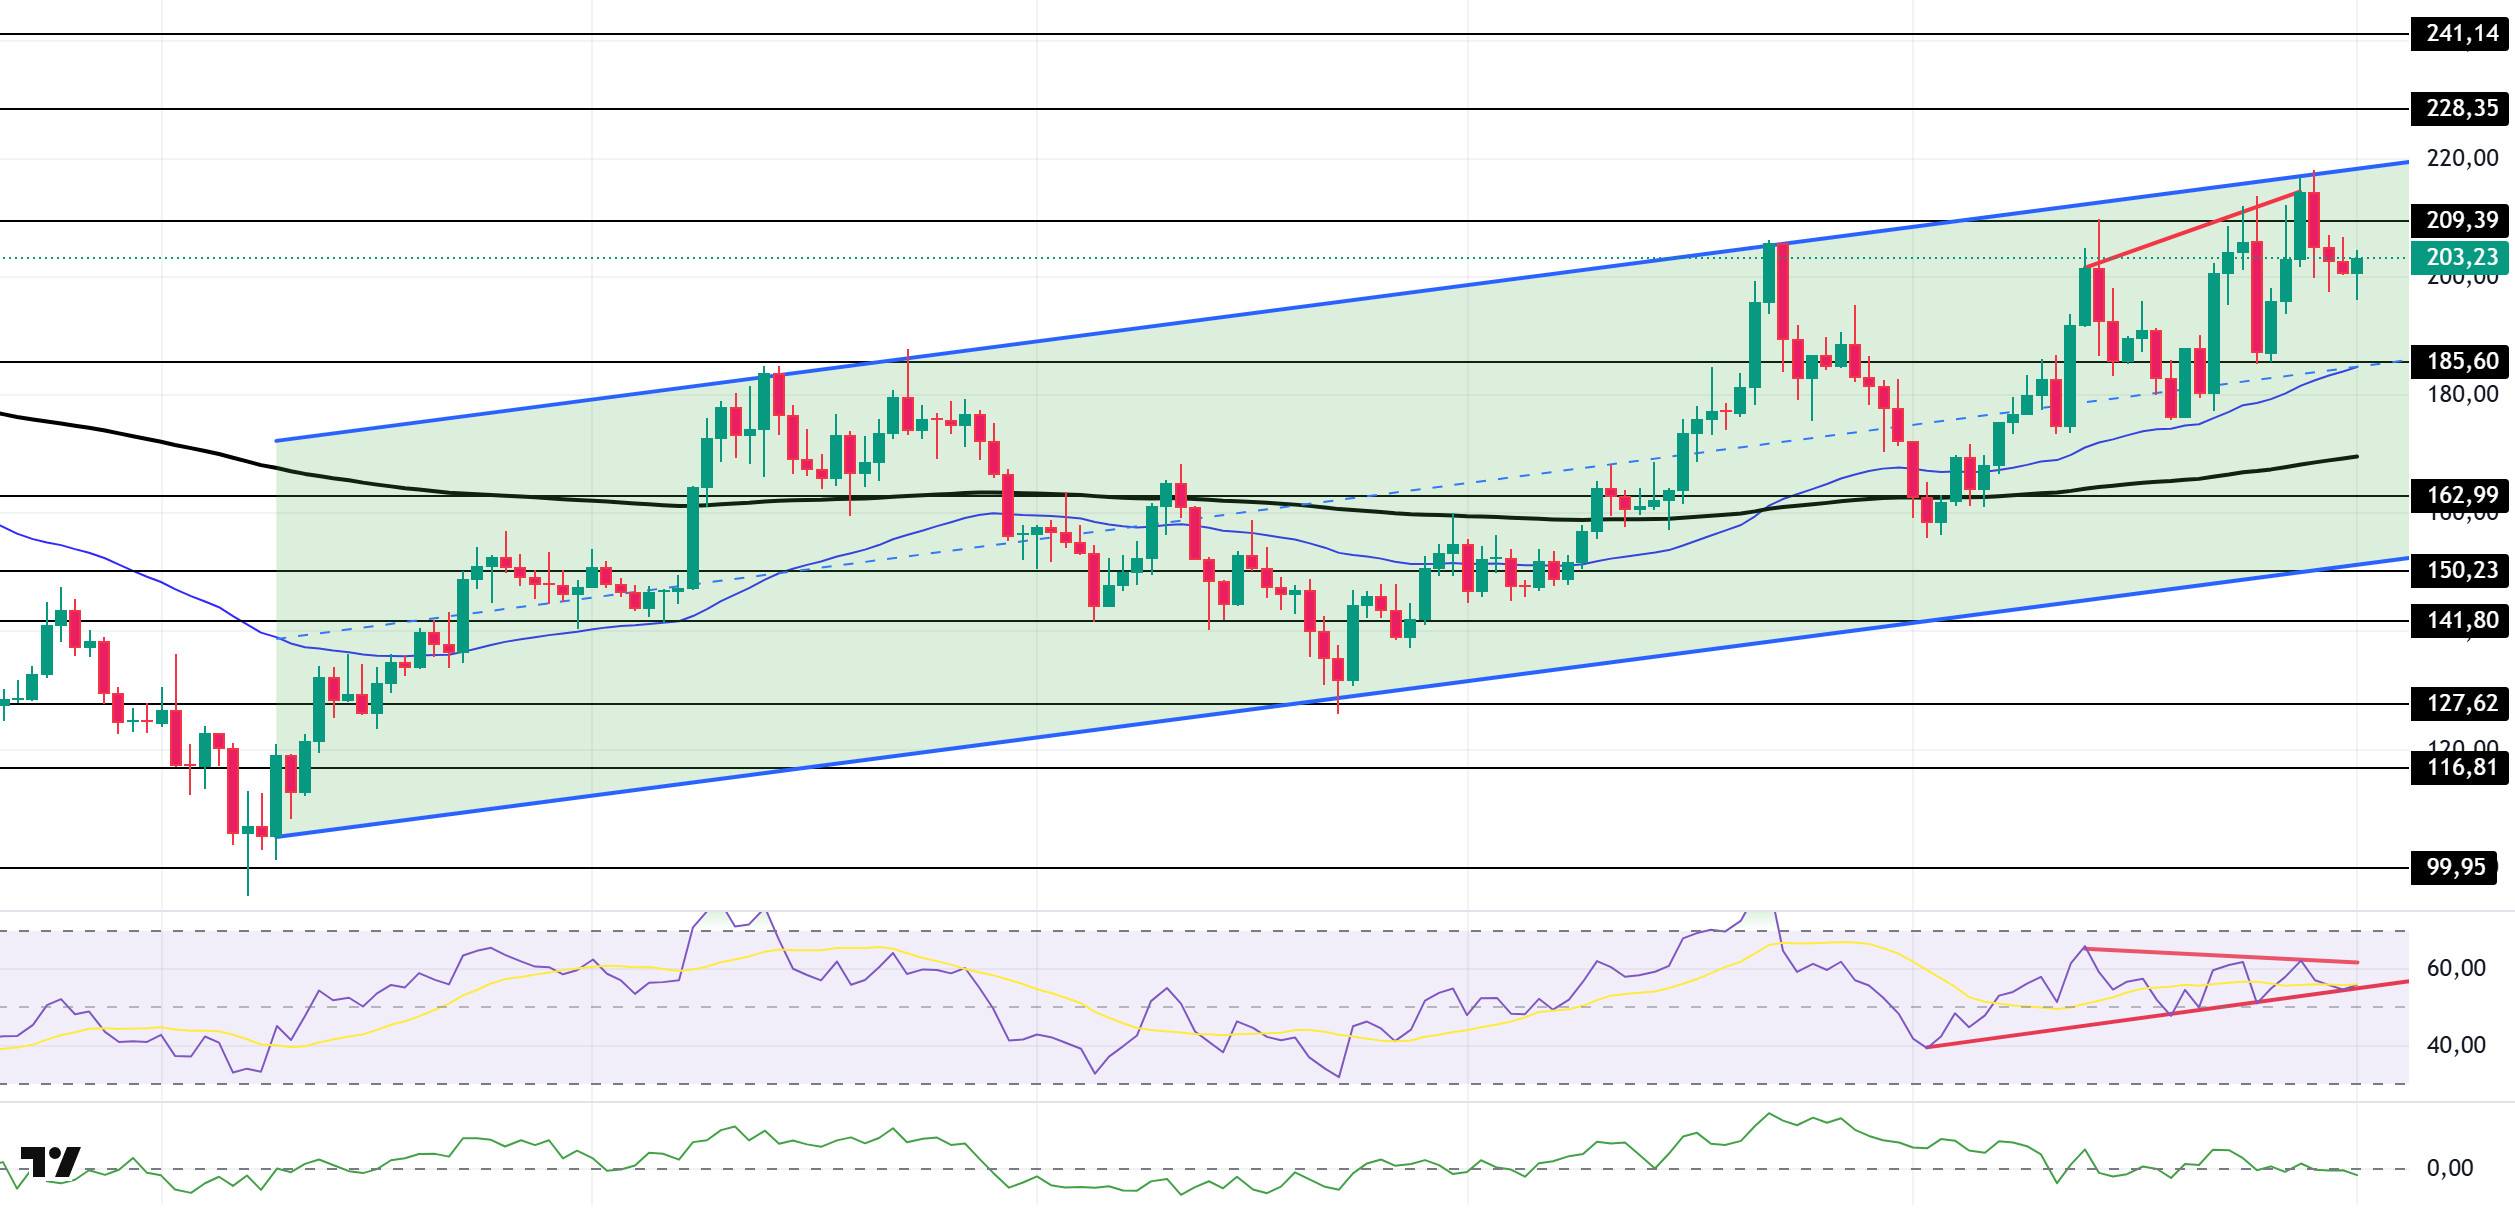
The SOL price has been volatile this week. The asset tested the resistance level of the upward trend that began on April 9 once again and experienced a pullback. The price continued its decline, breaking below the strong resistance level of $209.39. As of now, the asset continues to decline and may test the 50 EMA (Exponential Moving Average – Blue Line) moving average as support. On the upside, the $209.39 level can be monitored.
The asset is trading above its 50 EMA and 200 EMA (Black Line) moving averages, indicating an upward trend. Furthermore, the 50 EMA remaining above the 200 EMA signals the continuation of a technical “golden cross” formation. This suggests that the potential for upward movement continues in the medium term. On the other hand, the large gap between the two moving averages increases the possibility of a sideways movement or a decline. The RSI (14) is in positive territory. At the same time, the indicator remained above the upward trend that began on August 2. This indicates that buying pressure continues. However, negative divergence could cause a pullback. The Chaikin Money Flow (CMF-20) has retreated to a neutral level; at the same time, the decrease in money inflows may push the CMF-20 indicator into negative territory. If macroeconomic data remains positive and developments in the ecosystem continue favorably, the first major resistance level of $228.35 could be retested. Conversely, in the event of potential negative news flow or deterioration in macro data, the $185.60 level could be monitored as a potential buying opportunity.
Supports: 185.60 – 162.99 – 150.23
Resistances: 209.39 – 228.35 – 241.14
DOGE/USDT
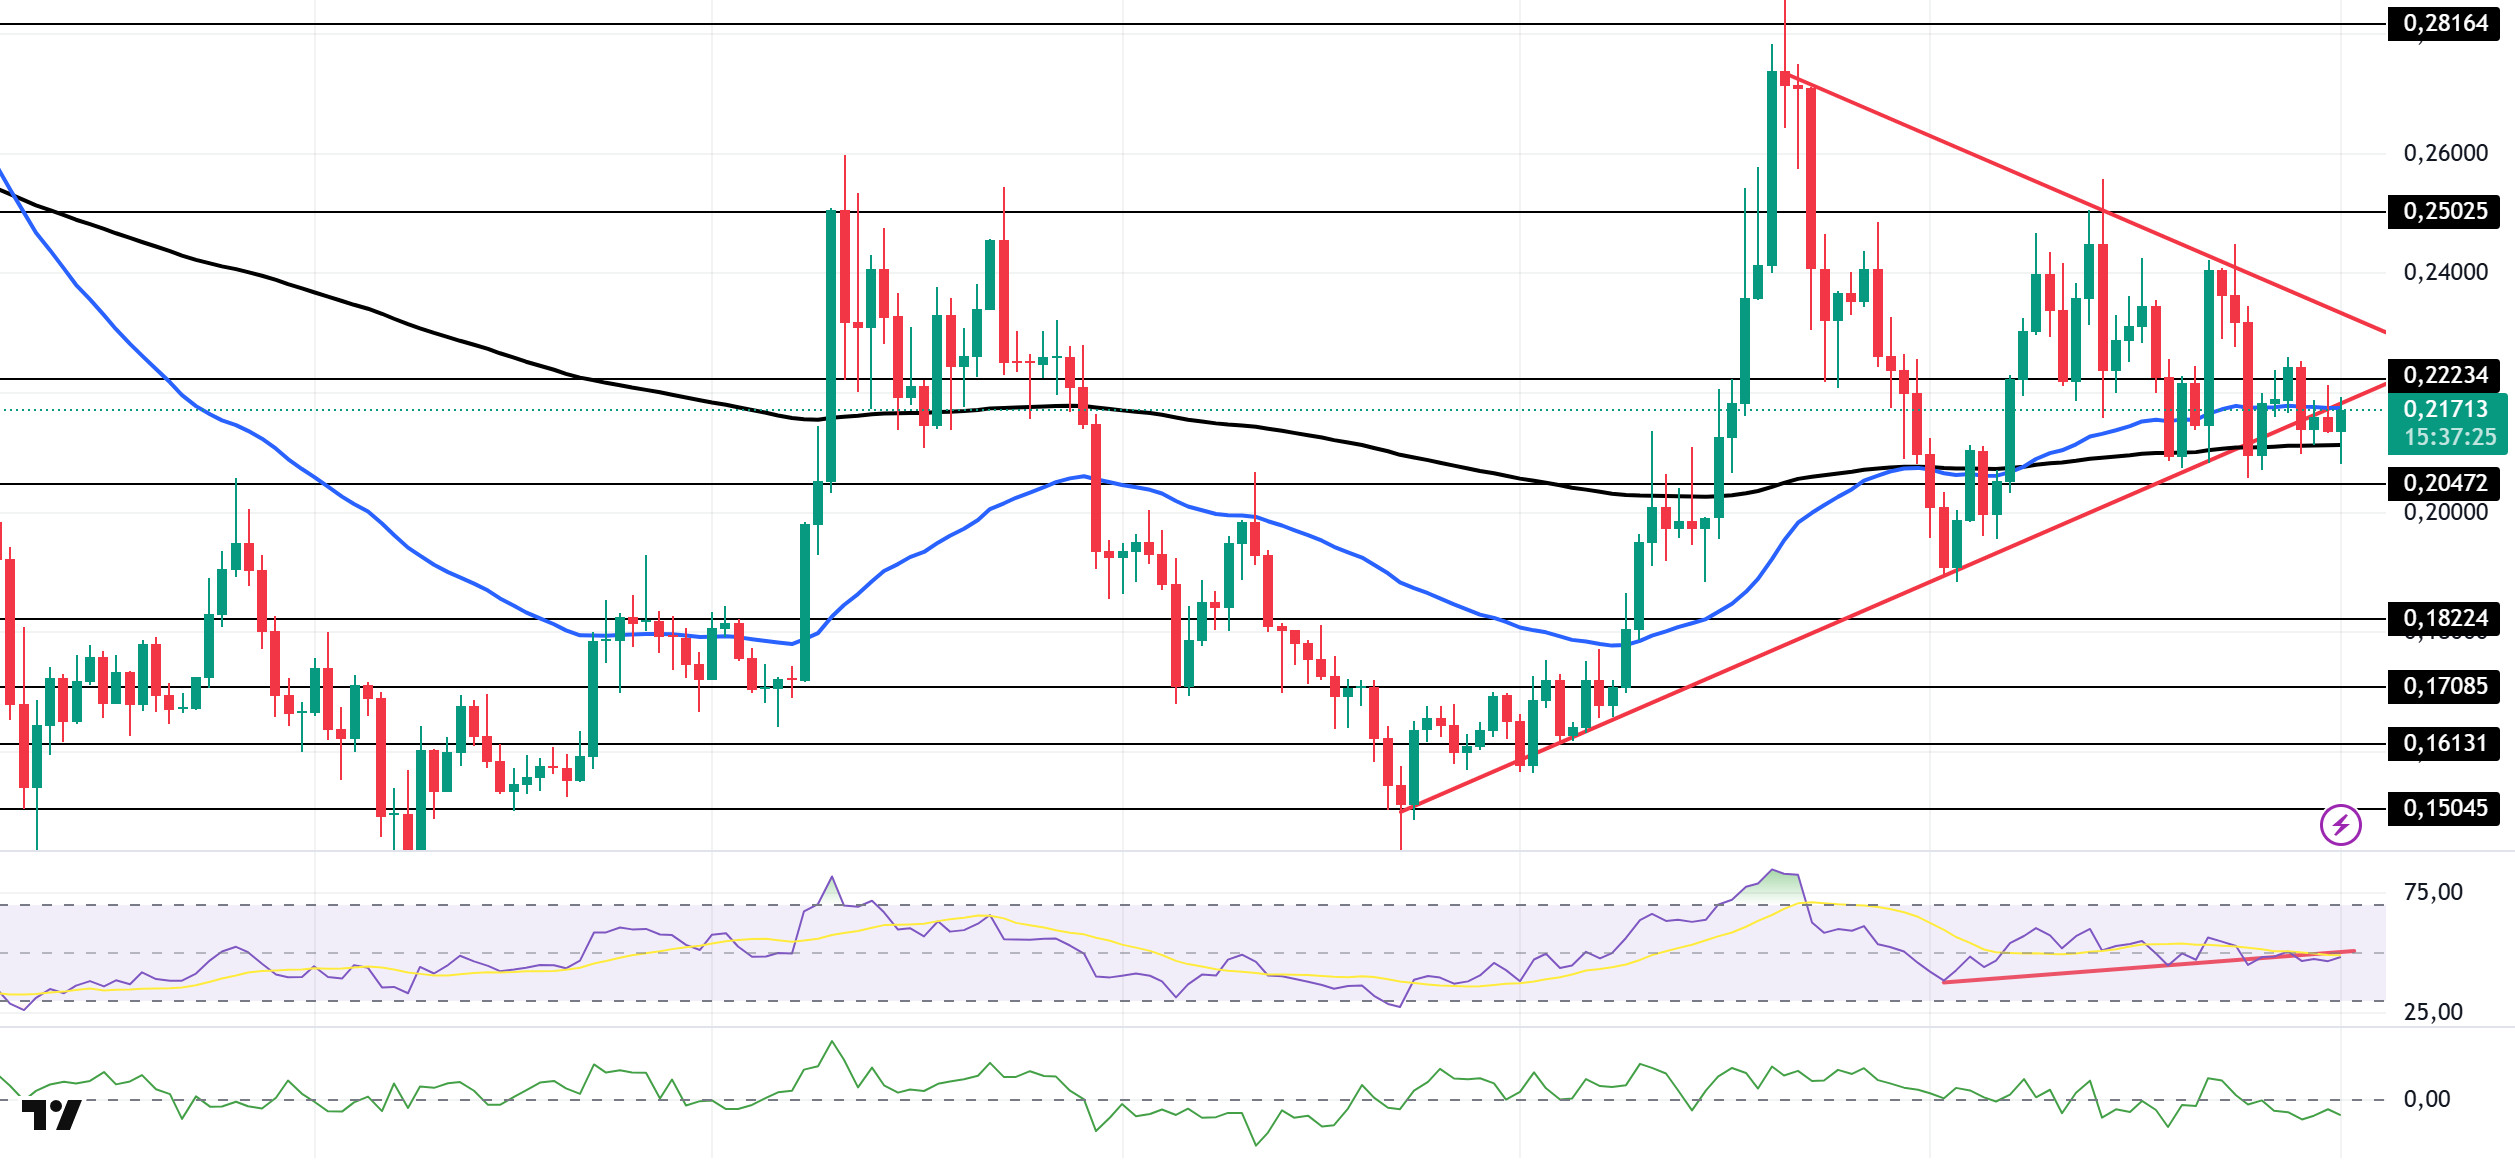
On the daily chart, DOGE has been trading sideways since last week. The price broke below the base level of the symmetrical triangle formation that began on July 21, found support at the 200 EMA (Exponential Moving Average – Black Line), and is currently testing the base level of the formation as resistance. If the upward trend continues, it could test the $0.25025 level. If it fails to enter the triangle formation area, the pullback could deepen. In this case, the $0.18224 level could be monitored.
The asset is trading between the 50 EMA (Blue Line) and 200 EMA moving averages. This indicates that the asset is in a decision phase. On the other hand, the 50 EMA continues to remain above the 200 EMA, indicating that the “golden cross” formation is continuing. This signals that upward pressure may continue in the medium term. The Chaikin Money Flow (CMF–20) indicator has moved into negative territory. Money inflows continue to decline. This could push CMF-20 deeper into negative territory. Looking at the Relative Strength Index (RSI-14) indicator, it is in the negative zone. On the other hand, it has moved to the lower zone of the rising trend that has continued since August 2, indicating that selling pressure has formed. Currently testing this trend as resistance, the indicator may face buying pressure if it breaks through here. In the event of macroeconomic risks or negative news from the ecosystem, the $0.20472 level can be monitored as a strong support. On the other hand, if the upward movement gains strength, the $0.25025 level comes to the fore as the first strong resistance level.
Supports: 0.20472 – 0.18224 – 0.17085
Resistances: 0.22234 – 0.25025 – 0.28164
TRX/USDT
Last week, the Tron community’s proposal to reduce Tron network fees by 60% was accepted and implemented. This rate is the highest fee reduction since the Tron network was founded.
In addition, Tron was officially selected by the U.S. Department of Commerce as one of nine blockchains that will record the release of the U.S. Gross Domestic Product (GDP) data for the second quarter of 2025.
Last week, the TRON network generated a total of $84.6 million in revenue, continuing to be the highest-earning ecosystem among all blockchain networks. Stablecoin transfers and user interactions on the DeFi side of the TRON network played a significant role in this revenue.
During the week of August 25–31, 2025, a total of 34.9 million TRX were burned on the TRON network. This reduced the circulating supply by 13.4 million. The decrease in circulating supply continues to exert deflationary pressure on TRX. Additionally, the total number of addresses increased by 1.4 million to 329.2 million during the same week.
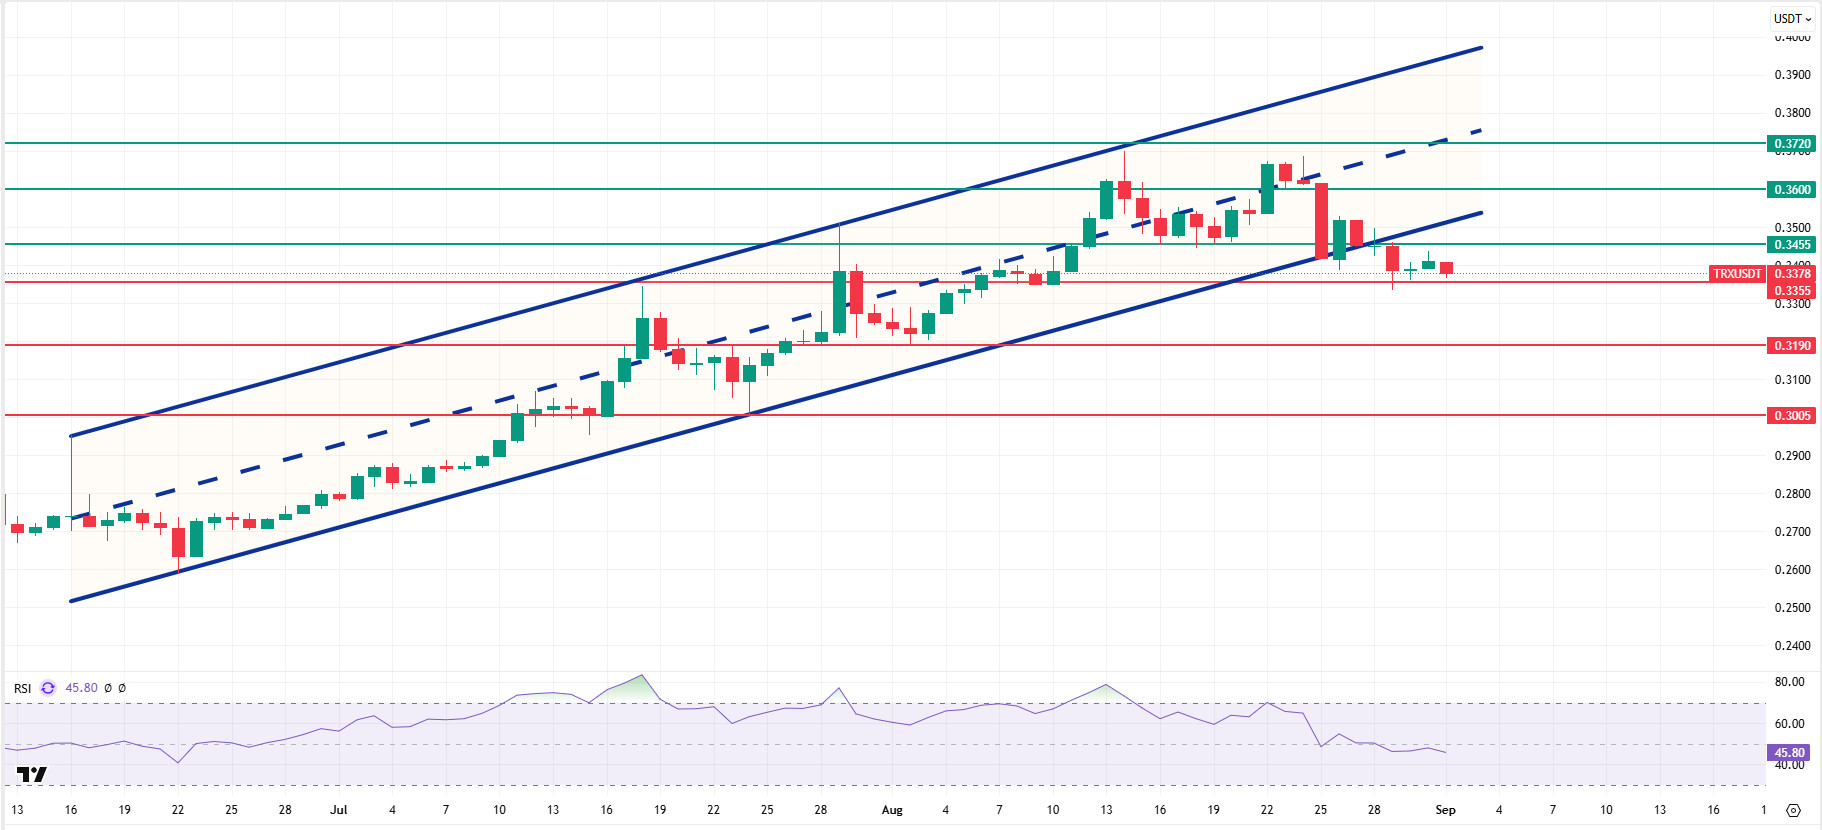
TRX, which started last week at 0.3616, fell approximately 6% during the week and closed at 0.3410. This ended a nine-week upward trend, with a market value of $32.26 billion. TRX, currently trading at 0.3378, has broken below the bullish channel on the daily chart and is now trading below the channel. The Relative Strength Index (RSI) value is observed to be in the sell zone at 45. Considering the current level of the Tron price and the RSI indicator, the TRX price is expected to rebound from the 0.3355 support level and start rising. This indicates that it may want to move towards the middle band by entering the bullish channel. In such a case, it may test the 0.3455 resistance level. If it closes above the 0.3455 resistance level on a daily basis, it may test the 0.3600 resistance level. If it fails to close above the 0.3455 resistance level on a daily basis and the bearish sentiment in the market continues, it may decline due to potential selling pressure from this area. In such a scenario, it may test the 0.3190 resistance level.
On the daily chart, 0.3005 is an important support level, and as long as it remains above this level, the upward momentum is expected to continue. If this support level is broken, selling pressure may increase.
Supports: 0.3355 – 0.3190 – 0.3005
Resistances: 0.3455 – 0.3600 – 0.3720
AVAX/USDT
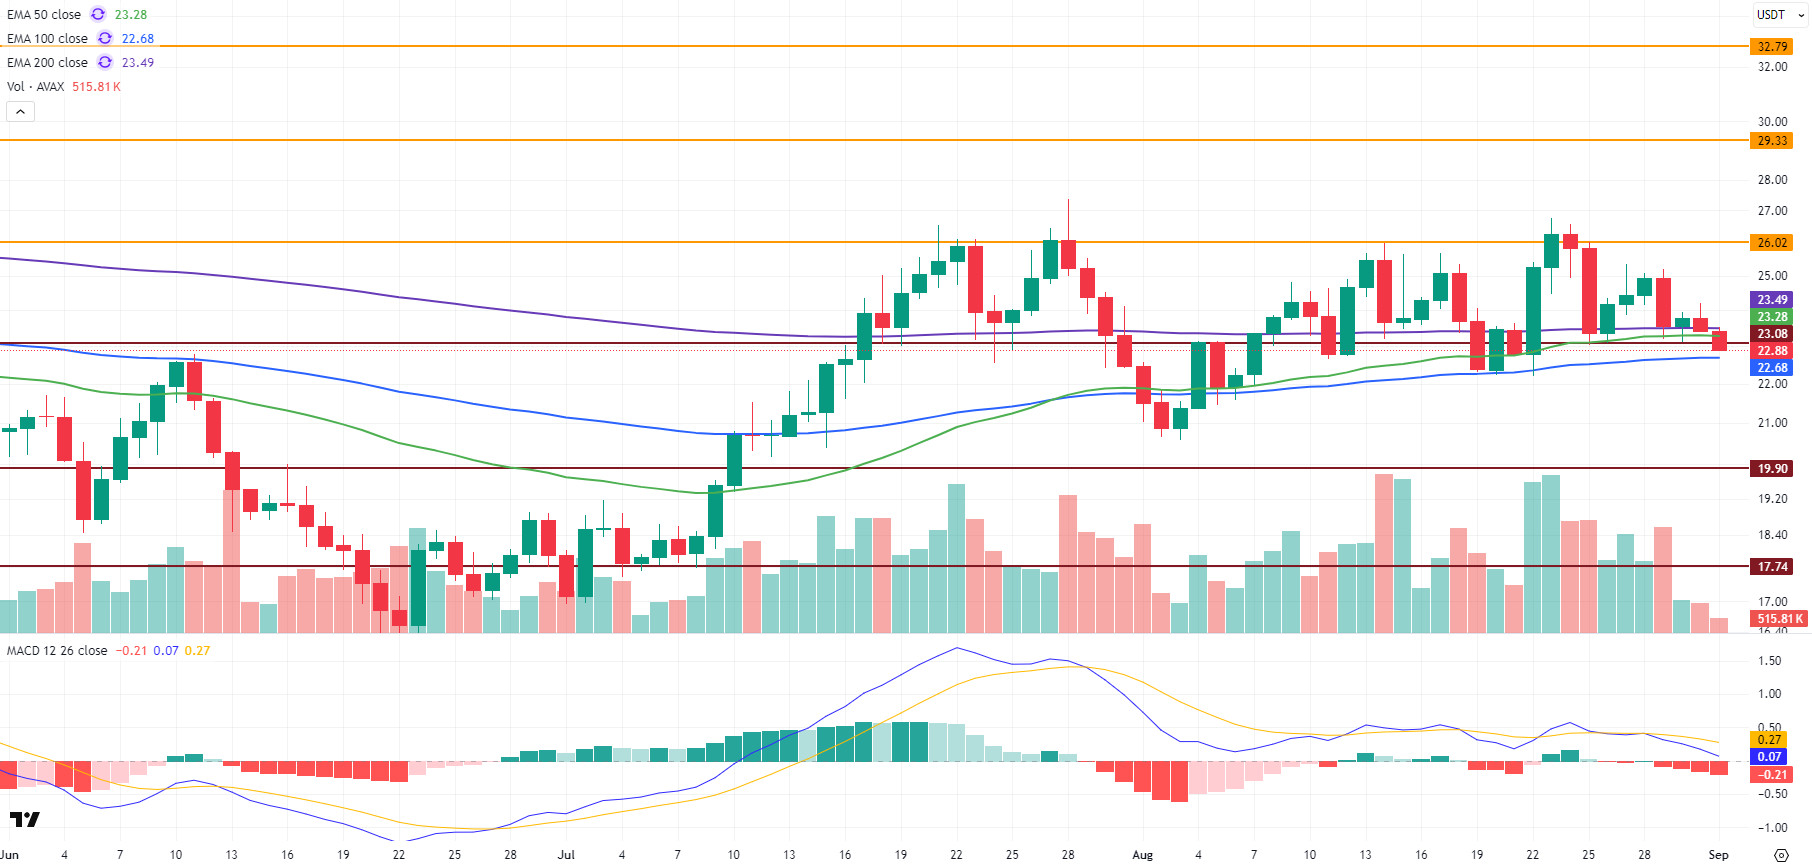
AVAX, which started last week at $25.82, closed the week at $23.40, losing approximately 9.40% of its value. Despite positive news flow in the ecosystem, such as Grayscale’s AVAX ETF application, Retro9000 second cohort developments, steps to enter the Japanese market, and a 66% increase in trading volume (11.9 million transactions), AVAX prices fell sharply due to the negative momentum prevailing in the cryptocurrency market in general. After testing the $26.02 resistance level on the first day of last week and failing to break through, AVAX fell under selling pressure and closed below the 200-period Exponential Moving Average (EMA200) level at the end of the week, marking a critical technical break. AVAX started the new week with a decline and is testing the $23.08 support level. A daily close below this level and the EMA100 level could deepen the decline.
On the daily chart, the MACD line crossed below the signal line, increasing selling pressure. Furthermore, if the MACD moves into negative territory, the current decline could deepen.
If AVAX remains below the $23.08 support level in the coming period, the EMA100 level will come into focus as the decline continues. If daily closes occur below these levels, selling pressure may increase, and with the deepening of the decline, the $19.90 and then $17.74 support levels may come into play. Conversely, if positive developments cause AVAX to rise, it must first break above the EMA200 level and maintain stability above this level to recover. In this case, the first target will be the $26.02 resistance. If the $26.02 level is exceeded, the uptrend could gain momentum, and the $29.33 and $32.79 resistance levels could come into play . Despite strong news flow from the ecosystem, AVAX entered a sharp selling pressure in line with the overall market. In the short term, the negative outlook is prominent, and the $23.08 support level will be decisive this week. If this level cannot be maintained, a deeper correction process may begin. However, if strong buying and positive news flow reverse the momentum, the $26.02 resistance level could come back into focus.
(EMA50: Green Line, EMA100: Blue Line, EMA200: Purple Line)
Supports 23.08 – 19.90 – 17.74
Resistances 26.02 – 29.33 – 32.79
SHIB/USDT
The Shiba Inu ecosystem stood out this week with a tangible leap in mainstream financial access and clear headlines in its infrastructure vision. Valour, a subsidiary of DeFi Technologies, listed eight new crypto ETPs in SEK on the Spotlight Securities Exchange in Sweden, including a Shiba Inu-based product. This step, which provides access to SHIB through a brokerage account in a regulated market with a 1.9% management fee, strengthened the ecosystem’s financial product side by opening a direct channel to the institutional and individual investor base in Europe. The move being highlighted in community publications as “SHIB’s transition to the mainstream” reinforced the week’s institutional tone.
On the infrastructure and product front, Shib Alpha Layer, a modular “Layer-3” structure on Shibarium, and its native element TREAT took center stage this week. Updates on August 29 reiterated TREAT’s position as a gas and incentive token for microtransactions and dApp rewards. The roadmap highlighted use cases in Web3 games through applications like Position DEX and TokenPlayAI developed by Astra Nova, supporting the ecosystem’s goal of expanding the application layer in DeFi and gaming. Official and industry-sourced content this week confirmed this framework, showing a shift in focus towards real use cases that will accelerate developer and user adoption.
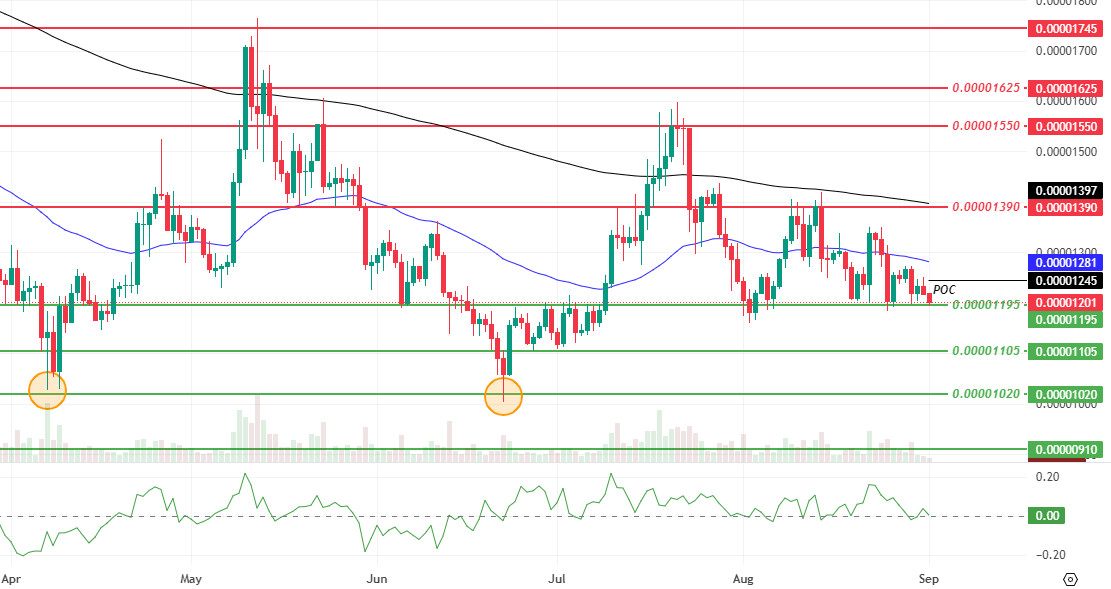
On the technical side, Shiba Inu failed to hold above last week’s Point of Control (POC) level of $0.00001260 this week, closing below it and limiting its pullback to the support level of $0.00001195. The $0.00001260 level now acts as an intermediate resistance zone. This week’s POC level formed at $0.00001245, with the price trading below the 50 and 200-period Exponential Moving Average (EMA). The combination of weakening momentum, declining trading volume, and volatility suggests that any rebound attempts should be viewed cautiously for now.
The Chaikin Money Flow (CMF) is in neutral territory, indicating a need for new flow signals to confirm direction. If the price remains above the $0.00001245–$0.00001260 level band and closes above the $0.00001300–$0.00001320 level zone on a daily basis, attempts to rise towards the $0.00001390 resistance level may be seen. and above this level, the $0.00001550 and $0.00001625 levels could come into play. Weakness with daily closes below the $0.00001195 support level could deepen towards the $0.00001105 and $0.00001020 target zones. The overall outlook points to continued fluctuations in the short term within the $0.00001195 to $0.00001260 range and the risk of limited rebound rallies at resistance zones as long as the price remains below EMA50. (EMA50: Blue Line, EMA200: Black Line)
Supports: 0.00001195 – 0.00001105 – 0.00001020
Resistances: 0.00001390 – 0.00001550 – 0.00001625
LTC/USDT
LTC ended last week with a 7.87% decline and started the new week at 108.87. During the same period, LTC lost 3.45% against Bitcoin, and its market value fell to approximately $8.4 billion, dropping one place in the market capitalization ranking to 21st. On the futures side, open positions decreased by 15.5%; the positive trend in funding rates continues.
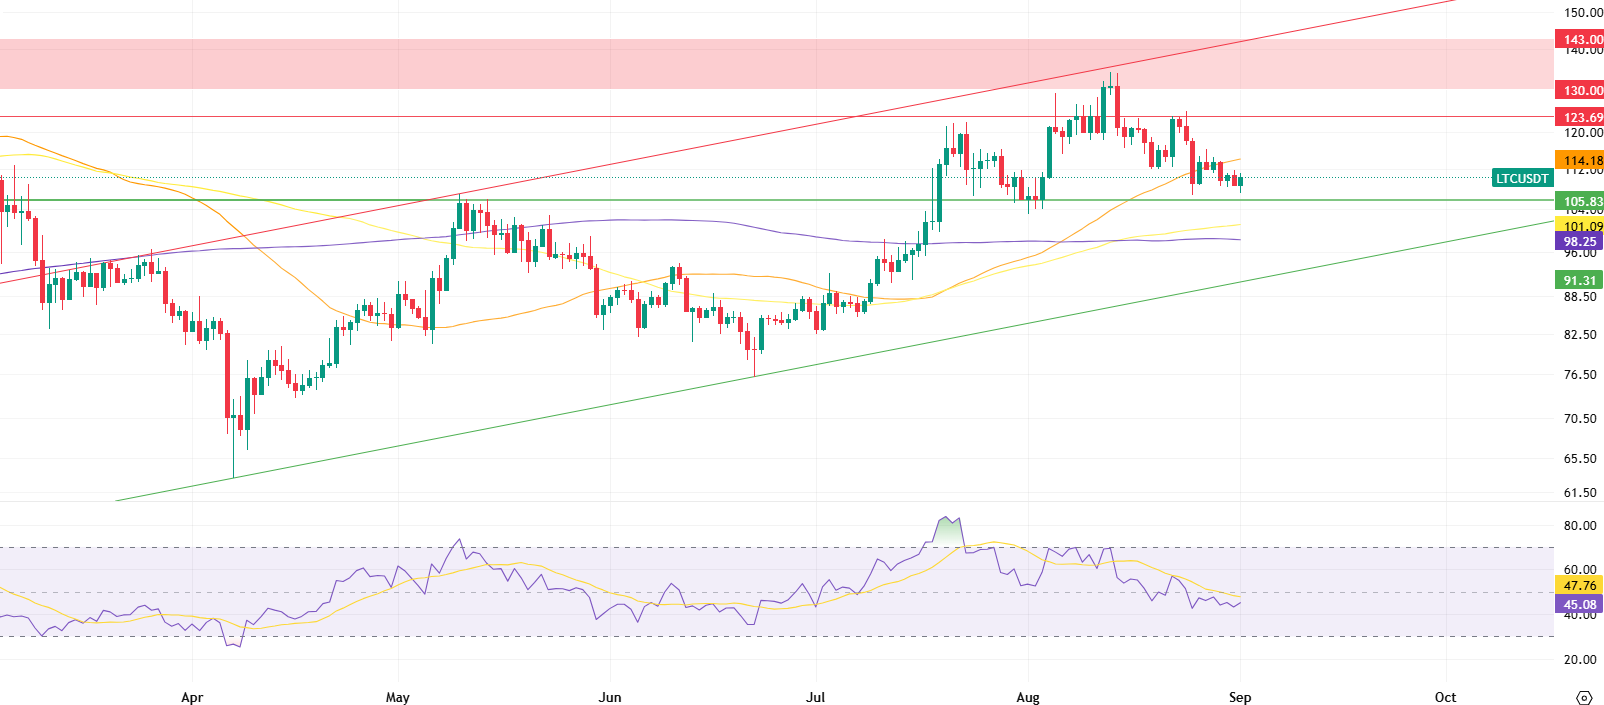
On the technical side, Litecoin continues to trade above the 100-period (yellow) and 200-period (purple) moving averages, while continuing to trade below the 50-period (orange) moving average. The 114.18 level, where this average crosses, carries the potential to create selling pressure in the short term as the first potential resistance point. If the upward movement continues, the 123.69 level, which was tested last week but not breached ( ), stands out as a critical resistance. If the price manages to stay above this level, it is likely to head towards the 130.00 – 143.00 range. However, the 130.00 level in particular should be monitored as a critical threshold where selling pressure, which may increase throughout the week, could initially become apparent on the price.
On the indicators side, the Relative Strength Index (RSI) continues to be positioned in neutral territory. This outlook indicates that current price movements are far from excessive upward or downward momentum and that the possibility of a pullback remains on the table. If the pullback deepens, the first level to watch will be the 105.83 horizontal support. Below this level, the support zone formed by the proximity of the 100-day and 200-day moving averages comes to the fore; here, the 98.26 level, where the 200-day moving average passes, is considered a stronger reference point. If selling pressure accelerates and intensifies downward, the rising channel lower band at the 91.31 level acts as the last line of defense for the price and stands out as the technical zone where the most attractive buying opportunity could emerge in the short term.
Supports: 105.83 – 98.26 – 91.31
Resistances: 114.18 – 123.69 – 130.00
BNB/USDT
Looking at the key developments this week, B Strategy, a BNB-focused treasury firm, announced that it aims to raise $1 billion in funding with support from CZ’s YZi Labs. Additionally, the DOLO, SHELL, and MITO projects in the BNB ecosystem have been listed on Binance Launchpool. These listings are expected to increase demand for BNB used in transaction fees and reduce the circulating supply through users staking BNB. This situation is expected to have a generally positive impact on the BNB price.
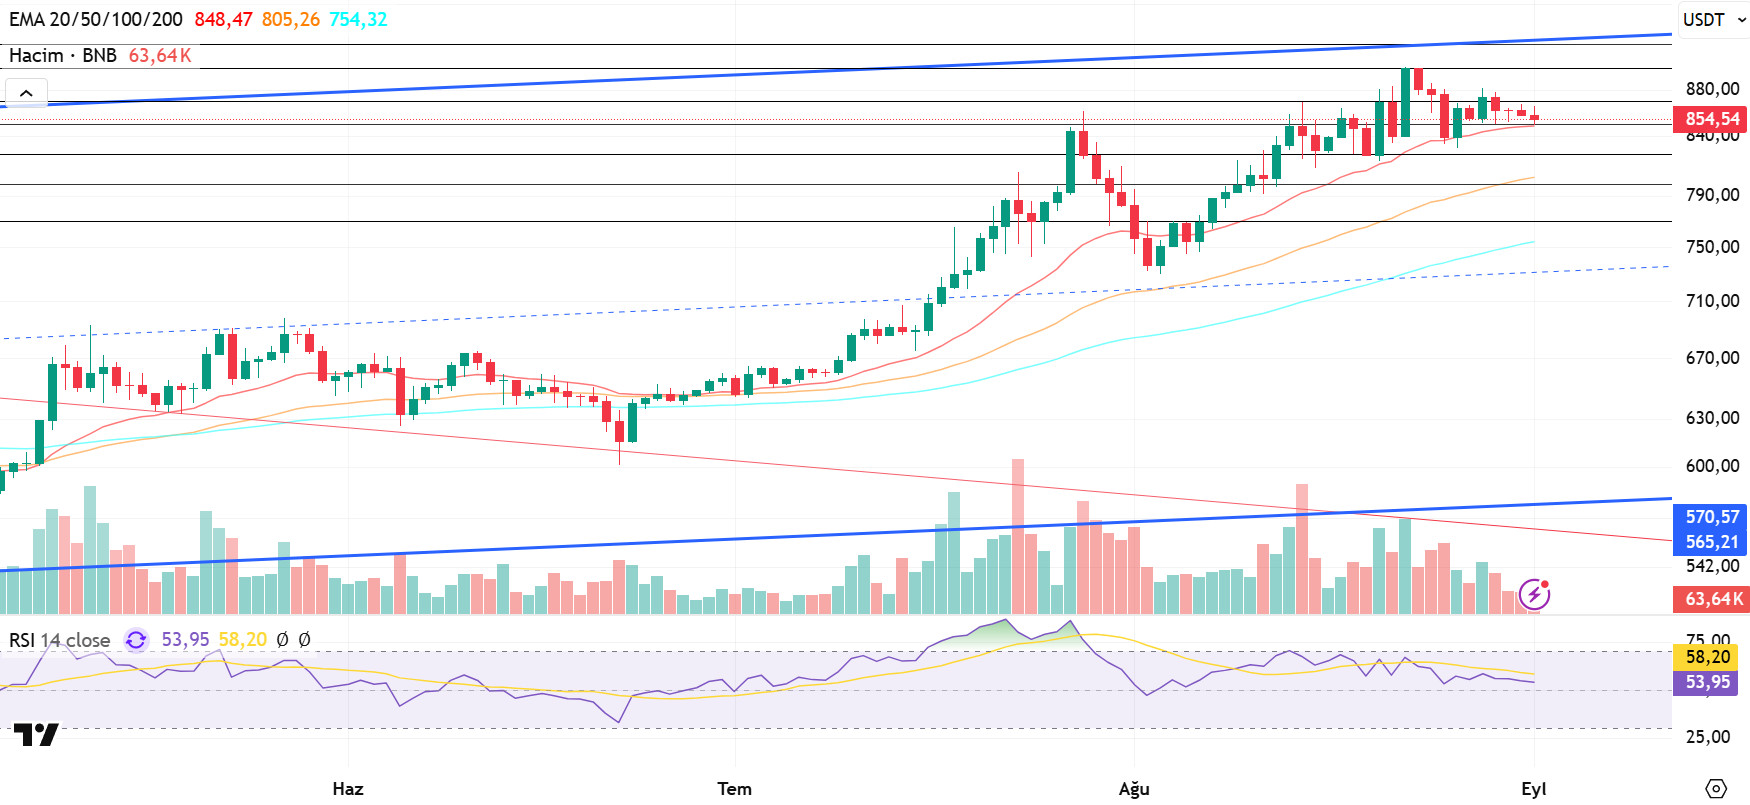
From a technical perspective, the BNB/USDT pair retreated slightly last week, falling below the $850 level, partly due to the negative market trend. However, with support buying seen at these levels, the price rose to $880 by midweek; but profit-taking that began at this point put renewed pressure on the price. Entering the new week, BNB started negatively and followed a downward trend due to this pressure.
Technical indicators for BNB/USDT, currently trading in the $850–870 range, show a weak and negative trend in trading volume in recent periods. This picture indicates increased selling pressure in the market overall. On the other hand, the Relative Strength Index (RSI) has declined towards the 50 level and turned downward. This technical structure indicates that negative trends may continue in the short term.
Within the current technical outlook, if the negative momentum persists, the BNB price is expected to test the $850 support level first. If this level is broken downwards, the $825 and $800 levels emerge as critical support zones to watch. On the other hand, if the $850 support level is maintained and buying appetite increases, the price is likely to head back towards the $870 resistance level. If this resistance is broken, the $900 and $920 levels will become important strong resistance points to watch.
Supports: 850 – 825 – 800
Resistances: 870 – 900 – 920
SUI/USDT
The Sui network started the new week quite strongly, with updates that enhance its technological infrastructure and increased interest from institutional investors. The increase in trading volumes observed in recent weeks and the vibrancy of the developer community show that Sui is not just a temporary focus of interest; on the contrary, it has entered a long-term, sustainable growth process. The strategic partnership with OKX Wallet, in particular, played a significant role in expanding the ecosystem. Thanks to this partnership, 2.3 million new addresses were created on the Sui blockchain, and a total trading volume of $1.3 billion was achieved. This figure highlights the high adoption rate of the network. In addition, there has been a significant development in terms of the gaming ecosystem. Jackson.io became the first licensed gaming protocol on Sui. This step not only diversifies the network’s use cases but also signals that Sui could be a strong player in the block -based gaming industry. According to experts, Sui’s steps in both the DeFi and GameFi sectors could position it as a more competitive player in the medium to long term. In particular, the increase in corporate partnerships and the active role of the developer community are making the network’s growth momentum sustainable.
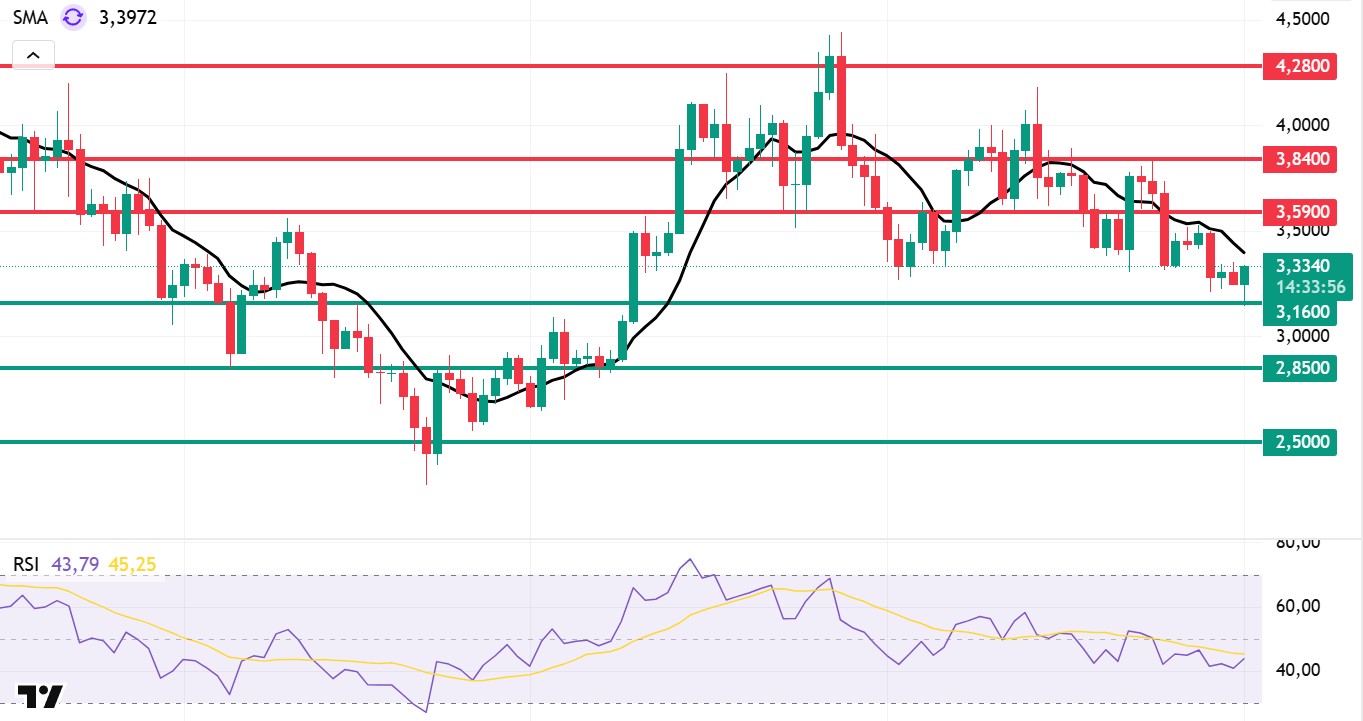
Following recent developments, when we look at Sui’s technical outlook, the price has declined on a weekly basis to around $3.33, influenced by fundamental developments. The Relative Strength Index (RSI) is currently in the 43.79 – 45.25 range. This range indicates that the market is trading close to the sell zone; however, if the RSI weakens and falls to the 35.00 – 40.00 range, it could signal a potential buying point. If the price moves upward, the $3.59, $3.84, and $4.28 levels can be monitored as resistance points. However, if the price falls to new lows, it could indicate that selling pressure is intensifying. In this case, the $3.16 and $2.85 levels stand out as strong support zones. Based on the trend line, a pullback to $2.50 appears technically possible. According to Simple Moving Averages (SMA) data, Sui’s average price is currently at $3.39. The price remaining above this level indicates that the current upward trend could technically continue. The upward trend of the SMA also supports this situation.
Support levels: 2.50 – 2.85 – 3.16
Resistances: 3.59 – 3.84 – 4.28
ADA/USDT
Cardano closed August with a trading volume of $913 million, down 3.48% from last week. The ADA stake amount rose to $21,820,000. Transaction addresses fell from 37,000 to 27,000. Buyers continue to wait in liquidation zones at the strong resistance level of 0.9850, absorbing sellers with limit orders. The average size of orders entered in the spot market has fallen to 274,758, indicating that institutional investors may be taking profits. According to news about Cardano this week, digital asset management company Grayscale Investments had applied for a spot exchange-traded fund for ADA in the US state of Delaware. The SEC announced that it had postponed this application.
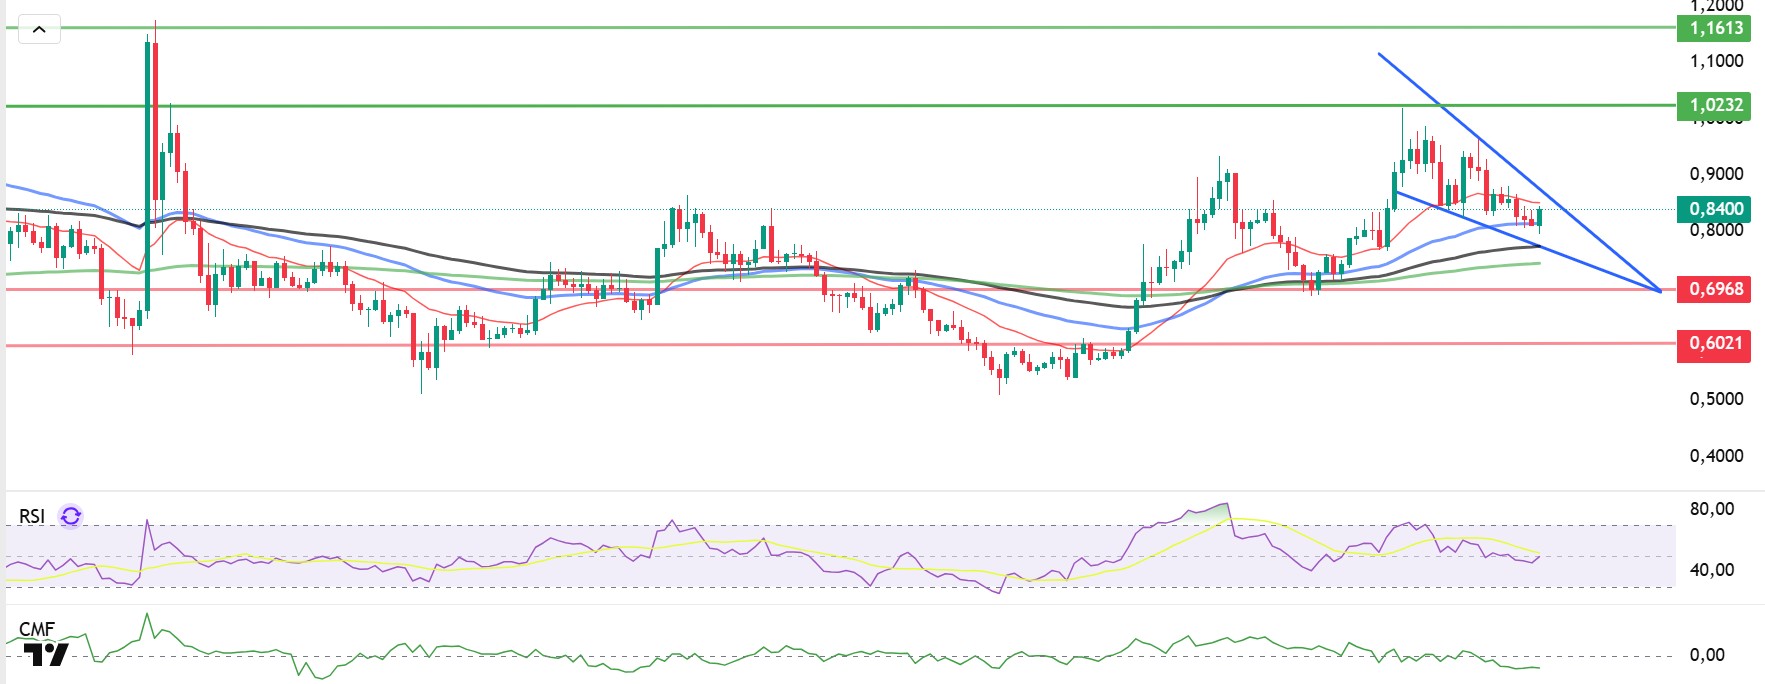
Technically speaking, it reached 0.9546 levels during the day at the close of last week. It continues to move within the falling channel band due to selling pressure during the day. If it breaks above the upper band on the daily chart, it is expected to remain above 1.0232 levels. The price may continue its downward trend as long as the EMA 20 (Red Line) rising channel band remains in place. While the Relative Strength Index (RSI) continues around the 51 level, the Chaikin Money Flow (CMF-20) has settled at -0.09 levels, and the observed signals point to negative momentum. The descending channel region indicated on the chart points to the price’s intense trading zones, where momentum is progressing within narrow ranges. This week, ADA’s price is consolidating around the $0.8356 band, with the $0.6968 – $0.7444 level emerging as a support zone in a possible downside scenario, while the $1.0238 – $1.1613 band stands out as a resistance zone.
Supports: $0.6021 – $0.6968 – $0.7444
Resistances: $0.9850 – $1.0232 – $1.1613
Legal Notice
The investment information, comments, and recommendations contained in this document do not constitute investment advisory services. Investment advisory services are provided by authorized institutions on a personal basis, taking into account the risk and return preferences of individuals. The comments and recommendations contained in this document are of a general nature. These recommendations may not be suitable for your financial situation and risk and return preferences. Therefore, making an investment decision based solely on the information contained in this document may not result in outcomes that align with your expectations.