
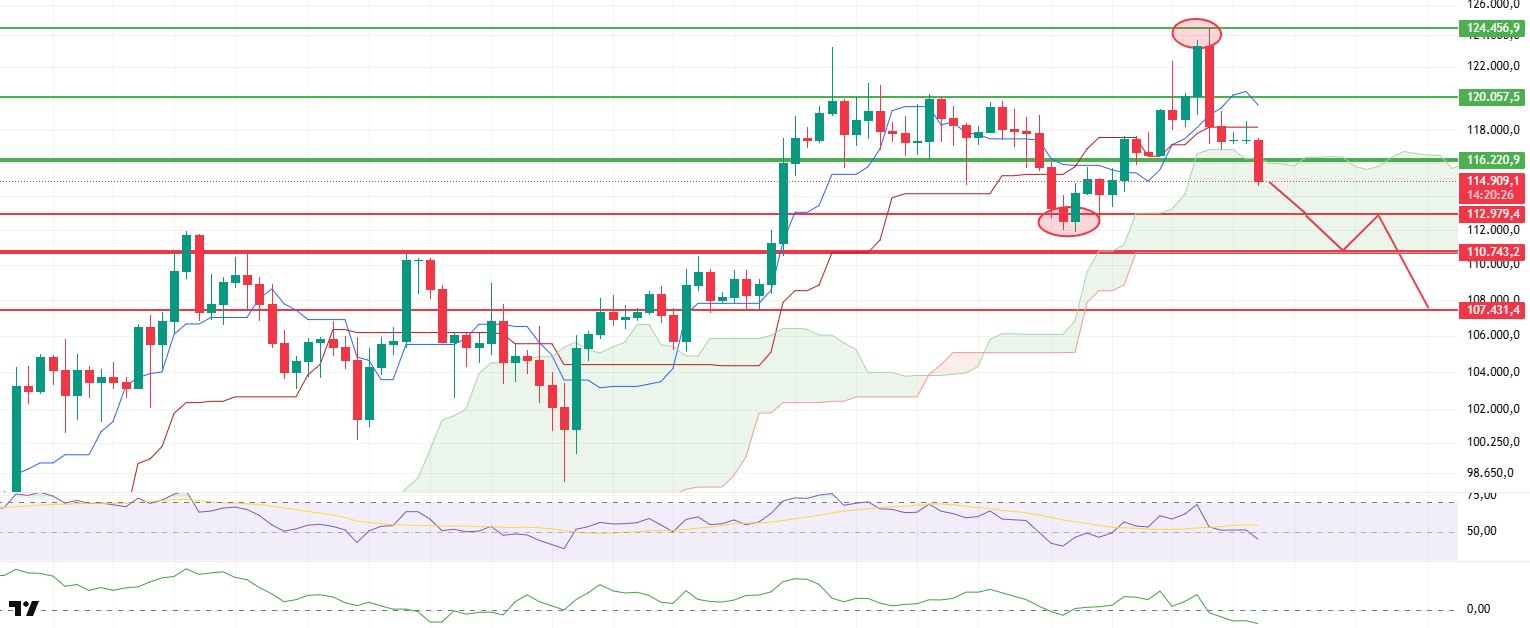
BTC/USDT
Last week, the Core Producer Price Index (PPI) significantly exceeded expectations on both a monthly and annual basis, weakening the likelihood of a rate cut by the Federal Reserve System (FED) in September. This dampened risk appetite and triggered negative price movements in BTC. BTC, which reached a new All-Time High (ATH) of $124,450 on Thursday, plummeted sharply due to macro-driven risk aversion and accelerating profit-taking, dropping below the $115,000 level. Meanwhile, on Friday, the seven-day streak of inflows into U.S. spot ETFs was broken, with a net outflow of $14.13 million observed.
Futures and on-chain metrics also confirm the weakness. A decline of approximately $3.7 billion in open interest (OI) indicates that long positions are being closed at high volumes and leverage is being reduced, while the funding rate falling from 0.0161 to 0.0044 suggests that the long position has decreased significantly and the short side has become more active. This outlook suggests that upward attempts are currently more likely to be short-lived reactions rather than indicative of a sustained trend momentum.
From the Ichimoku indicator perspective, after losing the tenkan and kijun levels, the price breaking below the upper band of the kumo cloud around 116,220 dollars and retreating into the cloud indicates that the positive trend structure has broken down and the price has entered a decision/equilibrium range. The lower band of the Kumo cloud at the 110,743 dollar level emerges as the first major defense line in the short to medium term. Daily closes below this region would increase the risk of the trend momentum turning negative. In the opposite scenario, sustaining above 116,220 and subsequently re-establishing above the tenkan–kijun could pave the way for the weak structure within the cloud to recover and the upward trend to be re-established.
Cash flow indicators and momentum also call for caution. Chaikin Money Flow (CMF) has pulled back sharply and slipped into negative territory. The structure of the CMF confirms that liquidity outflows are accelerating on the spot side and that seller pressure is weighing on prices. The Relative Strength Index (RSI) has fallen below both its moving average and the 50 reference level, signaling structural weakness in momentum. Unless the RSI recovers and sustains a move above the 50 threshold, the downward trend is expected to remain dominant despite any interim rallies.
In this context, the base scenario is that the price will close the week on a downward trend, accompanied by a weakening technical outlook and deteriorating momentum indicators, with the possibility of a test of the lower band of the cloud at $110,743 remaining alive. However, a recovery supported by daily closes above the 116.220 dollar threshold, along with stability in open interest (OI), the funding rate approaching equilibrium, the CMF moving closer to the zero line, and the RSI rising above 50, could confirm a break in the negative trend and allow the upward movement to resume from where it left off. Therefore, the range of 110,743–116,220, highlighted with thick lines on the chart, should be monitored as the primary decision zone, with a focus on sustained levels supported by volume and order flow rather than unconfirmed deviations.
Support levels: 112,979 – 110,743 – 107,431
Resistance levels: 116,220 – 120,057 – 124,456
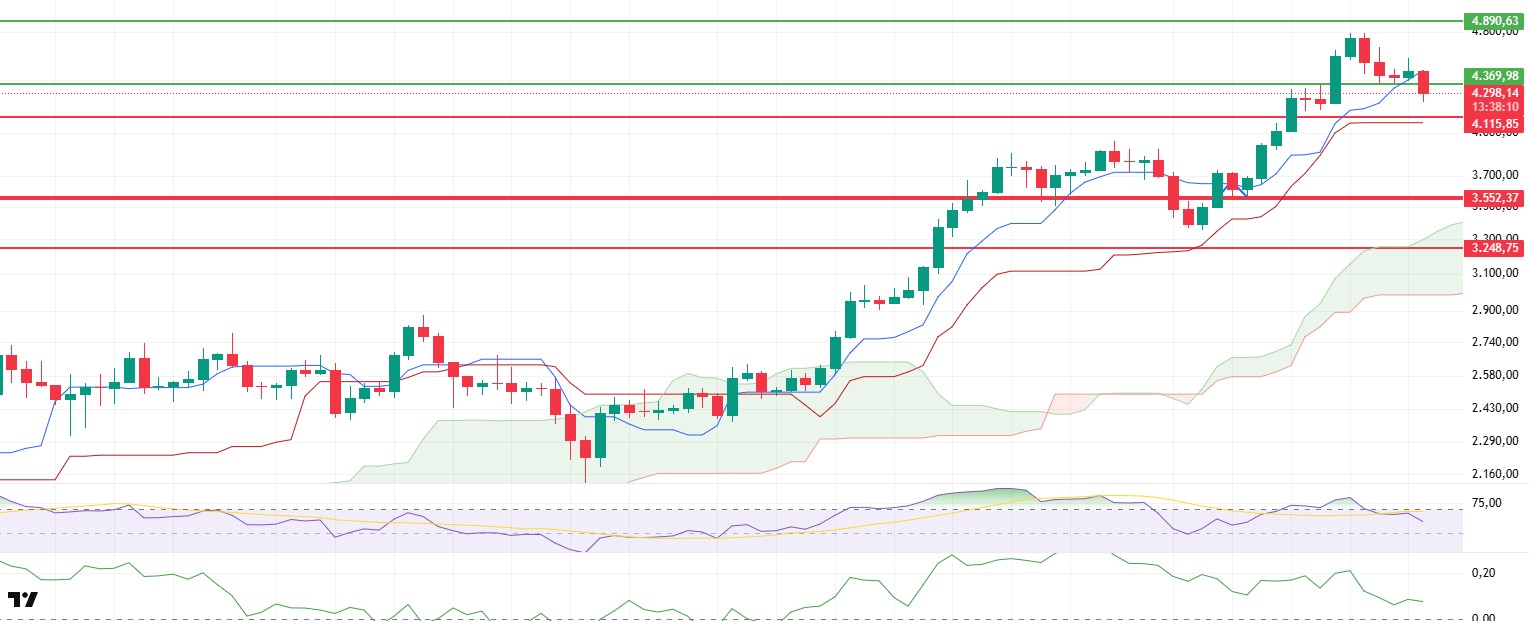
ETH/USDT
Ethereum climbed to $4,780 last week with momentum approaching its all-time high (ATH) of $4,890. However, the U.S. Core Producer Price Index (PPI) exceeded expectations on both a monthly and annual basis, weakening the likelihood of a September interest rate cut by the Federal Reserve System (FED). This dampened risk appetite and triggered negative price movements in ETH. Under this pressure, the price first retreated to the $4,369 support level, then fell below this level after the weekly close, deepening towards $4,200. The 8-day positive US ETF inflow series ended on Friday with a net outflow of $59 million. The decline in the amount of staked ETH from 36.175 million to 36.054 million suggests that institutional interest has cooled slightly and that the risk of stagnation in the U.S. is beginning to be priced in.
Futures and on-chain indicators rationalize this correction. A decline of approximately $5.25 billion in open interest indicates that the overheated leverage structure has been cleaned up in a healthy manner and that long positions are being gradually unwound. While this cleanup is positive for the long-term structure, it may signal that the correction trend could continue in the short term when combined with the decline in the funding rate. However, the Chaikin Money Flow (CMF) remaining in positive territory emphasizes that there is no aggressive liquidity outflow on the spot side and that buyer appetite has not completely dissipated. This suggests that declines could trigger gradual buyback attempts as the market searches for a bottom.
From the Ichimoku indicator perspective, the price losing the Tenkan level confirms that the short-term correction has become structural, while remaining above both the Kijun and Kumo clouds indicates that the medium-term trend has not yet broken down and the positive backbone remains intact. As long as the price remains above the cloud, any downward movements are likely to indicate a limited mean-reversion process rather than a trend break. However, the behavior of momentum during future tests near the cloud’s base will be decisive.
On the momentum front, the Relative Strength Index (RSI) turning back from the overbought zone to initiate a correction, coupled with the weakening trend of staying below the 50 threshold, suggests that the short-term momentum may continue to favor the sell side. If the RSI settles above 50 and the CMF approaches the zero line ( ), any rebound rallies could gain a more sustained character; otherwise, upward attempts are expected to remain limited for now.
In this context, the baseline scenario is for the pullback to continue to the $4,115 level, driven by weakening short-term indicators and the impact of OI/funding normalization. If this region fails to produce convincing support, selling could accelerate, triggering stop clusters and testing lower levels. On the other hand, regaining $4.369 with a daily close, followed by a settlement towards the $4.381–4.551 band and a reversal above the tenkan, would be the first structural signals confirming that the current correction has ended and that the upward trend could resume from where it left off. Therefore, price behavior between the 4,115 support threshold and the 4,369 key resistance level should be closely monitored in the short term, along with volume and order flow confirmation.
Support levels: 4,115 – 3,552 – 3,248
Resistance levels: 4,369 – 4,890 – 5,250
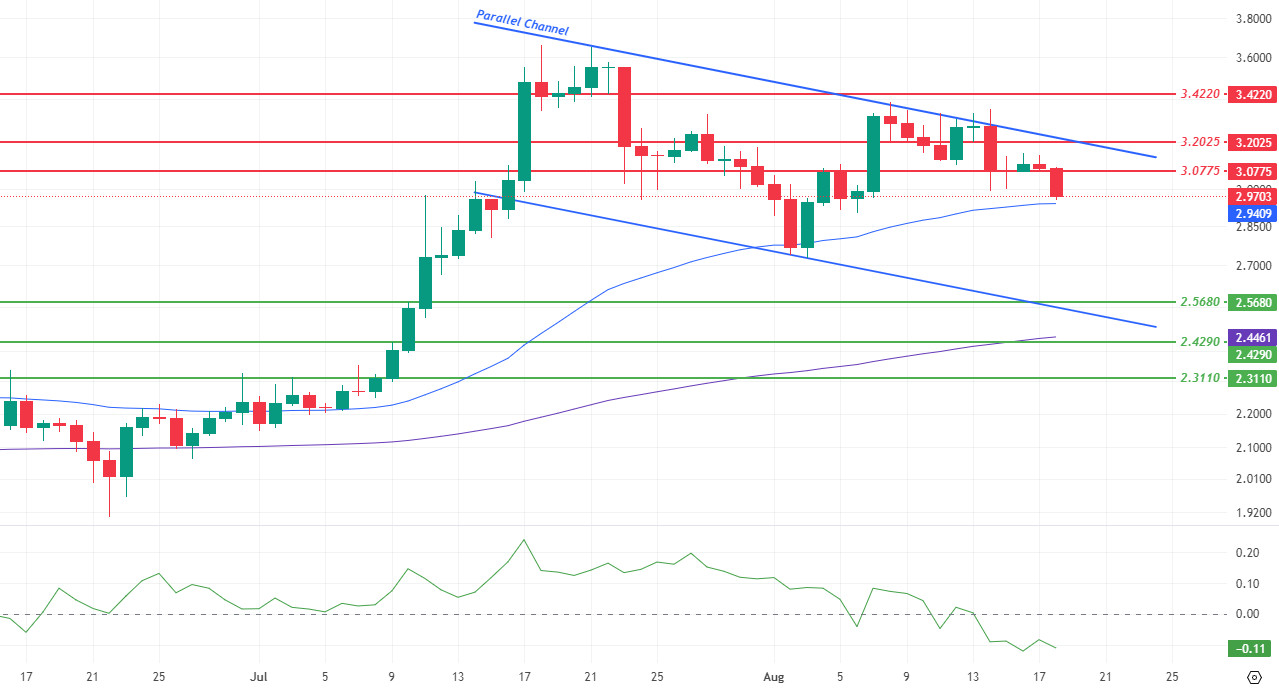
XRP/USDT
In the third week of August, the XRP ecosystem stood out with regulatory developments, increased institutional interest, and strategic focuses on the global financial infrastructure. The long-running SEC-Ripple lawsuit closed with both parties withdrawing their appeals, thereby removing legal uncertainty. This development not only strengthened the confidence of XRP investors but also provided a clearer framework for the future of crypto regulation in the US. The closure of the lawsuit positively shifted institutional funds’ view of XRP, and the removal of the regulatory shadow that had been weighing on prices for a long time made XRP a more predictable asset for investors. Following the legal clarity, the possibility of XRP being included in institutional investment products has once again been discussed. While ETF scenarios came to the fore during this period, US President Trump’s executive order allowing crypto assets to be included in 401(k) retirement accounts also stood out as a macro step supporting institutional interest. These developments provided strong signals that XRP could open up not only to its existing investor base but also to broader institutional funds. In the global financial infrastructure, developments strengthened Ripple’s role. In its assessment, SWIFT identified Ripple and Stellar as the main actors capable of transforming cross-border payments . This emphasis confirmed Ripple’s position as a bridge between traditional finance and blockchain-based solutions and made the potential use cases for XRP in international payment systems more visible. On-chain data also indicated strengthened institutional confidence. The accumulation of approximately 120 million XRP by major investors was one of the standout developments of the week. This accumulation demonstrated that long-term investors and institutional addresses continue to see value in XRP and that the confidence generated by the closure of the regulatory process is reflected in wallet movements.
XRP’s price movement on the daily chart continues to be stuck in a parallel channel. This structure indicates that the market has not yet made a clear directional choice, but the narrowing price range increases the likelihood of a strong breakout in the near future. The upper band of the channel is approaching the $3.2025 level, while the lower band is approaching the $2.5680 support level. The direction of the breakout from these bands will provide critical signals that will determine the medium-term direction of the trend.
The price is currently struggling to hold around the 50-day Exponential Moving Average (EMA50) (blue line). This level is a strategic threshold for determining the short-term direction. The 200-day Exponential Moving Average (EMA200) (purple line), located deeper, stands at the $2.4461 level and emerges as a major trend support. While the widening gap between the EMA50 and EMA200 in the medium term indicates that the trend is maintaining its healthy structure, the possibility of increased selling pressure should not be overlooked if the price remains below the EMA50. The Chaikin Money Flow (CMF) indicator, which measures liquidity flow, is at -0.11 and remains in negative territory. This outlook confirms that institutional and individual capital inflows are weak and that the buyer side is losing strength. The CMF’s failure to give a recovery signal strengthens the possibility of a pullback towards support levels.
Short-term resistance levels are at $3.0775, $3.2025, and $3.4220, which also coincides with the upper band of the channel. Breaking above these barriers could trigger a breakout of the short-term downtrend channel, creating strong momentum. On the downside, the first support level is at $2.5680, followed by $2.4290 and $2.3110, which are critical thresholds. The convergence of the channel’s lower band and these support areas could bring a potential bottoming scenario to the fore.
Support levels: 2.5680 – 2.4290 – 2.3110
Resistance levels: 3.0775 – 3.2025 – 3.4220
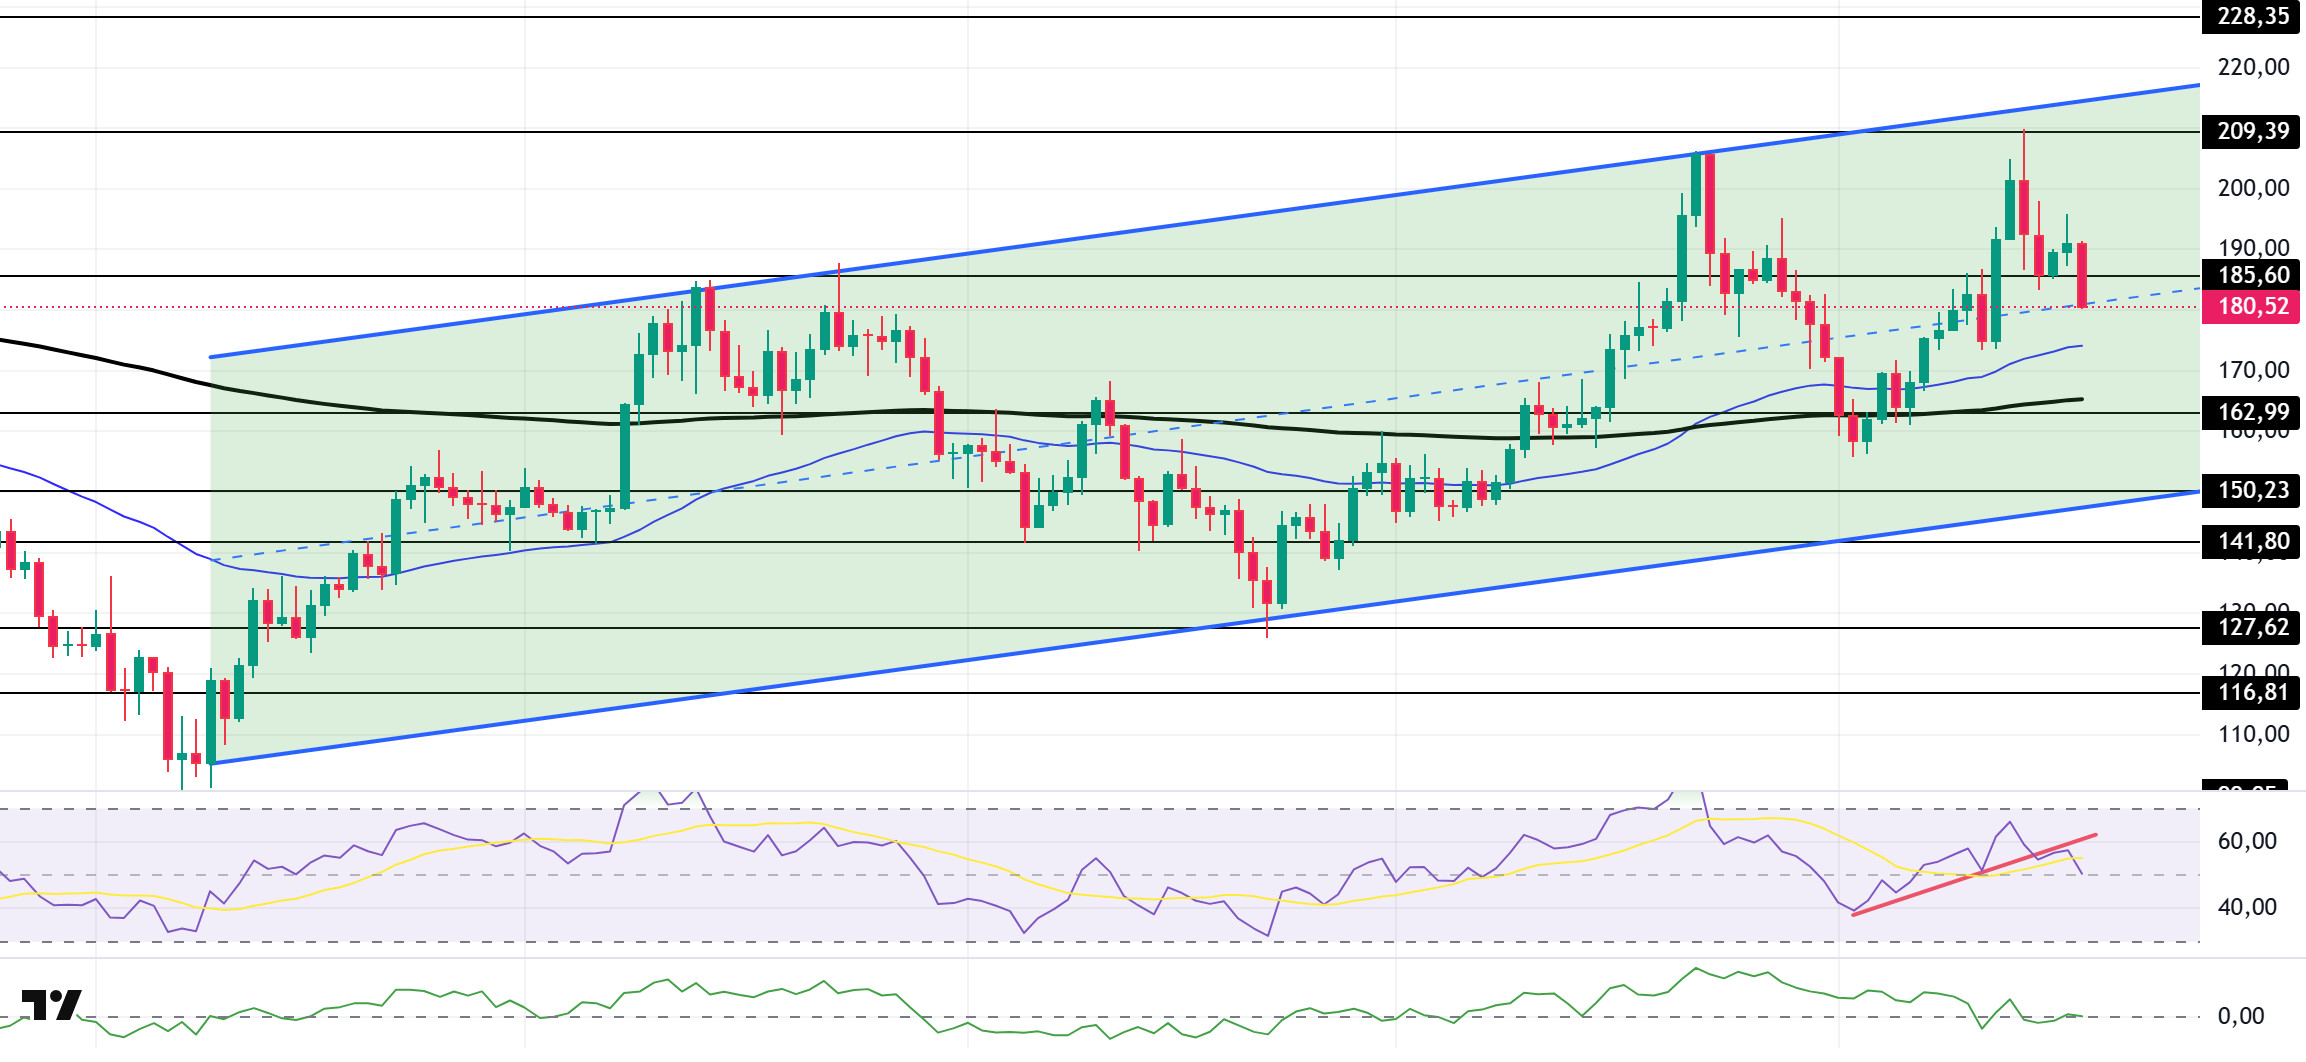
SOL/USDT
Last week in the Solana ecosystem
- The SPAC deal for the Solana treasury vehicle led by Joe McCann has been canceled. It was reported that the company planned to raise up to $1.5 billion.
- Exodus has partnered with Superstate to tokenize its Solana shares.
- Alameda has disclosed a $35.5 million stake in SOL.
- Arthur Hayes, co-founder of BitMEX, has joined Upexi as an advisor. The committee will guide Upexi’s development within the Solana ecosystem.
- Asset management firm DeFi Development Corp. (DFDV) has increased its crypto reserves to over 1.3 million SOL, currently valued at approximately $250 million.
- The SEC has approved Invesco Galaxy Spot Solana ETF’s application.
- The SEC has delayed four Solana ETF applications submitted by Bitwise, 21Shares, Canary Capital, and Marinade Finance.
The SOL price experienced volatility this week. The asset continues to trade at mid-range levels of the upward trend that began on April 9. The price tested the upward trend’s ceiling level and strong resistance point at $209.39 but failed to break through, retreating back to mid-range levels of the upward trend. As of now, the asset is continuing its downward trend and may test the 50 EMA (Blue Line) moving average. On the upside, the $209.39 level can be monitored.
The asset is trading above the 50 EMA (Blue Line) and 200 EMA (Black Line) moving averages, indicating that it is in an upward trend. Additionally, the 50 EMA remaining above the 200 EMA indicates the continuation of a “golden cross” formation from a technical perspective. This suggests that the potential for upward movement in the medium term remains intact. The RSI (14) has retreated to neutral levels. Additionally, the indicator broke below the upward trend that began on August 2, signaling the end of buying pressure. The Chaikin Money Flow (CMF-20) is at neutral levels; a decline in capital inflows could push the CMF-20 indicator into negative territory. If macroeconomic data continues to improve and positive developments in the ecosystem persist, the first major resistance level at $209.39 could be tested again. Conversely, in the event of potential negative news flow or deterioration in macroeconomic data, the $162.99 level could be monitored as a potential buying opportunity.
Supports: 162.99 – 150.23 – 141.80
Resistance levels: 185.60 – 209.39 – 228.35
DOGE/USDT
Grayscale and Bitwise have filed an application with the SEC for a spot Dogecoin ETF. Timothy Stebbing, director of the Dogecoin Foundation, outlined his vision for RadioDoge, a Dogecoin-based project aimed at improving financial inclusion for unbanked individuals.
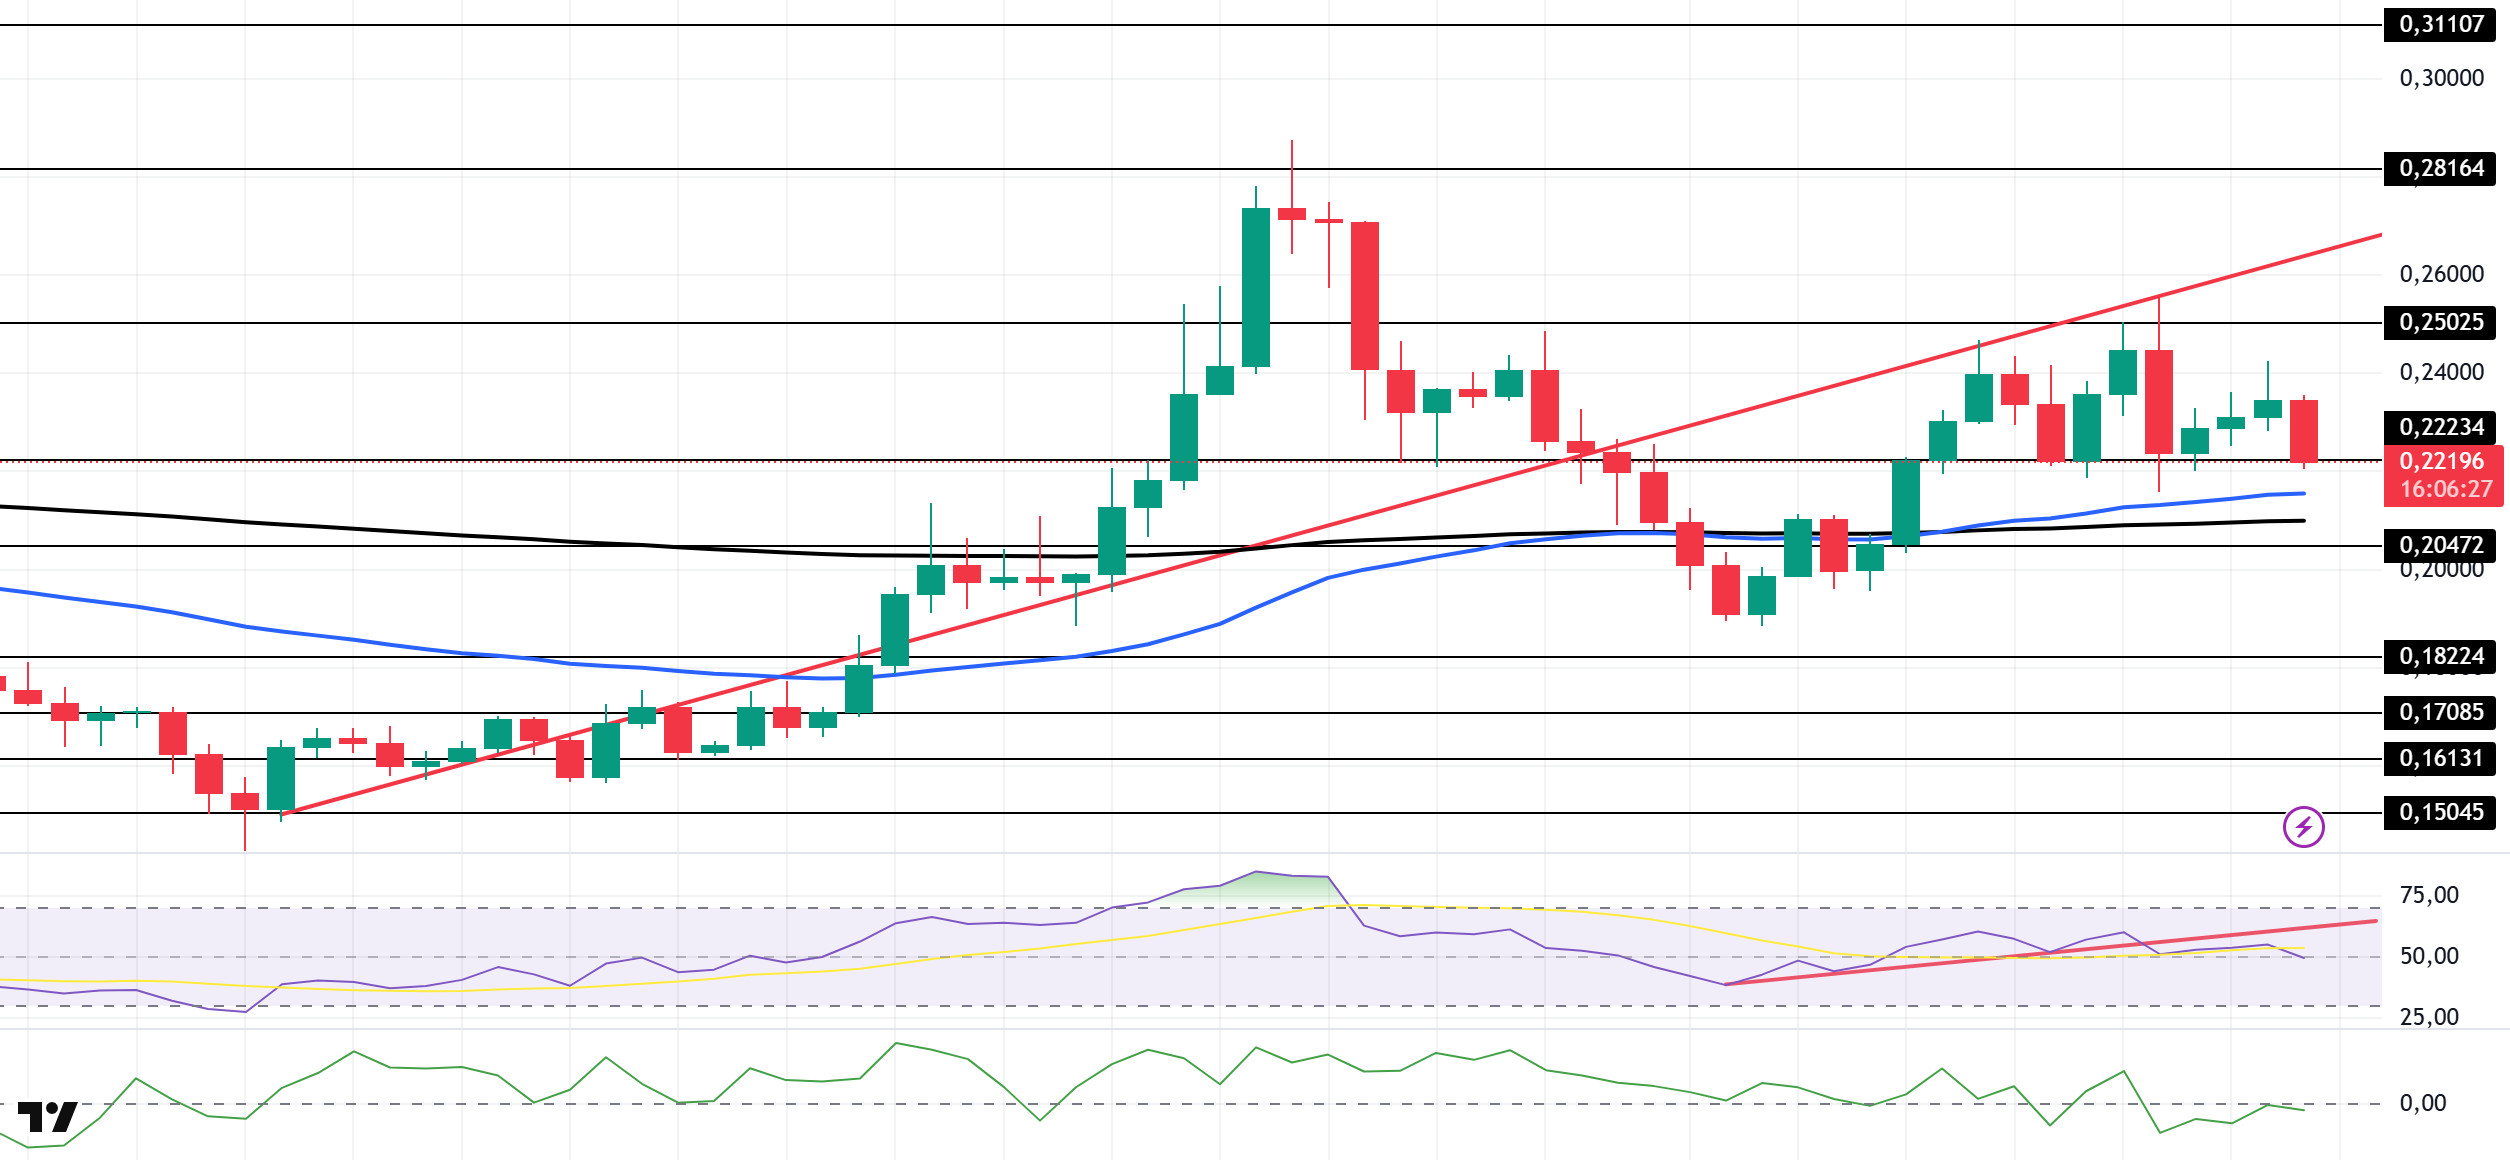
DOGE has been trading steadily on the daily chart since last week. The asset tested the resistance level of the upward trend that began on June 23 but failed to break through it. The price, which experienced a pullback, is currently testing the support level of $0.22234. If the price closes below $0.22234, the downtrend may continue. In the event of an upward movement, the 0.25025 dollar level can be monitored as resistance.
The asset continues to trade above the 50 EMA and 200 EMA moving averages. This indicates that the asset is in an upward trend. On the other hand, the 50 EMA remains above the 200 EMA, indicating that the “golden cross” formation is continuing. This signals that upward pressure may continue in the medium term. The Chaikin Money Flow (CMF–20) indicator is at a neutral level. Money inflows continue to decline, which could push the CMF-20 into negative territory. The Relative Strength Index (RSI-14) indicator is at a neutral level. On the other hand, it has crossed below the upward trend that has been ongoing since August 2, indicating that the buying pressure has come to an end. In the event of macroeconomic risks or negative news from the ecosystem, the $0.20472 level can be monitored as a strong support level. On the other hand, if the upward movement gains strength, the first strong resistance level at 0.25025 USD comes into focus.
Support levels: 0.22234 – 0.20472 – 0.18224
Resistances: 0.25025 – 0.28164 – 0.31107
TRX/USDT
Last week, an important development took place in the cryptocurrency ecosystem. The T3 Financial Crime Unit (a joint venture between Tether and TRM Labs), which includes Tron, announced that it had identified and frozen over $250 million in illegal cryptocurrency assets globally.
During the week of August 11–17, 2025, a total of 43.2 million TRX were burned on the TRON network. This reduced the circulating supply by 15.8 million. The decrease in circulating supply continues to exert deflationary pressure on TRX. Additionally, the total number of addresses increased by 1.4 million to reach 326.4 million during the same week.
Last week, the TRON network generated a record revenue of 104.3 million dollars, increasing its revenue by approximately 7.7 million dollars compared to the previous week and continuing to be the highest-revenue-generating ecosystem among all blockchain networks. This increase was driven by stablecoin transfers on the TRON network and user interactions in the DeFi sector.
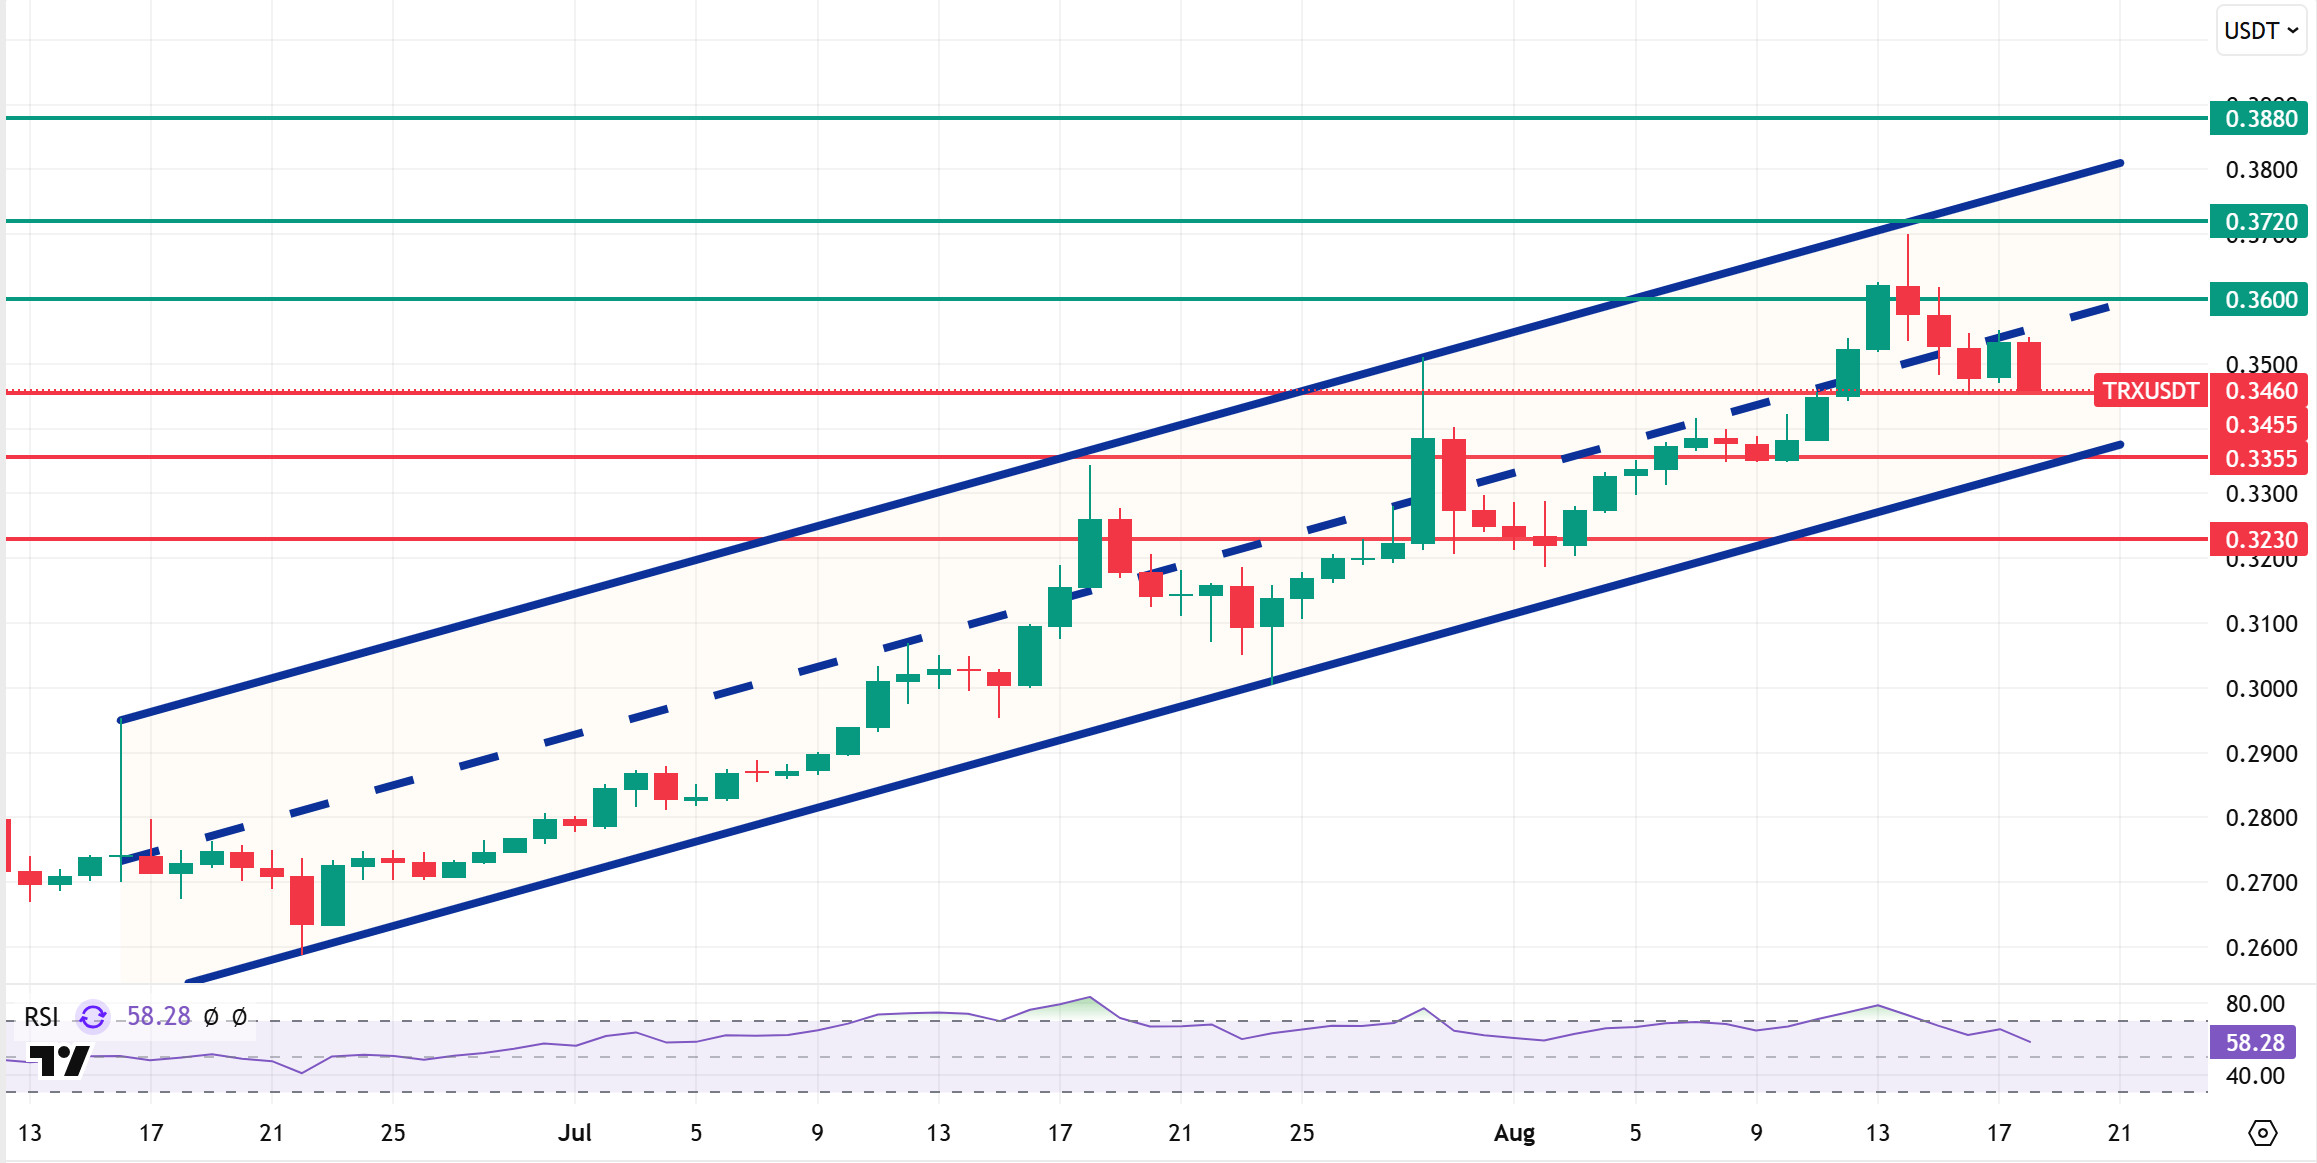
TRX started last week at 0.3383 and rose by approximately 4.5% during the week, closing at 0.3533. Thus, it closed its eighth consecutive week with an increase, reaching a market value of $32.87 billion. Currently trading at 0.3460, TRX is just below the middle band of the bullish channel on the daily chart. The Relative Strength Index (RSI) value is observed at 58. Considering its position within the bullish channel and the RSI indicator, TRX price is expected to rebound from the 0.3455 support level and resume its upward movement. This could indicate a potential move toward the middle and upper bands of the bullish channel. In such a scenario, it may test the 0.3600 resistance level. If it closes above the 0.3600 resistance level on a daily basis, it may test the 0.3720 resistance level. If it fails to close above the 0.3600 resistance level on a daily basis and the bearish sentiment in the market persists, it is expected to decline due to potential selling pressure from this area. In such a scenario, it could move toward the lower band of the bullish channel and test the 0.3355 resistance level. The 0.3230 level is an important support on the daily chart, and as long as it remains above this level, the upward momentum is expected to continue. A break below this support could increase selling pressure.
Support levels: 0.3455 – 0.3355 – 0.3230
Resistances: 0.3600 – 0.3720 – 0.3880
AVAX/USDT
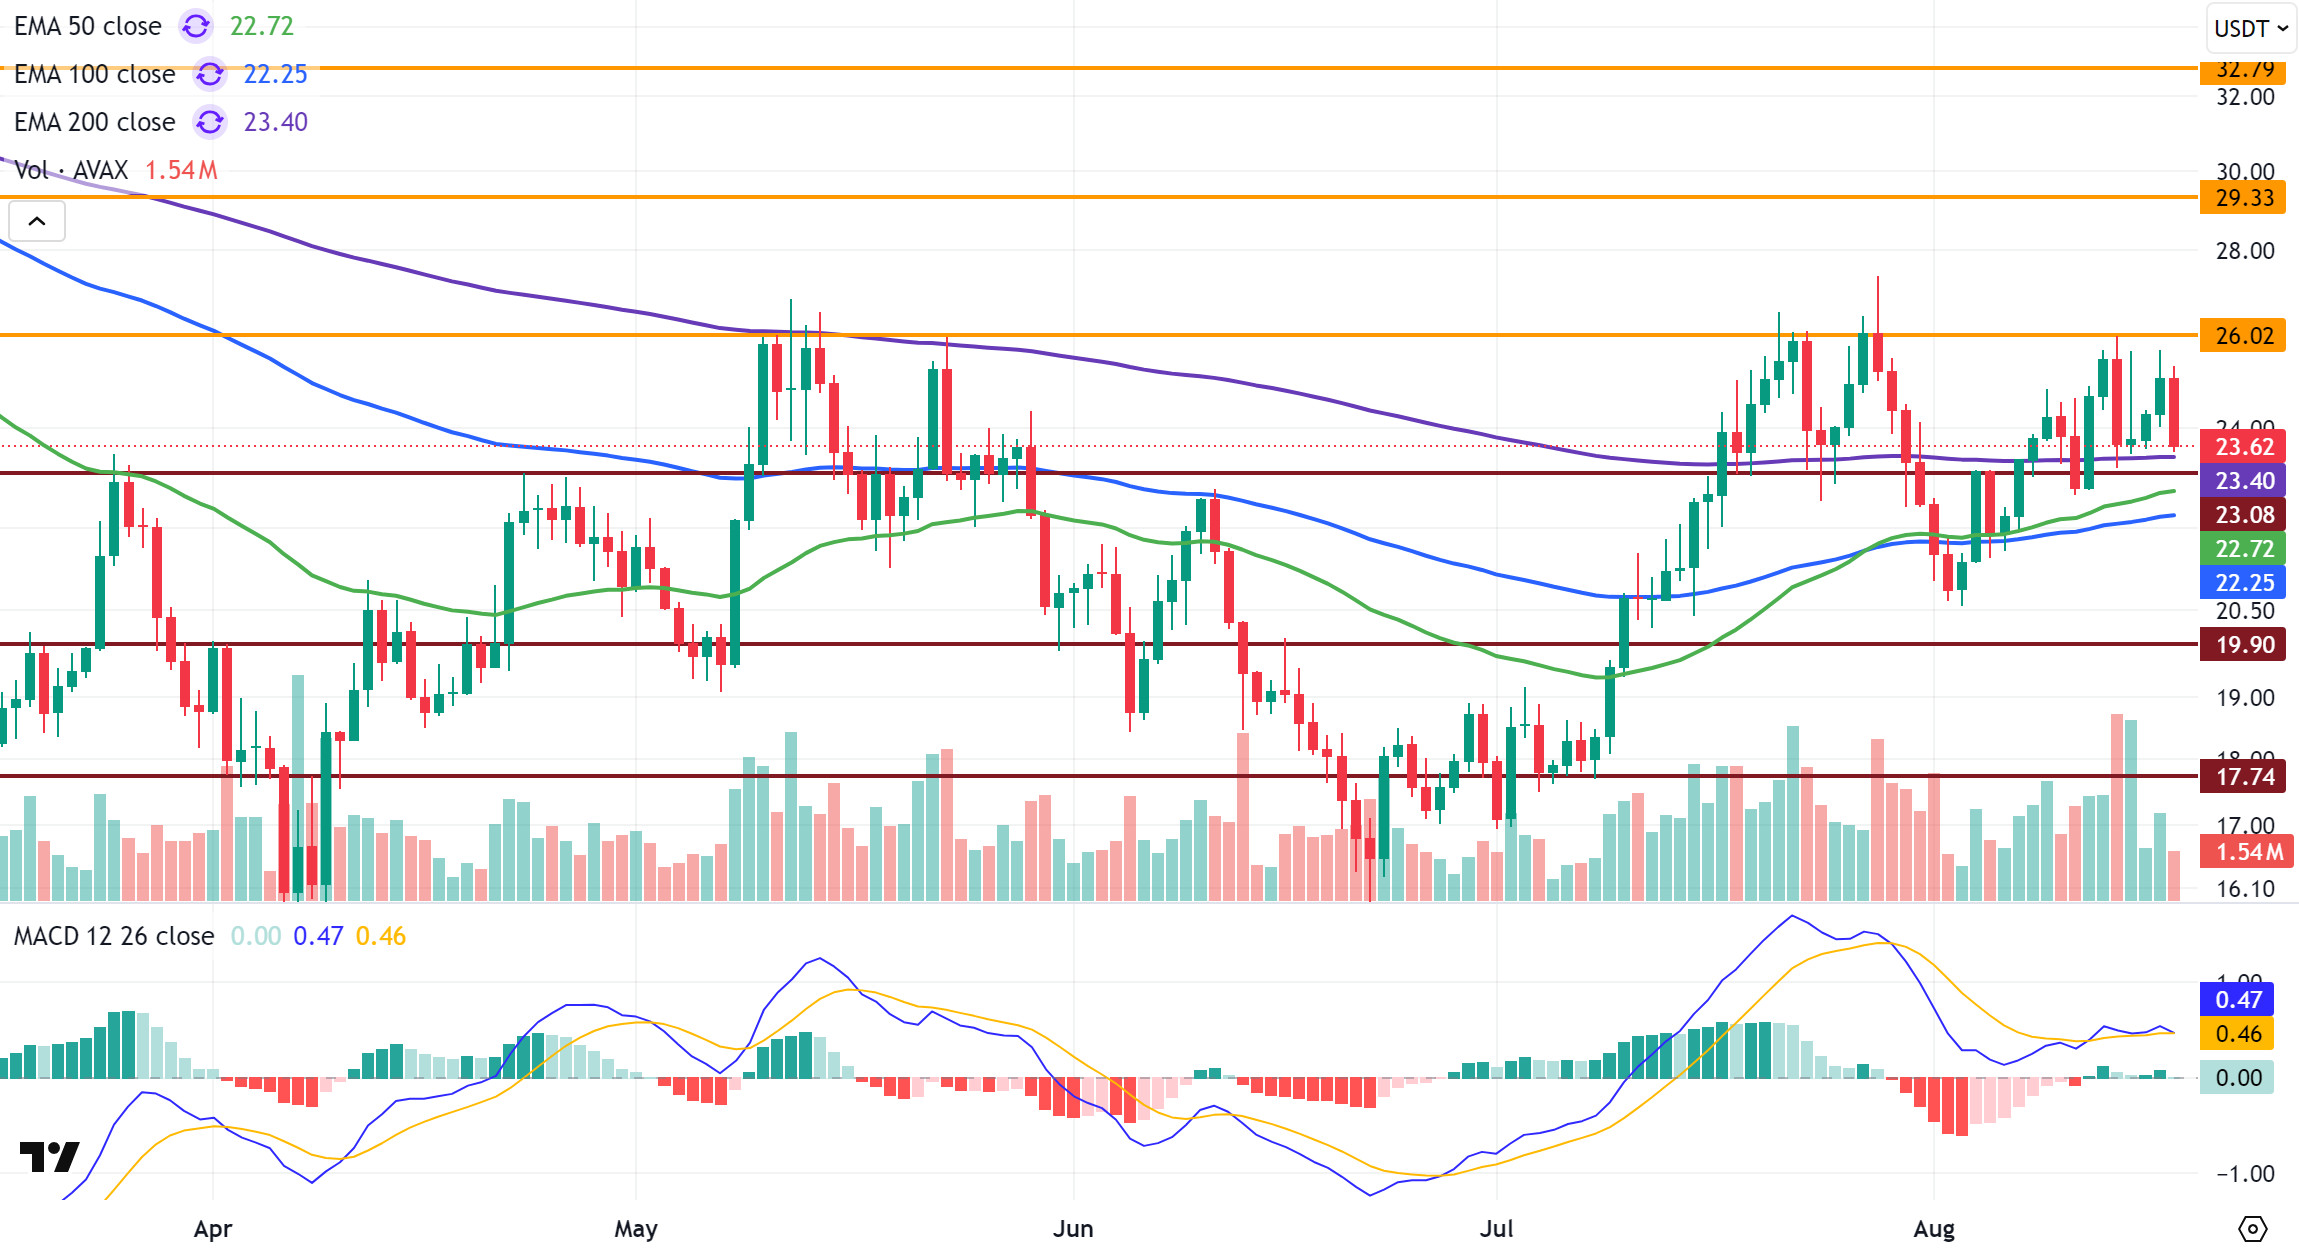
AVAX, which started last week at $23.83, closed the week at $25.06 with an approximate 5.2% increase in value. On the ecosystem front, last week was a period marked by a significant increase in institutional interest. Notably, BlackRock’s $240 million investment in AVAX projects and VanEck’s $100 million RWA fund were among the developments that bolstered investor confidence. This positive sentiment also reflected in the AVAX price, with the 26.02 dollar resistance level—which had been tested multiple times but not broken—being tested again during the week. However, due to the lack of a strong positive momentum, the price retreated after facing selling pressure at this level. This level, which has not been surpassed in the past six months, continues to be a critical resistance level for AVAX. On the other hand, after testing the 200-period Exponential Moving Average (EMA200) level during the decline, the price recovered with buying and closed the week above $25.
When examining the technical indicators on the daily chart, the Moving Average Convergence/Divergence (MACD) line crossed above the signal line during last week’s uptrend but turned downward following selling pressure at the $26.02 level during AVAX’s rally. The MACD line and signal line have now crossed during this downtrend. This outlook indicates that AVAX has not yet determined a clear direction but continues to remain in positive territory. In other words, although momentum is limited, the technical picture supports an upward trend. Additionally, AVAX trading above critical Exponential Moving Average (EMA) levels is another factor that strengthens the likelihood of an upward trend.
In the coming period, if AVAX manages to stay above the $26.02 level, the first target for the continuation of the upward momentum could be $29.33, followed by $32.79. Breaking these resistance levels will strengthen the upward trend and give it new momentum. On the contrary, if the $26.02 level cannot be broken and selling pressure increases, the EMA200 and $23.08 support levels may be tested. If there are closes below these levels, the decline may deepen, and the $19.90 , and $17.74 support levels may come into focus. In the overall picture, AVAX continues to trade above critical EMA levels, maintaining the possibility of an upward movement. However, breaking above the $26.02 resistance level is crucial for a new strong upward trend. If this level cannot be broken, short-term selling pressure may come to the fore.
(EMA50: Green Line, EMA100: Blue Line, EMA200: Purple Line)
Support levels: 23.08 – 19.90 – 17.74
Resistance Levels: 26.02 – 29.33 – 32.79
SHIB/USDT
This week, the Shiba Inu (SHIB) ecosystem stood out with increases in transaction volume and address growth. The total number of transactions on the Shibarium network reached 1.53 billion, 12.5 million blocks were produced, and an average of 4.7 million transactions were processed daily. This figure significantly exceeded last week’s daily average of 3 million, indicating an acceleration in user activity within the ecosystem. The number of wallets rose to 267 million addresses, continuing the ecosystem’s adoption momentum. The network’s utilization rate reached 50.5%, and gas fees remained at 0.6 Gwei, maintaining its user-friendly structure. On the burn side, rates increased by over 150% as of August 11, and this momentum was sustained throughout the week, contributing to the supply reduction strategy. While community-driven burns were prominent last week, this week saw Shibarium’s deflationary effect become more pronounced. Net outflows from exchanges supported the reduction in supply pressure, indicating that investors are moving their tokens to long-term wallets. In the decentralized finance space, ShibaSwap maintained its position as the leading application in the ecosystem with a total value locked (TVL) of approximately $1.12 million. It was followed by WoofSwap with $354,623 and ChewySwap with $191,539 in TVL. Additionally, platforms like DogSwap, Marswap, Shibex, and PunkSwap contributed to increasing financial diversity on Shibarium. Despite minor fluctuations in TVL figures compared to last week, the overall picture confirmed the ecosystem’s steady growth in the DeFi sector. Data shared on the occasion of Shibarium’s second anniversary showed that the network has established a solid foundation in terms of scalability and adoption. While infrastructure and governance-focused innovations took center stage last week, this week saw data on network size take the spotlight. This further solidified Shibarium’s steady rise both in terms of transactions and the DeFi ecosystem.
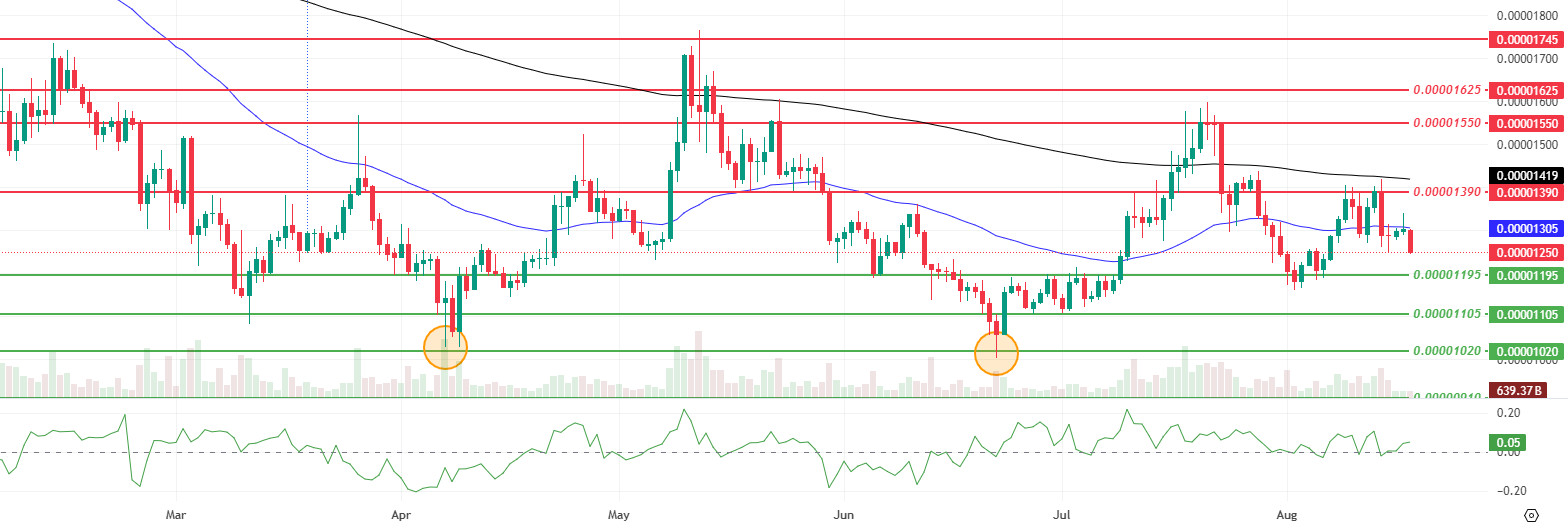
On the technical side, Shiba Inu’s price is looking weak this week. Momentum, trading volume, and volatility are all down significantly. The price has dropped from $0.00001305 to $0.00001250, approaching the intermediate support level. Maintaining this level is critical for the short-term outlook, while the 0.00001195 dollar level could come back into focus as a strong support level below it. Further down, the 0.00001105 dollar and 0.00001020 dollar levels act as other support zones.
On the upside, the 50-period Exponential Moving Average (EMA50 – Blue line) continues to exert pressure just above the price. In the medium term, the 200-period Exponential Moving Average (EMA200 – Black line) remains the main resistance level. A strong trend reversal is unlikely without a sustained break above this level. In upward attempts, 0.00001390 USD is the first important resistance level, followed by 0.00001550 USD and 0.00001625 USD levels. The Chaikin Money Flow (CMF) indicator is in the positive zone at the 0.05 level but shows a horizontal trend. This indicates that capital inflows are not strong and buyer interest is weakening. A resumption of upward movement in the CMF could strengthen buyer confidence. Looking at the overall picture, it is likely that the price will fluctuate between 0.00001250 and 0.00001390 dollars in the short term.
Support levels: 0.00001195 – 0.00001105 – 0.00001020
Resistance levels: 0.00001390 – 0.00001550 – 0.00001625
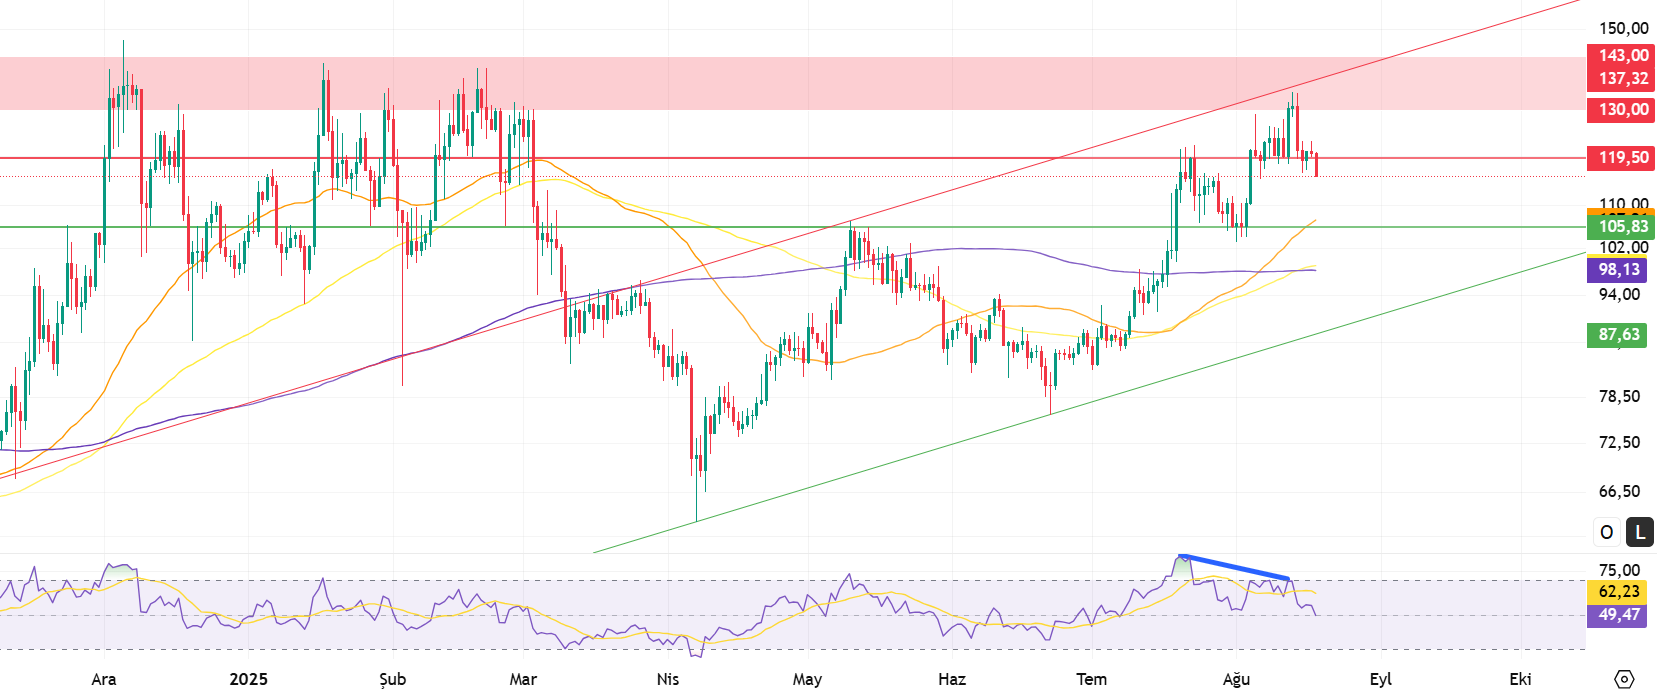
LTC/USDT
LTC ended last week with a 2.46% decline, entering the new week at 120.72. LTC also lost 0.34% against Bitcoin during the same period, with its market value falling to approximately $8.8 billion and dropping one place in the market rankings to 20th. In the futures market, open positions decreased by approximately 12% compared to the previous week, while funding rates continued their positive trend.
This week, Litecoin (LTC) continues to trade above all important short, medium, and long-term moving averages. The absence of any moving averages forming dynamic resistance above the price indicates that these averages could act as support in the event of a pullback. The first potential resistance level in upward movements is 119.50. If this level is broken, the 130.00–143.00 range can be monitored as the next important resistance zone.
This band, which was tested last week as it was in previous weeks, remains an important level that has not been broken. Rapid sell-off reactions may be seen as the price approaches this area; however, if a breakout occurs, sharp rallies at the same pace could also be expected. If the 130.00 level, which is the first stage of this resistance zone, is broken, the upper line of the rising trend within the band could create potential selling pressure. This level is currently at 137.32, but it may increase as the week progresses. Following this, the upper limit of the red band at 143.00 stands out as the area where selling pressure could be felt most strongly.
Meanwhile, technical indicators, particularly the Relative Strength Index (RSI), show that the negative divergence observed since last week continues to exert pressure on prices. This situation brings a potential pullback scenario into focus. In this scenario, the first potential support level is at 105.83, supported by the 50-day moving average (orange line). In deeper declines, the 100-day (yellow line) and 200-day (purple line) moving averages at the 98.13 level can be monitored. The best buying opportunity could come from the rising channel’s lower band at the 87.63 level during sharp declines.
Support levels: 105.83 – 98.13 – 87.63
Resistance levels: 119.50 – 137.32 – 143.00
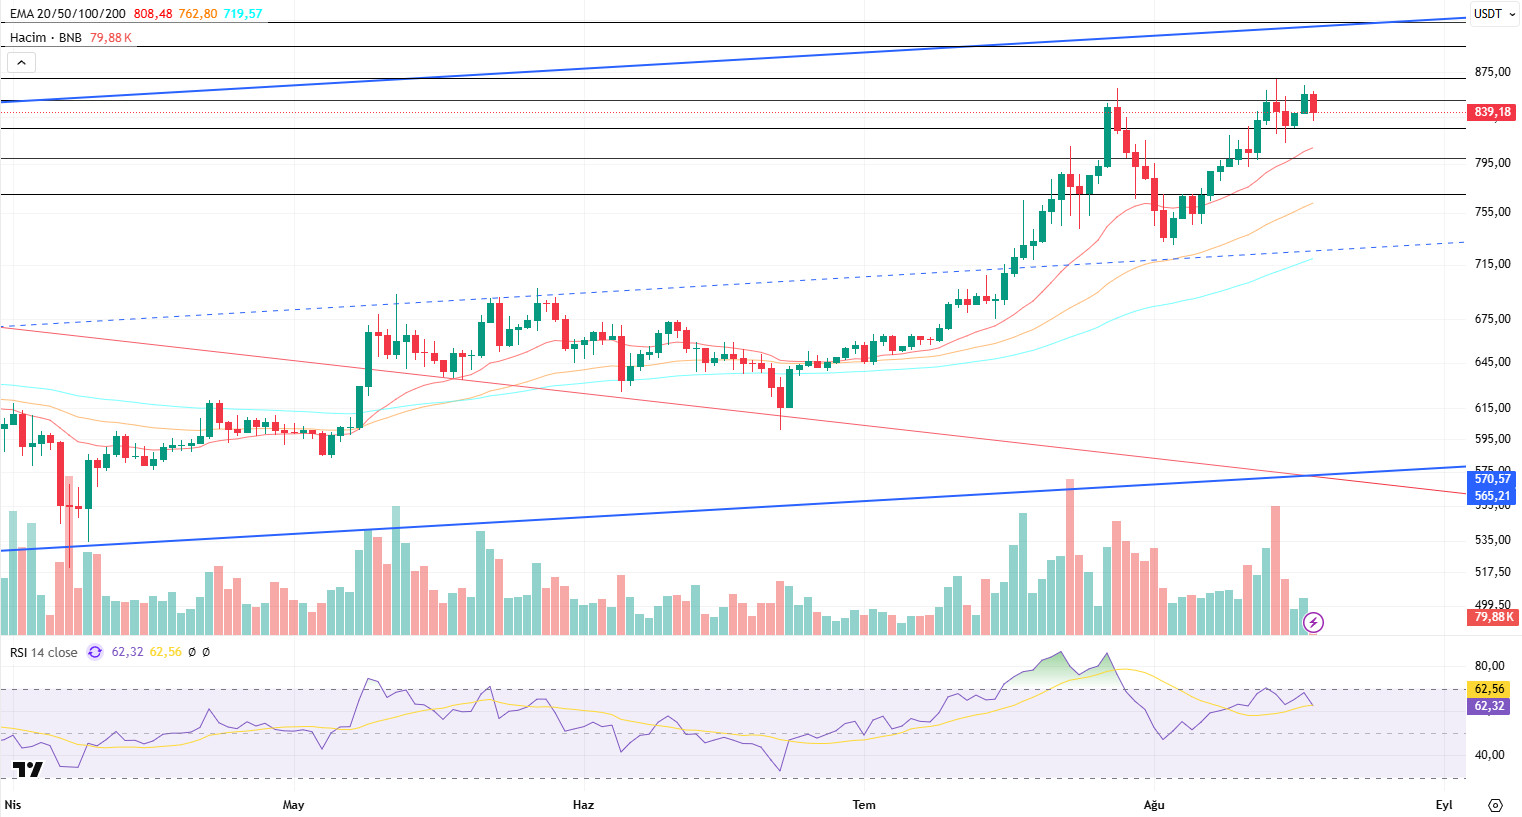
BNB/USDT
From a technical perspective, the BNB/USDT pair rose to the $870 level last week, influenced by the overall positive market trend. However, the selling pressure encountered at these levels caused the pair to trade sideways from the middle of the week onwards. As the new week began, BNB started negatively, trading below $850, and continued its downward trend due to the ongoing pressure at the same levels.
Currently trading in the $825–850 range, technical indicators for the BNB/USDT pair show a weak and negative trend in trading volume over the past week. This indicates an increase in selling appetite across the market. On the other hand, the Relative Strength Index (RSI) has rebounded twice from the 70 level and reversed its direction downward. This technical structure suggests that negative trends could gain momentum in the short term.
Within the current technical outlook, if the negative momentum persists, the BNB price is expected to test the 825 dollar support level in the first instance. If this level is broken to the downside, the 800 and 770 dollar levels emerge as the next critical support zones. On the other hand, if the 825 dollar support level holds and buying interest increases, the price may retest the 850 dollar resistance level. If this resistance level is broken to the upside, the 870 and 900 dollar levels will emerge as the next strong resistance points to watch.
Supports: 825 – 800 – 770
Resistance levels: 850 – 870 – 900
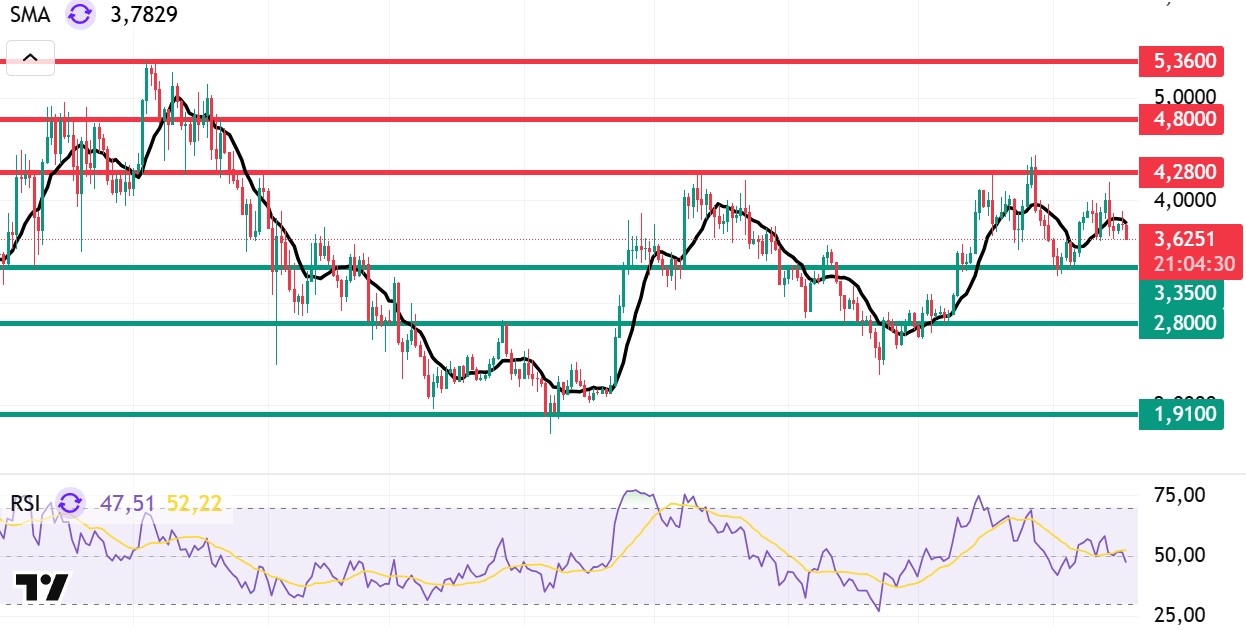
SUI/USDT
The Sui (SUI) network started the new week quite strongly with both technological updates and interest from institutional investors. In particular, the recent increase in trading volumes and activity in the developer community show that Sui is not just experiencing temporary popularity, but rather that the ecosystem has entered a period of sustained growth. The most significant contribution to this picture came from the investment company Mill City Ventures III. The company announced that it would invest a total of $500 million in Sui. By making an initial purchase of $276 million, Mill City Ventures significantly increased the amount of Sui in its portfolio. This move is not only a significant investment in terms of numbers but also positions the company as the only institutional treasury integrated into the ecosystem, as it operates within an official partnership framework with the Sui Foundation. This development is of great importance for Sui. First, the growing interest from institutional investors increases liquidity within the ecosystem and contributes to price stability. The fact that a large-scale fund is directing such strong support toward Sui serves as a reassuring example for other institutional actors. This not only enhances the Sui Foundation’s visibility on an international scale but also deepens investor interest and boosts the motivation of the developer community.
Following recent developments, when we look at Sui’s technical outlook, the price has declined on a weekly basis to around $3.62, influenced by fundamental developments. The Relative Strength Index (RSI) is currently in the 47.351 – 52.22 range. This value range indicates that the market is trading close to the sell zone; however, if the RSI weakens and falls to the 35.00 – 40.00 range, it could signal a potential buy point. If the price moves upward, the resistance levels of 4.28, 4.80, and 5.36 dollars can be monitored. However, if the price falls to new lows, it could indicate that selling pressure is intensifying. In this case, the 3.35 and 2.80 dollar levels stand out as strong support zones. Based on the trend line, a pullback to 2.80 dollars is technically possible. According to Simple Moving Averages (SMA) data, Sui’s average price is currently at 3.78 dollars. If the price remains above this level, it could signal that the current upward trend could continue technically. The upward trend of the SMA also supports this scenario.
Support levels: 1.91 – 2.80 – 3.35
Resistance levels: 4.28 – 4.80 – 5.36
ADA/USDT
Cardano rose 11.50% since last week, ranking second among the altcoins with the highest weekly gains. The market cap reached $3.90 billion during the day, the highest trading volume since November 2024. According to Spot Taker CVD (Cumulative Volume Delta) data, the market is showing seller dominance at the 0.9612 level on the ADA network this week. Buyers are absorbing sellers with limit orders and continuing to wait in the liquidation zones around the strong resistance level of 1.03250 and the level. The average size of orders entered in the spot market has dropped to 274,758, indicating that institutional investors may be moving toward profit-taking. According to this week’s news about Cardano, digital asset management company Grayscale Investments has filed an application for a spot exchange-traded fund (ETF) for ADA in the US state of Delaware. Following the news, the ADA price rebounded from its support level and rose by 12%.
Technically speaking, it closed at 1.098 last week. It continues to move within the rising channel band amid selling pressure during the day. It tested the resistance level of 1.0178 last week and managed to stay above the 0.9017 level. If it breaks above the rising band on the daily chart, it is expected to remain above the 1.0255 level. If the price enters the rising channel band within the EMA 20 (Red Line), it may move towards a downward trend. The Relative Strength Index (RSI) continues at around 61, while the Chaikin Money Flow (CMF-20) has settled at 0.01 levels, with the observed signals pointing to positive momentum. The rising channel zone indicated on the chart marks the price’s intense trading zones, where momentum is advancing within narrow ranges. This week, ADA’s price is consolidating in the $0.9111–$1.110 range, with the $0.8379–$0.7378 level emerging as a support zone in a potential downturn scenario, while the $1.0255–$1.0760 range is attracting attention as a resistance zone.
Support levels: 0.8379 – 0.7378 – 0.7000
Resistances: 1.0255 – 1.0760 – 1.0178

Legal Notice
The investment information, comments, and recommendations contained in this document do not constitute investment advisory services. Investment advisory services are provided by authorized institutions on a personal basis, taking into account the risk and return preferences of individuals. The comments and recommendations contained in this document are of a general nature. These recommendations may not be suitable for your financial situation and risk and return preferences. Therefore, making an investment decision based solely on the information contained in this document may not result in outcomes that align with your expectations.