
Weekly Technical Analysis Report
BTC/USDT
The first days of August saw the US economy facing a busy agenda in terms of foreign trade policies, cryptocurrency regulations, and employment data. While a 15% joint customs tariff between the US and the European Union came into effect, trade talks with China were extended by 90 days, and new tariffs began to be applied to many countries. The US economy grew by 3% in the second quarter; however, July’s non-farm payroll data came in at 73,000, below expectations, and unemployment rose to 4.2%. The Fed kept interest rates unchanged, while Powell’s remarks and divisions among FOMC members drew attention. Following the White House’s first official crypto report, the SEC took steps to clarify the regulatory framework with its “Project Crypto” initiative. While corporate Bitcoin reserves continued to grow, Strategy purchased an additional 21,021 BTC, and companies such as Metaplanet, The Smarter Web Company, H100 Group, Capital B, Empery Digital, and Virtu Financial also made purchases. Apple stood out with quarterly revenue exceeding $94 billion, while the Trump administration announced new measures on trade and customs with South Korea, India, Canada, Switzerland, and many other countries. President Trump also signaled his intention to appoint a new BLS director and make changes to the Fed’s leadership.
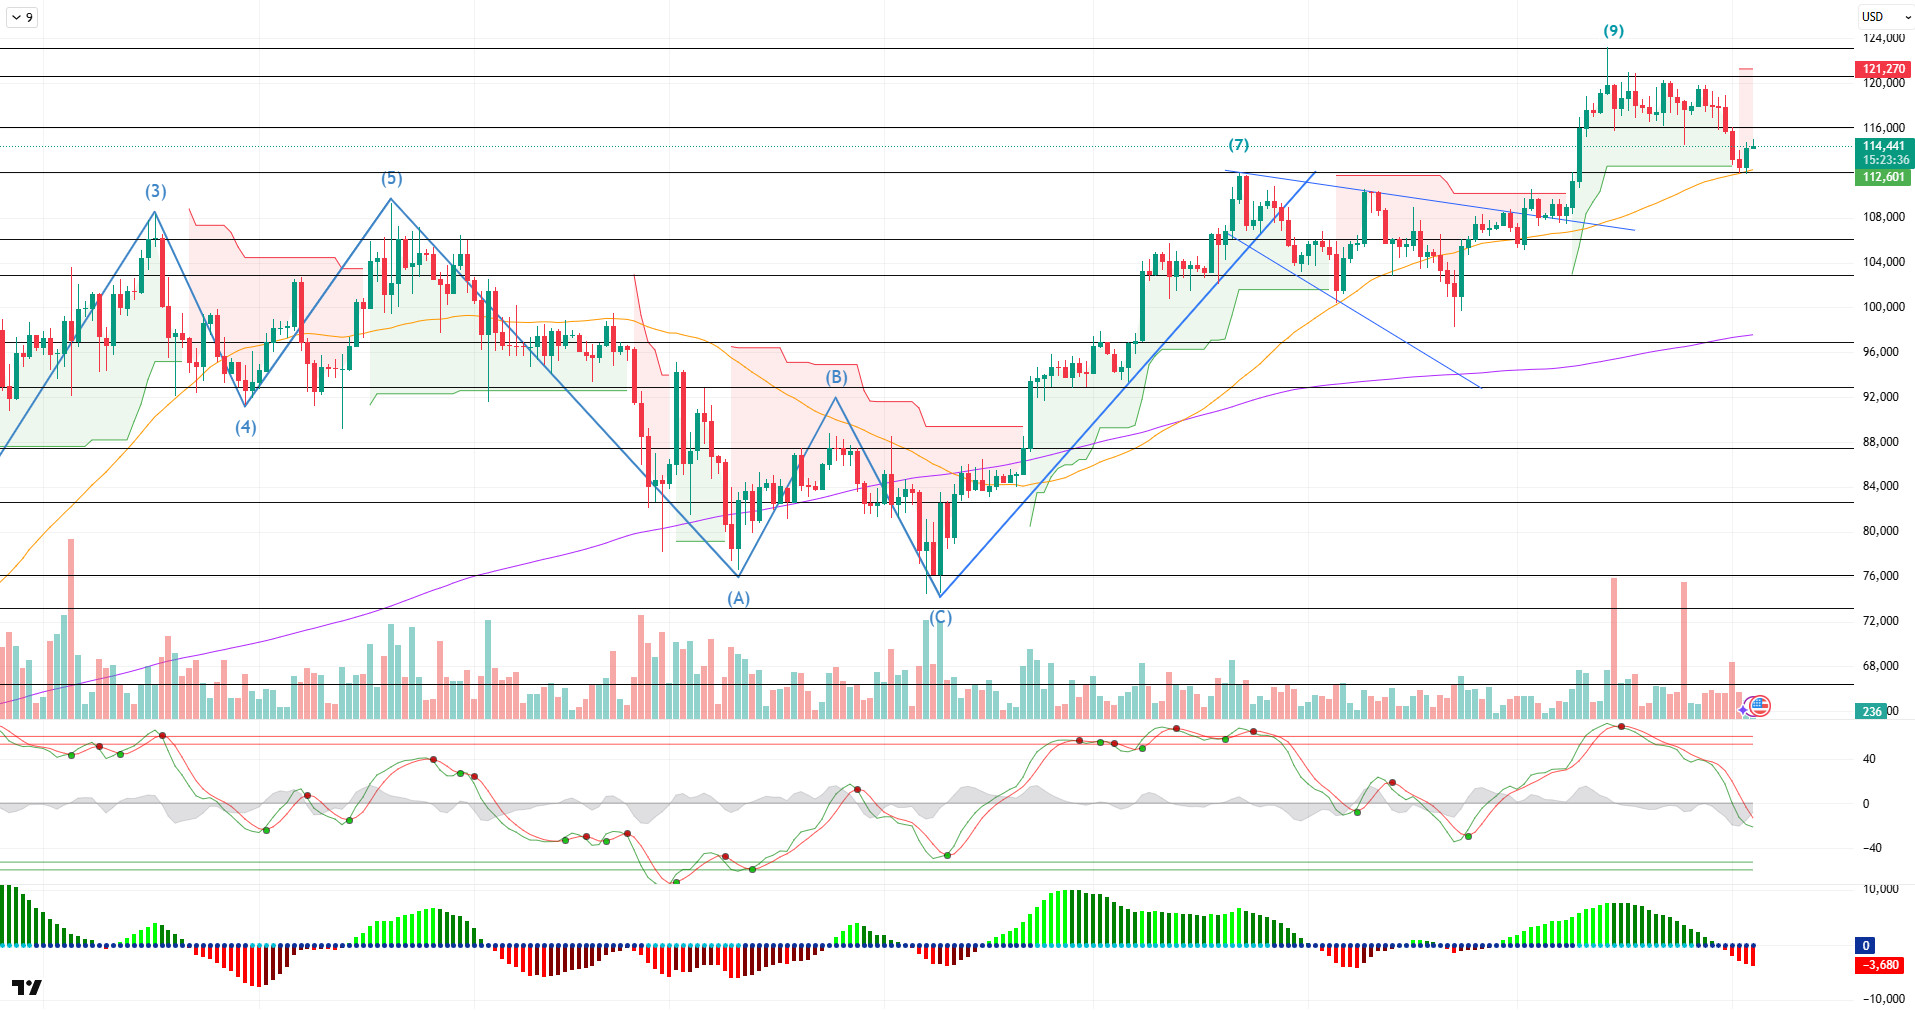
Looking at the daily technical outlook following all these developments, BTC completed its consolidation phase near the ATH level after reaching the 9th peak with its golden cross pattern and retreated to the 112,000 level, which is the SMA 50 line.
Looking at technical indicators, the WT oscillator has retreated from the overbought zone to the middle band of the channel on the daily chart, while the histogram on the SM indicator has reached maximum momentum in the negative zone. Meanwhile, the golden cross pattern continues as the 50-day SMA crosses above the 200-day SMA.
When examining weekly liquidity data, the recent decline has led to the liquidation of buy positions above the 112,000 level, while the sell-off continues above the 120,000 level.
In summary, fundamental developments have emerged as the key factors exerting pressure on prices. After reaching a technical saturation point, the market is now repositioning itself to establish a suitable foundation. Liquidity data continues to set boundaries for the price to regain its upward momentum. In this context, the 116,000 level stands out as the entry point to the consolidation band, and breaking above this level could open the way for a return to the 120,000 levels. On the other hand, if this level is not broken, the 112,000–116,000 band, which appears as the “Gap” zone, can be monitored as the new movement area.
Support levels: 112,000 – 110,000 – 106,000
Resistance levels: 116,000 – 120,000 – 123,000
ETH/USDT
Ethereum lost value throughout last week due to selling pressure, falling below the $3,557 support band. During this decline, the price rebounded strongly from the $3,350 level and managed to climb back above the critical support zone. While these price movements were taking place, there was an important development on the institutional front. SharpLink Gaming purchased an additional 15,822 ETH with a new purchase of $53.9 million, increasing its total reserves to 480,031. This purchase demonstrates the company’s continued long-term positive outlook for Ethereum and its commitment to its aggressive treasury management strategy. On-chain data also supports this optimism among institutional and large investors. The total staking amount on the Ethereum network reaching 36.18 million units indicates that long-term investors continue to lock up their assets and maintain confidence in the price.
In the futures market, the decline in open positions from $27 billion to $22 billion confirms that a significant portion of leveraged long positions have been closed and that the market is undergoing a correction process. Concurrently, the funding rate, which had risen to 0.0153, has returned to neutral levels, indicating that the market has rebalanced and the overly inflated structure has been unwound. These data suggest that a healthy correction has taken place and that the positive structure has now settled on a more solid foundation.
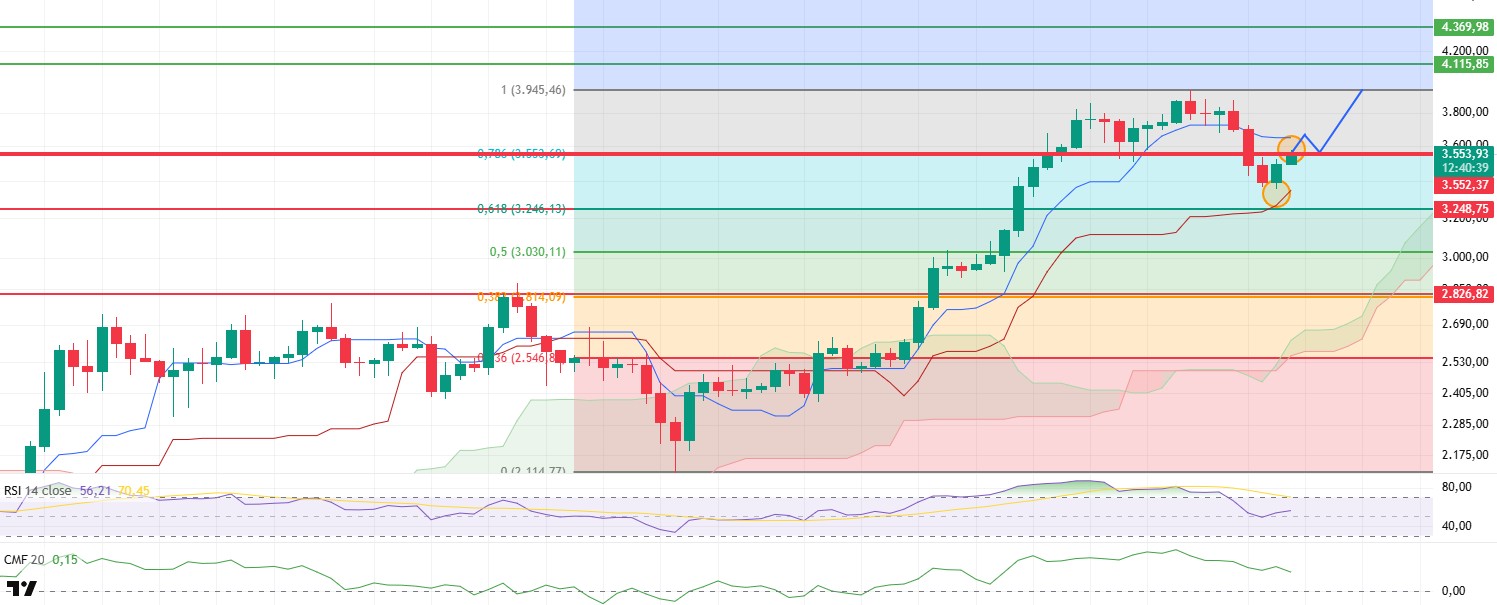
On the technical side, the data provided by the Ichimoku cloud is noteworthy. The decline that began with the price breaking below the Tenkan level continued down to the Kijun level. During this process, prices also fell below the Fibonacci 0.786 level. However, the reclaiming of these levels after the weekly close brought a possible re-accumulation scenario to the fore within the Wyckoff methodology. According to this structure, the SC (Selling Climax) point can be estimated at $2,350, while the AR (Automatic Rally) point matches the Tenkan level of $3,650. In this scenario, the price is expected to rise to the 3,650 dollar level initially, then retest the Fibonacci 0.786 level at 3,550 dollars, defined as the ST (Secondary Test), and continue its upward movement after the ” .” If this structure gains traction, the upward potential is considered strong.
When examining the Chaikin Money Flow (CMF) indicator, which measures liquidity dynamics, it can be seen that despite showing a slight downward trend, the indicator remains in positive territory. This indicates that net inflows into the market are continuing and that sufficient demand is being maintained in the spot market.
The Relative Strength Index (RSI), on the other hand, retreated from the overbought zone and declined to the 50 level, where it found support and resumed its upward movement. This classic positive reversal pattern indicates that the market has exited the overbought zone without losing momentum and has begun to regain strength.
When all these technical and on-chain data are evaluated together, it can be said that the current structure in Ethereum is laying the groundwork for an upward movement. Continued institutional demand, positive liquidity indicators, and a market that has balanced itself with a healthy correction support this outlook. In this context, it is likely that the price will test the $3,950 level again in the coming days. If this level is broken, and especially if the $4,115 resistance is broken, a strong upward rally could come to the fore. On the other hand, the 3,248 dollar level is the main support level, and daily closes below this region could weaken the outlook and open the door to deeper declines.
Support levels: 3,533 – 3,130 – 2,826
Resistances 4,115 – 4,369 – 4,890
XRP/USDT
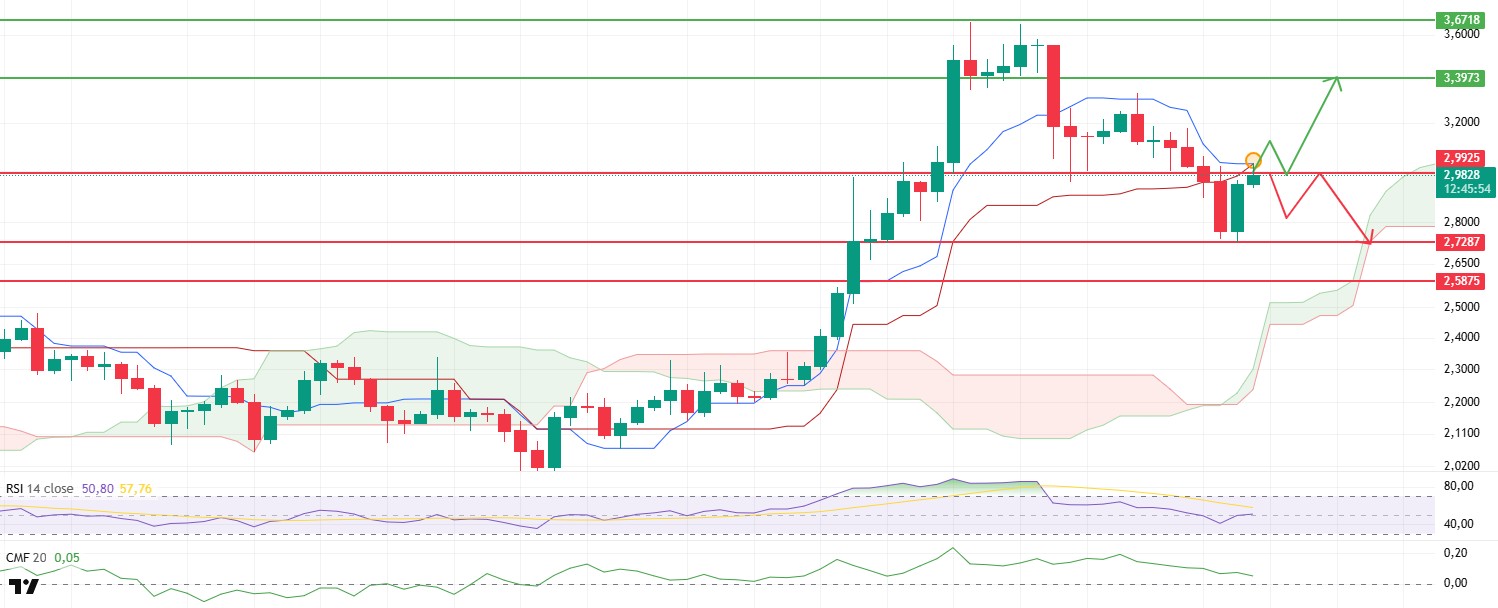
The price of XRP experienced a sharp decline last week due to economic data from the US. In particular, macroeconomic data dampened risk appetite, triggering a broad pullback in the cryptocurrency markets. During this process, XRP found strong support at the $2.72 level, which had been tested many times before and is technically significant. With buying activity from this level, the price recovered after the weekly close and rose to the 2.99 dollar resistance level, as seen on . This upward movement indicates that buyers remain active in the short term and that investors continue to take positions during downturns.
Technical indicators support the price’s reaction from this support zone. In particular, the Relative Strength Index (RSI) turned upward with purchases from $2.72 and regained the critical threshold of 50. The RSI’s continued stay in the positive zone at this level indicates that market momentum is regaining strength and that the price retains its upward potential. This creates a healthy foundation for an upward scenario and suggests that the market may have entered a technical recovery process.
However, it is difficult to say that the liquidity side is equally strong. The Chaikin Money Flow (CMF) indicator continues to show a negative trend despite the recovery in the RSI. The downward movement of the indicator indicates that there are still clear liquidity outflows in the market and that this situation should be closely monitored in terms of the sustainability of the uptrend. If purchases from the spot market are insufficient, the price may struggle at resistance levels and buyers may lose momentum.
The Ichimoku indicator, on the other hand, presents a complex picture. The intersection between the Tenkan and Kijun levels in the daily time frame indicates that the trend is showing an indecisive structure in the short term and that some weak signals are continuing. These crossovers can signal a negative structure, especially if prices begin to move below the cloud. However, in the current situation, prices are still holding above the Kumo cloud. This can be interpreted as a factor confirming that the overall trend remains positive and the primary direction is upward.
In light of all these technical data, a daily close above the $2.99 level during the week could be a critical threshold for buyers to regain confidence. In such a scenario, a gradual rise to the $3.39 region seems technically possible. However, as long as the $2.99 resistance level is not breached, upward movements are likely to remain limited, and the price could enter a corrective movement back toward the $2.72 support zone. Therefore, the $2.99 level should be closely monitored as a key threshold for both short-term direction and overall market sentiment.
Top of the FormBottom of the FormSupports 2.9925 – 2.7287 – 2.5875
Resistances 3.3973 – 3.6718 – 4.1848
SOL/USDT
Last week in the Solana ecosystem;
- Solana treasury company Upexi (UPXI) announced that it had signed a $500 million equity credit facility agreement with Alliance Global Partners.
- Invesco Galaxy filed an application with CBOE for a Solana ETF. Cboe BZX submitted an application for a Solana ETF with spot access and built-in staking rewards.
- 21Shares submitted an updated S-1 filing for a spot Solana ETF.
- Bitwise and VanEck have urged the SEC to approve Liquid Staking Tokens for their Solana ETFs.
- VanEck, Grayscale, Franklin, Bitwise, Fidelity, and CoinShares have filed amended S-1 forms for their Solana ETFs.
- Jito Labs and VanEck have launched a Solana-based liquid staking solution that enables investors to maintain liquidity while staking their assets, is compliant with regulations, and enhances DeFi participation.
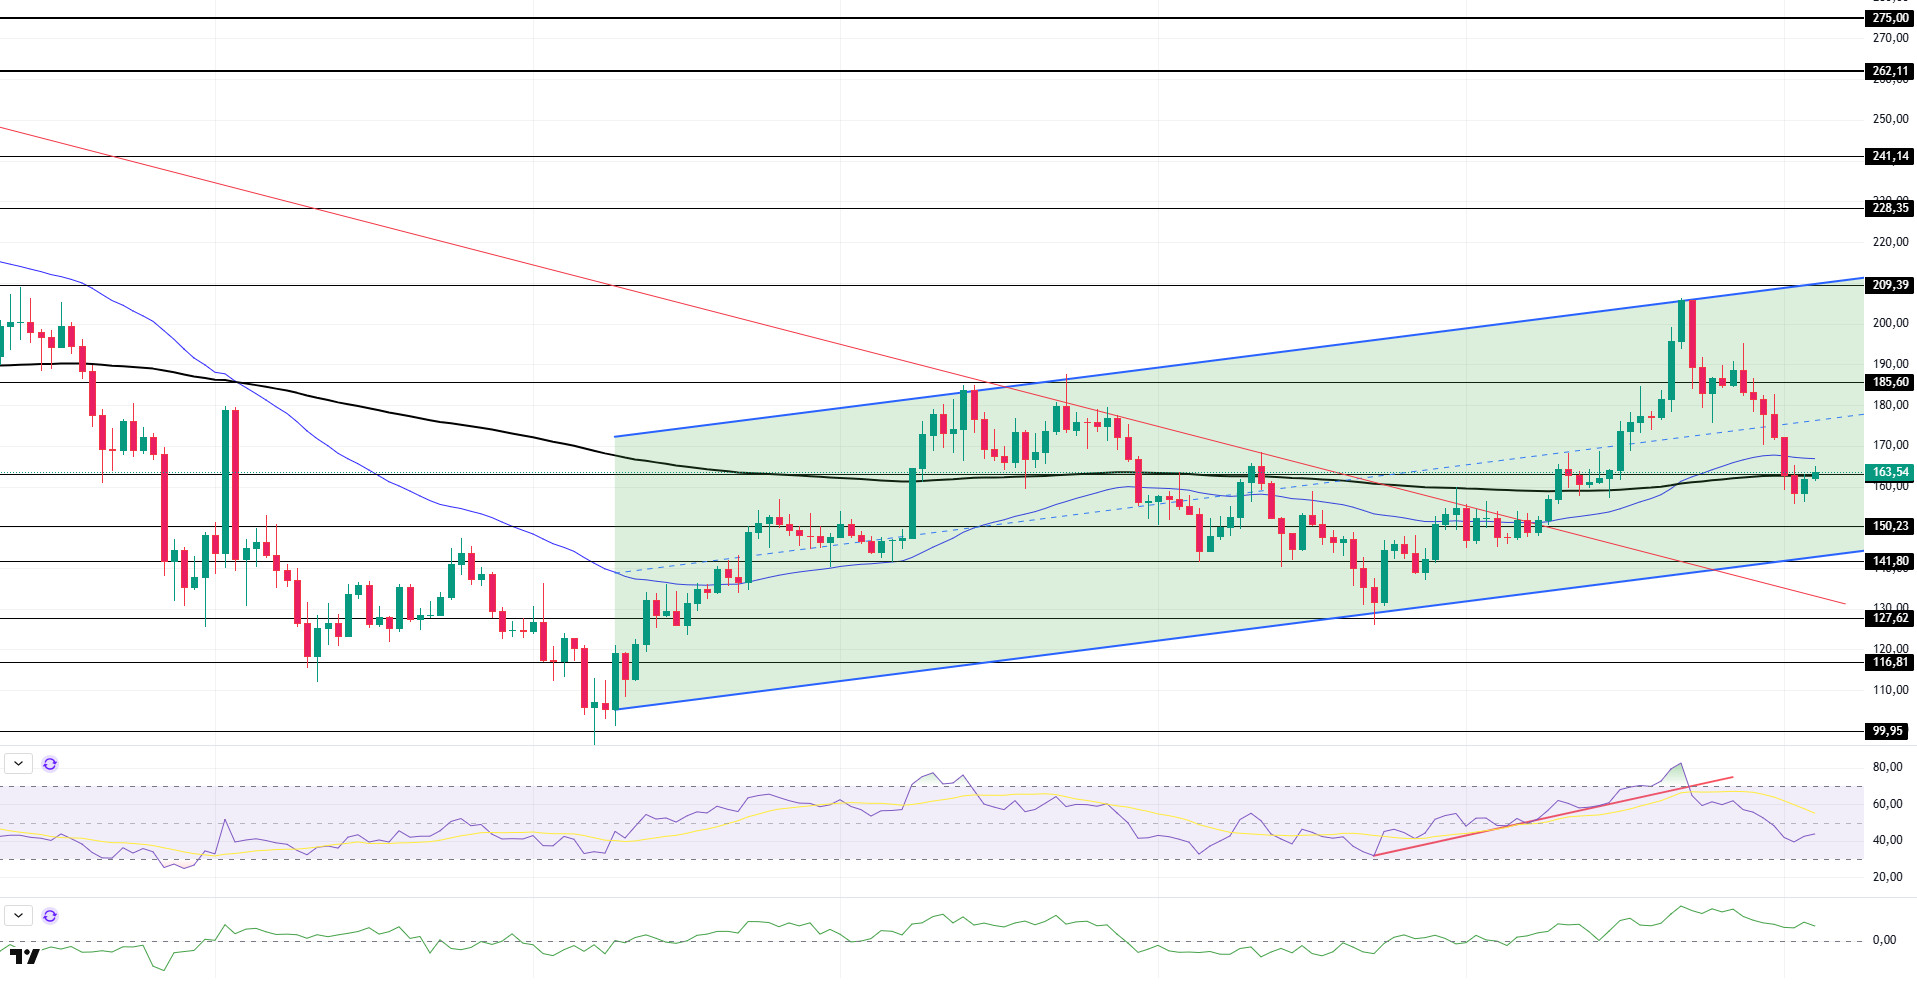
The SOL price has been on a downward trend this week. The asset experienced a decline after encountering resistance at the peak of the upward trend that began on April 9 and closed below the 50 EMA (Blue Line) and 200 EMA (Black Line) moving averages. As of now, it is testing the strong resistance level at $162.99 and the 50 EMA moving average. If the pullback continues, it could break below the bottom of the upward trend and test the downward trend that began on January 26 as support. Otherwise, the top of the upward trend should be monitored.
The asset is trading below the 50 EMA (Blue Line) and 200 EMA (Black Line) moving averages, indicating that the asset is in a downtrend. Additionally, the 50 EMA remaining above the 200 EMA indicates the continuation of a technical “golden cross” formation. This suggests the potential for an upward trend in the medium term. The RSI (14) has moved into the negative zone, indicating increased selling pressure. Additionally, the indicator has moved into the lower region of the upward trend that began on June 22. This could prolong the downward movement. The Chaikin Money Flow (CMF-20) remains in the positive ( ) zone; however, the decline in money inflows could push the CMF-20 indicator into the negative zone. If macroeconomic data continues to improve and positive developments in the ecosystem persist, the first major resistance level at $185.60 could be tested again. Conversely, in the event of negative news flow or deterioration in macroeconomic data, the $127.62 level could present a potential buying opportunity.
Support levels: 150.23 – 141.80 – 127.62
Resistance Levels: 162.99 – 185.60 – 209.39
DOGE/USDT
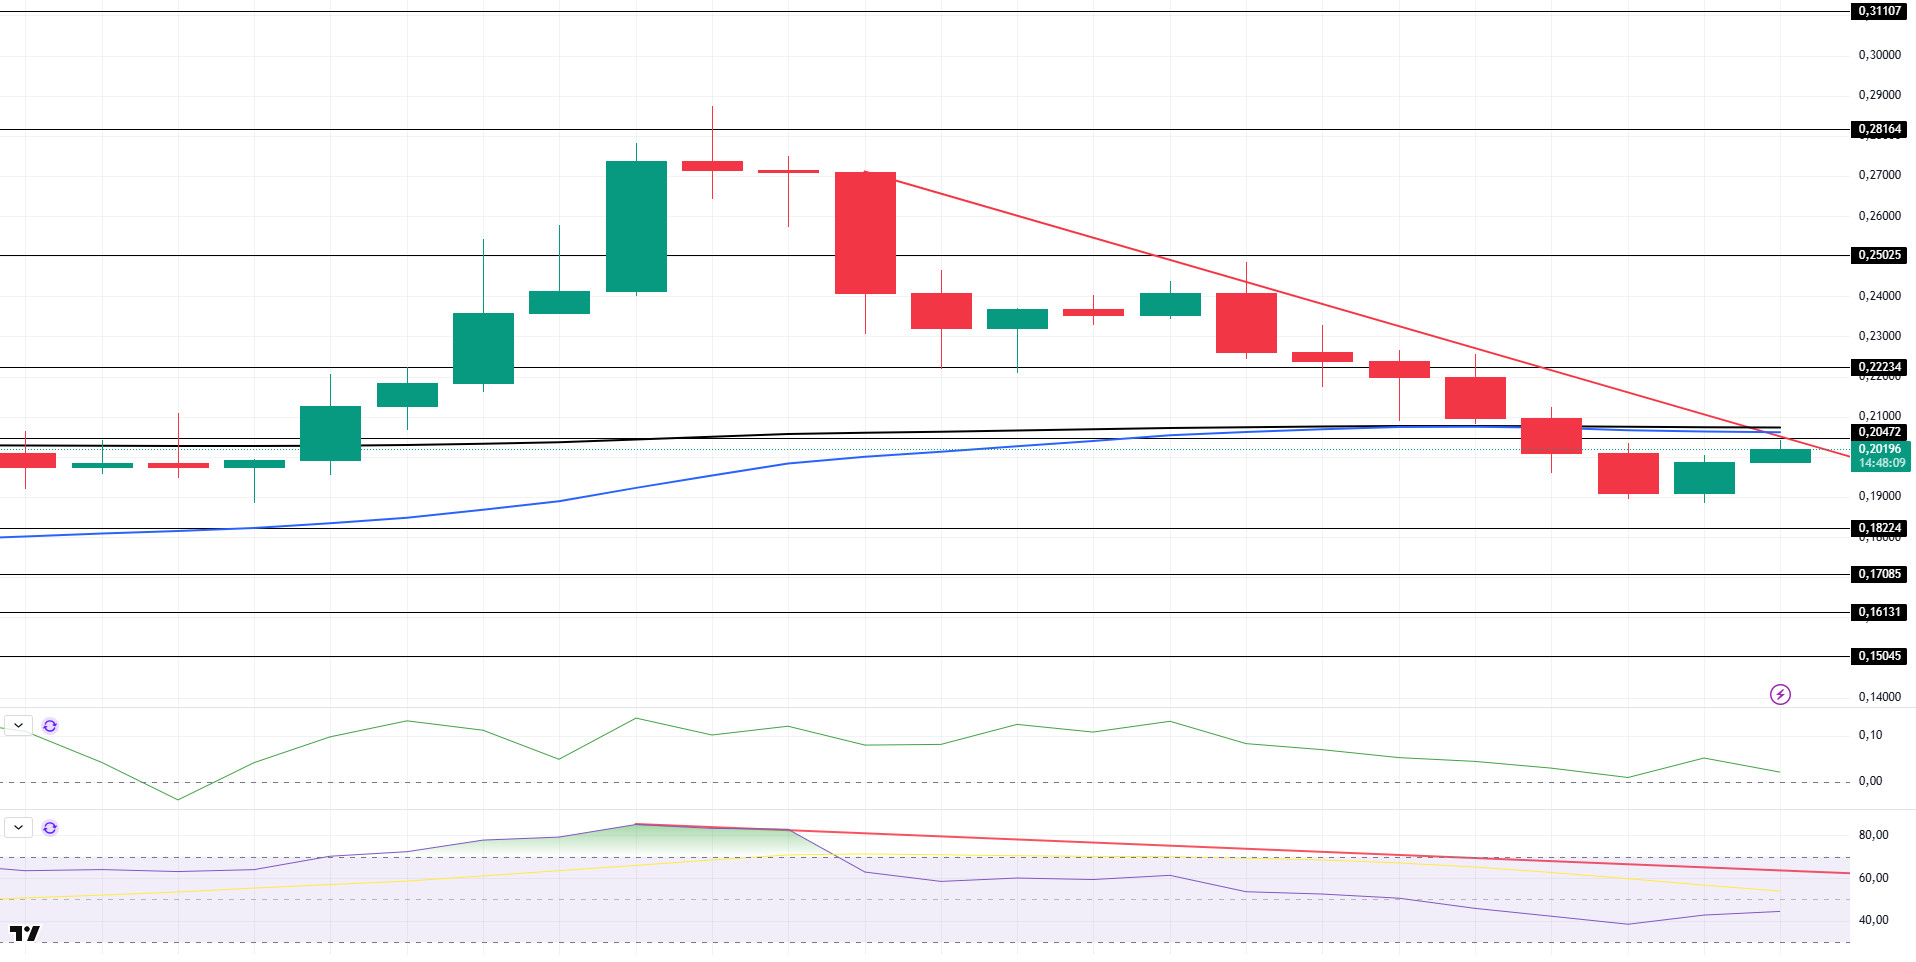
DOGE has experienced a decline of approximately 15.88% since last week on the daily chart. Testing the downtrend that began on July 23, the asset may test the $0.17085 level if it fails to break through this point. Additionally, the price is testing the 50 EMA (Blue Line) and 200 EMA (Black Line) moving averages as resistance levels here, appearing to have lost momentum. If it breaks through these resistance levels and gains upward momentum, the 0.22234 level could be targeted.
The asset began trading below the 50 EMA and 200 EMA moving averages. This indicates that the asset is in a downward trend. On the other hand, the 50 EMA remained below the 200 EMA, indicating that the “death cross” formation remains valid. This signals that downward pressure may continue in the medium term. The Chaikin Money Flow (CMF–20) indicator remains in the positive zone. However, money inflows continue to decline, which could push the CMF-20 into the negative zone. Looking at the Relative Strength Index (RSI-14) indicator, it has failed to hold above the overbought level and remains below the downward trend that has been in place since July 20. This could create a negative impact. In the event of macroeconomic risks or negative news from the ecosystem, the $0.15045 level could be monitored as a strong support level. On the other hand, if the upward movement towards $0.22234 gains momentum, the $0.22234 level will emerge as the first strong resistance level.
Support levels: 0.18224 – 0.17085 – 0.16131
Resistance Levels: 0.20472 – 0.22234 – 0.25025
TRX/USDT
Last week, with the minting of an additional 1 billion USDT on the Tron network, the total USDT supply on the network reached 82.7 billion dollars. Thus, Tron has maintained its position as the leading blockchain network in terms of USDT supply.
During the week of July 28–August 3, 2025, a total of 43 million TRX were burned on the TRON network. This reduced the circulating supply by 15.6 million. The decrease in circulating supply continues to exert deflationary pressure on TRX. Additionally, the total number of addresses increased by 1.4 million to reach 323.4 million during the same week.
Last week, the TRON network generated a total revenue of $94.3 million, increasing its revenue by approximately $5 million compared to the previous week and continuing to be the highest-revenue-generating ecosystem among all blockchain networks. This increase was driven by stablecoin transfers on the TRON network and user interactions in the DeFi sector.
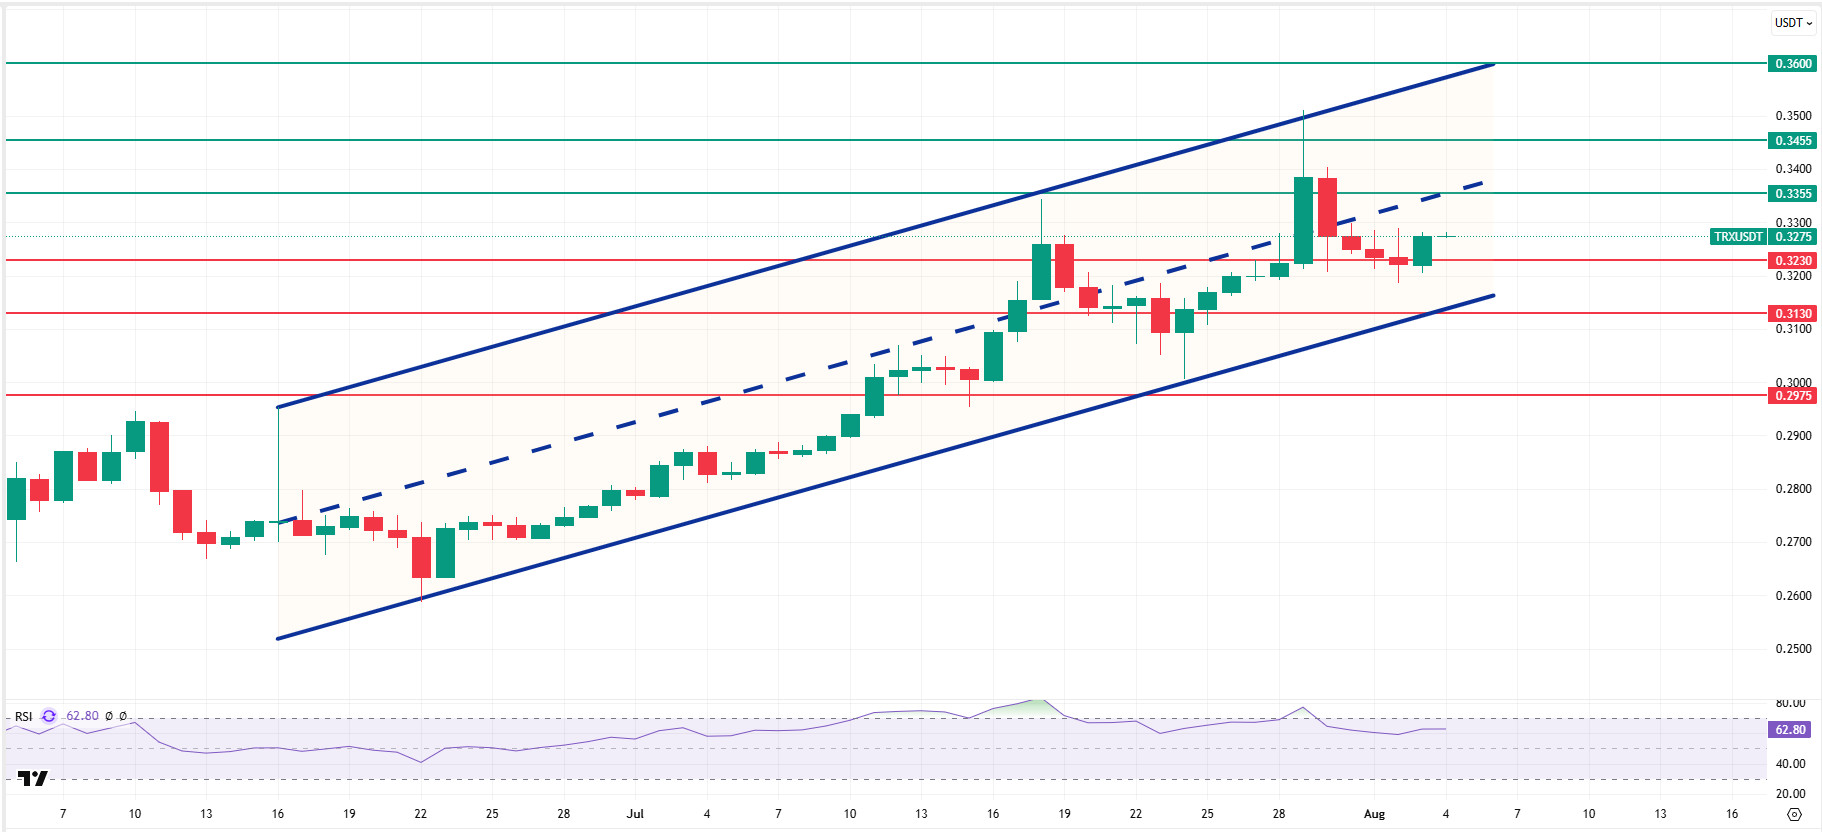
TRX started last week at 0.3200 and rose by approximately 2.5% throughout the week, closing at 0.3274. Thus, it closed its sixth consecutive week with an increase. Currently trading at 0.3275, TRX is in the middle band of the bullish channel on the daily chart. The Relative Strength Index (RSI) value is 62, very close to the overbought zone. TRX price is expected to rise slightly from these levels to the 0.3355 resistance level, then pull back and move towards the lower band of the bullish channel. In such a case, it may test the 0.3230 and 0.3130 support levels in succession. If it closes below the 0.3130 support level, it may test the 0.2975 support level . If it cannot close below the 0.3230 support level and a positive market sentiment emerges, it is expected to rise with potential buying activity in this area. In such a scenario, it could move toward the upper band of the bullish channel and test the resistance levels at 0.3355 and 0.3455. On the daily chart, 0.2975 is an important support level, and as long as it remains above this level, the upward momentum is expected to continue. A break below this support level could increase selling pressure.
Support levels: 0.3230 – 0.3130 – 0.2975
Resistance levels: 0.3355 – 0.3455 – 0.3600
AVAX/USDT
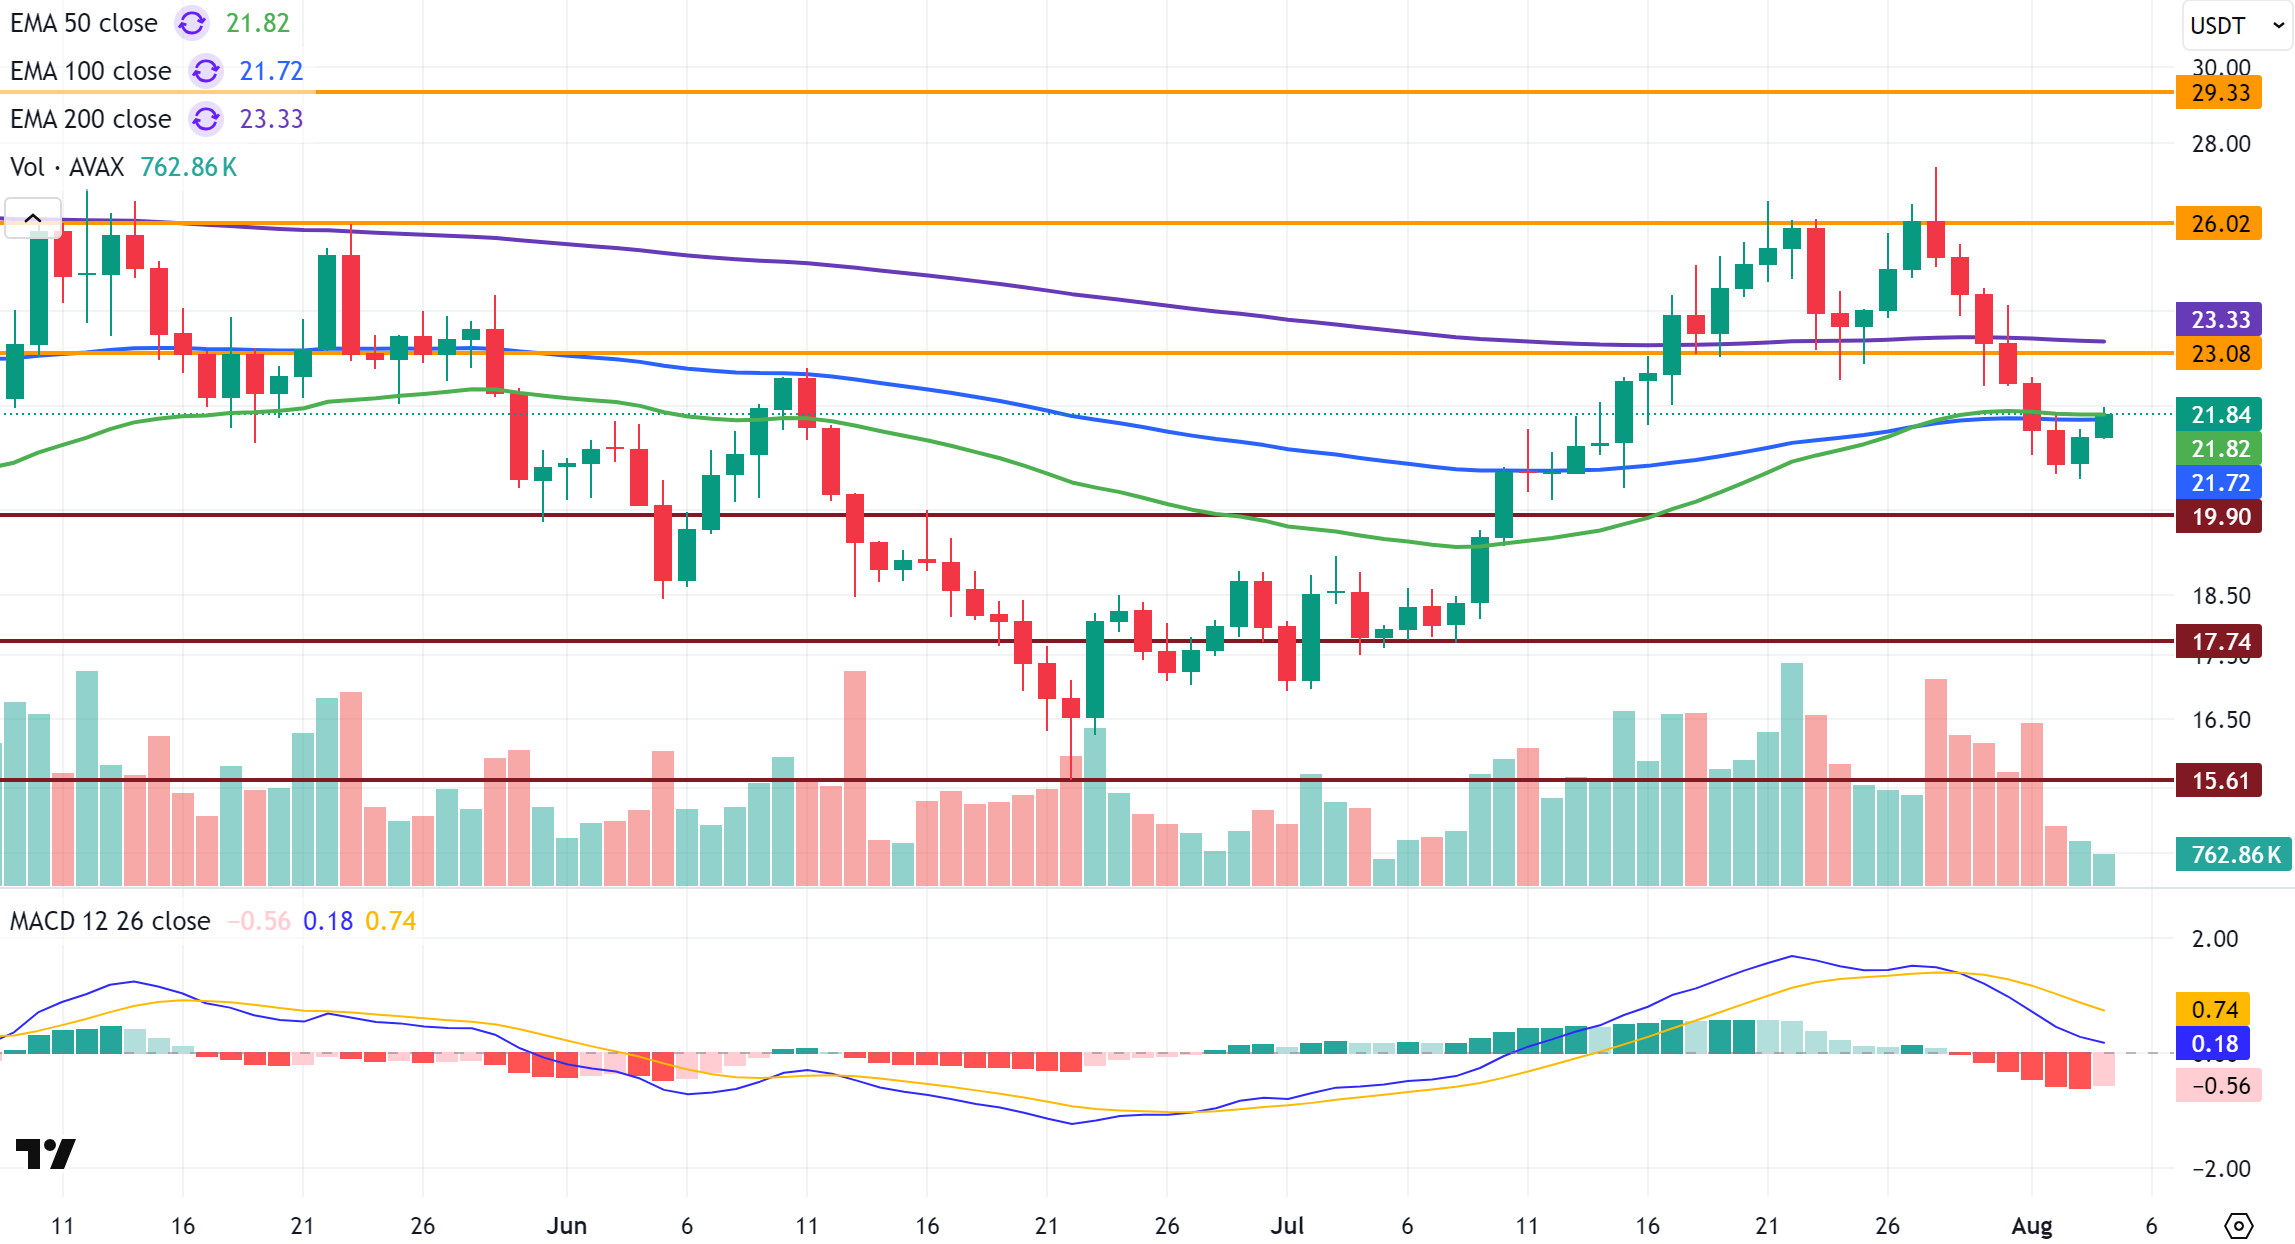
AVAX started last week at the $26 level and closed at $21.35, losing approximately 18% on a weekly basis. Unable to hold above $26.02 on the opening day of last week, AVAX entered a six-day downtrend. AVAX showed signs of recovery on the last day of the week and started the new week with an upward trend. On the daily chart, AVAX is testing the 50 and 100-period Exponential Moving Average (EMA) levels. Sustaining above these critical Exponential Moving Average (EMA) levels is important for the continuation of the upward trend.
When we examine the technical indicators on the daily chart, the Moving Average Convergence/Divergence (MACD) line fell below the signal line during the decline, producing a negative signal. Although the MACD is still in positive territory, its movement below the signal line indicates that there is no strong momentum. Additionally, AVAX fell below critical EMA levels during the decline, exacerbating negative momentum. Maintaining above these critical EMA levels is crucial for the continuation of the upward trend. This outlook suggests that the upward movement may remain limited for now and could face renewed downward pressure if strong buying does not materialize.
In the coming period, it is critical for AVAX to maintain stability above the EMA50 and EMA100 levels for the uptrend to continue. If stability is maintained above these levels and the uptrend continues, the EMA200 level at $23.08 will come to the fore. If these levels are broken upward, the $26.02 level could come back into focus as the main resistance. On the other hand, if AVAX cannot remain above the critical EMA levels of , and selling pressure increases again, the $19.90 level could be tested first. If this level is broken downward, the $17.74 level will come to the fore as the main support. In a deeper pullback, the decline could continue down to the 15.61 dollar level. Overall, maintaining above the critical EMA levels could create positive momentum for an upward move. Otherwise, selling pressure could resurface in the short term.
(EMA50: Green Line, EMA100: Blue Line, EMA200: Purple Line)
Support levels: 19.90 – 17.74 – 15.61
Resistance Levels: 23.08 – 26.02 – 29.33
SHIB/USDT
This week, the Shiba Inu (SHIB) ecosystem experienced a period of record-breaking effectiveness of supply-reducing mechanisms, accelerated whale accumulation, and notable steps taken by the community and infrastructure. On the Shibarium network, 70% of transaction fees continued to be converted to SHIB and burned. With the increase in network usage, the burn rate surged to approximately 370%, resulting in over 616,000,000 SHIB being removed from circulation throughout the week. Additionally, 602,000,000 SHIB were burned in a single day, marking the highest daily burn of the year with a 16,717% increase. This deflationary movement directly reduced the supply while sparking noticeable activity within the community. Meanwhile, on-chain data indicated that large investors were increasing their positions. The transfer of a total of 4,660,000,000,000 SHIB to large wallets in a short period of time revealed that whales are continuing their strategic accumulation process. SHIB reserves on centralized exchanges remained at 84,000,000,000,000, near the lowest levels of the year. This trend pointed to investors’ strategy of holding their assets for the long term. As the price dropped, the number of addresses in the red increased again, while the percentage of addresses in the green decreased significantly. One of the week’s notable developments was Shiba Inu’s celebration of its 5th anniversary. While symbolic, this marked an increase in confidence in the ecosystem. On the technological front, the impact of the Shibarium developer portal updates released last week was evident this week. New documentation, ranging from validator node setup to cross-chain bridge creation, began to be utilized by developers. Additionally, new tools such as ShibaSwap integration, Hardhat support, and Alpha Layer accelerated the application development process. The Shib Paymaster feature has improved the user experience by enabling applications to cover gas fees on behalf of users. Meanwhile, the Bury 2.0 update increased staking rewards and aimed to strengthen community engagement. The Shibarium network has consistently processed over 3,000,000 transactions daily, and the total number of user wallets continues to grow. All these developments demonstrate that Shiba Inu is continuing to grow beyond being just a token, evolving into a multi-layered and sustainable ecosystem, and taking steps toward decentralized AI integration in alignment with the ShibPaper vision.
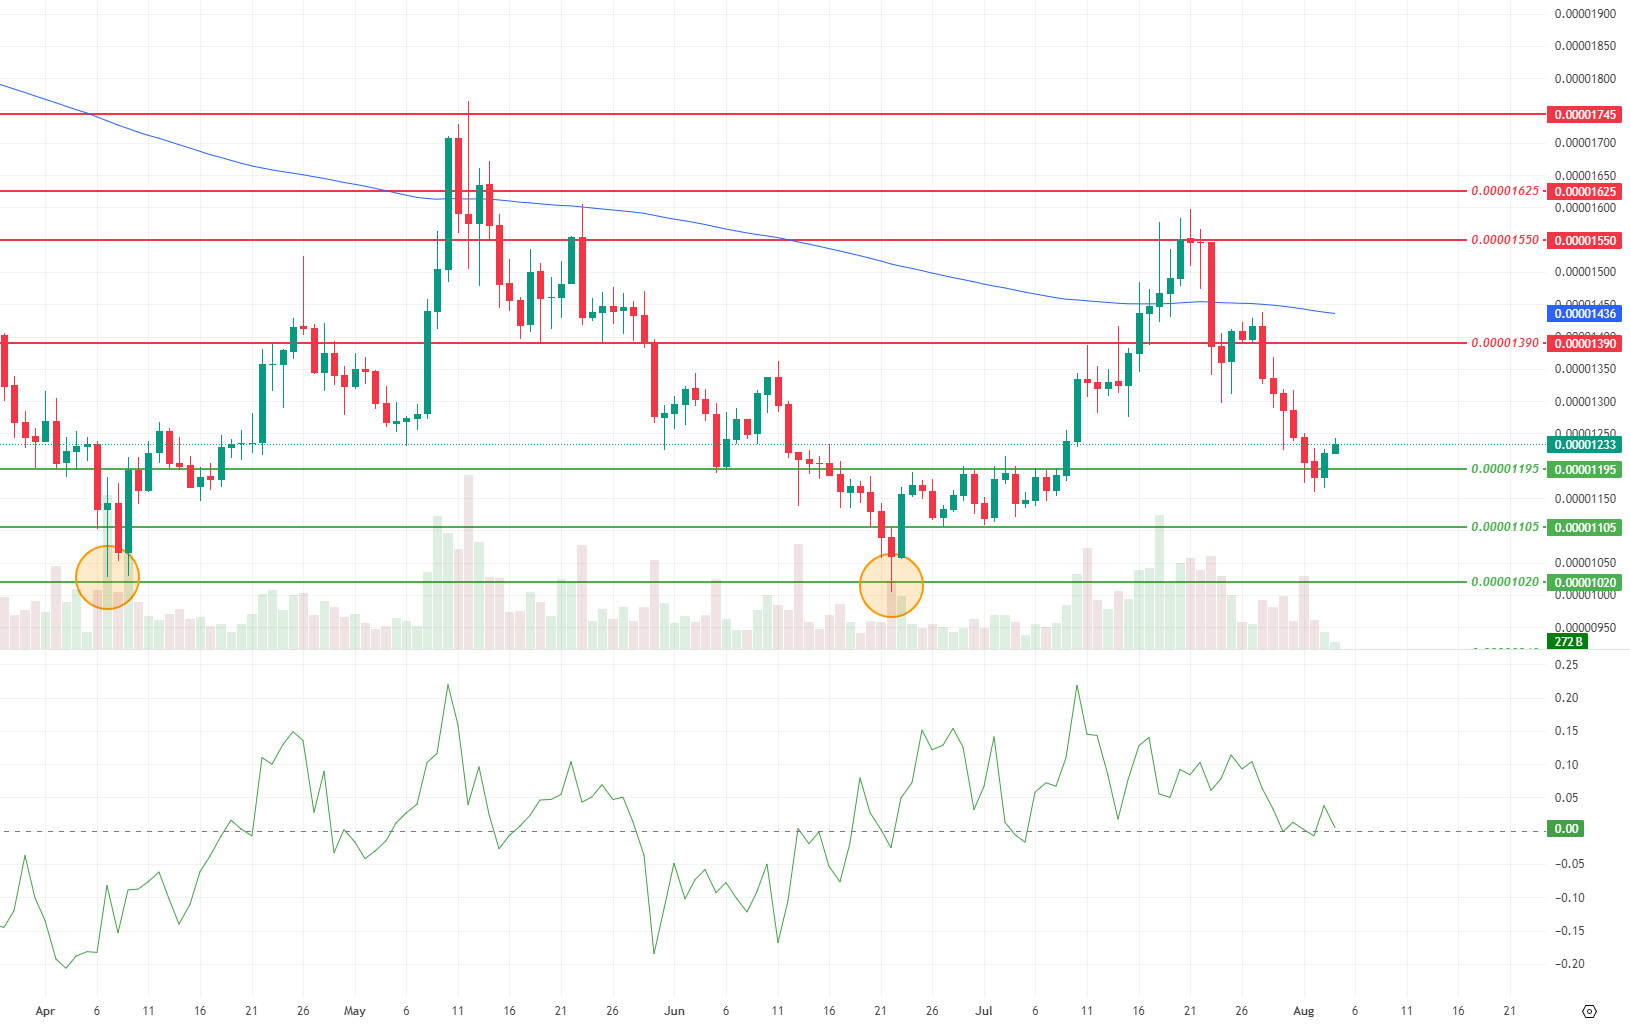
On the technical side, this week’s Shiba Inu price movement shows that the momentum of buyers has weakened further compared to last week, with a noticeable slowdown in indicators. The decline in momentum, trading volume, and volatility indicates that the influence of buyers in the market has weakened significantly and that the upward momentum has been further interrupted. The price falling below the support levels of $0.00001380 and $0.00001255 has led to increased downward pressure and a narrowing of the upward movement range in the short term. As a result of this selling pressure, the price retreated to the 0.00001195 dollar level and is currently attempting to stabilize around the 0.00001230 dollar level with buying activity from this level. During this process, the Chaikin Money Flow (CMF) oscillator has moved from last week’s positive zone to the 0 level, indicating that capital flow has shifted to a neutral outlook. Additionally, the price remaining below the EMA200 (Blue Line) level confirms the weakness in the medium-term technical outlook. As long as the current structure is maintained, the 0.00001195 dollar support level will retain its importance in the short term. Below this level, the 0.00001105 and 0.00001020 dollar levels will be monitored as support levels. On the upside, for the price to regain strength, it must first break above the 0.00001390 and then the 0.00001550 dollar levels. If these resistance levels are also broken, the 0.00001625 dollar level could emerge as the next significant resistance point.
Support levels: 0.00001195 – 0.00001105 – 0.00001020
Resistance levels: 0.00001390 – 0.00001550 – 0.00001625
LTC/USDT
Litecoin (LTC) ended last week with a 3.82% decline and started the new week at 110.39. During this period, LTC appreciated by 0.84% against Bitcoin, with a market value of approximately $8.44 billion and falling two places in the market ranking to 20th. In the futures market, there was a roughly 9% decrease in open positions compared to last week, while funding rates continued their positive trend.
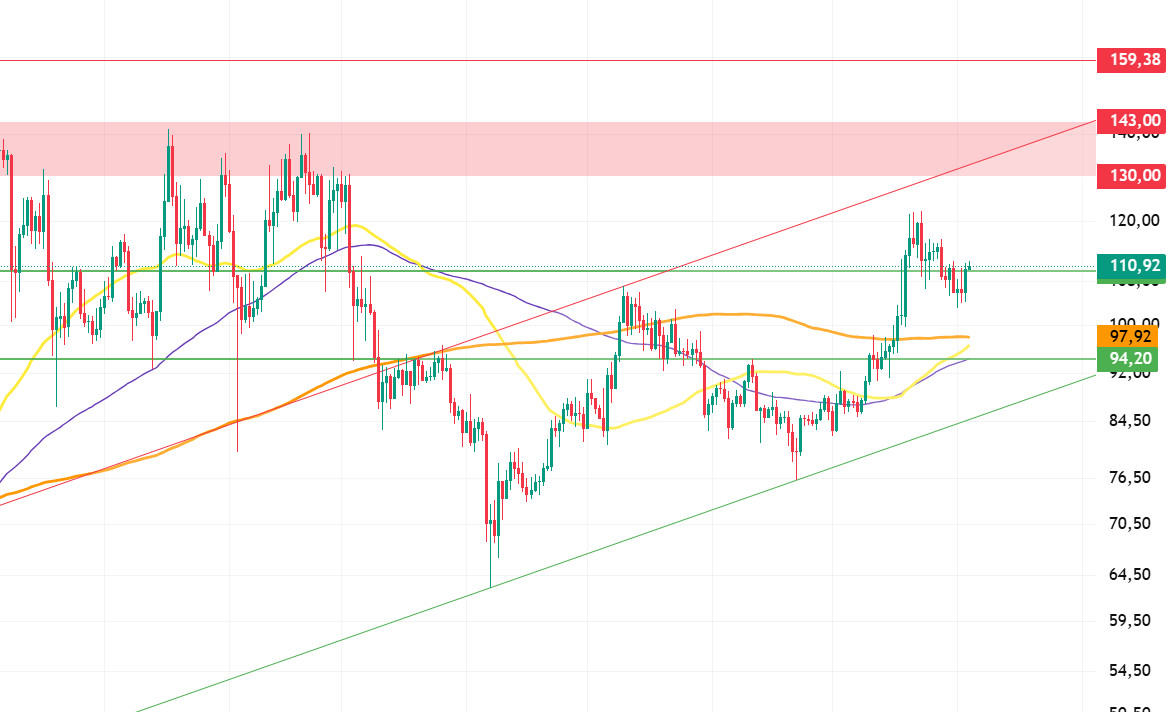
As of this week, Litecoin (LTC) is trading above all important short, medium, and long-term moving averages. The absence of any moving average forming dynamic resistance above the price indicates that the upward momentum is continuing. The first resistance zone to watch is the 130.00–143.00 range. This band is noteworthy both because it is an important resistance zone that has been tested and failed to break through for approximately eight weeks, and because it intersects with the upper band of the rising channel at the 130.00 level. Short-term sell-off reactions may be observed as the price approaches this region; however, a breakout would clearly shift the technical outlook in favor of the bulls. If this resistance zone is broken to the upside, the only remaining barrier ahead of the price would be the horizontal resistance at 159.38. With confirmation from RSI, volume, and trend indicators, price movements are expected to gain momentum following a breakout.
In the event of a pullback, the first strong support level is expected to be 110.00 as of this week. Below this level, the 200-day moving average at 97.92 can be monitored as an intermediate support level. In deeper correction scenarios, the horizontal support at the 94.20 level, along with the 50- and 100-day moving averages, which are quite close to each other, can be considered the strongest support zone. This zone forms a strong defense line both technically and psychologically.
Resistance levels: 130.00 – 143.00 – 159.38
Support levels: 110.00 – 97.92 – 94.20
LINK/USDT
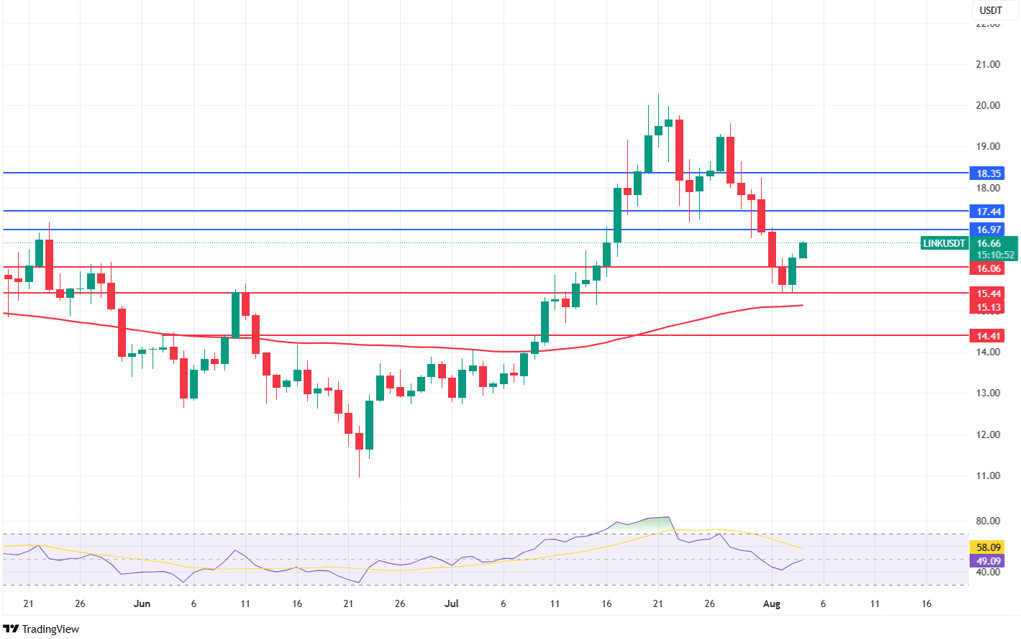
LINK experienced a sharp pullback after breaking below the 17-dollar level, which was the neckline of the double top formation of critical importance in technical analysis last week. The current area where the price is showing signs of recovery is the Fibonacci 0.50 retracement level of the upward movement that began on June 22. Sustaining above this level could potentially increase the price’s upward momentum. However, any declines below this level could expose the price to the risk of a pullback to below the 100-day moving average and then to the $14 region. In particular, staying below the 100-day moving average would be a strong signal that the medium-term uptrend is weakening.
The Relative Strength Index (RSI) indicator is currently moving in negative territory, reflecting weak momentum. If the price continues to remain below $17, it could support the RSI’s persistence in this weak zone and increase selling pressure. On the other hand, a daily close above $17 could signal a shift in both the technical structure and market psychology toward the positive. In this case, we may not expect the price to target the $18.30 and $20.00 resistance levels again.
Additionally, the observed decline in volume indicates that the market is in a state of indecision. This situation could lead to sharp price movements if a new breakout occurs, either upward or downward, supported by high volume. The 17 dollar level, which emerged as a support level last week, has now turned into a strong resistance level. As long as sustainability is not achieved above this level, downward risks will remain in the foreground.
Support levels: 16.06 – 15.44 – 14.41
Resistances: 16.97 – 17.44 – 18.35
BNB/USDT
This week, the TREE and TOWNS projects were listed on Binance Launchpool in the BNB ecosystem. These listings are expected to have a positive impact on the BNB price overall, as they are likely to increase demand for BNB used in transaction fees and reduce the circulating supply through BNB staking.
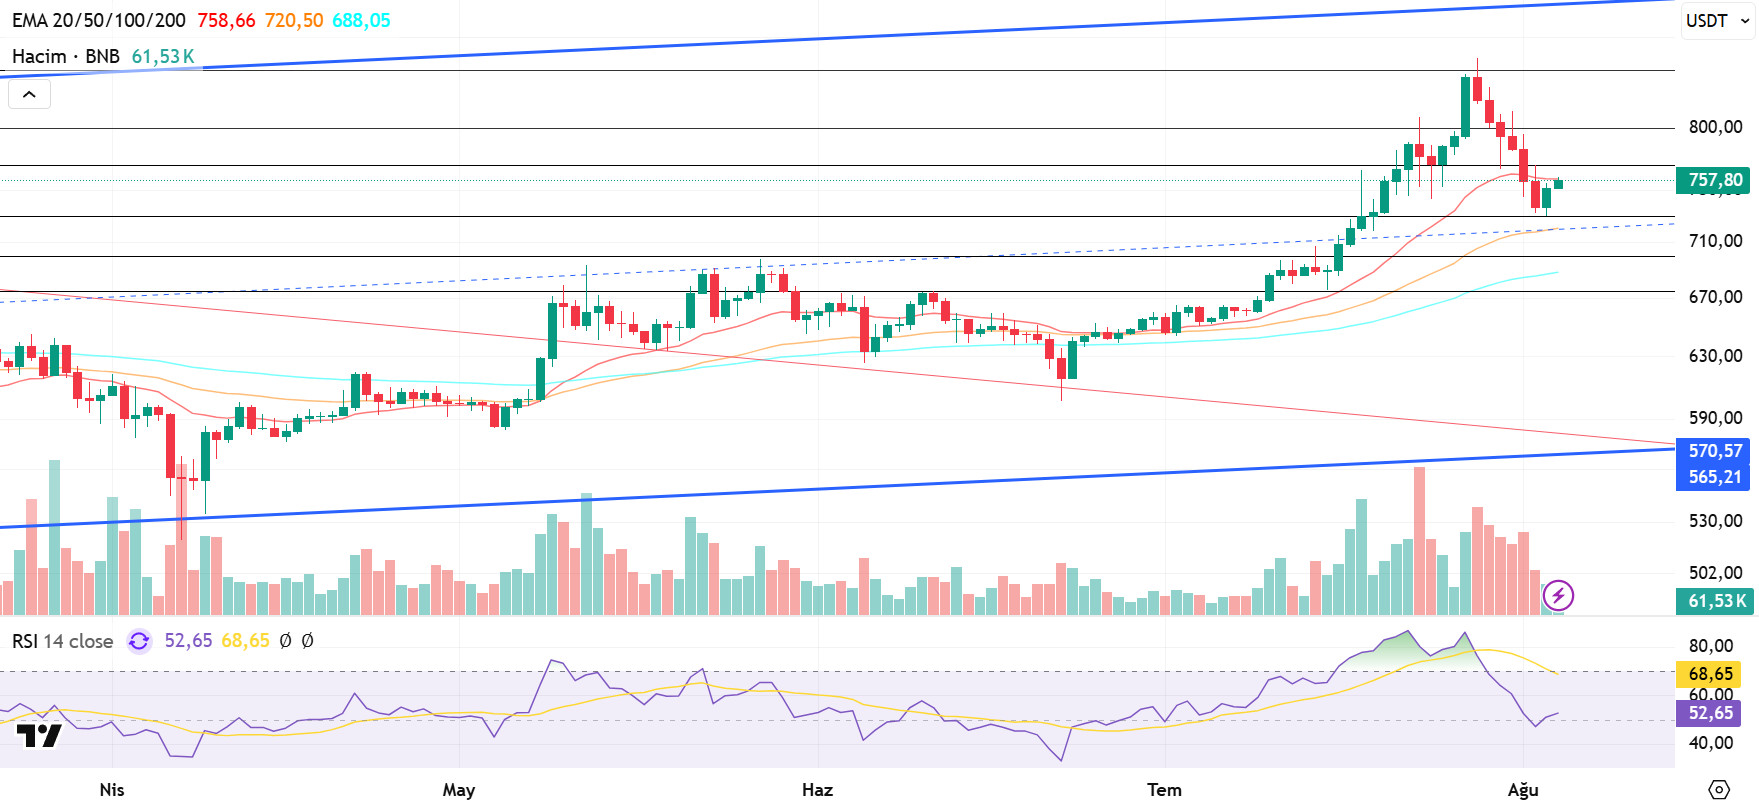
From a technical perspective, the general negative trend in the markets contributed to the pullback in the BNB/USDT pair last week, causing the price to drop to the $730 level. However, as the new week began, BNB started positively, trading above the $750 level and showing an upward trend, supported by the levels reached earlier.
Currently trading in the $730–770 range, technical indicators for the BNB/USDT pair show a negative trend in trading volume over the past week. This indicates an increase in selling appetite across the market. On the other hand, the Relative Strength Index (RSI) has fallen below the 50 level due to the recent pullback but has rebounded above the 50 level with the recovery seen in the new week. This technical structure indicates that negative trends remain dominant in the short term.
Within the current technical outlook, if the positive momentum continues, the BNB price is expected to test the $770 resistance level in the first stage. If this level is broken upward, the $800 and $850 levels will emerge as the next strong resistance zones. On the other hand, if the 760 dollar level is not broken and selling pressure increases, the price of is likely to return to the 730 dollar support level. If this support is broken downward, the 700 and 670 dollar levels should be monitored as the next critical support points.
Support levels: 730 – 700 – 670
Resistance levels: 770 – 800 – 850
SUI/USDT
The Sui (SUI) network started the new week quite strongly, supported by both technological updates and balancing factors in supply dynamics. Increased activity within the network, a steady rise in the number of users, and the rapidly expanding infrastructure of the ecosystem are making Sui’s medium- and long-term potential more visible every day. In particular, new integrations in decentralized finance (DeFi), NFTs, and gaming are diversifying the network’s use cases and strengthening its connection to real-world applications. These developments are fueling optimism among investors and market analysts about the project’s sustainable growth potential while also attracting institutional interest. In this context, the $500 million capital agreement announced by Mill City Ventures III stands out as a notable development. The fund will be used to support the Sui token strategy and shape long-term corporate treasury policies. As a result, SUI assets will begin to secure a more strategic position in large-scale investment portfolios. Meanwhile, improvements to the network’s technical infrastructure also offer an attractive framework for institutional investors. Advanced features such as ISO 20022 compliance, AI-integrated systems, and quantum-resistant encryption technologies position Sui as a blockchain network that is both regulation-compliant and future-ready. When all these factors are considered together, it can be said that SUI is sending strong signals that its growth trend will continue both technically and economically.
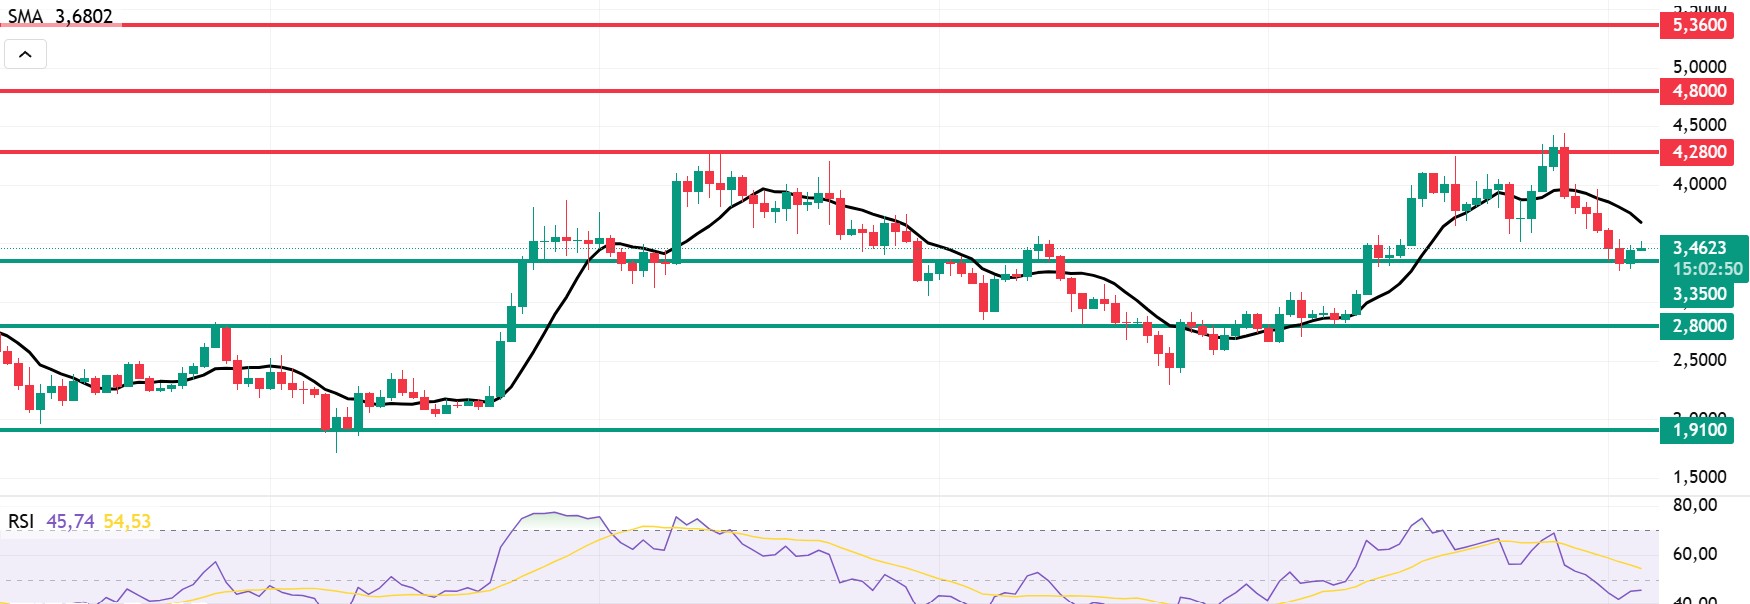
Following recent developments, when we look at Sui’s technical outlook, the price has fallen sharply on a weekly basis to around $3.46, influenced by fundamental developments. The Relative Strength Index (RSI) is currently in the 45.74–54.33 range. This value range indicates that the market is trading near the sell zone; a further decline in the RSI to the 35.00–40.00 range could signal a potential buy point. If the price moves upward, resistance levels of 4.28 – 4.80 – 5.36 dollars can be monitored. However, if the price retreats to new lows, this could indicate intensifying selling pressure. In such a scenario, 3.35 and 2.80 dollars emerge as strong support levels. Especially when considering the trend line, a pullback to 2.80 dollars is technically possible. According to Simple Moving Averages (SMA) data, Sui’s average price is currently at 3.68 dollars. If the price remains above this level, it could signal that the current upward trend could continue technically. The upward trend of the SMA also supports this scenario.
Support levels: 1.91 – 2.80 – 3.35
Resistance levels: 4.28 – 4.80 – 5.36
Legal Notice
The investment information, comments, and recommendations contained in this document do not constitute investment advisory services. Investment advisory services are provided by authorized institutions on a personal basis, taking into account the risk and return preferences of individuals. The comments and recommendations contained in this document are of a general nature. These recommendations may not be suitable for your financial situation and risk and return preferences. Therefore, making an investment decision based solely on the information contained in this document may not result in outcomes that align with your expectations.
