
October 13-20, 2025 – Darkex Weekly Technical Analysis Report
BTC/USDT
The global market agenda this week revolves around US-China relations, policy divergence at the Fed, and institutional Bitcoin movements. Despite announcing a 100% tariff on Chinese goods starting November 1, President Donald Trump attempted to de-escalate tensions by stating, “We want to help Beijing.” China’s Ministry of Commerce, however, called this move a “double standard” and signaled countermeasures. The White House announced that the government shutdown is costing the economy $150 billion per week, while permanent layoffs began in nine ministries. On the monetary policy front, differences of opinion among Fed members became apparent: Williams, Barr, Waller, and Milan supported gradual interest rate cuts, while Kashkari warned against early easing. On the corporate front, The Smarter Web Company, Remixpoint, and Exodus Movement increased their Bitcoin reserves; BlackRock continued its IBIT purchases for the seventh week, while Strategy CEO Michael Saylor took a short accumulation break.
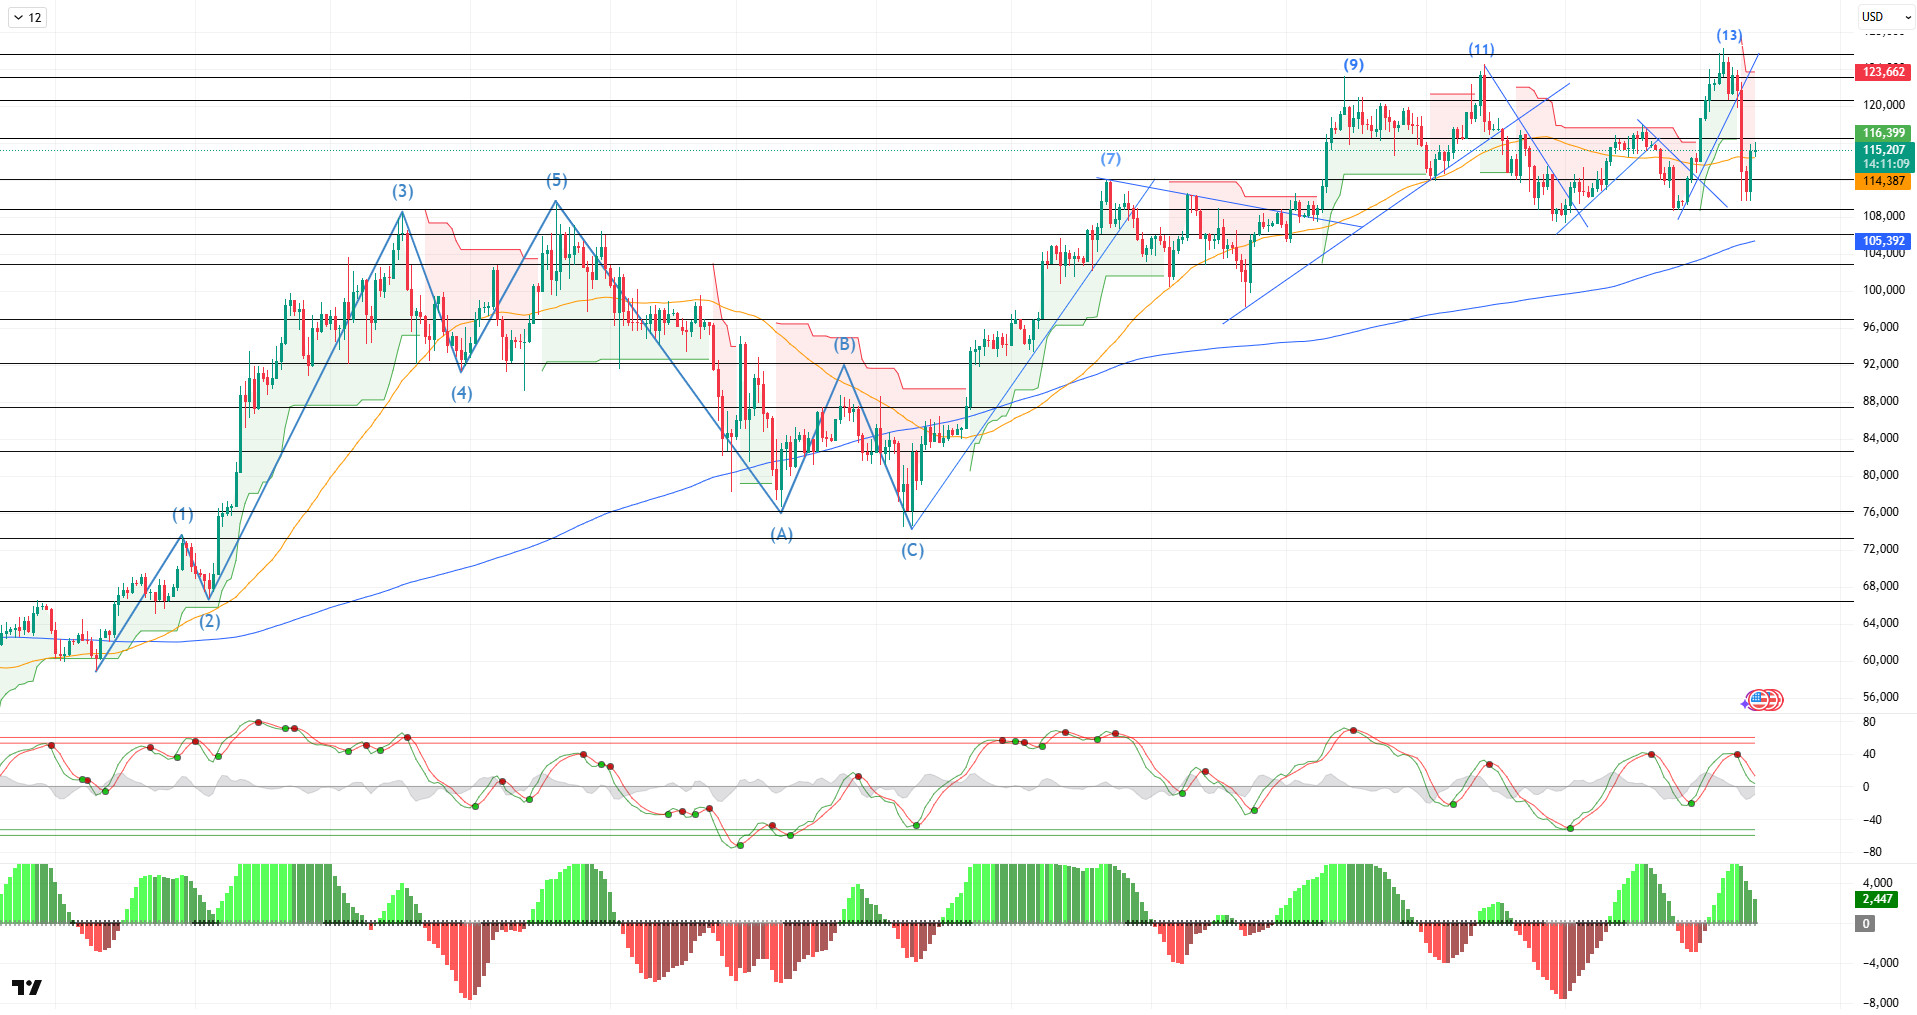
Following all these developments, looking at the daily technical outlook, BTC reached its 13th point with a golden cross formation and pushed its ATH level to 126,200. BTC consolidated in this region for a while but failed to hold on and made a sharp pullback to the 101,500 level. The price then quickly recovered and returned to the 115,000 level. BTC is set to close the week with a 6.80% decline, while its October return rate fell from 10% to 1.29%. After testing its ATH levels, BTC recorded an average pullback of 10% but managed to reach new highs each time.
Looking at technical indicators, the Wave Trend (WT) oscillator retreated to the middle band of the parallel channel, in line with the sell signal it gave on a daily basis. While the Squeeze Momentum (SM) indicator weakened within the positive zone, the golden cross pattern continues in the moving averages, with the 50-day SMA crossing above the 200-day SMA.
When examining weekly liquidity data, it is seen that the intensity of buy-side transactions was liquidated at the 117,000, 112,000, and 108,500 levels, while the intensity of sell-side transactions increased above the 120,000 level along with the decline.
In summary, the reduction in recession risk by US macro data, coupled with increased expectations for interest rate cuts, created a positive atmosphere in the markets. This was supported by the increase in institutional interest seen in ETF data and paved the way for BTC to test a new all-time high (ATH) as a result of optimistic pricing in October. However, with tariffs back on the agenda, the market experienced a sharp correction. Technically, BTC has recorded an average 10% pullback after each new peak attempt. Furthermore, liquidity data has emerged as a factor deepening these pullbacks. Looking ahead, the price needs to permanently regain reference levels to move toward ATH levels again. Specifically, sustaining above $115,000 could support the price moving toward the $120,500 level. Breaking above this level could be critical for new peak attempts. Conversely, closing below $115,000 could create renewed selling pressure on the price and increase the likelihood of a pullback towards the $110,000 level.
Supports: 115,000 – 112,500 – 110,000
Resistances: 118,000 – 120,500 – 123,300
ETH/USDT
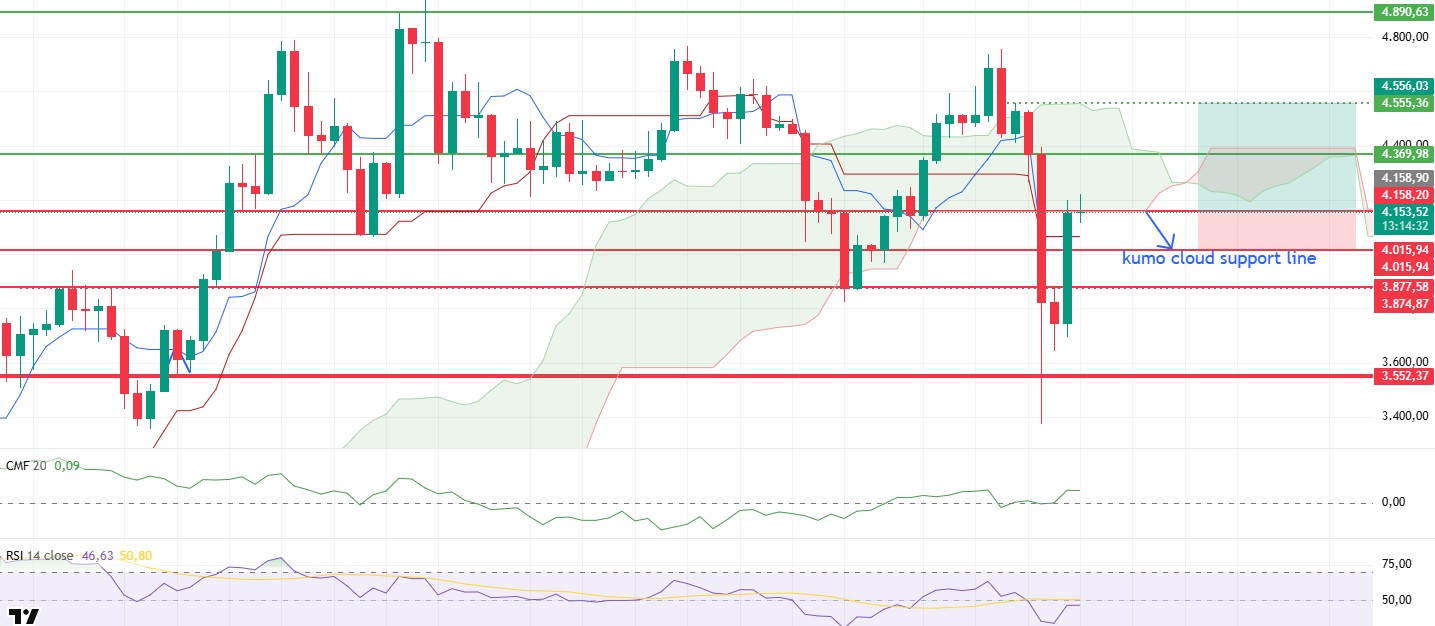
Last week, the price of Ethereum was quite volatile due to US President Donald Trump’s tariff announcements against China and the positive messages that followed. Starting with a sharp decline from the $4,747 level, the price fell back to the $3,300 region. Following the subsequent recovery wave, ETH rose again and is currently trading around $4,150, at the lower band of the Kumo cloud. This movement shows that the market reacted strongly to both macro developments and technical limit zones.
Despite these sharp fluctuations in price, the lack of significant change in CME futures contracts and the Ethereum Total Value Staked (TVS) indicator suggests that investors maintain their long-term confidence. Institutional investors largely holding their positions steady indicates that strategic confidence in the Ethereum ecosystem persists despite short-term volatility.
On the fundamentals side, Ethereum developers’ new project Kohaku stands out as a noteworthy step for the ecosystem’s future. Announced by Ethereum Foundation coordinator Nicolas Consigny, Kohaku offers a modular software development framework aimed at enhancing wallet privacy and security for advanced users. Developed in collaboration with key teams such as Ambire, Railgun, DeFi Wonderland, Helios, and Oblivious Labs, the project encourages developer participation with its open-source structure. The first release is expected to be a browser extension based on the Ambire wallet.
Technical indicators generally show that the positive trend is being maintained. The fact that the price has not yet lost the lower band of the Ichimoku cloud and remains above the Tenkan and Kijun levels confirms that the main trend is still upward. Furthermore, the Tenkan line staying above the Kijun continues to support the short-term positive outlook. This structure suggests that the market is currently pricing declines as corrections.
The Chaikin Money Flow (CMF) indicator sharply moving up from the region near the zero line reveals that liquidity inflows have resumed in the market and buyers are gaining strength. The CMF’s tendency to move into positive territory can be considered important data supporting the bullish scenario.
The Relative Strength Index (RSI) indicator’s recovery from oversold levels and upward momentum indicates that a healthy foundation for prices is forming and that momentum is beginning to gain strength. The RSI’s approach towards the 50 level signals that the potential for recovery in the short term may increase.
The $4,015 support level is critically important in the technical outlook. Maintaining this level will be decisive for the price to regain upward momentum. If this region is maintained with the support of the lower band of the Kumo cloud, the ETH price is expected to rise to the $4,555 level as the first target. This region is positioned as both a short-term resistance and a threshold for restoring market confidence. However, closes below the $4,015 level could increase selling pressure, leading the price to retest the $3,552 support. In this scenario, short-term momentum may weaken, but current indicators have not yet confirmed such a breakdown.
Supports: 4,015 – 3,877 – 3,552
Resistances: 4,158 – 4,369 – 4,555
XRP/USDT
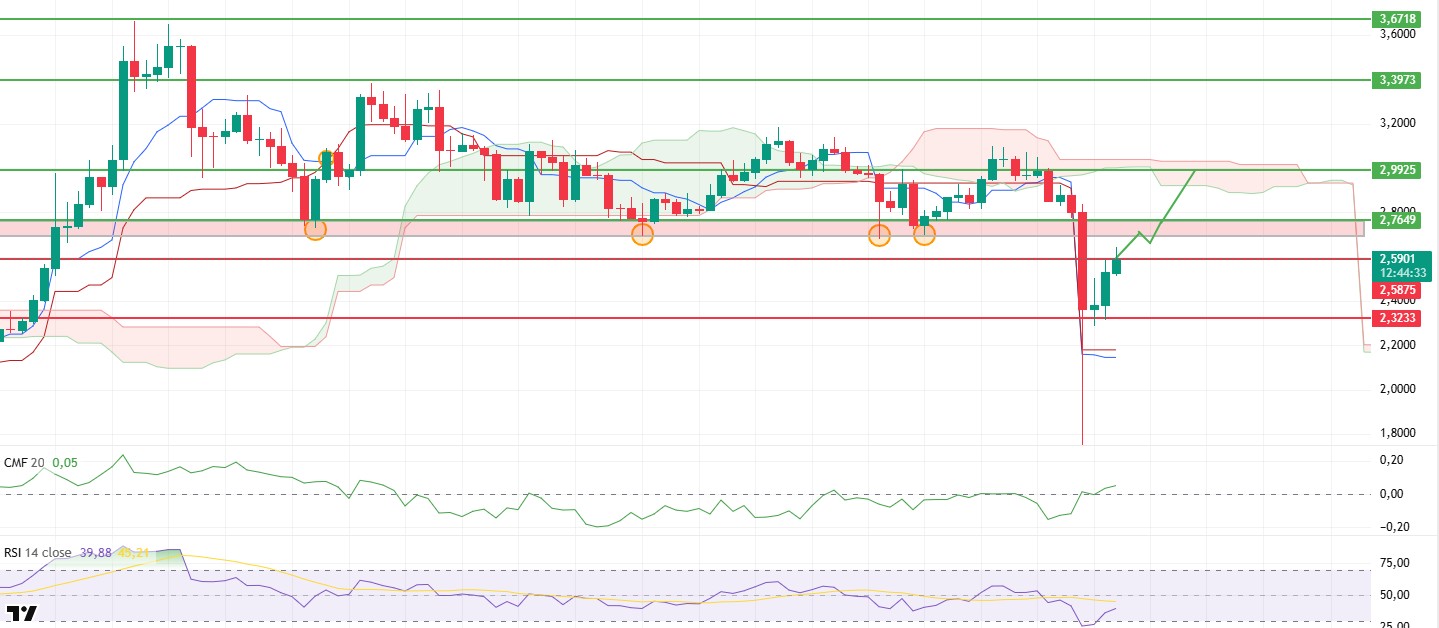
Last week, the XRP price experienced significant volatility due to US President Donald Trump’s tariff announcements targeting China and the subsequent conciliatory messages that followed. During the intense selling pressure across the market, the price fell to the $1.25 level, leaving a strong pin, then quickly recovered with heavy buying, rising above the $2.60 level. This movement reflected a period of high volatility in the market, with both panic selling and strong rebound buying occurring simultaneously.
The Chaikin Money Flow (CMF) indicator moved distinctly into positive territory during this process. This outlook confirms that there are heavy liquidity inflows into the market and that the buyers are regaining strength. The reversal of the long-standing weak capital flow signals that there is a more solid foundation behind the upward movement. If the CMF continues to remain in positive territory, it could create a strong foundation for the sustainability of the upward momentum.
The Relative Strength Index (RSI) indicator’s upward acceleration after exiting the oversold zone shows that momentum is recovering and the uptrend is gaining strength in the short term. The RSI approaching the 50 level supports the idea that buyers are starting to increase their control of the market and that the upward movement may continue.
On the Ichimoku indicator side, the price is still below the kumo cloud, revealing that the overall trend is negative in the medium term. However, the price holding near the lower band of the cloud indicates that the search for direction continues in the short term and that a possible recovery is on the table. The retest of the Tenkan and Kijun levels creates a critical threshold for the continuation of the uptrend.
In the technical outlook, the $2.76 level, indicated as the red area on the chart, is the most important resistance level in the short term. If the price breaks above this level, it will be a strong signal for the resumption of the positive trend. In this case, the first target for the uptrend could be the $2.99 band. On the downside, the $2.32 level stands out as a strong support zone. Maintaining this level is critical for the short-term bullish scenario to remain valid. Overall, the XRP price has entered a strong recovery phase after a sharp decline. The CMF indicator remaining in positive territory and the RSI’s upward movement confirm that buyers are returning to the market and that the short-term upside potential is increasing. However, for the uptrend to be technically confirmed, the price needs to break above the $2.76 resistance level and establish sustainability there. Until this condition is met, the price may continue to consolidate around the $2.32 support level.
Supports: 2.5875 – 2.3233 – 2.0000
Resistances: 2.7649 – 2.9925 – 3.3973
SOL/USDT
Last week in the Solana ecosystem:
- Forward Industries, listed on Nasdaq, launched an enterprise-level validator node on the Solana blockchain.
- Bitwise updated its Solana fund application to include “Staking” and set a low sponsorship fee of 0.20%.
- DeFi Development Corp. announced a strategic partnership with Superteam Japan to launch DFDV Japan (DFDV JP), the country’s first Solana-focused treasury initiative.
- Grayscale filed a Solana ETF with a 0.35% commission.
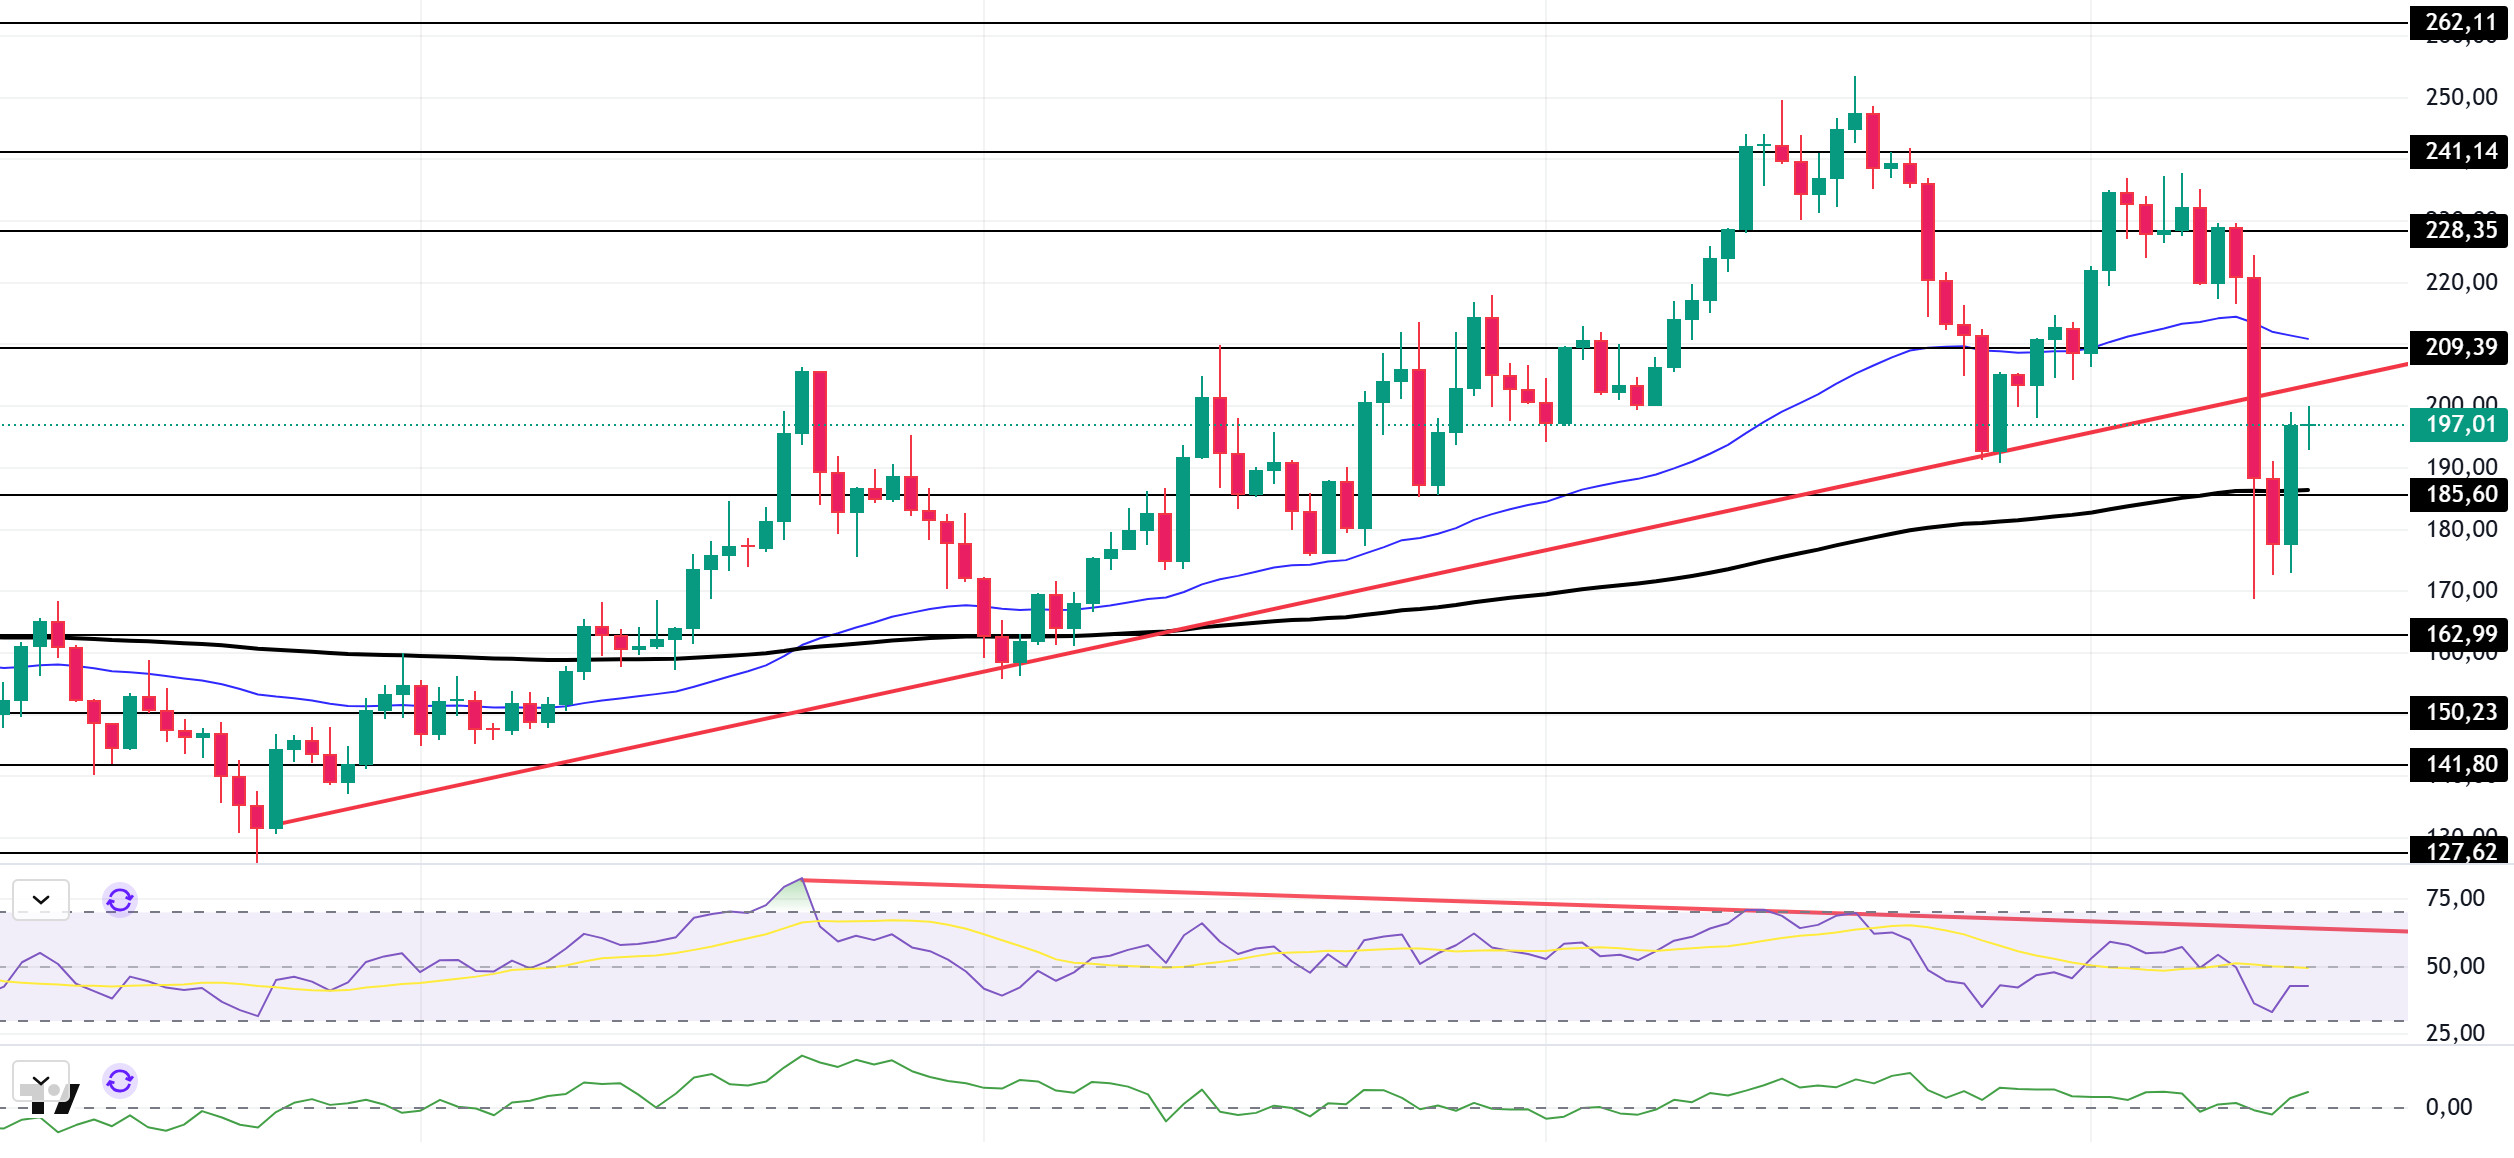
The SOL price showed a drop of approximately 16% on the daily chart this week. The asset moved into the lower region of the rising trend that began on June 23. Breaking the base level of the rising trend with a strong candle, the price experienced a pullback to the 200 EMA (Black Line) moving average and the strong support level of $185.60. The price then found support at this level and rose above the 200 EMA moving average. Currently testing the rising trend line, which is a strong resistance level, the price could test the $209.39 level if the uptrend continues. If a pullback begins, the $162.99 level should be monitored.
The asset is trading between the 50 EMA (Exponential Moving Average – Blue Line) and 200 EMA (Black Line) moving averages; this indicates that the asset is in a decision phase. Furthermore, the 50 EMA continuing to sit above the 200 EMA signals the continuation of a technical “golden cross” formation. This indicates that the potential for an uptrend in the medium term remains intact. The RSI (14) has retreated from positive territory to the middle of negative territory. At the same time, the indicator remained below the downward trend line that began on July 22. This indicates that selling pressure continues. The Chaikin Money Flow (CMF-20) remains in positive territory; however, a decrease in money inflows could push the CMF-20 indicator into negative territory. If macroeconomic data remains positive and developments in the ecosystem continue to be favorable, the first major resistance level of $228.35 could be retested. Conversely, in the event of potential negative news flow or deterioration in macro data, the $162.99 level could be monitored as a potential buying opportunity.
Supports: 185.60 – 162.99 – 150.23
Resistances: 209.39 – 228.35 – 241.14
DOGE/USDT
Bitwise filed an updated version of its Dogecoin ETF. Microsoft began accepting Dogecoin for certain digital services.
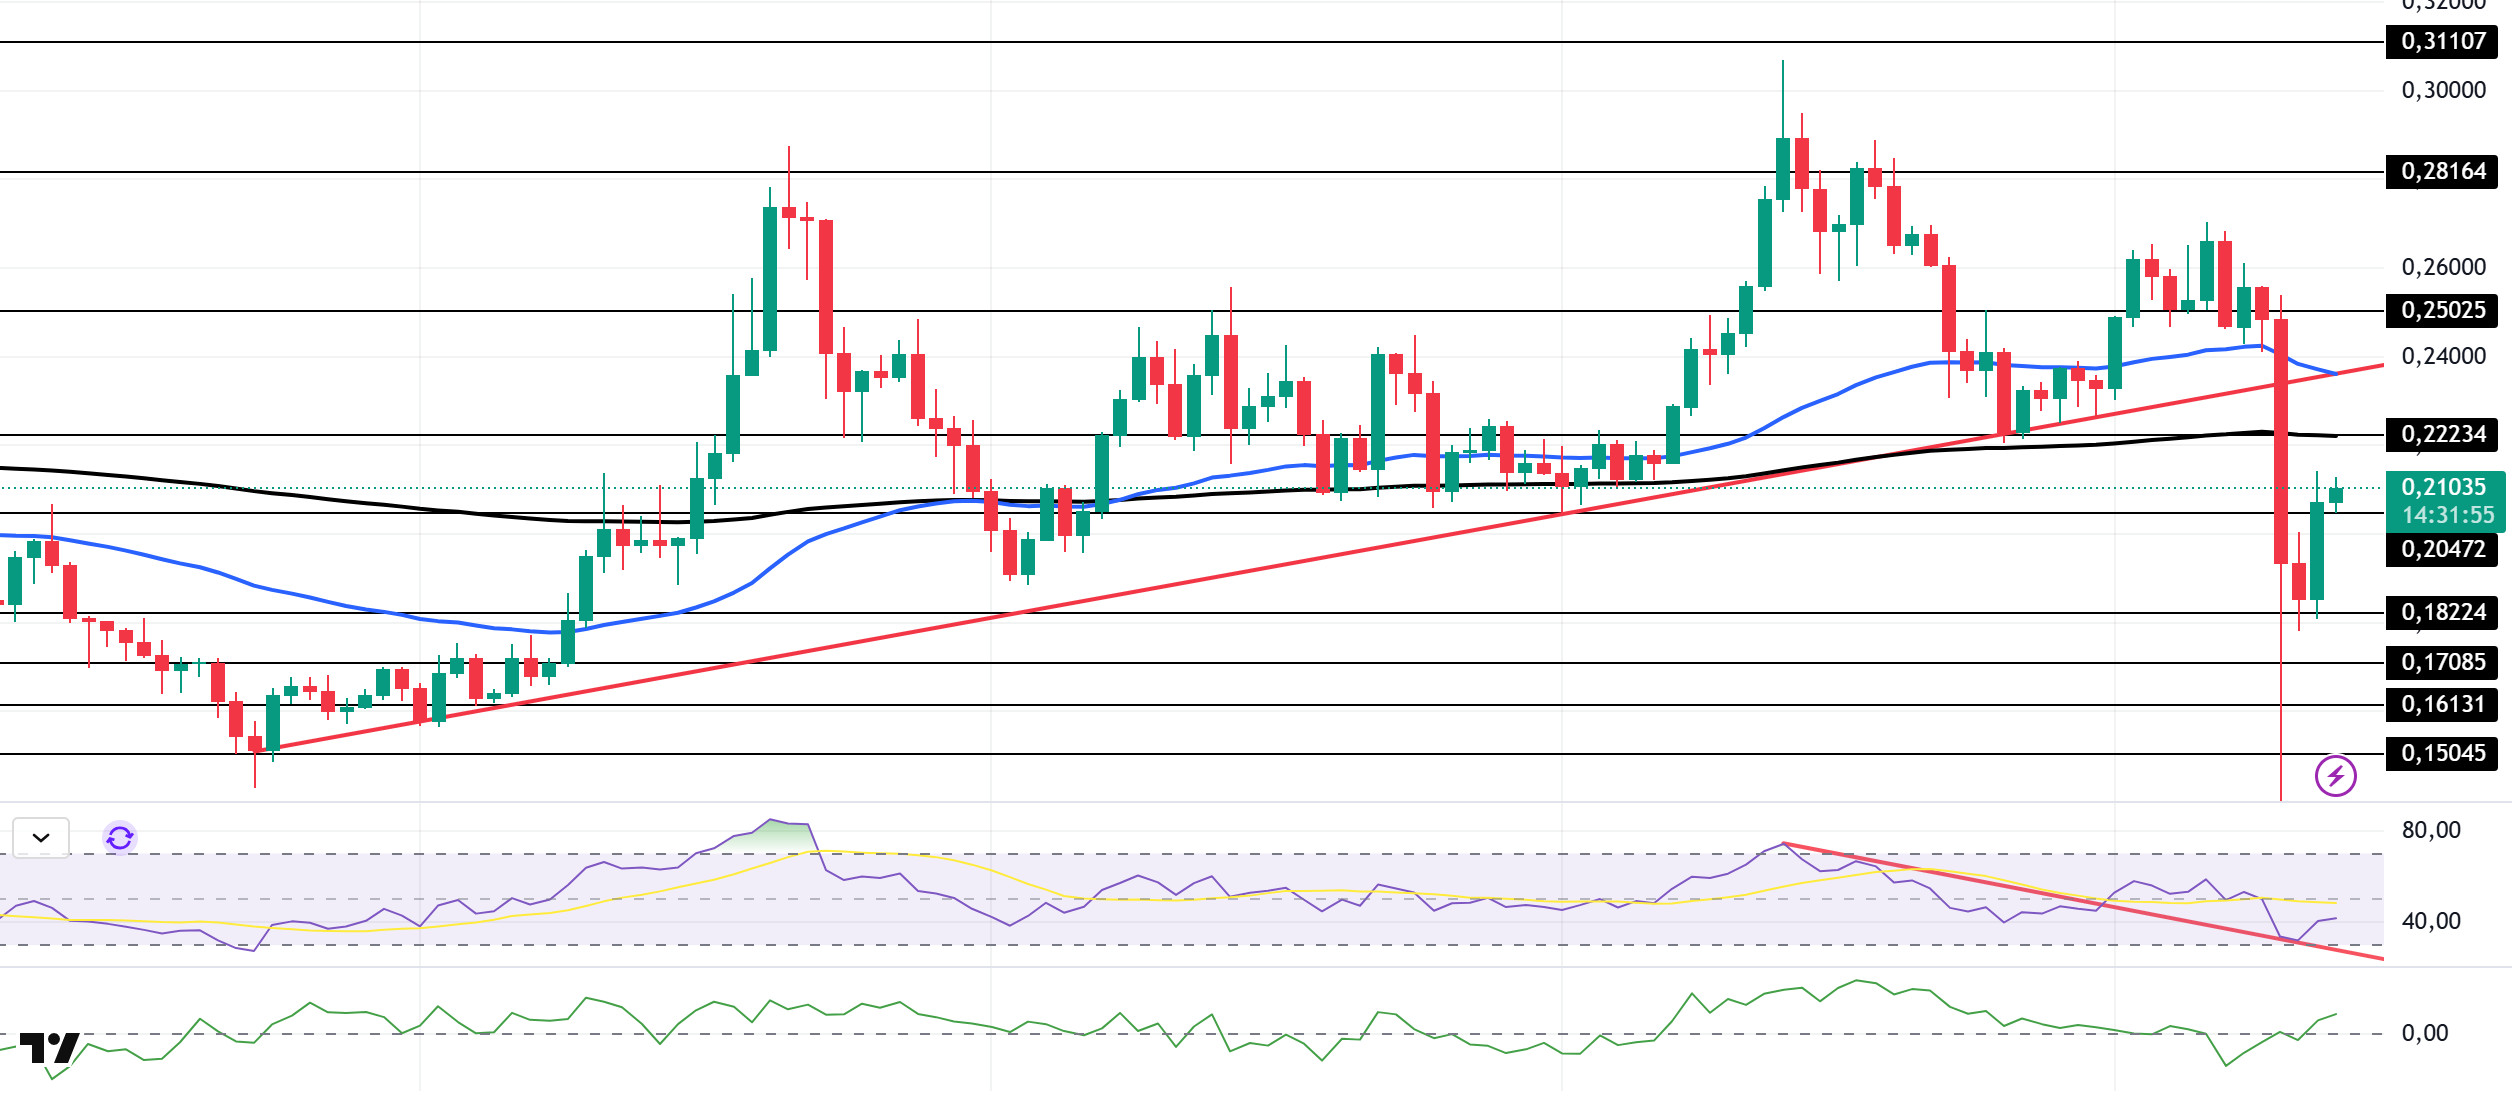
On the daily chart, DOGE has fallen approximately 21% since last week. Testing the strong support level of $0.25025 and the rising trend that began on June 22 as support, the price failed to maintain its momentum by breaking below this level and began trading below these levels. Currently experiencing an uptrend, the asset is preparing to test the 200 EMA (Black Line) and the $0.22234 level as resistance. In the event of a pullback, the $0.15045 level could be monitored.
The asset began trading below the 50 EMA (Blue Line) and 200 EMA (Exponential Moving Average – Black Line) moving averages. This indicates that the asset is trending downward. On the other hand, the 50 EMA continues to remain above the 200 EMA, indicating that the “golden cross” formation is continuing. This also signals that upward pressure may continue in the medium term. The Chaikin Money Flow (CMF–20) indicator has moved into positive territory. Money inflows, however, continue to decline. This could push the CMF-20 back into negative territory. Looking at the Relative Strength Index (RSI-14) indicator, we see a pullback from positive territory to the mid-level of negative territory. At the same time, it has gained momentum by finding support from the downtrend that has been ongoing since September 13. This indicates that buying pressure is forming. In the event of macroeconomic risks or negative news from the ecosystem, the $0.15045 level can be monitored as strong support. On the other hand, if the upward movement gains strength, the $0.22234 level comes to the fore as the first strong resistance level.
Supports: 0.20472 – 0.18224 – 0.17085
Resistances: 0.22234 – 0.25025 – 0.28164
TRX/USDT
S&P announced the launch of a new index that includes 15 crypto assets and 35 crypto-related stocks. TRON has been included in this index, joining the crypto assets represented in the institutional investment index structure. This development is significant in terms of TRON’s market representation and institutional recognition.
Last week, the TRON network generated a total of $55.2 million in revenue, increasing its revenue by $0.3 million compared to the previous week and continuing to be the highest-grossing ecosystem among all blockchain networks. This continued positive momentum in TRON’s revenues strengthens the network’s dominance in the DeFi and stablecoin ecosystems.
During the week of October 6-12, 2025, a total of 28.7 million TRX were burned on the TRON network. This reduced the circulating supply by 1.3 million. The decrease in circulating supply creates deflationary pressure on TRX. Additionally, the total number of addresses increased by 1.6 million to 338.3 million during the same week.
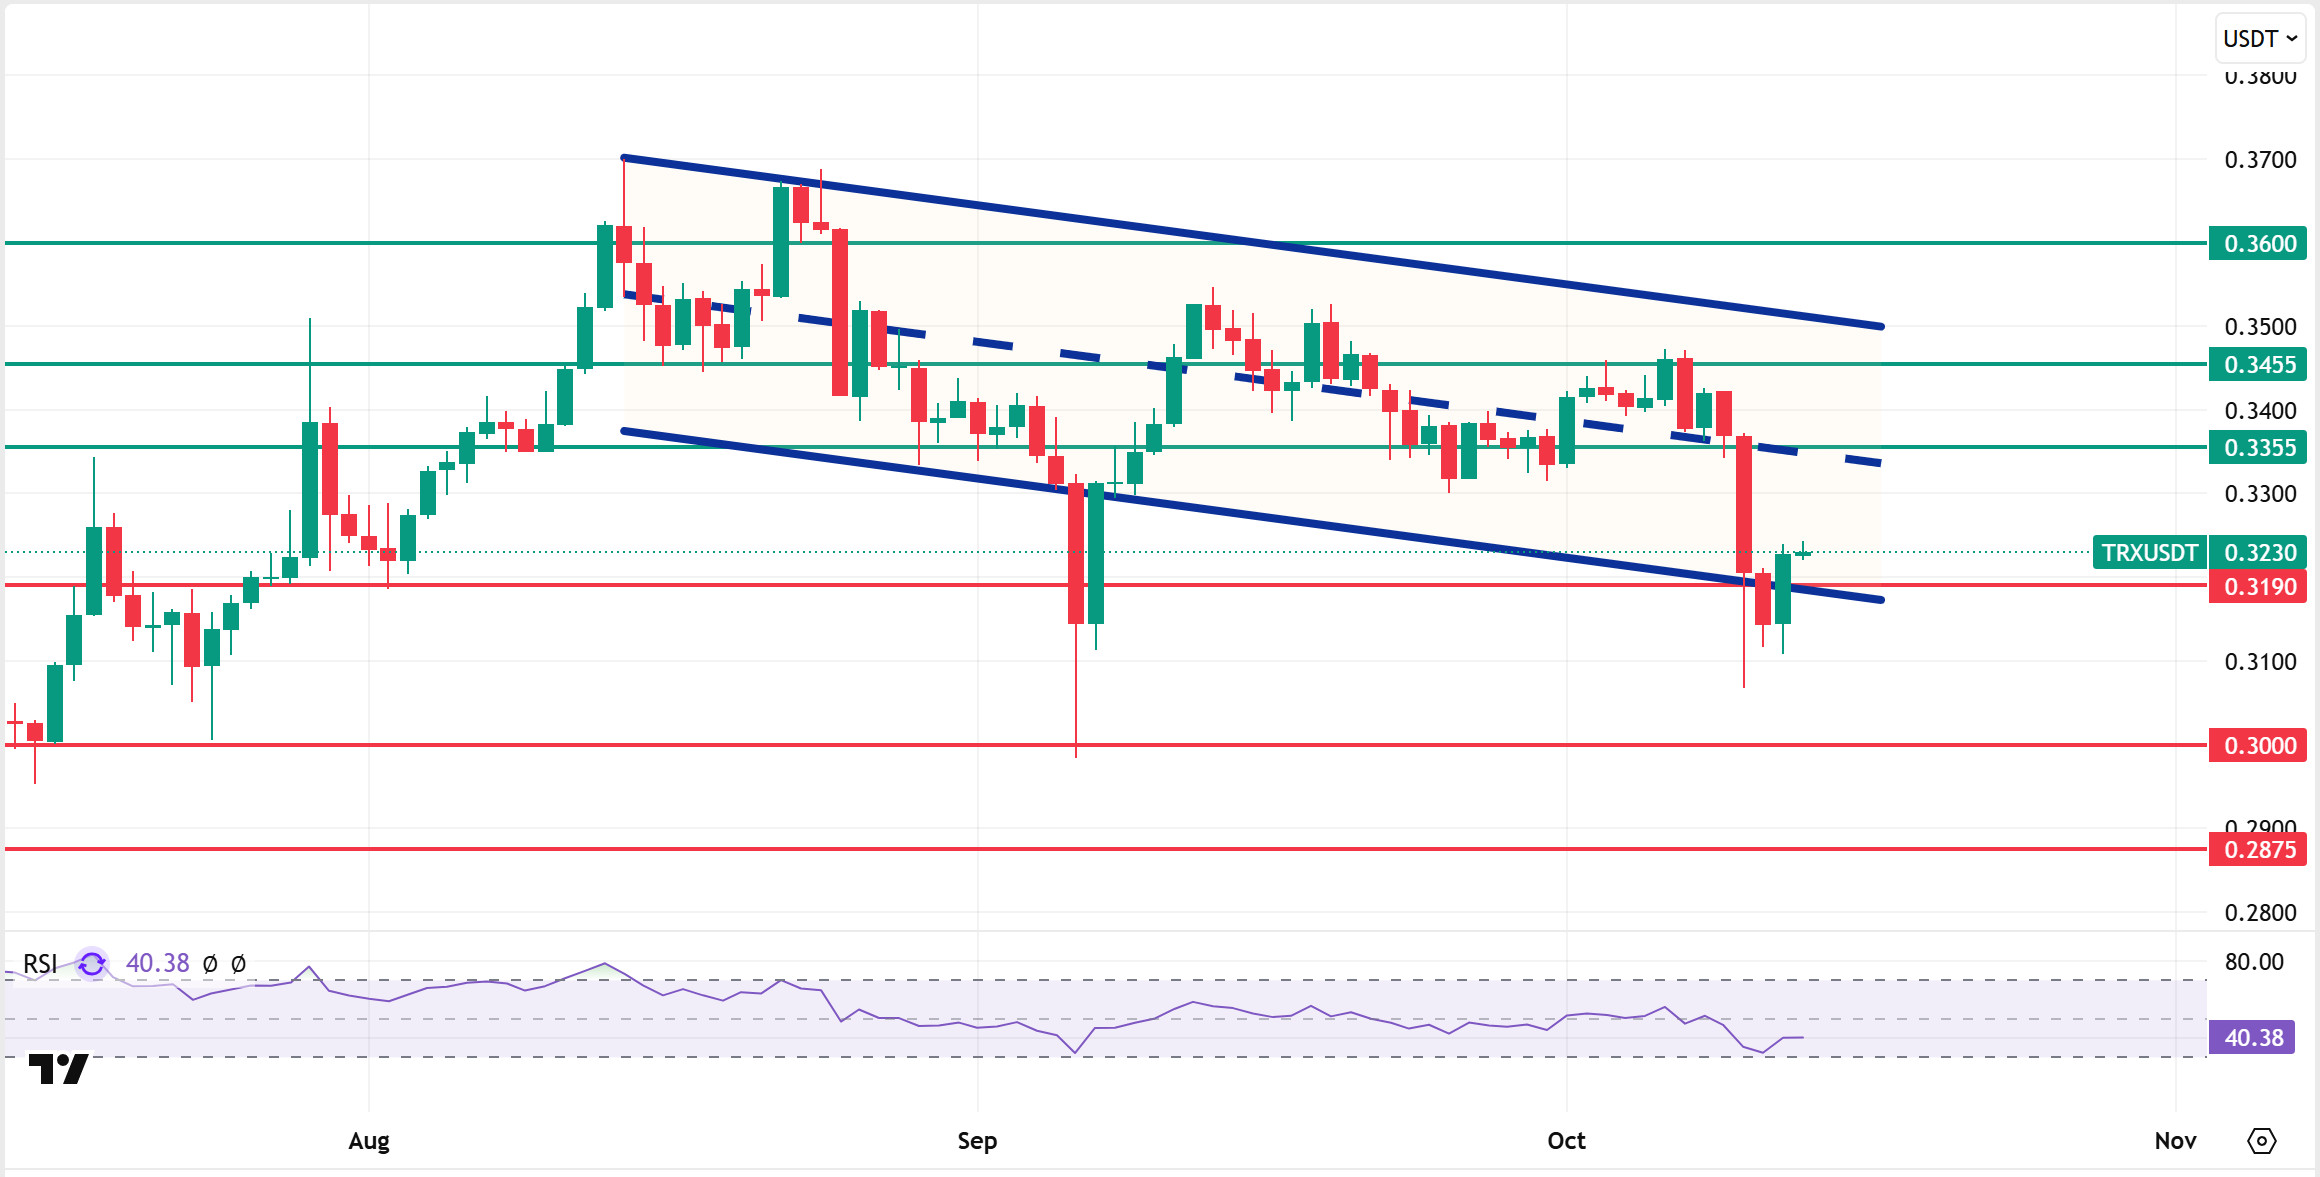
Technically speaking, TRX started the week at 0.3413 and closed the week at 0.3228, falling approximately 5.5% over the course of the week. Thus, TRON ended the week with a decline, and its market value was $30.6 billion. Currently trading at 0.3230, TRX is just above the lower band of the bearish channel on the daily chart and is hovering near the 0.3190 support level. The Relative Strength Index (RSI) value is observed to be very close to the oversold zone at 40. Considering its position within the bearish channel and the RSI indicator, the TRX price may rise slightly. This indicates that it may want to move towards the middle band of the channel. In such a case, it may test the 0.3355 resistance. If it closes above the 0.3355 resistance level on a daily basis, it may test the 0.3455 resistance level. If it fails to close above the 0.3355 resistance level on a daily basis and selling pressure increases in the market, it may decline due to potential selling from this area. In such a case, it may test the 0.3190 support level. The 0.2875 level is being monitored as a critical support point on the daily chart. Sustaining above this level could maintain the upward trend, while closes below it ( ) could lead to increased selling pressure and deeper downward price movements.
Supports: 0.3190 – 0.3000 – 0.2875
Resistances: 0.3355 – 0.3455 – 0.3600
AVAX/USDT
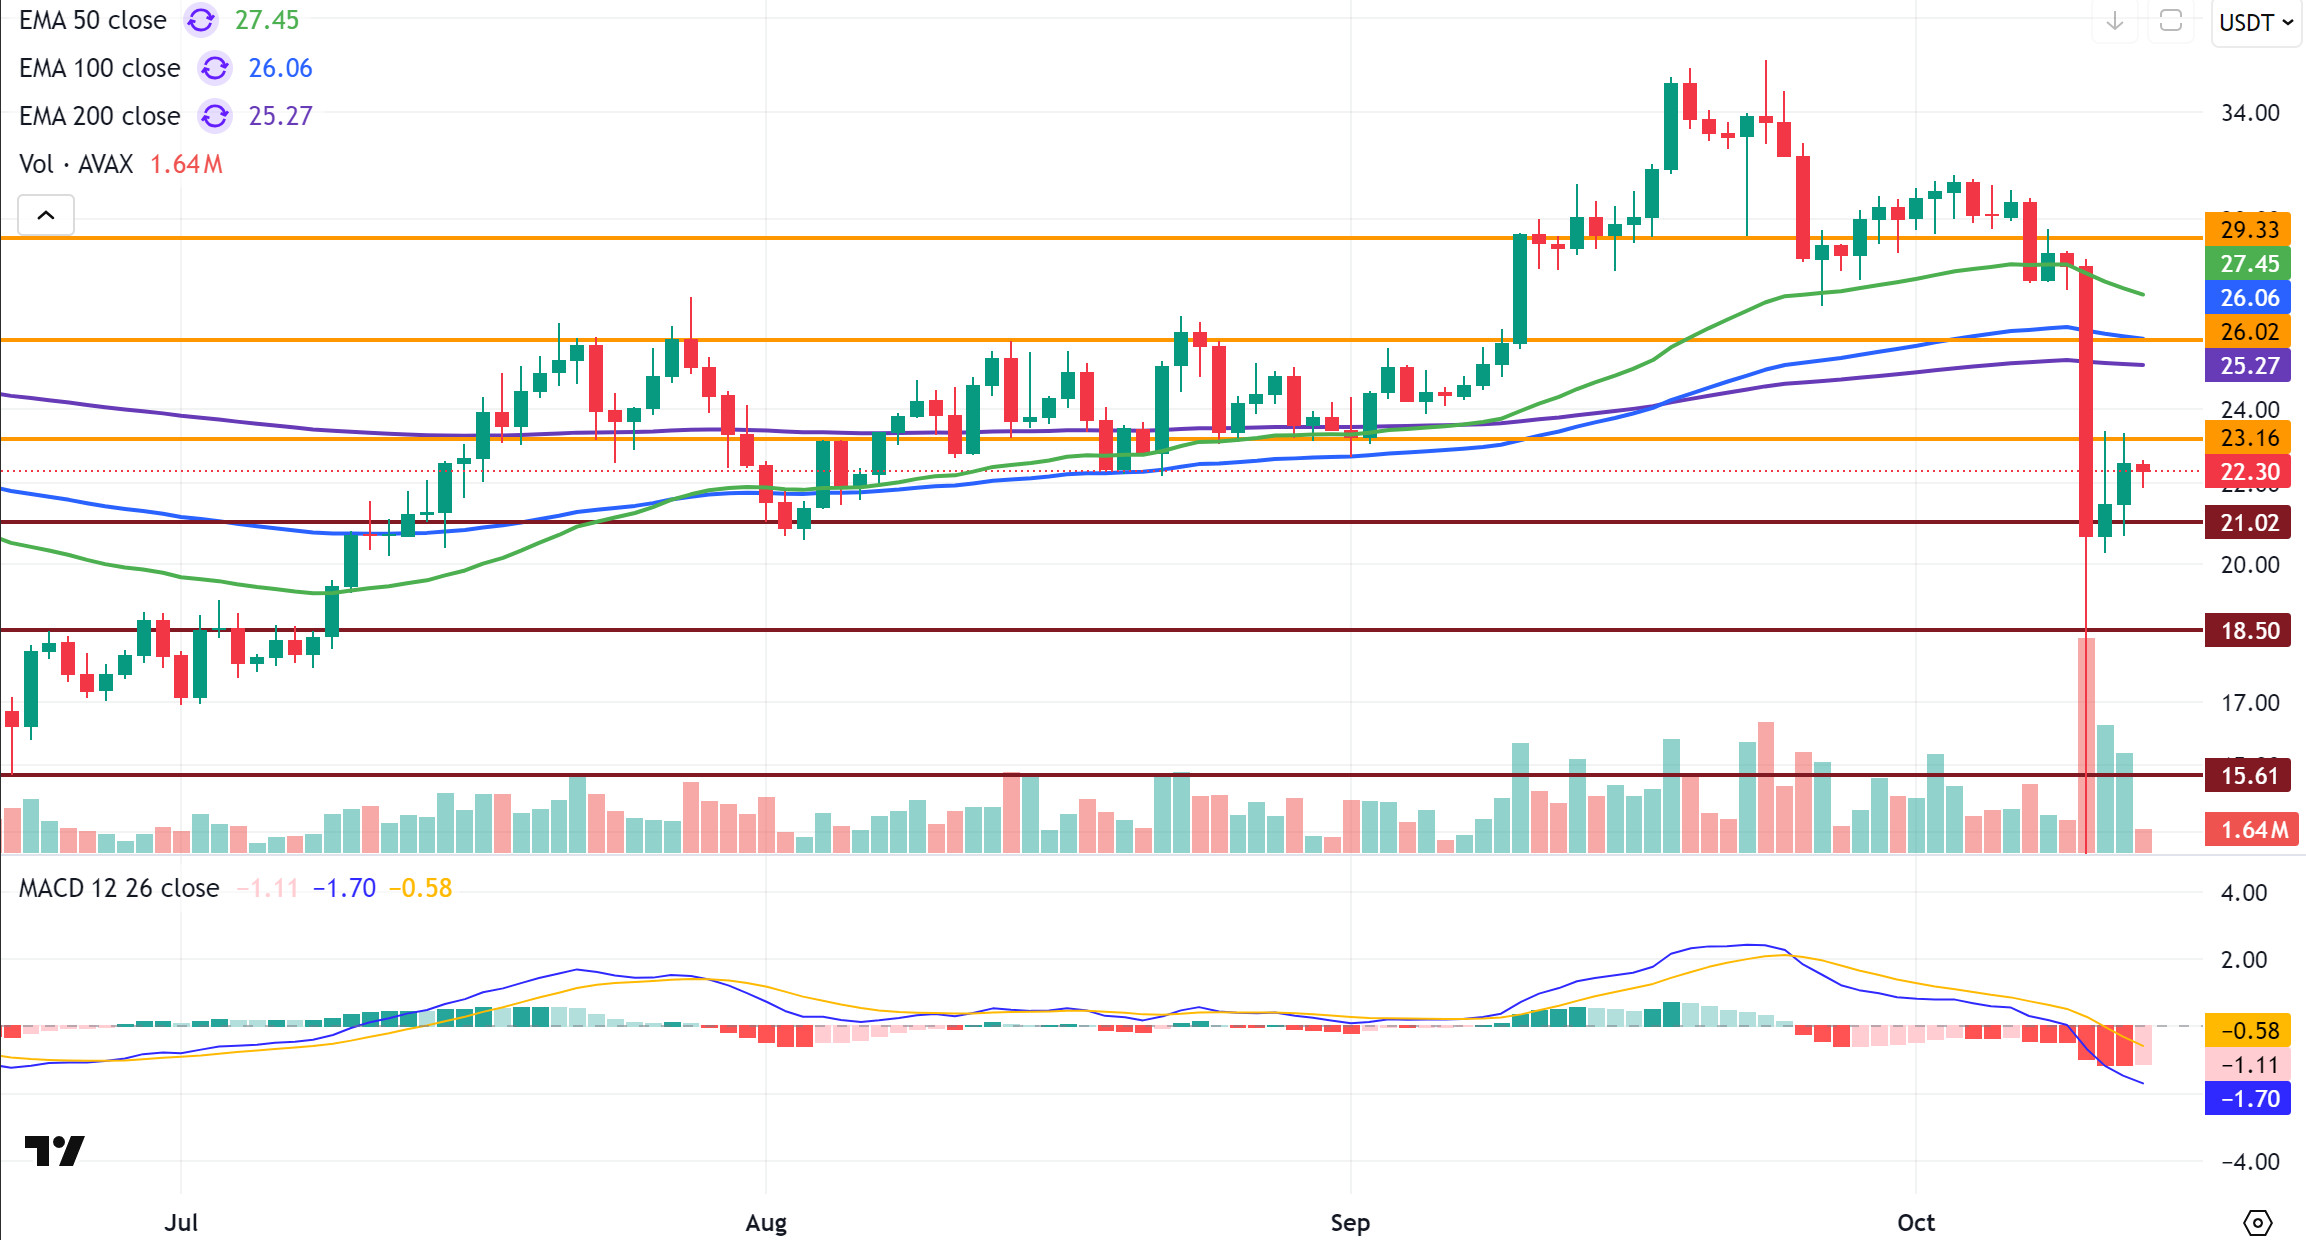
AVAX, which started last week at $30.07, closed the week at $22.51, losing 25.14% of its value. The collapse seen in global markets following statements made by US President Trump was also reflected in the cryptocurrency market. In this sharp decline, AVAX initially lost more than 60% of its value, falling to $8.52. As with the crypto market in general, AVAX showed signs of recovery with purchases following the short-term collapse and rose back to $22.5. Despite its recovery efforts, AVAX maintained its negative outlook during this week of sharp volatility.
On the daily chart, following last week’s strong sell-off, the Moving Average Convergence/Divergence (MACD) line fell below the signal line, retreating into negative territory. The MACD line is currently below the signal line, momentum is weak, and the direction is down. This indicates that the downward trend is continuing in the short term. Furthermore, after its collapse, AVAX fell below all critical Exponential Moving Average (EMA) levels, presenting a technically negative outlook. In other words, pressure continues in terms of both momentum and trend direction.
From a technical perspective, AVAX broke below the $26.02 level during its decline, making this level a critical resistance point. If this level is retested during an upward movement, it could act as strong resistance. In downward movements, the $21.02 support level is the most important short-term support. Although the price tested the $23.16 level with the rebound buying seen last week, this level was not broken, and AVAX continues to trade below this resistance. If selling pressure continues in the coming period, a break below the $21.02 support level could lead to a pullback to the $18.50 and $15.61 levels, respectively. Conversely, if strong buying pressure emerges and the momentum recovers, AVAX maintaining stability above the $26.02 level could reignite the upward trend. However, the overall outlook remains negative, with both the MACD and EMA continuing to produce negative signals.
(EMA50: Green Line, EMA100: Blue Line, EMA200: Purple Line)
Supports: 21.02 – 18.50 – 15.61
Resistances: 23.16 – 26.02 – 29.33
SHIB/USDT
This week, the risk-off wave triggered by the US announcing a 100% tariff on China led to sharp sell-offs across crypto; signs of recovery emerged after SHIB saw a roughly 44% pullback. On-chain data showed that exchange reserves continued their downward trend since 2023, indicating a decrease in supply ready for sale; accumulation flows in whale wallets and a significant increase in burn rates supported this picture.
On the ecosystem front, Shibarium was reactivated after an approximately 10-day outage, and repairs for the bridge exploit caused by a fake checkpoint were completed. 4.6 million BONE were recovered, all validator keys were renewed, over 100 critical contracts were moved to multi-signature wallets, and a blacklisting mechanism with a 30-checkpoint delay was added to bridge exits. On the LEASH side, the v2 transition was announced after Hexens audit, permanently resolving the rebase-induced supply deviation, the total supply was fixed at 107,000, and a three-phase 1:1 migration plan was announced. While comprehensive warnings against phishing attempts mimicking official channels dominated community communications, the week saw the pressure created by the macro shock balanced by progress in ecosystem security/infrastructure hardening and supply discipline.
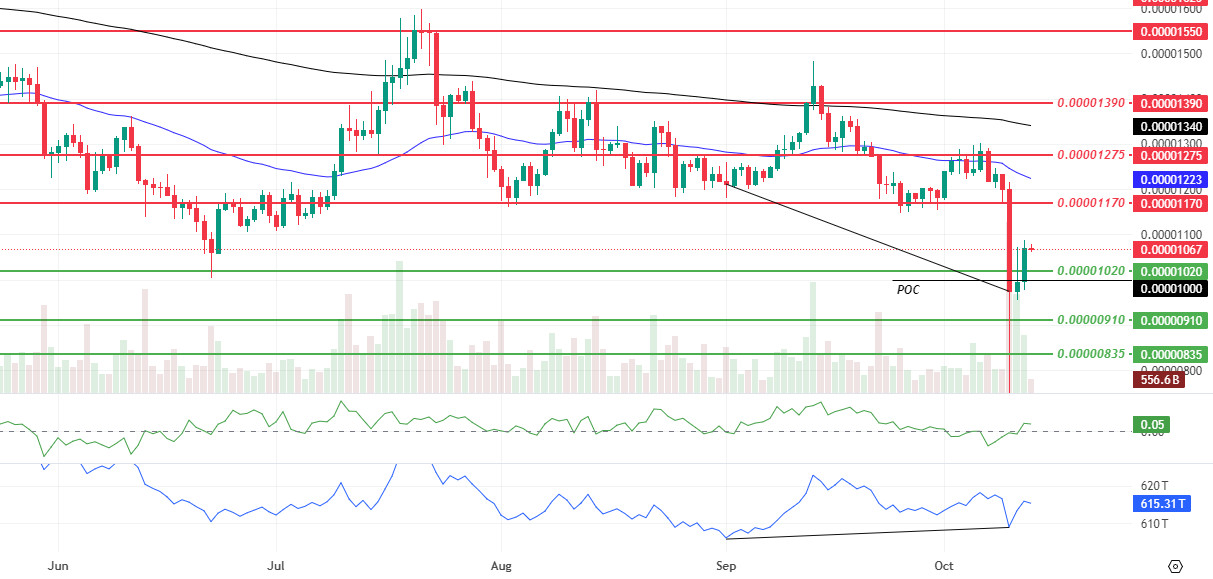
The technical outlook is taking shape on the ground following the sharp sell-off. The price is returning above the $0.00001020 level and the week’s Point of Control (POC) value of $0.00001000, while remaining below the 50 Exponential Moving Average (EMA) ($0.00001123 level) limits short-term directional attempts. Above, the $0.00001170 level is the first horizontal resistance, followed by the $0.00001275 level and the EMA 200 ($0.00001340 level) and $0.00001390 level as a gradual resistance zone; If these thresholds are retaken with volume, the likelihood of a sustained recovery increases. Below, the $0.00001020 level is the first support; below this level, the $0.00000910 level and the $0.00000835 level come into play.
Chaikin Money Flow (CMF) remains in positive territory, signaling money inflows; the positive divergence between On-Balance Volume (OBV) and price (black line) also supports the possibility of accumulation around the bottom. In summary, the continuation of the trend below EMA 50 keeps upward attempts corrective in nature, while closes above the $0.00001170 – $0.00001275 range and the approach to EMA 200 remain critical for confirming a recovery. (EMA200: Black line, EMA50: Blue line)
Supports: 0.00001020 – 0.00000910 – 0.00001020
Resistances: 0.00001170 – 0.00001275 – 0.00001390
LTC/USDT
Litecoin (LTC) ended last week with a 16.72% decline and started the new week at $98.98. LTC lost 10.6% against Bitcoin during the same period, and its market value fell to approximately $7.75 billion. As a result, it dropped one spot in the market cap rankings to 20th place. On the futures side, open positions were largely liquidated due to the decline, causing the total open position size in the market to decrease by 50% compared to the previous week, while funding rates turned negative.
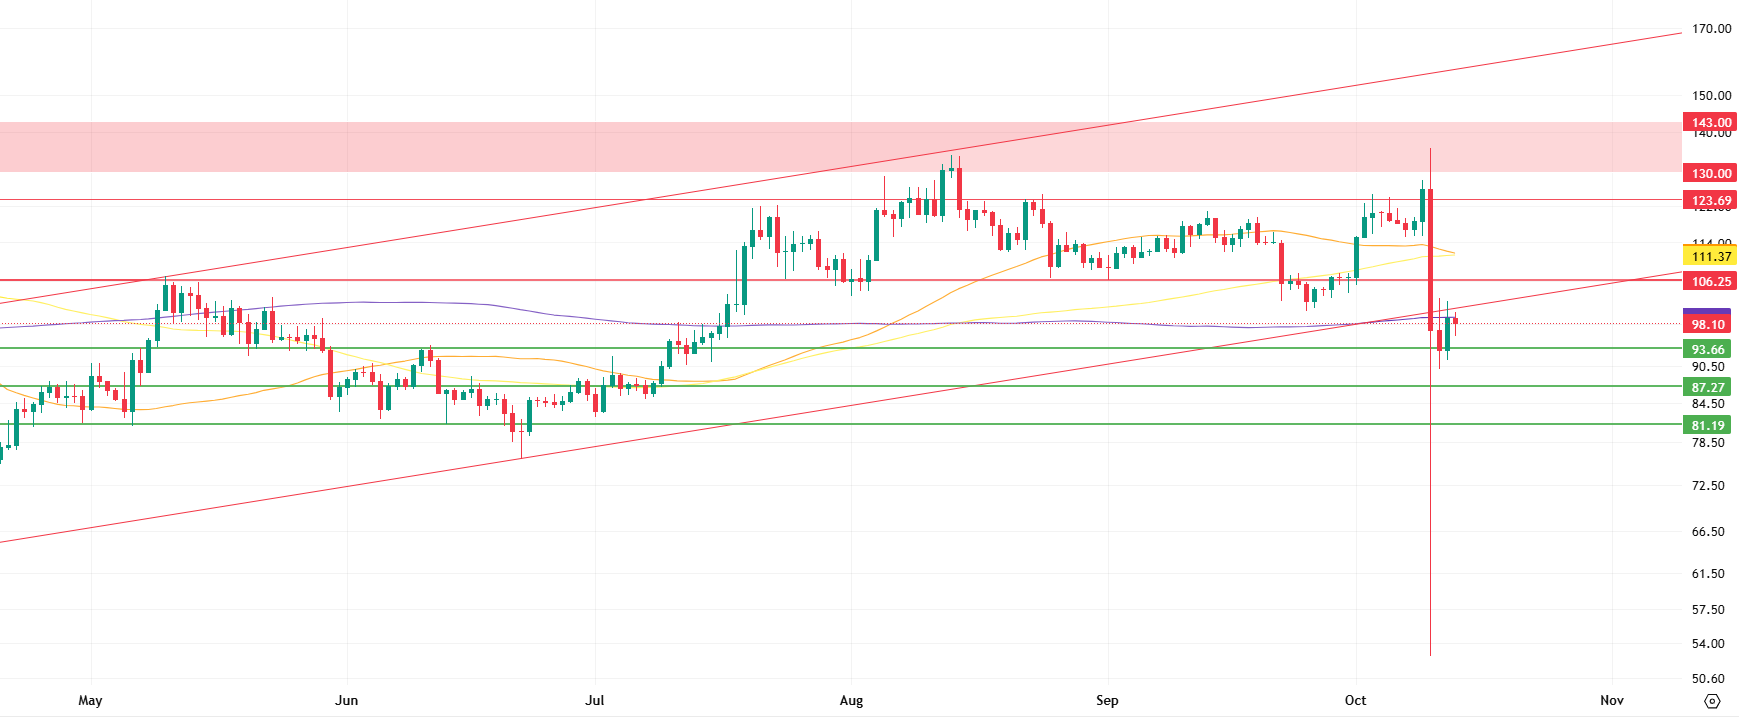
Litecoin is currently trading below all major moving averages and has lost its rising trend support, reflecting a generally negative outlook. Resistance appears to be forming at the rising channel’s lower band at $98.17 ( ) and the 200-period moving average (purple line). If there are closes above this line, the price can be expected to move towards the $106.25 band. While $106.25 is initially a horizontal resistance level, if it can hold above this level, it may re-establish itself as a level that can function at its former strength. On the other hand, the 100-period moving average (yellow line) at 111.37 and the 50-period moving average (orange line) located nearby form another selling zone.
In the event of further pullbacks, the $93.66 level emerges as Litecoin’s first strong support. This level is the first line of defense where short-term buyers could re-enter, as it is an area where the price has reacted several times in previous phases. In the event of a crisis below this level, the horizontal support at the $87.27 level can be monitored as the second important area that could limit the decline. In the event of a deeper pullback, the $81.19 level emerges as a critical threshold. This level represents a concept where many medium-term bottoms have accumulated in the past and where weekly moving averages should bring buyers back into play.
Supports: 93.66 – 87.27 – 81.19
Resistances: 98.17 – 106.25 – 111.37
BNB/USDT
Looking at the key developments this week, Trump’s statement about the new tariffs he will impose on China, “I was going to meet with Xi in two weeks. Now it seems there is no reason for me to meet with him. I didn’t meet with President Xi because there was no reason to meet. Many countermeasures are being considered regarding China.”
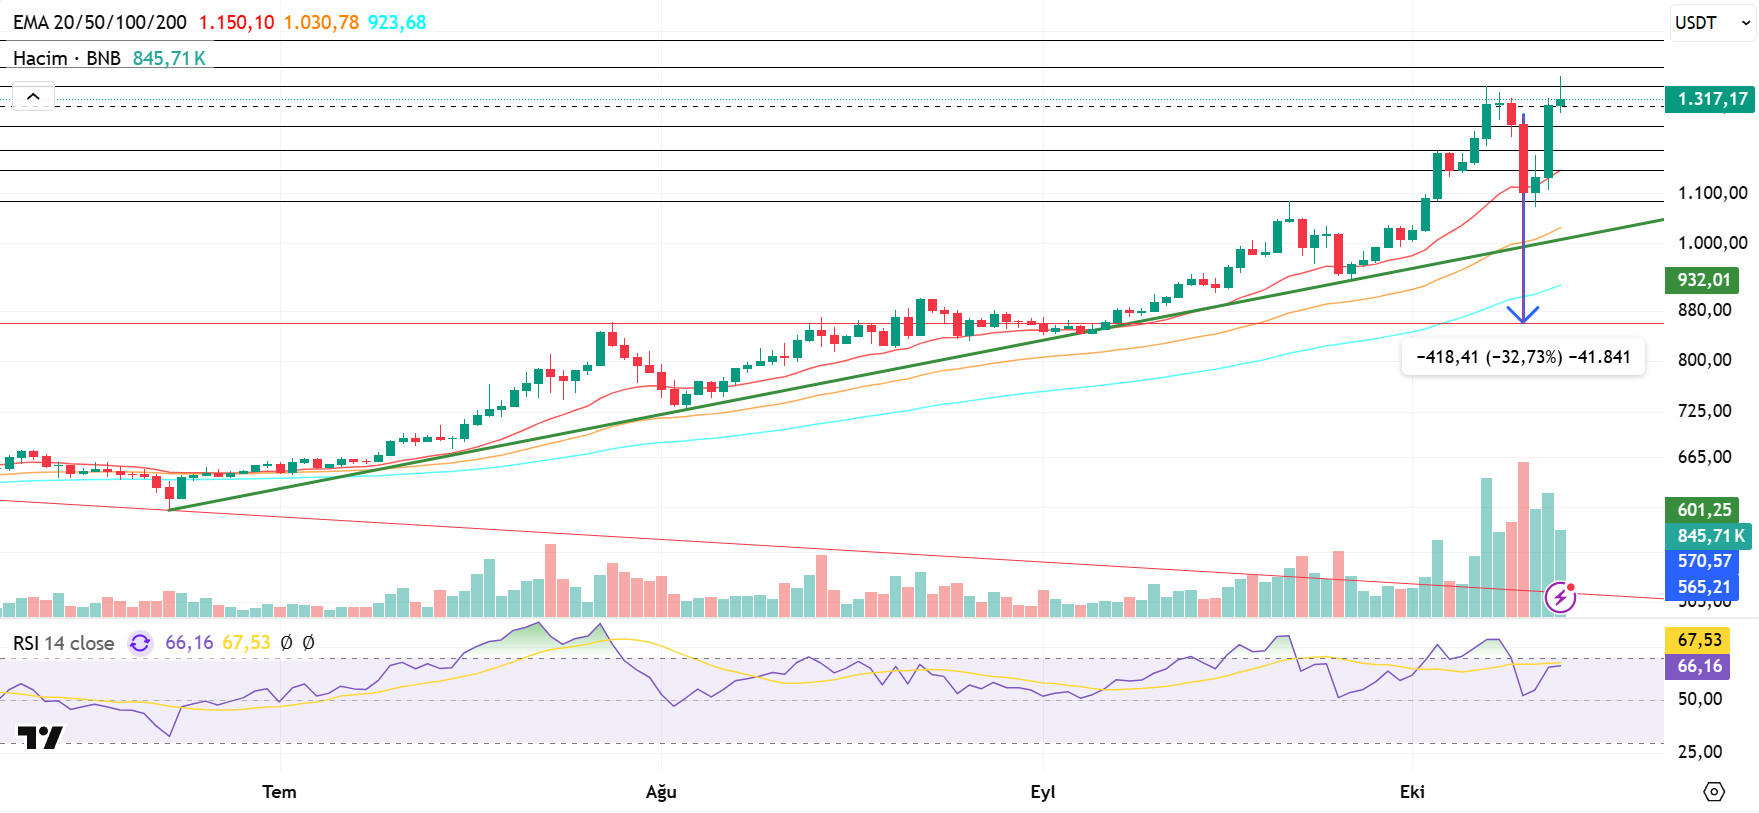
During this decline, BNB fell by approximately 33% to $860. However, the BNB ecosystem continued to rise, supported by strong fundamentals, and the BNB/USDT pair tested the $1,350 level again.
Also this week, CEA Industries reported holding 480,000 BNB in its portfolio and announced plans to own 1% of BNB’s total supply by the end of the year. YZi Labs announced a $1 billion creator fund to support founders in the BNB ecosystem, particularly on the BNB Chain. Meanwhile, China’s Renaissance Bank stated that it aims to raise $600 million for BNB investments.
In the BNB ecosystem, the WAL project has been listed on Binance Launchpool. This listing is expected to increase demand for BNB used in transaction fees and reduce the circulating supply through users staking BNB. This situation is expected to have a generally positive effect on the price of BNB.
From a technical perspective, the correction movement that started from the all-time high (ATH) of $1,350 ended at the $860 level due to Friday’s sharp decline; the BNB/USDT pair, which continued its rise with strong support from this region, has again reached the $1,300 level.
Technical indicators for BNB/USDT, currently trading in the $1,250–$1,350 range, show that the recent increase in trading volume has supported buying. This picture indicates that the positive outlook in the market is gaining strength. Furthermore, the Relative Strength Index (RSI) fell to the 50 level following recent pullbacks; however, it found support at these levels and resumed its upward trajectory. This technical structure indicates that positive momentum in BNB is strengthening.
Within the current outlook, if buying appetite is maintained, BNB is expected to test the $1,350 resistance level in the first stage. If this level is broken, the price could move towards the $1,400 and $1,450 levels. On the other hand, if selling pressure increases, the price may retreat back to the $1,250 support level. If this level is broken downward, the $1,200 and $1,150 levels emerge as critical monitoring zones.
Supports: 1,250 – 1,200 – 1,150
Resistances: 1,300 – 1,350 – 1,400
LINK/USDT
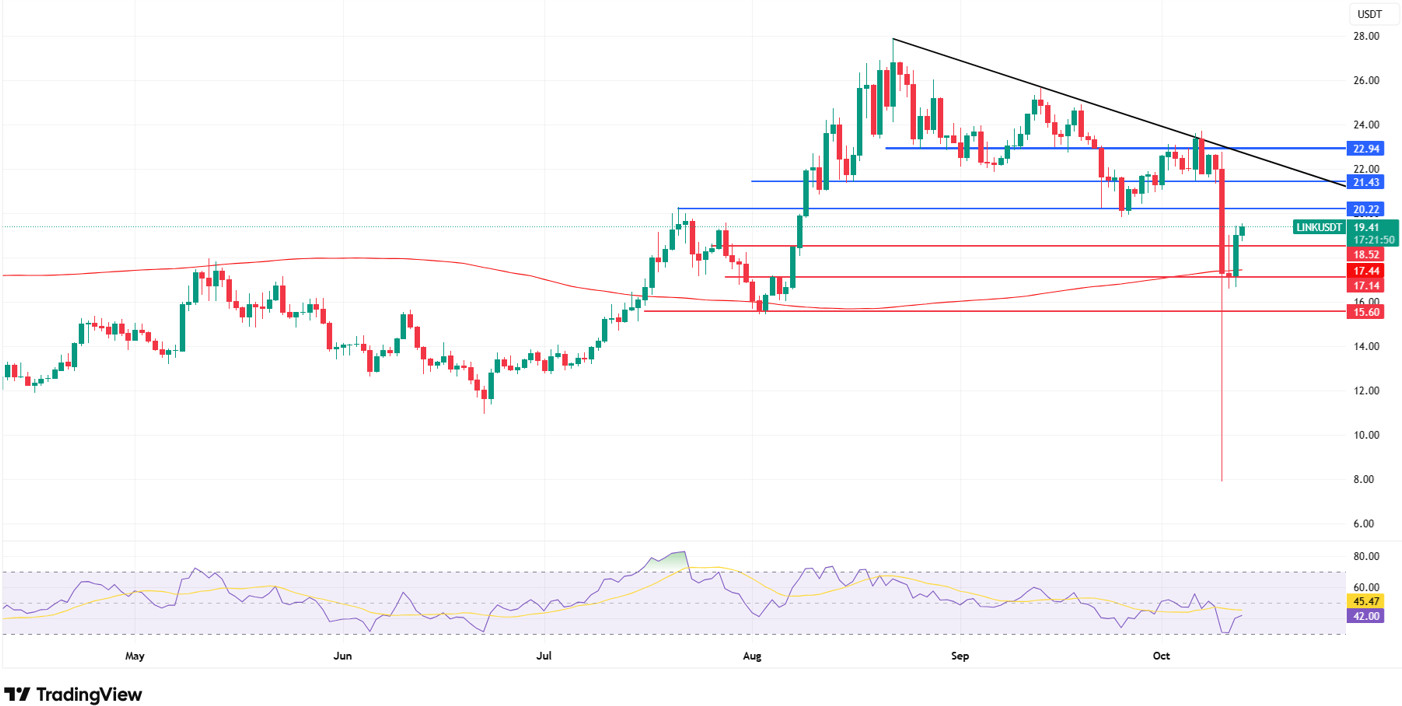
LINK, which has gained upward momentum since the end of June, rose rapidly to around $27 at the beginning of July and formed a peak in this region, then gradually declined, creating a downward trend. In particular, the failure to maintain stability above $22 in the last weeks of September caused the price to fall below the important support level of $20.22 during last Friday’s “market crash.” During this decline, the price fell back to the $7 range. We see that the price is attempting to rebound and stabilize around the $17–19 level, accompanied by a long wick forming in this region.
Currently, Link is attempting to hold above the 200-day simple moving average around $17 and is advancing towards the $20.22 resistance zone. Here, we can say that it is difficult to talk about a sustainable recovery without maintaining stability above $20.22. It is important to note that downside risks are still on the table. If the support levels at $17.44 and $17.14 are retested and broken, the price could potentially pull back to the $16 and lower $15.60 range.
For upward movements, our most important resistance zone will be the $21.43–$22.94 range. This zone is both a horizontal resistance and a resistance point for our downtrend. If the price breaks through this zone and we see 4-hour closes above it in the first stage, a stronger upward wave towards the $24 and $26 levels could come into play. In this scenario, volume-supported movements forming in the $24.00–25.20 range will confirm the upward trend. Although the Relative Strength Index (RSI) indicator is attempting to recover around the 45 level, it needs to rise above 55 to indicate strong upward momentum. Otherwise, the current upward movements are likely to remain limited as a rebound and could turn into selling opportunities.
Supports: 18.52 – 17.14 – 15.60
Resistances: 20.22 – 21.43 – 22.94
SUI/USDT
This week, the entire crypto world, including the Sui (SUI) ecosystem, experienced major crashes and noteworthy developments. According to Tokenomist data, 44 million SUI tokens are scheduled to be released this week as part of the “cliff unlock” list. This amount is worth approximately $189.62 million. This is a significant development that could put pressure on the price as it will introduce new supply into circulation.
Meanwhile, news about Coinbase’s plans to launch futures listings for SUI has reignited institutional investor interest. The support of derivative products by major exchanges such as Coinbase generally increases the project’s recognition on an institutional scale and boosts trading volume. This development is viewed positively in terms of medium-term price stability and volume growth, as it will facilitate access to SUI, particularly for US-based investors.
Additionally, there has been a noticeable increase in DeFi activity and TVL (Total Value Locked) on the Sui network in recent times. The fact that TVL has reached $2.28 billion indicates that network usage rates have increased and that new capital continues to flow into the ecosystem. This underscores that SUI is not only an investment vehicle but also an actively used DeFi infrastructure.
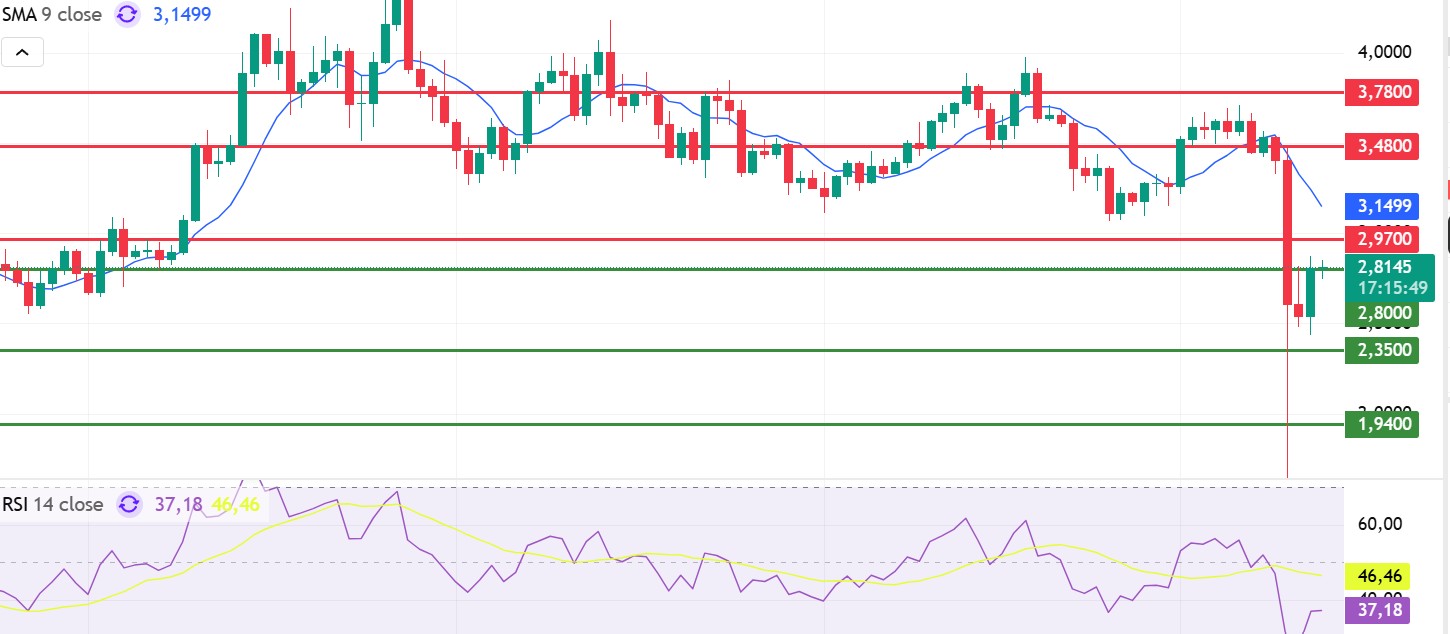
Looking at Sui’s technical outlook following the recent disruptive developments, we see that the price has been moving sideways at around $2.81 on a weekly basis, influenced by fundamental developments. The Relative Strength Index (RSI) is currently in the range of 46.46 – 37.18. This range indicates that the market is trading close to the sell zone; however, if the RSI weakens and falls to the 35.00 – 40.00 range, it could signal a potential buying point. If the price moves upward, the resistance levels of $2.97, $3.48, and $3.78 can be monitored. However, if the price falls to new lows, it could indicate that selling pressure is intensifying. In this case, the support levels of $2.80, $2.35, and $1.94 come to the fore. Based on the trend line, a pullback to $1.94 appears technically possible. According to Simple Moving Averages (SMA) data, Sui’s average price is currently at $3.14. If the price remains below this level, it could signal that the current uptrend may not continue technically.
Supports: 1.94 – 2.35 – 2.80
Resistances: 2.97 – 3.48 – 3.78
ADA/USDT
Whale Alert reported a large transfer of 67,926,042 ADA worth over $54 million from Coinbase to an unknown wallet. This move, one of the largest Cardano whale transactions in recent months, caused the price to drop below 0.6000 following the sudden outflow. Large transfers are closely monitored as they often reflect institutional or whale sentiment. With Cardano trading just below the 0.6768 resistance level, this pullback has fueled discussions. Notably, whales withdrawing funds from exchanges like Coinbase are typically seen as bullish and indicate no immediate intention to sell. Such movements usually indicate that coins are being stored in cold wallets for long-term holding, while inflows into exchanges typically signal selling pressure. Cardano recently gained regulatory support with the re-inclusion of the largest cryptocurrency in Hashdex’s US ETF following a compliance-related announcement. Cardano founder Charles Hoskinson has explored decentralized finance (DeFi) opportunities involving XRP and the potential integration of Ripple’s RLUSD stablecoin into the Cardano network. His desire to integrate it into the ADA network could signal favorable pricing for ADA in the future.
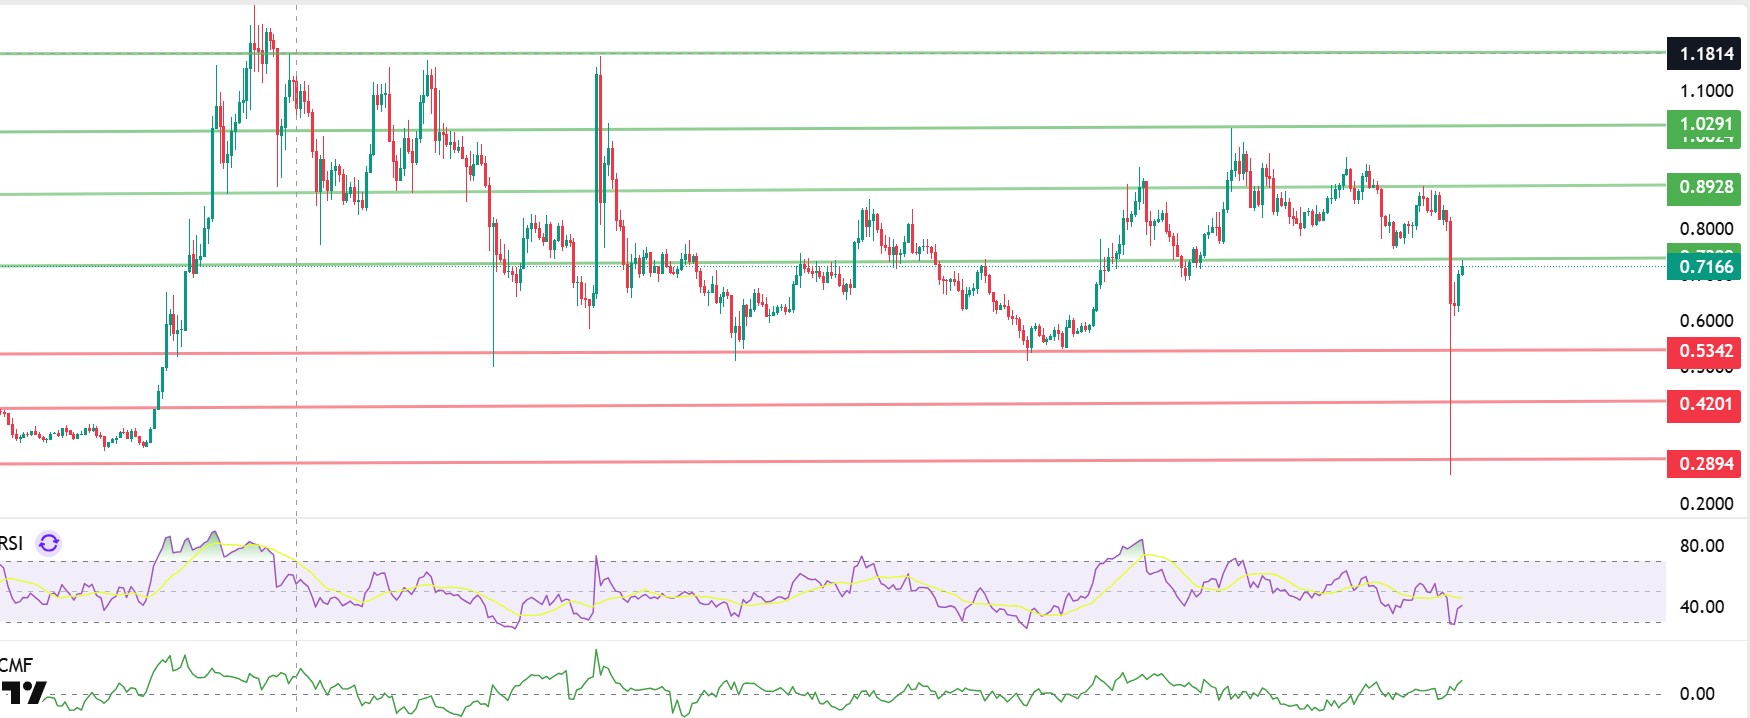
Technically speaking, the ADA price experienced negative days this week due to the US’s statement regarding China, falling approximately 4.6% in the last 24 hours and over 71% in the last week to around $0.2700. Trading at its current price of $0.7100, ADA could experience a significant technical turning point if it manages to stay above $0.8200, as this would mean it has broken through the resistance level that has been anticipated for weeks. This rise, if it happens, signals renewed market confidence and more profit potential, especially for investors, with the return of ETFs, which are classic bullish indicators, and increased institutional interest.
The Relative Strength Index (RSI) is hovering in the oversold territory at 38 levels, while the Chaikin Money Flow (CMF-20) is retreating to 0.12 levels, indicating that the selling potential continues. Should positive macroeconomic data be released this week or positive news emerge regarding the Cardano ecosystem, the $0.8928 level could emerge as a strong resistance point. Should a decline begin, the $0.5342 level will be the key support level to monitor.
Supports: 0.5342 – 0.4201 – 0.2894
Resistances: 1.0291 – 0.8928 – 0.7172
Legal Notice
The investment information, comments, and recommendations contained in this document do not constitute investment advisory services. Investment advisory services are provided by authorized institutions on a personal basis, taking into account the risk and return preferences of individuals. The comments and recommendations contained in this document are of a general nature. These recommendations may not be suitable for your financial situation and risk and return preferences. Therefore, making an investment decision based solely on the information contained in this document may not result in outcomes that align with your expectations.