
Weekly Technical Analysis Report
BTC/USDT
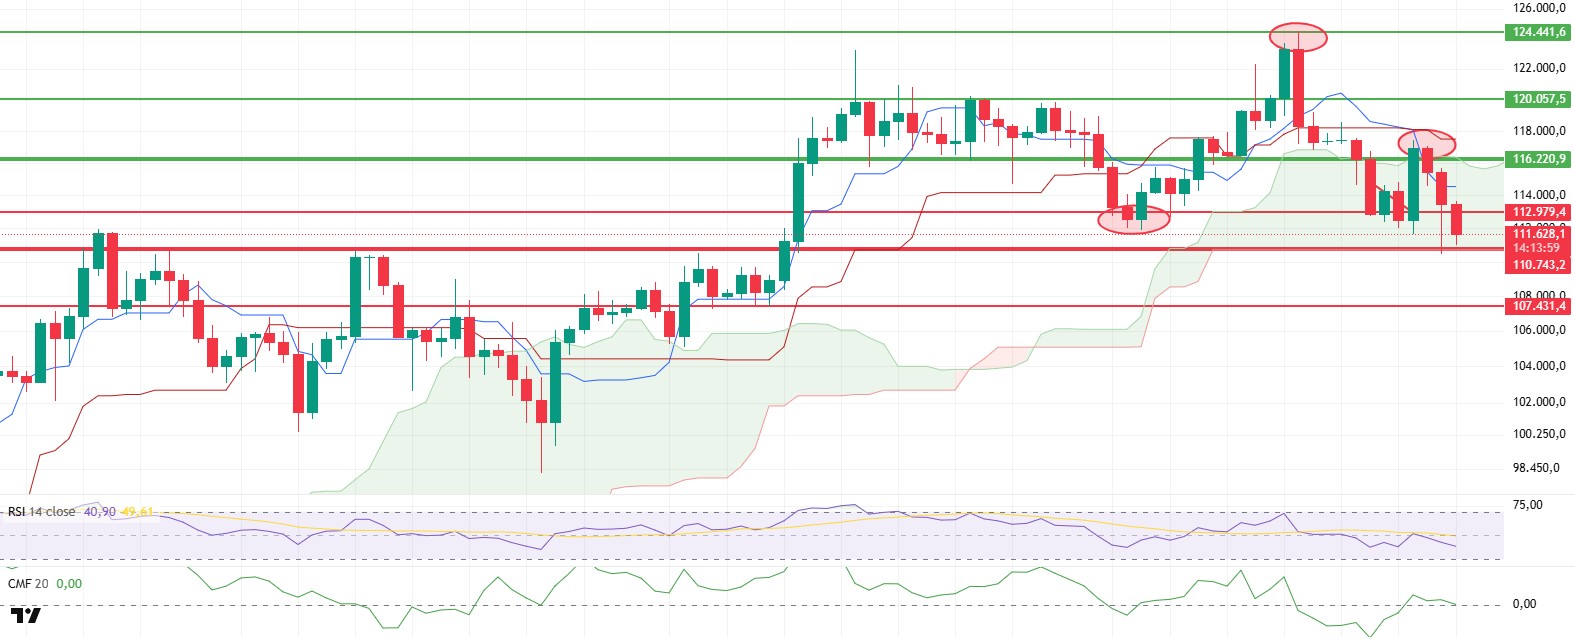
Following the positive reception of Fed Chair Powell’s Jackson Hole speech, BTC gained momentum rapidly and climbed to the significant resistance level of $117,329. Expectations of a potential interest rate cut fueled the rally, but selling pressure in the region and rotation toward ETH weakened momentum. The price retreated to the strong support level of $110,936 and is currently attempting to hold in this area. The short-term technical outlook is shifting from neutral to negative, with buyers attempting to create room for a rebound in this balancing phase.
Futures market data indicates that positioning has not been completely unwound despite the pullback. Open interest remained at around $39.7 billion, and the funding rate continued to hover in positive territory. The net takeaway is that upward expectations have not yet been undermined and long positions have not been fully liquidated. However, the combination of a positive funding rate and high open interest increases the risk of crowded long positions in the short term and amplifies the likelihood of a deepening decline driven by liquidation if prices break below critical support levels.
The Ichimoku indicator shows short-term pressure more clearly. After rising above $116.220 and breaking through the upper band of the kumo cloud, a fakeout formed with the subsequent pullback, and the movement eased down to the lower band of the kumo cloud. Currently, the thickness and slope of the cloud maintain their resistance for the price hovering in the border zone. The failure to establish a sustained position above the Tenkan and Kijun lines weakens the backbone of the upward trend. The positioning of the Chikou Span relative to the price and the cloud also warrants caution. If dips toward the lower band are confirmed by daily closes, stop triggers and liquidity withdrawals could accelerate the price downward.
On the cash flow side, the Chaikin Money Flow (CMF) has moved into positive territory following the recent uptrend but is now approaching the zero line again. Despite the sharp price rejection, the indicator’s relative resilience suggests that a broad-based breakout has not yet formed and that buyer interest remains intact in the lower price regions. A return to the positive zone would support a recovery scenario, while a move below zero would signal renewed selling pressure.
On the momentum side, the Relative Strength Index (RSI) was rejected from both the 50 threshold and the MA line, turning downward and confirming short-term weakness. This pattern indicates an increased risk of lower highs and lower lows, with profit-taking likely to come to the fore during any rebound rallies. If the RSI breaks back above 50 and holds there, rally attempts would gain more convincing ground.
Looking at the weekday outlook, the $110,936 and $110,743 bands are the primary defense lines. A volume-supported reaction above this region would bring the $116,220 level back into focus after breaking through the intermediate resistance around $114,500. With closes above 116,220, a re-break of the 120,000 dollar level could be expected. On the downside, closes below 110,743 dollars would deepen selling and increase the likelihood of a decline toward a lower support area. In such a scenario, increased volatility is expected, and a cautious approach seeking confirmation rather than aggressive risk-taking without a reaction would be more prudent. The trend’s direction is reinforced by sustained movement above 116,220 in favor of bulls and below 110,743 in favor of bears.
Support levels: 112,979 – 110,743 – 107,431
Resistance levels: 116,220 – 120,057 – 124,456
ETH/USDT
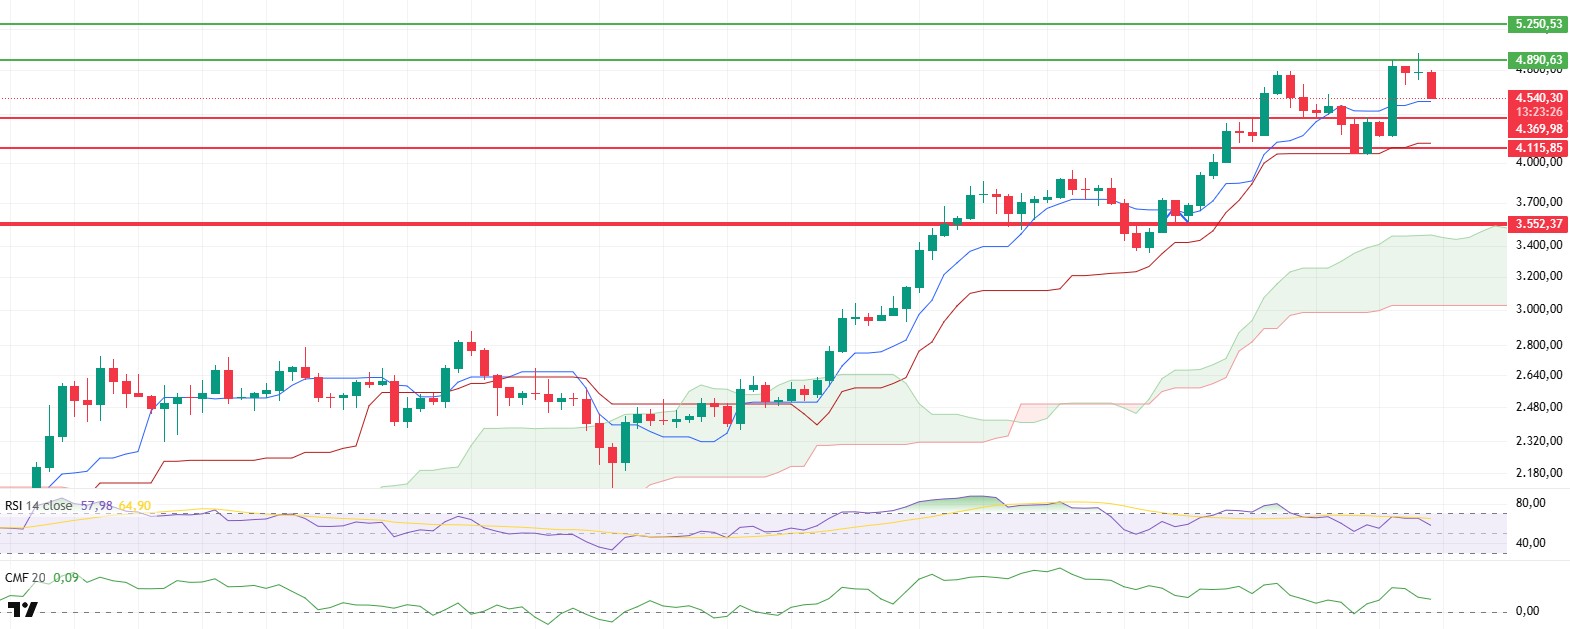
ETH gained strong momentum as Fed Chair Powell’s Jackson Hole speech was positively received by the market. First, the price broke through the important resistance level of $4,551, then rose to $4,956 with increased buyer appetite, refreshing its all-time high (ATH). Despite the limited pullback observed after the weekly close, the structural outlook remains positive. Market participants are clearly maintaining their buying-oriented tendencies, and the overall upward trend expectation remains strong.
On-chain data is producing important signals supporting price movements. The total amount of staked ETH, which had been on a downward trend since August 9, rose again after last week’s increase, reaching 36.14 million. This increase indicates that institutional investors and large-scale addresses continue to maintain their confidence in ETH. In particular, the acceleration in the increase in staked amounts during periods when prices tested record levels supports the notion that long-term upward expectations remain intact. Additionally, on the ETF front, the high inflows observed on Thursday and Friday of last week served as another factor supporting the price’s upward movement. These developments highlight that fresh liquidity continues to flow into the market and that institutional demand plays a decisive role in price dynamics.
Technical indicators also confirm the positive structure. The Chaikin Money Flow (CMF) indicator’s horizontal movement in the positive zone indicates that liquidity entering the market remains strong. This structure clearly reflects that buying appetite is maintained in spot markets and that upward-trending positions are sustained. The CMF’s continued presence in the positive zone signals that the price could regain upward momentum.
The Ichimoku indicator shows that the price continues to move above the Kumo cloud, Tenkan, and Kijun levels. This view confirms that the short-term technical structure is strong and that the overall trend continues unabated. The upward slope of the kumo cloud increases the likelihood that price will find support during any pullbacks. Additionally, the price remaining above the kijun level suggests that any declines may be limited and that buying interest could quickly emerge.
The Relative Strength Index (RSI) pulled back slightly after reacting to the upper boundary of the overbought zone. This movement can be interpreted as a cooling of the overheated momentum and produces a healthy correction signal. The RSI’s structurally positive outlook indicates that the primary trend has not lost its strength. Although there is a slight weakening in momentum, the overall upward trend persists, enabling the price to stabilize at higher levels.
The overall outlook indicates that ETH has strong potential to test the ATH region at $4,956 in the short term. If buying pressure continues, breaking through this region could bring new record highs. However, if the intermediate support at $4,369 is lost, the price could retreat to $4,115. Therefore, it is crucial to defend the critical support levels strongly to maintain the current upward trend. Key factors to monitor include the continuation of liquidity flow, the RSI regaining strength, and the preservation of the Ichimoku structure.
Support levels: 4,369 – 4,115 – 3,552
Resistance levels: 4,890 – 5,250 – 5,550
XRP/USDT
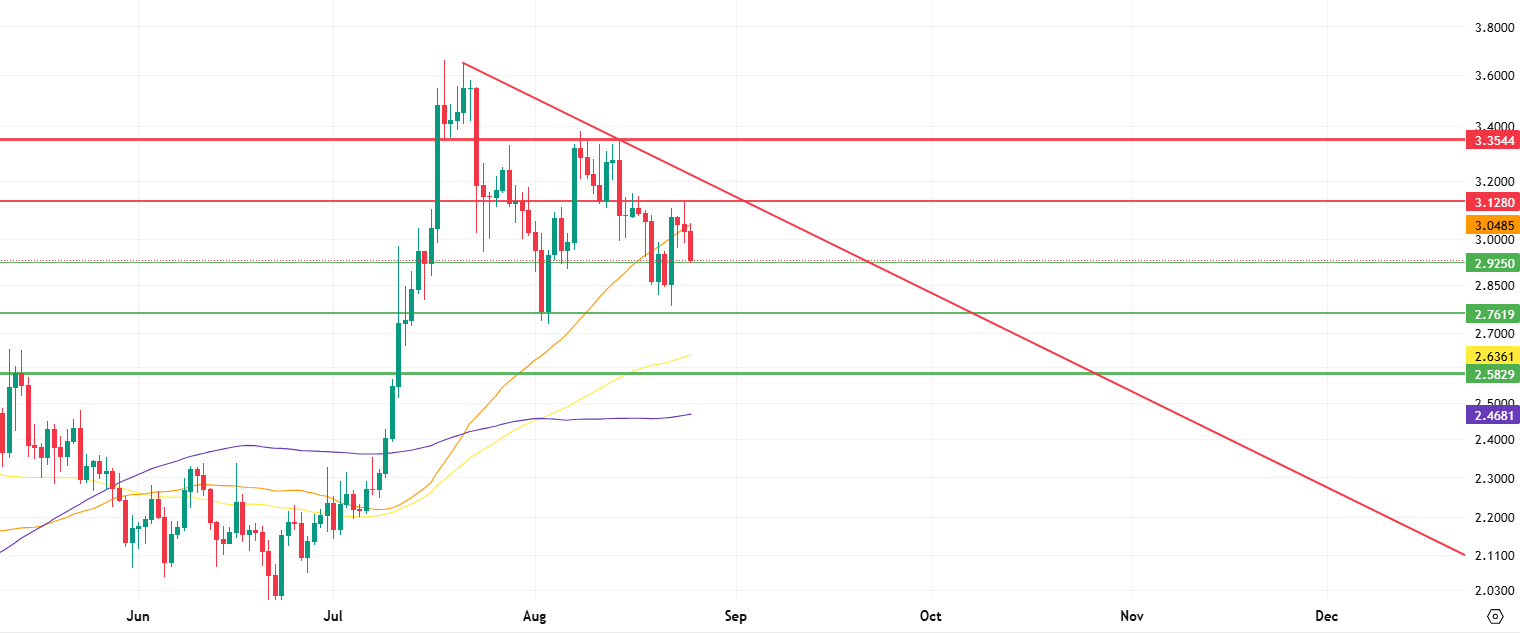
It ended last week with a 2% decline and entered the new week at 3.0259. XRP, which rose 1.37% against Bitcoin during the same period, can be said to have been less affected by the overall negative market movements. In terms of market capitalization, it maintains its 3rd place with $174.25 billion. In the futures market, there was a 0.84% increase in open positions compared to last week. Funding rates continue to trend positively.
When examining the technical analysis on the chart, it can be seen that the 50-period moving average (orange line) has broken above the price, creating negative pressure. With this selling pressure, the 2.9250 level stands out as the first support level. Below this level, the 2.7619 support level stands out as a relatively stronger support position. In the final stage, the 2.5829 level, located between the 100-period moving average (yellow line) and the 200-period moving average (purple line), is considered a major support zone.
Contrary to downward movements, the first possible sell wave in upward accelerations may occur at the 3.1280 level. This region is a critical resistance position in terms of the trend’s continuity. Above the 3.1280 level, the downward trend line passing through the 3.2124 level is being followed. If this trend is broken, the price is expected to rise rapidly to the 3.3544 level. At this level, the upward movement may slow down or a return to the trend line for retesting purposes may come into play.
Support levels: 2.925 – 2.7619 – 2.5829
Resistances: 3.1280 – 3.2124 – 3.3544
SOL/USDT
Last week in the Solana ecosystem;
- Solana’s community is preparing to vote on Alpenglow (SIMD-0326), which could redefine the network’s performance and scalability.
- 1inch introduced Solana integration for cross-chain swaps.
- Rapper Kanye West launched the Solana-based meme coin ‘YZY’.
- Crypto investment firm SOL Strategies disclosed that it currently holds slightly over 400,000 Solana tokens in its treasury.
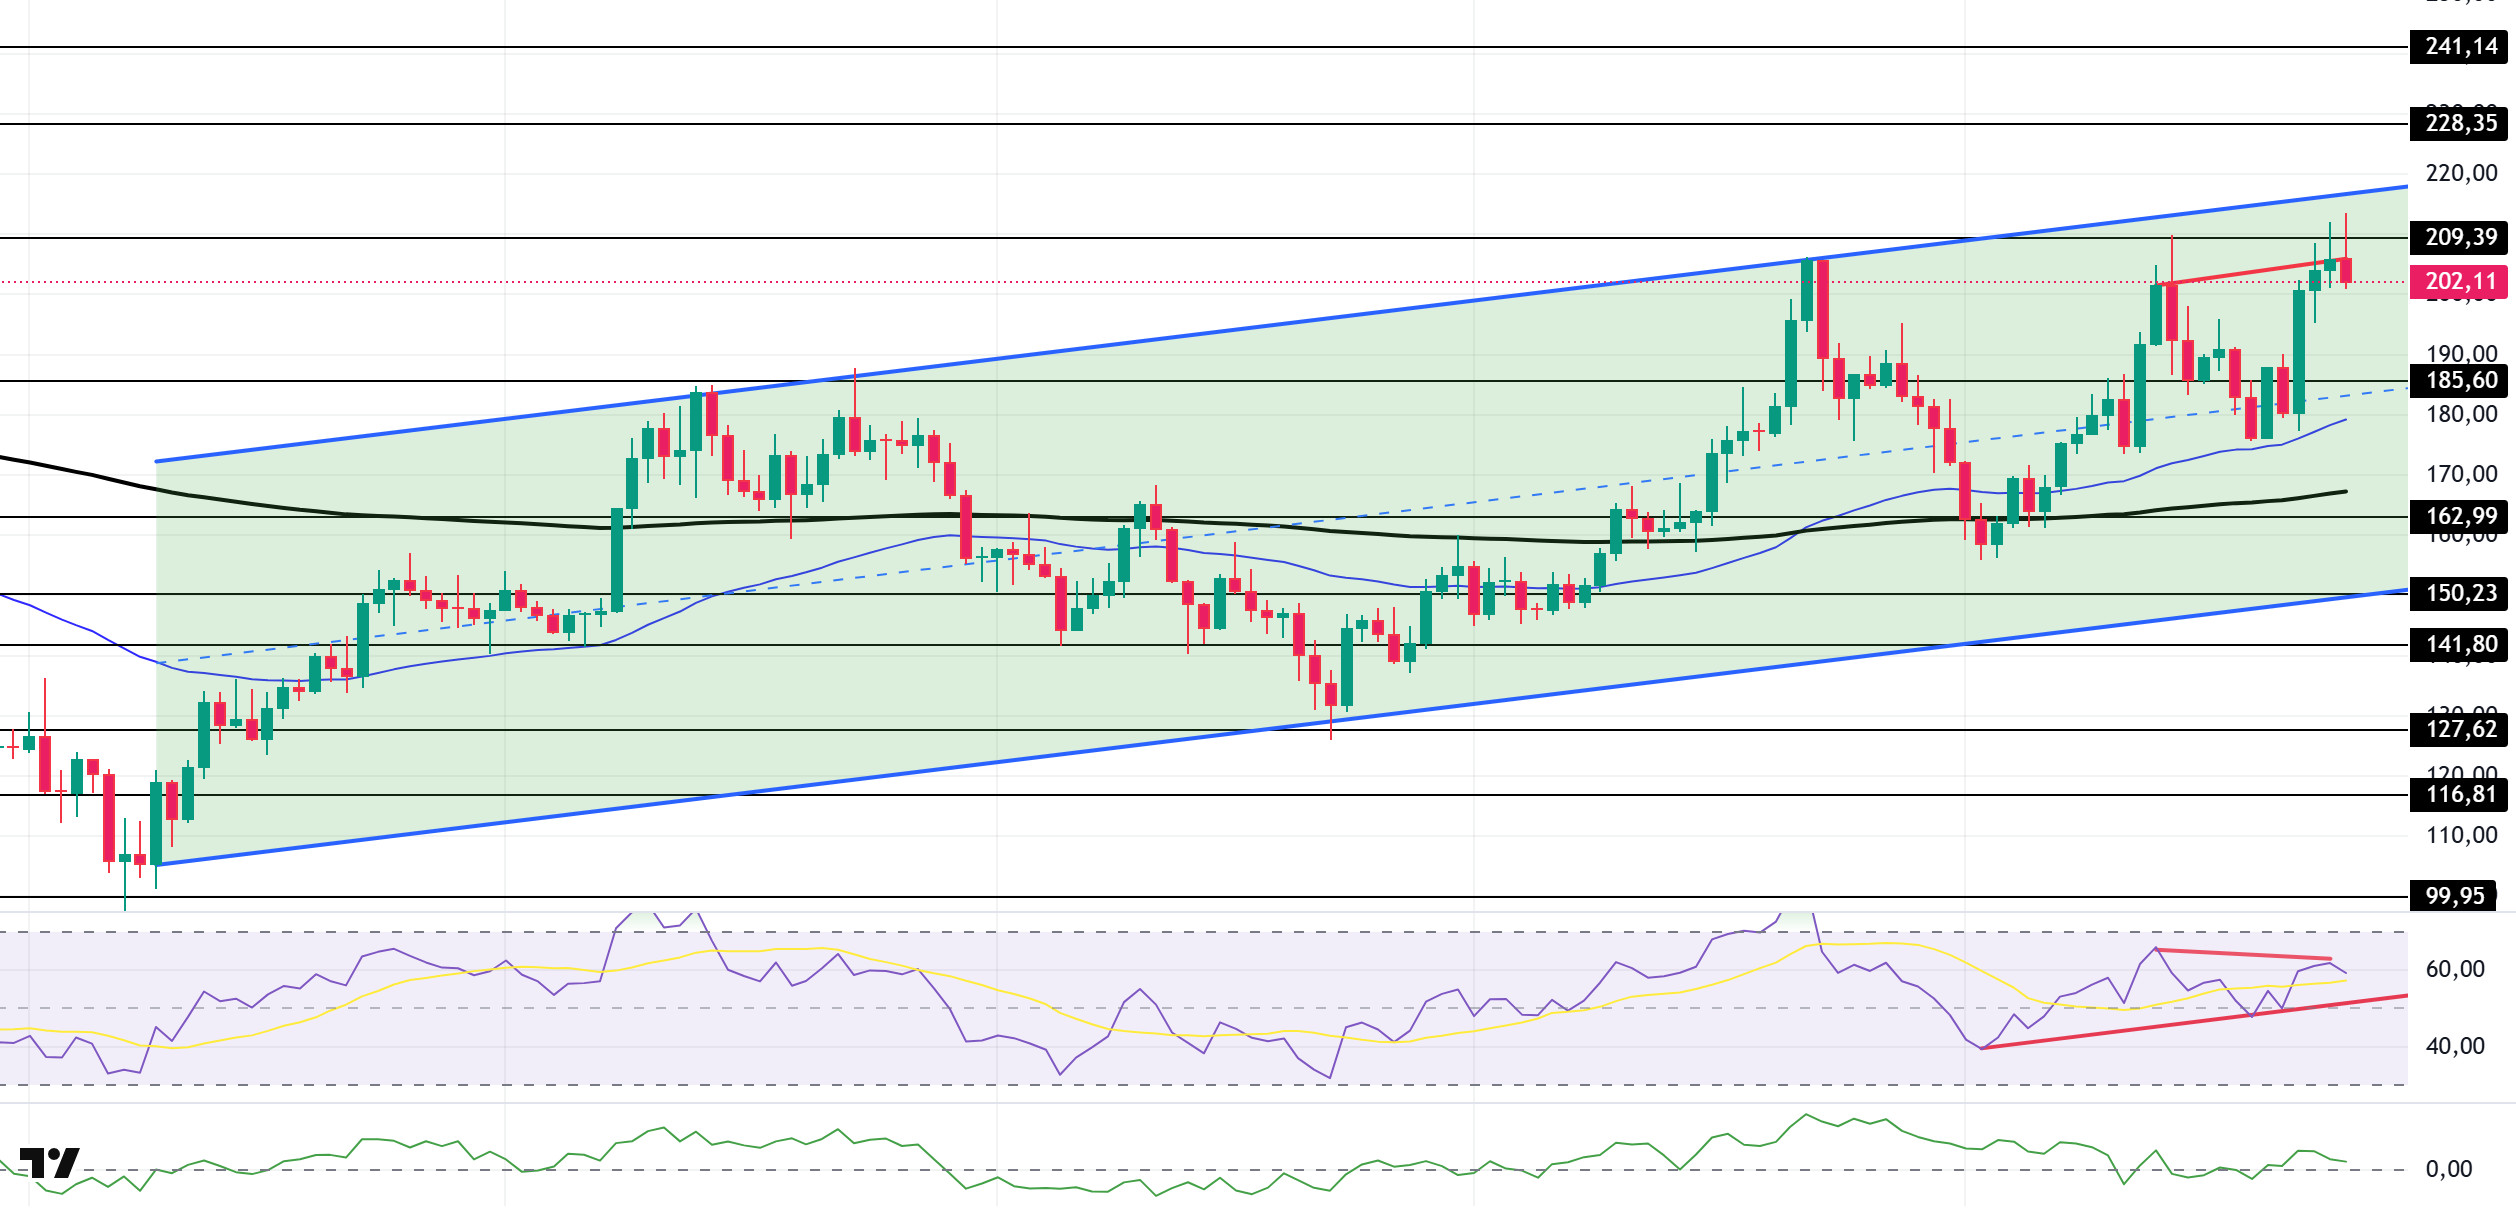
The SOL price has risen by approximately 11% this week. The asset continues to trade near the peak levels of the upward trend that began on April 9. The price tested the strong resistance level at $209.39 but failed to break through, resulting in a pullback. As of now, the asset is continuing its downward trend and may test the 50 EMA (Exponential Moving Average – Blue Line) moving average. On the upside, the $228.35 level is worth monitoring.
The asset is trading above the 50 EMA and 200 EMA (Black Line) moving averages, indicating that the asset is in an uptrend. In addition, the 50 EMA remaining above the 200 EMA indicates the continuation of a “golden cross” formation from a technical perspective. This indicates that the medium-term upside potential continues. On the other hand, the wide gap between the two moving averages increases the likelihood of a sideways movement or a decline. The RSI (14) is in the positive zone. Additionally, the indicator has remained above the upward trend that began on August 2. This indicates that buying pressure is continuing. However, a negative divergence could lead to a pullback. Chaikin Money Flow (CMF-20) is in the positive zone; however, a decrease in money inflows could push the CMF-20 indicator into the negative zone. If macroeconomic data continues to perform well and developments in the ecosystem remain positive, the first major resistance level of $228.35 could be tested again. Conversely, in the event of potential negative news flow or deterioration in macro data, the $185.60 level could be monitored as a potential buying opportunity.
Support levels: 185.60 – 162.99 – 150.23
Resistance Levels: 209.39 – 228.35 – 241.14
DOGE/USDT
- Dogecoin Foundation director Timothy Stebbing outlined his vision for RadioDoge, a Dogecoin-based project aimed at improving financial inclusion for unbanked individuals.
- The SEC has delayed its decision on Grayscale’s spot DOGE ETF.
- Thumzup plans to acquire Dogehash through a stock deal expected to be finalized by the end of this year.
- Grayscale and Bitwise have filed an application with the SEC for a spot Dogecoin ETF.
- Dogecoin Foundation director Timothy Stebbing outlined his vision for RadioDoge, a Dogecoin-based project committed to improving financial inclusion for unbanked individuals.
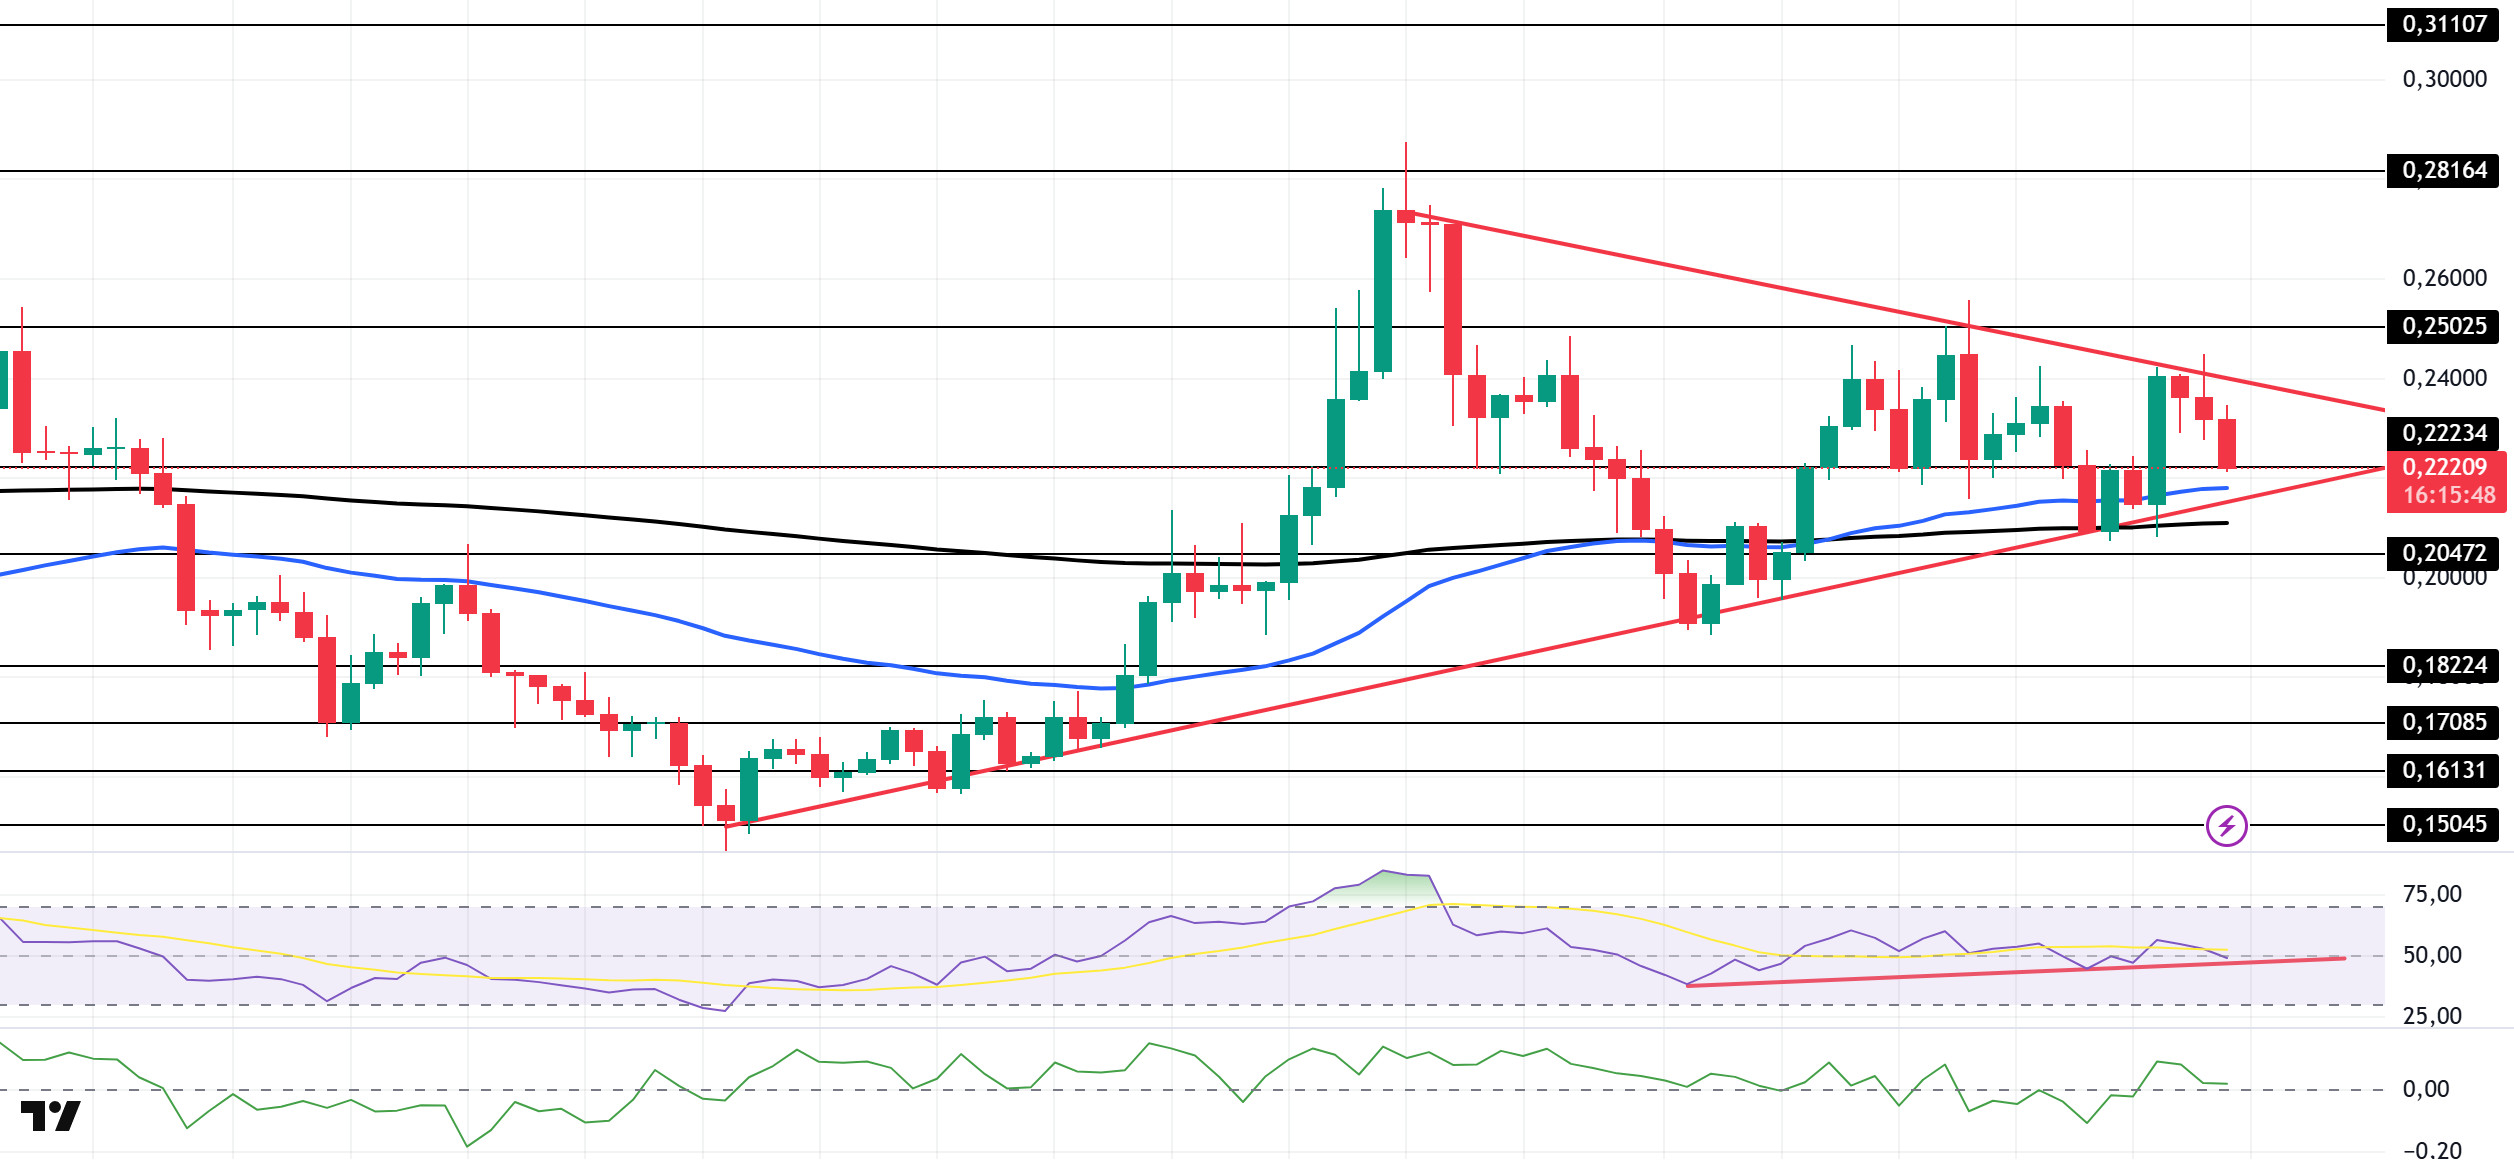
DOGE has been on a steady course on the daily chart since last week. The price tested the ceiling level of the symmetrical triangle formation that began on July 21 for the second time, but failed to break through and retreated, remaining within the formation. The price, which has experienced a pullback, could test the 0.22234 dollar level and the 200 EMA (Exponential Moving Average – Black Line) as support if the pullback continues. If the price closes below the 0.22234 dollar level, the downtrend could continue to . In the event of an upward movement, the 0.25025 dollar level can be monitored as resistance.
The asset continues to trade above the 50 EMA (Blue Line) and 200 EMA moving averages. This indicates that the asset is in an upward trend. On the other hand, the 50 EMA remains above the 200 EMA, indicating that the “golden cross” formation is continuing. This suggests that upward pressure could persist in the medium term. The Chaikin Money Flow (CMF–20) indicator is in positive territory. However, money inflows continue to decline. This could push the CMF-20 into negative territory. Looking at the Relative Strength Index (RSI-14) indicator, it is at a neutral level. On the other hand, it continues to remain above the upward trend that has been ongoing since August 2, indicating that buying pressure continues. However, as of now, the indicator is testing this trend as support, and if it breaks below this level, it could face selling pressure. In the event of macroeconomic risks or negative news from the ecosystem, the $0.20472 level can be monitored as a strong support. On the other hand, if the upward movement gains strength, the $0.25025 level comes to the fore as the first strong resistance level.
Support levels: 0.22234 – 0.20472 – 0.18224
Resistances: 0.25025 – 0.28164 – 0.31107
TRX/USDT
According to a study conducted last week, TRON was identified as the most widely used blockchain for stablecoin transfers in 35 out of 50 countries analyzed (including countries in Asia, Africa, and Latin America).
Over the past week, the TRON network generated a total of $103.3 million in revenue, continuing to be the highest-earning ecosystem among all blockchain networks. This increase was driven by stablecoin transfers on the TRON network and user engagement in the DeFi sector.
Between August 18 and 24, 2025, a total of 41 million TRX were burned on the TRON network. As a result, the circulating supply decreased by 13.5 million. The decrease in circulating supply continues to exert deflationary pressure on TRX. Additionally, the total number of addresses increased by 1.3 million to reach 327.7 million during the same week.
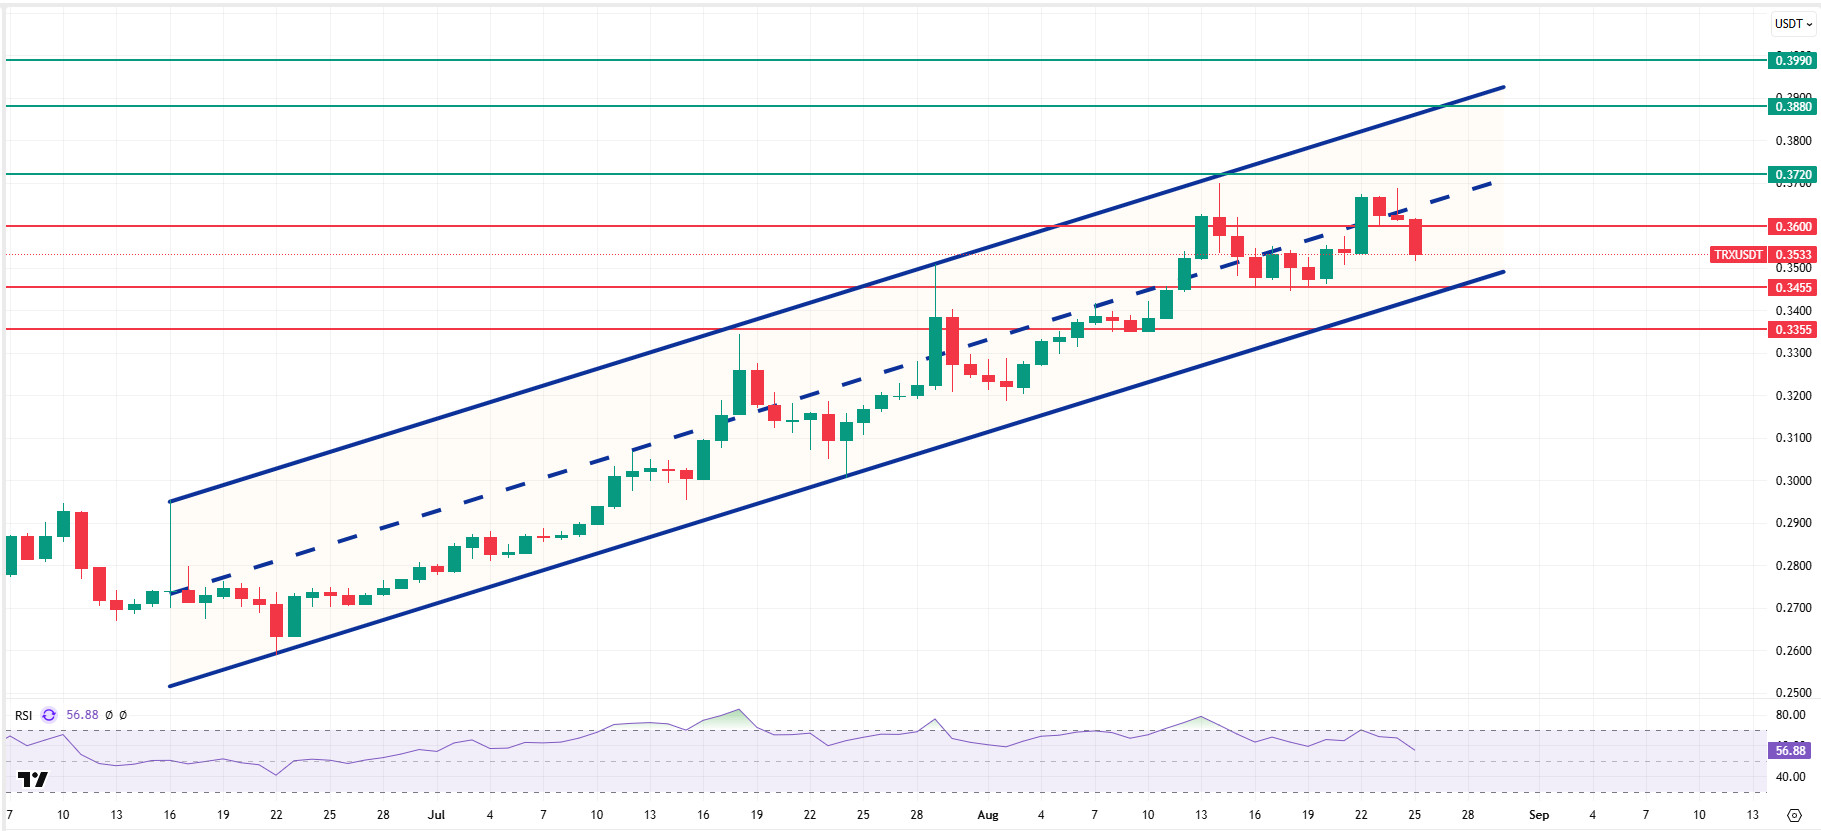
TRX, which started the week at 0.3534, rose by approximately 2.5% during the week and closed at 0.3616. This marks the ninth consecutive week of gains, bringing the market cap to $34.22 billion. Currently trading at 0.3533, TRX is below the middle band of the bullish channel on the daily chart. The Relative Strength Index (RSI) value is observed at 56. Considering its position within the bullish channel and the RSI indicator, TRX prices may rebound from the 0.3455 support level and resume an upward trend. This could indicate a move toward the middle and upper bands of the bullish channel. In such a scenario, it may test the 0.3720 resistance level. If it closes above the 0.3720 resistance level on a daily basis, it may test the 0.3880 resistance level. If it fails to close above the 0.3720 resistance level on a daily basis and the bearish sentiment in the market persists, it is expected to decline due to potential selling pressure from this area. In such a scenario, it may move toward the lower band of the bullish channel and test the 0.3355 resistance level. The 0.3355 level is an important support on the daily chart, and as long as it remains above this level, the upward momentum is expected to continue. A break below this support could increase selling pressure.
Support levels: 0.3600 – 0.3455 – 0.3355
Resistance levels: 0.3720 – 0.3880 – 0.3990
AVAX/USDT
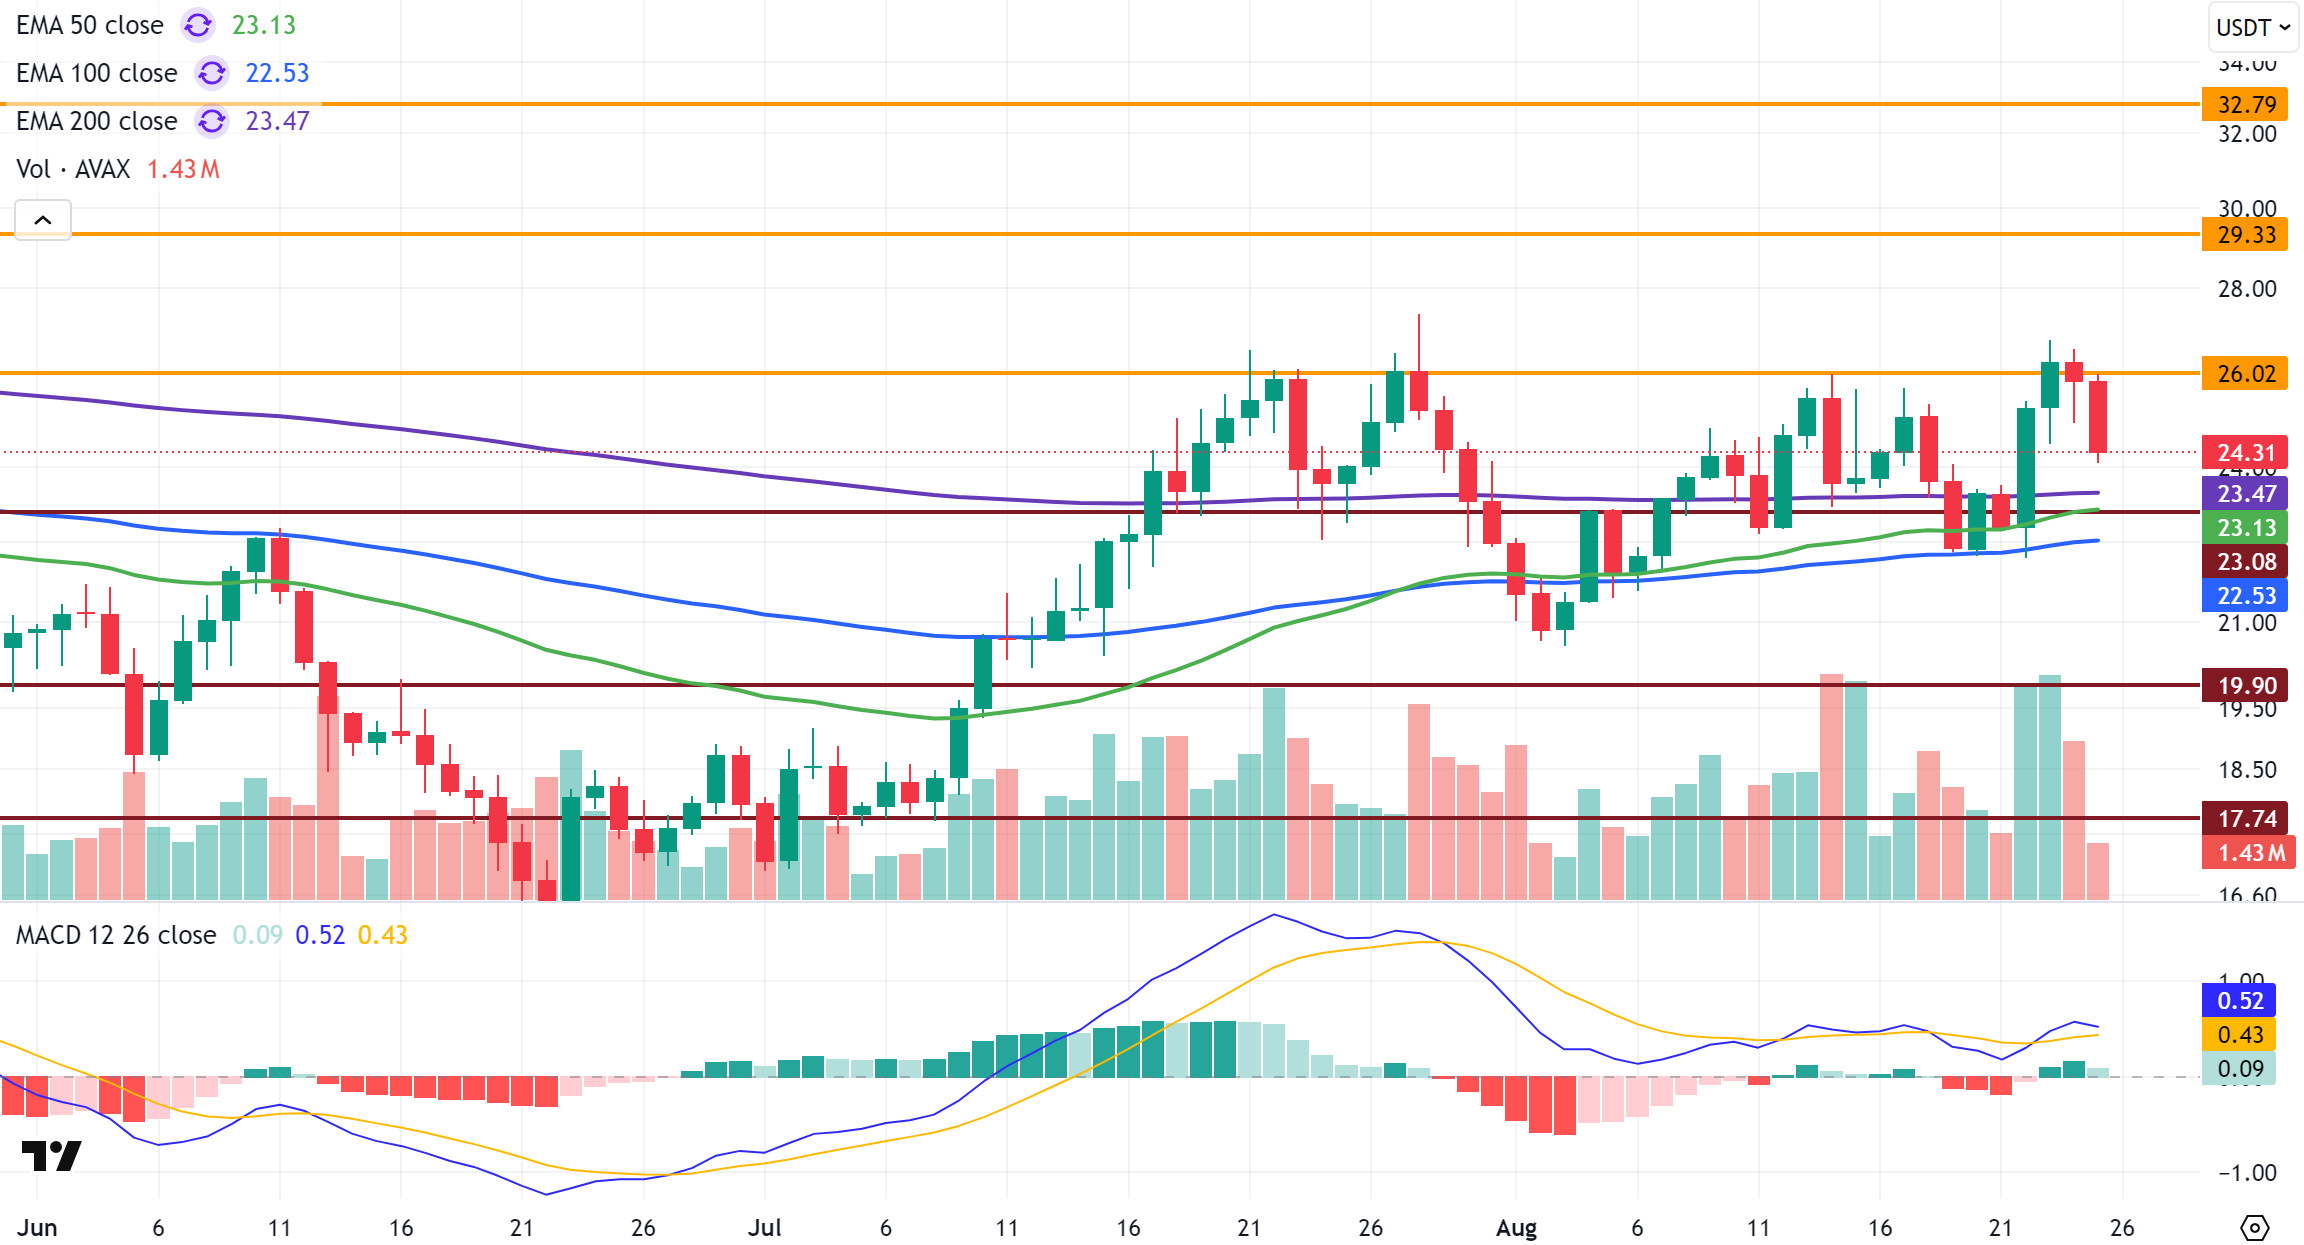
AVAX, which started the week at $25.06, saw an approximate 3% increase in value, closing the week at $25.82. On the ecosystem side, Avalanche gained significant momentum at the corporate and government levels. SkyBridge Capital took a step toward tokenizing its funds on Avalanche with a value of $300 million through Tokeny, while the State of Wyoming launched the first US government-backed stablecoin on the Avalanche platform. These steps demonstrated that AVAX is being preferred for regulated use. Additionally, the daily transaction count surpassing 1.5 million, the Octane update significantly reducing transaction fees, and DeFi TVL crossing the $2 billion threshold all indicated the ecosystem’s growing strength. Following this positive development and the subsequent rise, AVAX fell below the critical $26.02 level during the sharp sell-off of major coins in the cryptocurrency market on the closing day of last week. This level stands out as a strong resistance for AVAX, and even if it is broken, the inability to sustain the breakout will bring selling pressure. Indeed, AVAX started the new week with a decline and quickly lost over 5% of its value, dropping to the $24 level. Although it continues to trade above critical Exponential Moving Average (EMA) levels, it lacks a strong positive momentum for an upward trend.
On the daily chart, the Moving Average Convergence/Divergence (MACD) line, which crossed above the signal line during the uptrend, has lost momentum due to the recent selling pressure and is about to cross the signal line. If a downward crossover occurs, this could lead to a deeper decline in AVAX.
In the coming period, if AVAX manages to stay above the $26.02 level, it could start a new upward trend. In this case, the resistance levels of $29.33 and $32.79 could come into play. Breaking these levels would strengthen the upward momentum. On the other hand, if AVAX fails to hold above $26.02 and selling pressure increases, the price may first test the EMA200 and $23.08 support levels. If there are closes below these levels, the pullback could accelerate, with the $19.90 and $17.74 support levels coming into focus. Overall, AVAX continues to trade above critical EMA levels and the MACD is in positive territory. However, it lacks strong positive momentum to capture upward momentum, and selling pressure could emerge unless it manages to hold above the critical $26.02 resistance level.
(EMA50: Green Line, EMA100: Blue Line, EMA200: Purple Line)
Support levels: 23.08 – 19.90 – 17.74
Resistance Levels: 26.02 – 29.33 – 32.79
SHIB/USDT
The Shiba Inu ecosystem stood out this week with flexibility in its governance architecture, clarification of the LEASH v2 framework in its token economy, and expanded DeFi bridging capabilities on Shibarium. On the community side, Doggy DAO introduced flexible voting strategies, offering stakeholders staking-based, token-based, and quadratic voting options, while preparations for an identity-based model continued. This established a corporate framework aimed at increasing participation and limiting whale influence. Meanwhile, a short-term normalization in on-chain activity was observed. Shibarium’s daily transactions retreated after reaching previous highs but quickly showed signs of recovery. A single day of noticeable weakness in the burn rate created a temporary pause in the deflation narrative, but developer updates and ecosystem news flow supported the medium-term outlook.
Momentum has increased on the product and infrastructure front. K9 Finance DAO launched the BoneCrusher v3 upgrade for its liquid staking product, opening new pools for knBONE and updated BONE pairs with KNINE, and announced that existing pools will be gradually closed and emission parameters will become adjustable. In the cross-chain layer, Hoichi’s Torii Gateway solution strengthened Shibarium’s connection to external ecosystems with bridging support for dozens of networks and thousands of tokens. The roadmap includes expansion to non-EVM networks, ramp-up, and staking functionality. In the token economy, a security-focused design and ratio-based migration strategy for LEASH v2 has been finalized, with the migration contract unable to mint additional tokens, the supply held in multi-signature wallets, and the migration framed by snapshots of Uniswap V3 and ShibaSwap V2. A community vote is planned for timing and the fate of idle tokens, aiming to protect long-term holders. Exchange data remained strong. Bybit reported holding 2.94 trillion SHIB in its proof-of-reserves update, indicating sustained demand from both retail and institutional sides. On-chain data showed increased signals of large wallets withdrawing from exchanges, with these dynamics supporting a long-term accumulation theme amid price volatility.
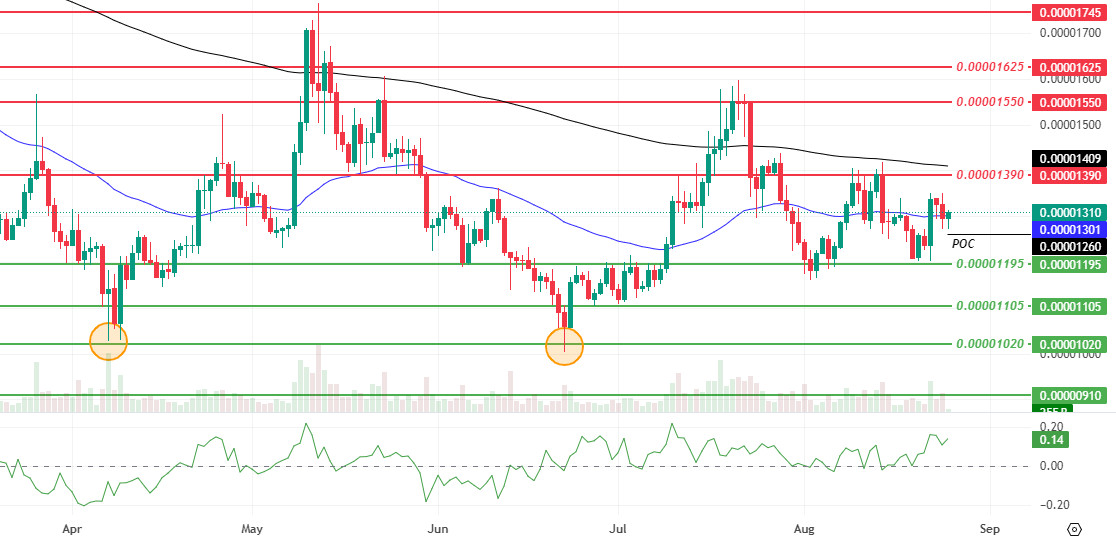
Technically, Shiba Inu has held above last week’s Point of Control (POC) level of $0.00001260 this week, showing signs of a short-term recovery. Following a rebound from the 0.00001195 dollar level, the price rose to around the 0.00001300 dollar level and is testing the 50-period Exponential Moving Average (EMA50) level. While momentum is increasing, there is a slight decline in trading volume and volatility, which may indicate that current upward attempts should be interpreted cautiously for now.
The Chaikin Money Flow (CMF) is in the positive zone, indicating that capital inflows are continuing. If the price remains above the EMA50 and closes above the 0.00001320 dollar level, attempts to move toward the 0.00001390 dollar resistance level could be seen. Above this level, the 0.00001550 dollar level and the 0.00001625 dollar level should be monitored. If the price dips below the 0.00001260 dollar level and closes below it, weakness could deepen toward the strong support level at 0.00001195 dollars. Below this level, the 0.00001105 dollar level and the 0.00001020 dollar level could emerge as potential target zones. The overall outlook suggests that the price may continue to fluctuate within the range of 0.00001260 and 0.00001390 dollars in the short term, with the possibility of an upward scenario emerging, albeit limited, if the price remains above the EMA50. (EMA50: Blue Line, EMA200: Black Line)
Support levels: 0.00001195 – 0.00001105 – 0.00001020
Resistance Levels: 0.00001390 – 0.00001550 – 0.00001625
LTC/USDT
LTC ended last week with a 2.09% decline, entering the new week at 118.18. During the same period, LTC appreciated 1.36% against Bitcoin, with its market value falling to approximately $8.5 billion and maintaining its position in the market size ranking at 20th place. In the futures market, there was no significant change in open positions compared to the previous week, and funding rates continued their positive trend.
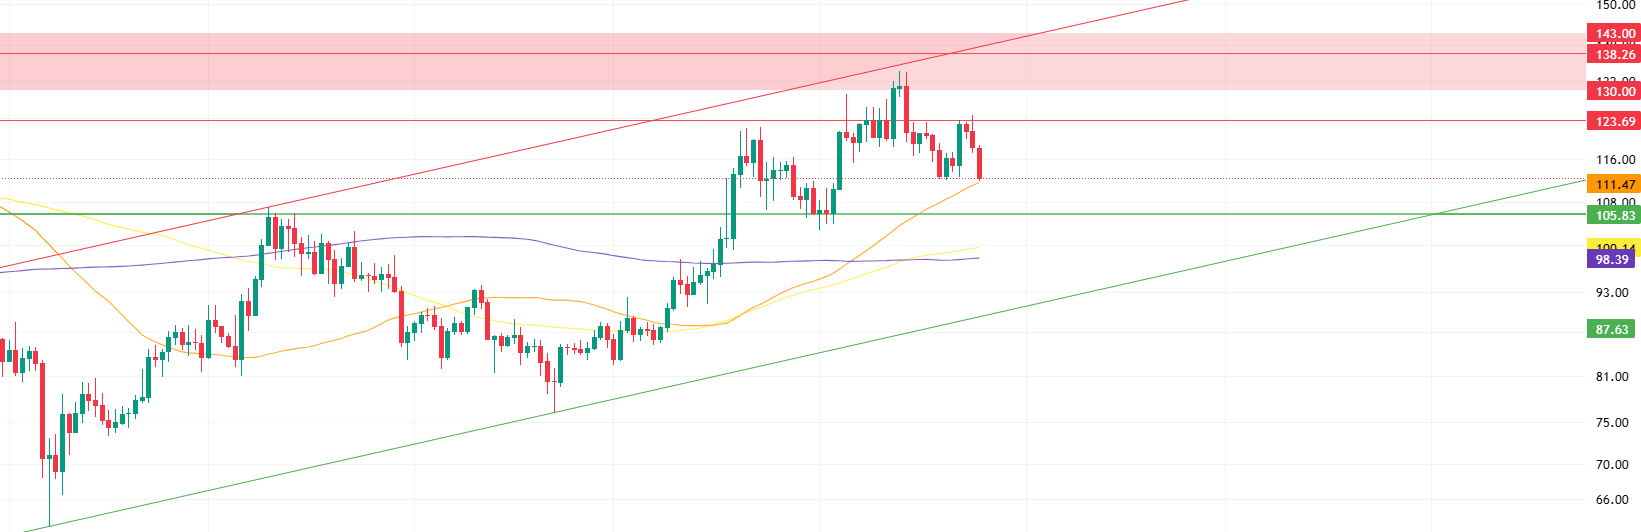
This week, Litecoin (LTC) continues to trade above all key short, medium, and long-term moving averages. The absence of any moving averages forming dynamic resistance above the price suggests that these averages could act as support levels in case of potential pullbacks. The first potential resistance level in upward movements is at 123.69. If this level is broken, the 130.00–143.00 range could be the next important resistance zone to watch. However, if the price reaches the rising trend upper band at 138.26 within this zone during the week, it is expected to further increase the selling pressure already concentrated in the red band range.
Meanwhile, on the technical indicators side, the Relative Strength Index (RSI) has been showing negative divergence since last week, continuing to put pressure on the price. This situation brings the possibility of a further pullback into focus. In this scenario, the first potential support is at the 50-day moving average (orange line) at the 111.48 level. In deeper declines, the horizontal support at the 105.83 level can be monitored. Finally, the 100.15 level, formed by the overlap of the 100-day (yellow line) and 200-day (purple line) moving averages, constitutes an important level where potential support can be found. The best buying opportunity may come from the lower band of the rising channel.
Support levels: 111.48 – 105.83 – 100.15
Resistance levels: 123.69 – 130.00 – 138.26
BNB/USDT
This week, the PLUME and LAYER projects have been listed on Binance Launchpool in the BNB ecosystem. These listings are expected to have a generally positive impact on the price of BNB, as they are likely to increase demand for BNB used in transaction fees and reduce the circulating supply through BNB staking.
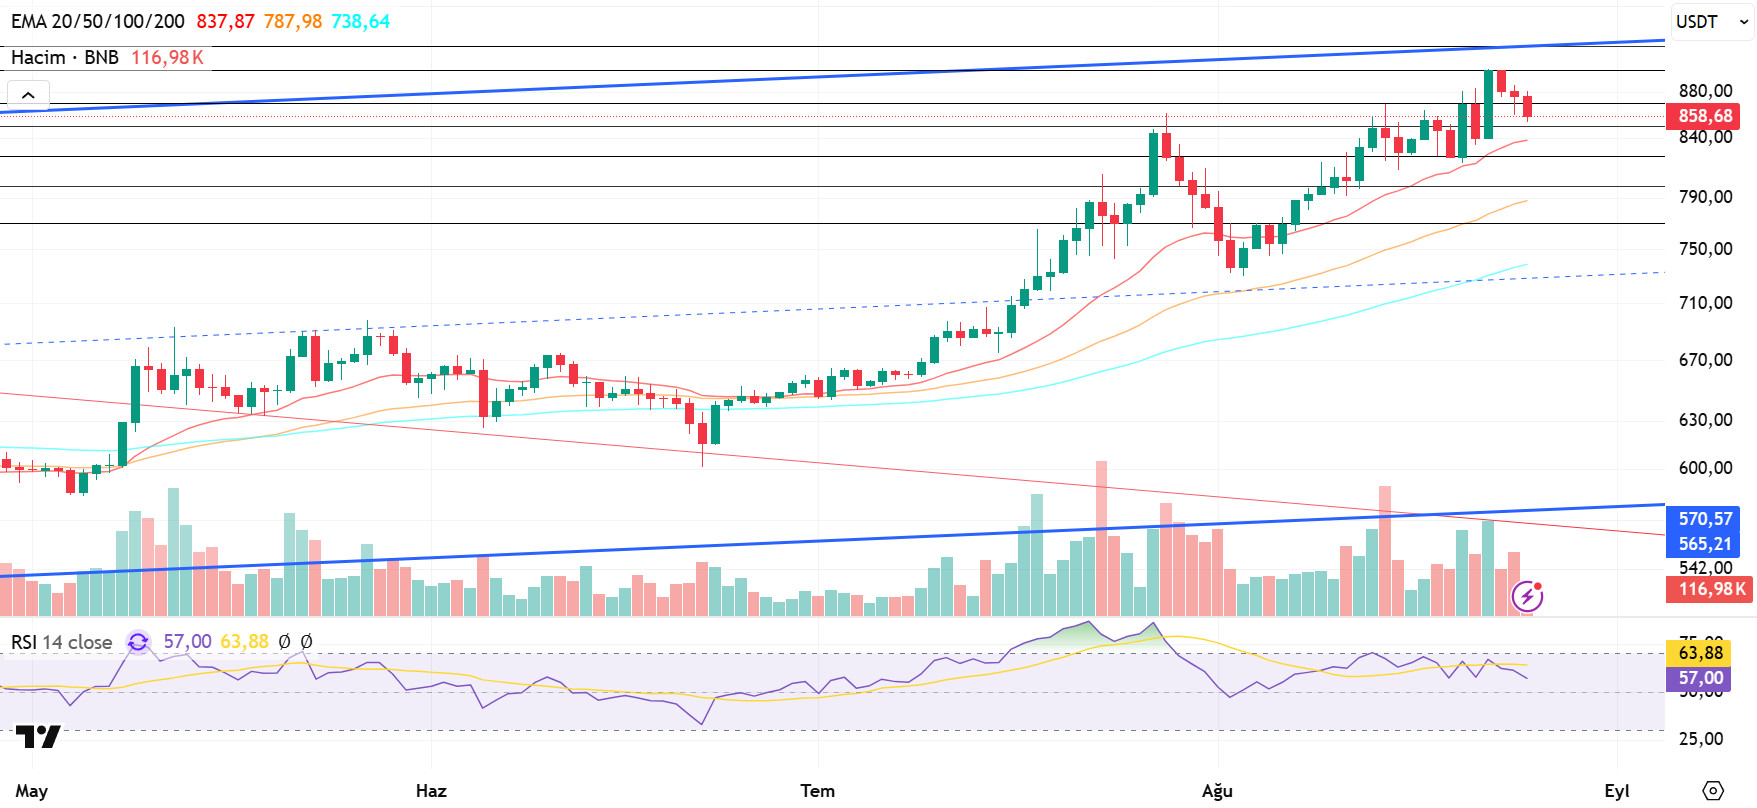
From a technical perspective, BNB/USDT retreated slightly last week, influenced by the negative market sentiment, dropping to the $825 level. However, with support buying at these levels, the pair began to show a positive outlook from mid-week and rose to our previous target level of $900. Profit-taking at this level has put pressure on the price. Entering the new week, BNB started negatively, falling below $870 and following a downward trend.
Currently trading in the $850–870 range, technical indicators for BNB/USDT show a weak and negative trend in trading volume in recent periods. This indicates an increase in selling appetite across the market. On the other hand, the Relative Strength Index (RSI) has reversed twice from the 70 level and turned downward. This technical structure suggests that negative trends could gain momentum in the short term.
Within the current technical outlook, if the negative momentum persists, the BNB price is expected to test the 850 dollar support level initially. A break below this level could lead to the next critical support zones at 825 and 800 dollars, respectively. On the other hand, if the 850 dollar support level holds and buying interest increases, the price may once again target the 870 dollar resistance level. If this resistance is broken to the upside, the 900 and 920 dollar levels will become the next key resistance points to watch.
Support levels: 850 – 825 – 800
Resistance Levels: 870 – 900 – 920
LINK/USDT
On August 18, 2025, approximately 2,995 new wallets were registered on the Chainlink network, indicating a significant increase in user interest. Additionally, the Chainlink Reserve program was launched in August, causing a reduction in supply by removing LINK from the market and locking it for an extended period. On the corporate front, the notable development was Chainlink’s strategic partnership with Japan-based SBI Group. Under this collaboration, SBI plans to develop blockchain solutions using Chainlink’s infrastructure for areas such as the tokenization of assets like real estate and government bonds, cross-border payments, and fund-based net asset value calculations.
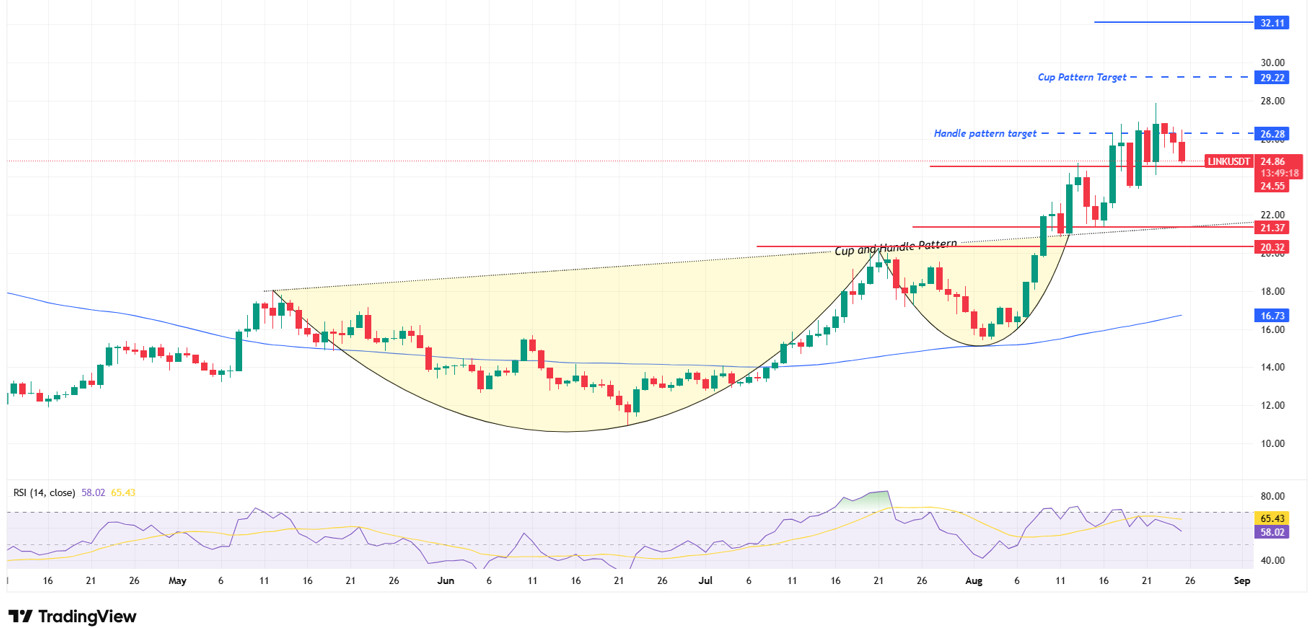
LINK rose by approximately 38% to reach $27.87 after breaking out upward from a cup and handle formation on August 9, but encountered selling pressure at this level and fell back to our first support level of $24.55. In a potential downward scenario, the first strong support area stands out as the current price levels of $24.55–$24.86. This region could play a critical role in stabilizing the price in the short term. However, daily closes below this level could increase selling pressure, paving the way for the price to retreat back to the $21.37 level. In deeper corrections, the 20.32 dollar level is the most critical support position in the medium term. This level should be closely monitored as its loss could lead to a breakdown in the formation structure.
In an upward scenario, the price remaining above the $26.28 level is also a key point for upward movement. If daily closes come above this level, the formation’s target of $29.22 will come into focus in the first stage. If this level is broken, the possibility of an upward movement toward 32.11 dollars in the medium term will come to the fore. Although our Relative Strength Index (RSI) indicator is at 58, indicating that we are still in the positive zone, a break of the support levels mentioned above could push us into the negative zone, potentially leading to a loss of momentum and increased selling pressure.
Support levels: 25.55 – 21.37 – 20.32
Resistance levels: 26.28 – 29.22 – 32.11
SUI/USDT
The SUI network started the new week quite strongly with both technological updates and interest from institutional investors. In particular, the recent increase in trading volumes and activity in the developer community show that Sui is not just experiencing temporary popularity, but rather that the ecosystem has entered a period of sustained growth. The launch of the Sui Name Service ($NS) project, a staking platform where users can earn rewards by locking their tokens, is planned for the end of August 2025. This could have a positive impact on the price by reducing the circulating supply. Additionally, the company Matrixdock has launched a gold-backed token called XAUm on the Sui network. The Sui Foundation’s support for this project with its treasury funds stands out as a sign of strategic vision. With this move, the foundation is not only diversifying the Sui ecosystem but also aiming to build a bridge between traditional finance and crypto finance by gaining the trust of institutional capital. All these developments clearly highlight the dynamics that are strengthening Sui’s future potential. Both community-driven projects and innovations supported at the corporate level demonstrate that the network is maturing not only technically but also in terms of its financial infrastructure. If this momentum continues, the Sui ecosystem could become a key hub for both DeFi investments and corporate integration in the coming period.
Following recent developments, when we look at Sui’s technical outlook, the price has declined on a weekly basis to around $3.59, influenced by fundamental developments. The Relative Strength Index (RSI) is currently in the 47.84–49.97 range. This value range indicates that the market is close to the selling zone; however, if the RSI weakens and falls to the 35.00–40.00 range, it could signal a potential buying point. If the price moves upward, the resistance levels of 4.28, 4.80, and 5.36 dollars can be monitored. However, if the price retreats to new lows, it could indicate that selling pressure is intensifying. In this case, the 3.35 and 2.80 dollar levels stand out as strong support zones. Especially when considering the trend line, a pullback to 2.80 dollars is technically possible. According to Simple Moving Averages (SMA) data, Sui’s average price is currently at 3.61 dollars. If the price remains above this level, it indicates that the current upward trend for could technically continue. The upward trend of the SMA also supports this scenario.
Support levels: 1.91 – 2.80 – 3.35
Resistance levels: 4.28 – 4.80 – 5.36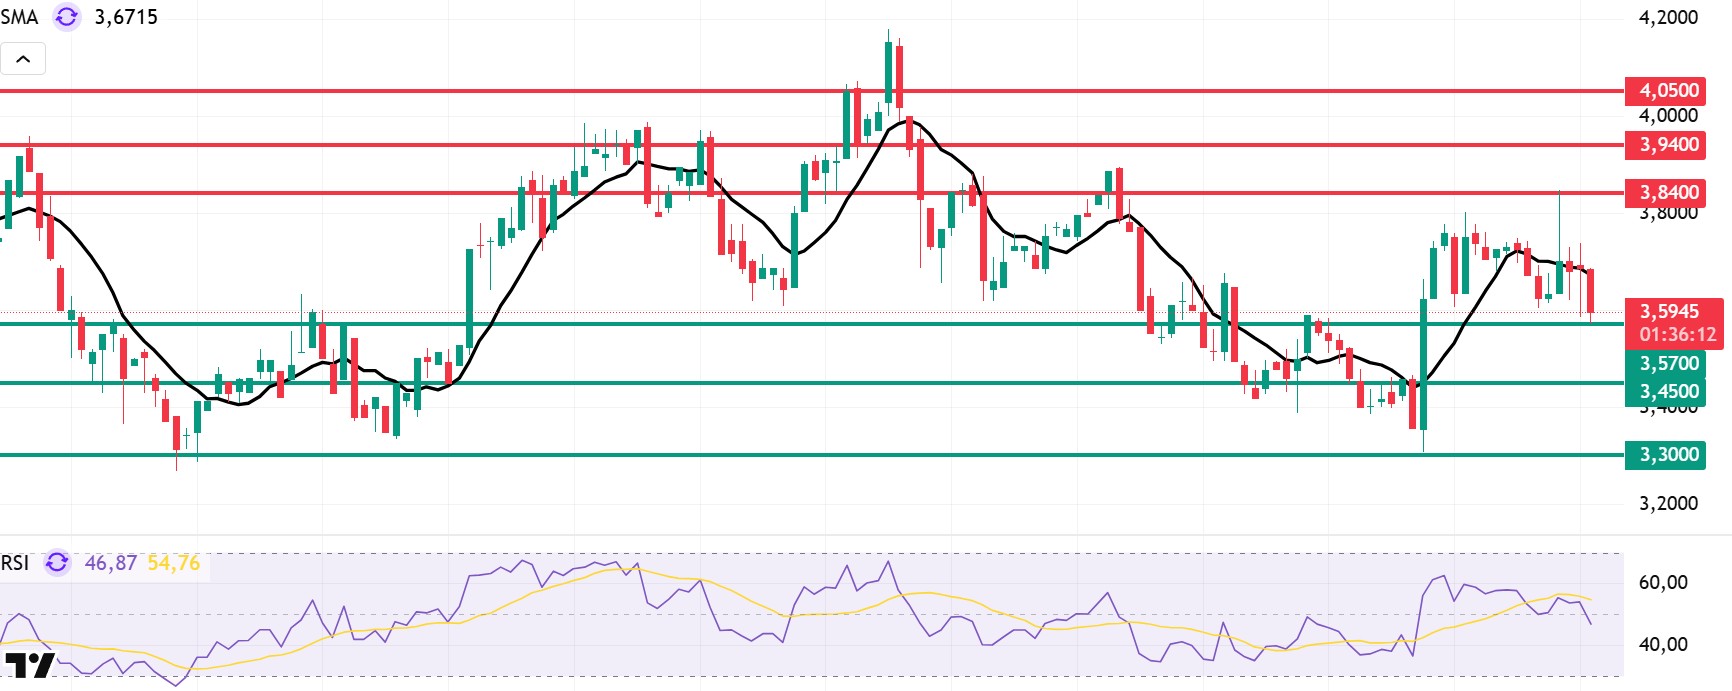
ADA/USDT
Although ADA rose briefly last week following the Fed’s remarks at the Jackson Hole meeting, the negative trend in cryptocurrencies continues to weigh on ADA prices. In the Cardano network, long-term expectations were bolstered by increasing futures trading volume, the possibility of ETF approval, and rising Total Value Locked (TVL) values, which strengthened expectations for a new rally for ADA. However, ADA prices retreated after rising by 37% in August. Cardano’s TVL value on July 1 increased by 56% from $271 million to $423.6 million, reaching its highest level since March. However, the decline in TVL and ADA futures trading volume in August negatively impacted the price, resulting in a 5% drop this week. The total stake pool reached 2,756, increasing the daily stake volume to $21.82 billion. The number of holders also increased, reaching 3,108,385, with 1,420,000 of them staked. Although the number of transactions in the last blocks remained low at 5-7, the transaction volume remained between 137,000 and 617,000, maintaining its upward trend. This indicates that large wallet movements, staking transactions, or DeFi flows are active.
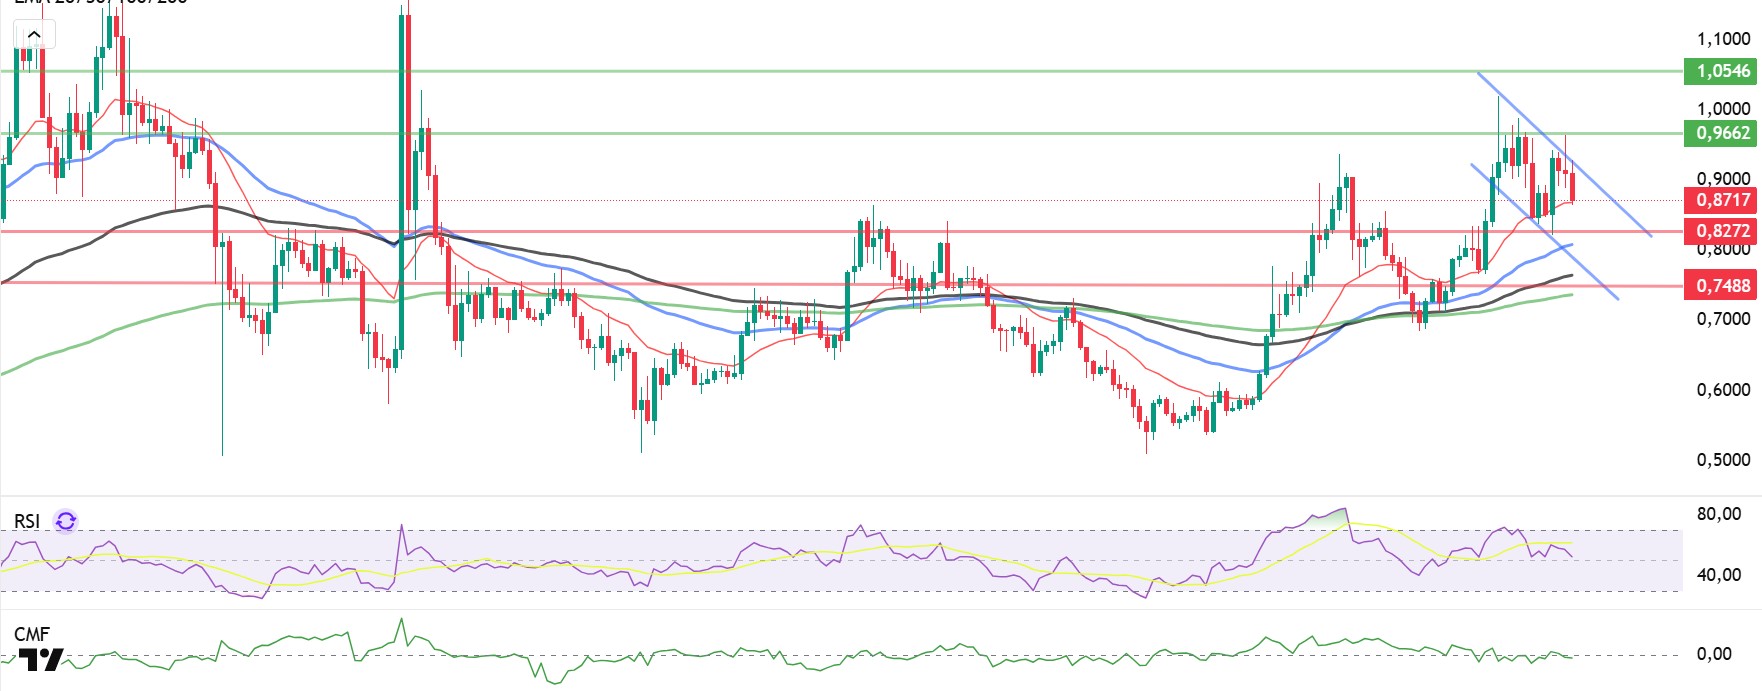
Technically, the price tested the resistance level of 1.0178 last week and managed to stay above the 0.9017 level. The EMA 20 (Red Line) remains below the price, indicating that the upward trend potential is still intact. The chart shows that the price remains above the 50 and 100-day Exponential Moving Averages (EMA-Blue Line) and (EMA-Black Line), indicating that buyers are gaining strength. The Relative Strength Index (RSI) has risen to 53 levels, continuing its movement close to the buy zone, while the Chaikin Money Flow (CMF-20) has risen to 0.2 levels, indicating a possible buy signal. The increase in money inflows could keep the CMF in the positive zone and have a buy-side effect. , this week’s macroeconomic data releases or positive news related to the Cardano ecosystem could bring the 1.0255 dollar level into focus as a strong resistance point. In the event of a decline, the 0.8379 level will be the key support level to watch.
Support levels: 0.8444 – 0.8379 – 0.7378
Resistances: 1.0255 – 1.0237 – 0.9447
Legal Notice
The investment information, comments, and recommendations contained in this document do not constitute investment advisory services. Investment advisory services are provided by authorized institutions on a personal basis, taking into account the risk and return preferences of individuals. The comments and recommendations contained in this document are of a general nature. These recommendations may not be suitable for your financial situation and risk and return preferences. Therefore, making an investment decision based solely on the information contained in this document may not result in outcomes that align with your expectations


