
BTC/USDT
Last week, we followed an intense agenda in the global economy, diplomacy, and digital asset markets. While the US and China reached an agreement on a preliminary framework agreement to be submitted for approval by their leaders in the long-standing trade dispute, Washington launched a Section 301 investigation during the same period, citing Beijing’s failure to comply with its 2020 trade commitments. The Trump administration suspended trade talks with Canada, while the Russia-Ukraine peace process remained uncertain despite Europe’s cautious support. On the macro front, the US core CPI data came in below expectations, reinforcing the cooling trend in inflation and increasing expectations of a possible Fed rate cut. On the crypto side, despite weekly net outflows exceeding $500 million, companies such as Strategy and The Smarter Web Company continued to buy Bitcoin, albeit at a limited pace. JPMorgan’s decision to accept BTC and ETH as collateral for corporate loans and iShares’ launch of a new Bitcoin ETP stood out as important steps accelerating the integration of traditional finance and crypto.
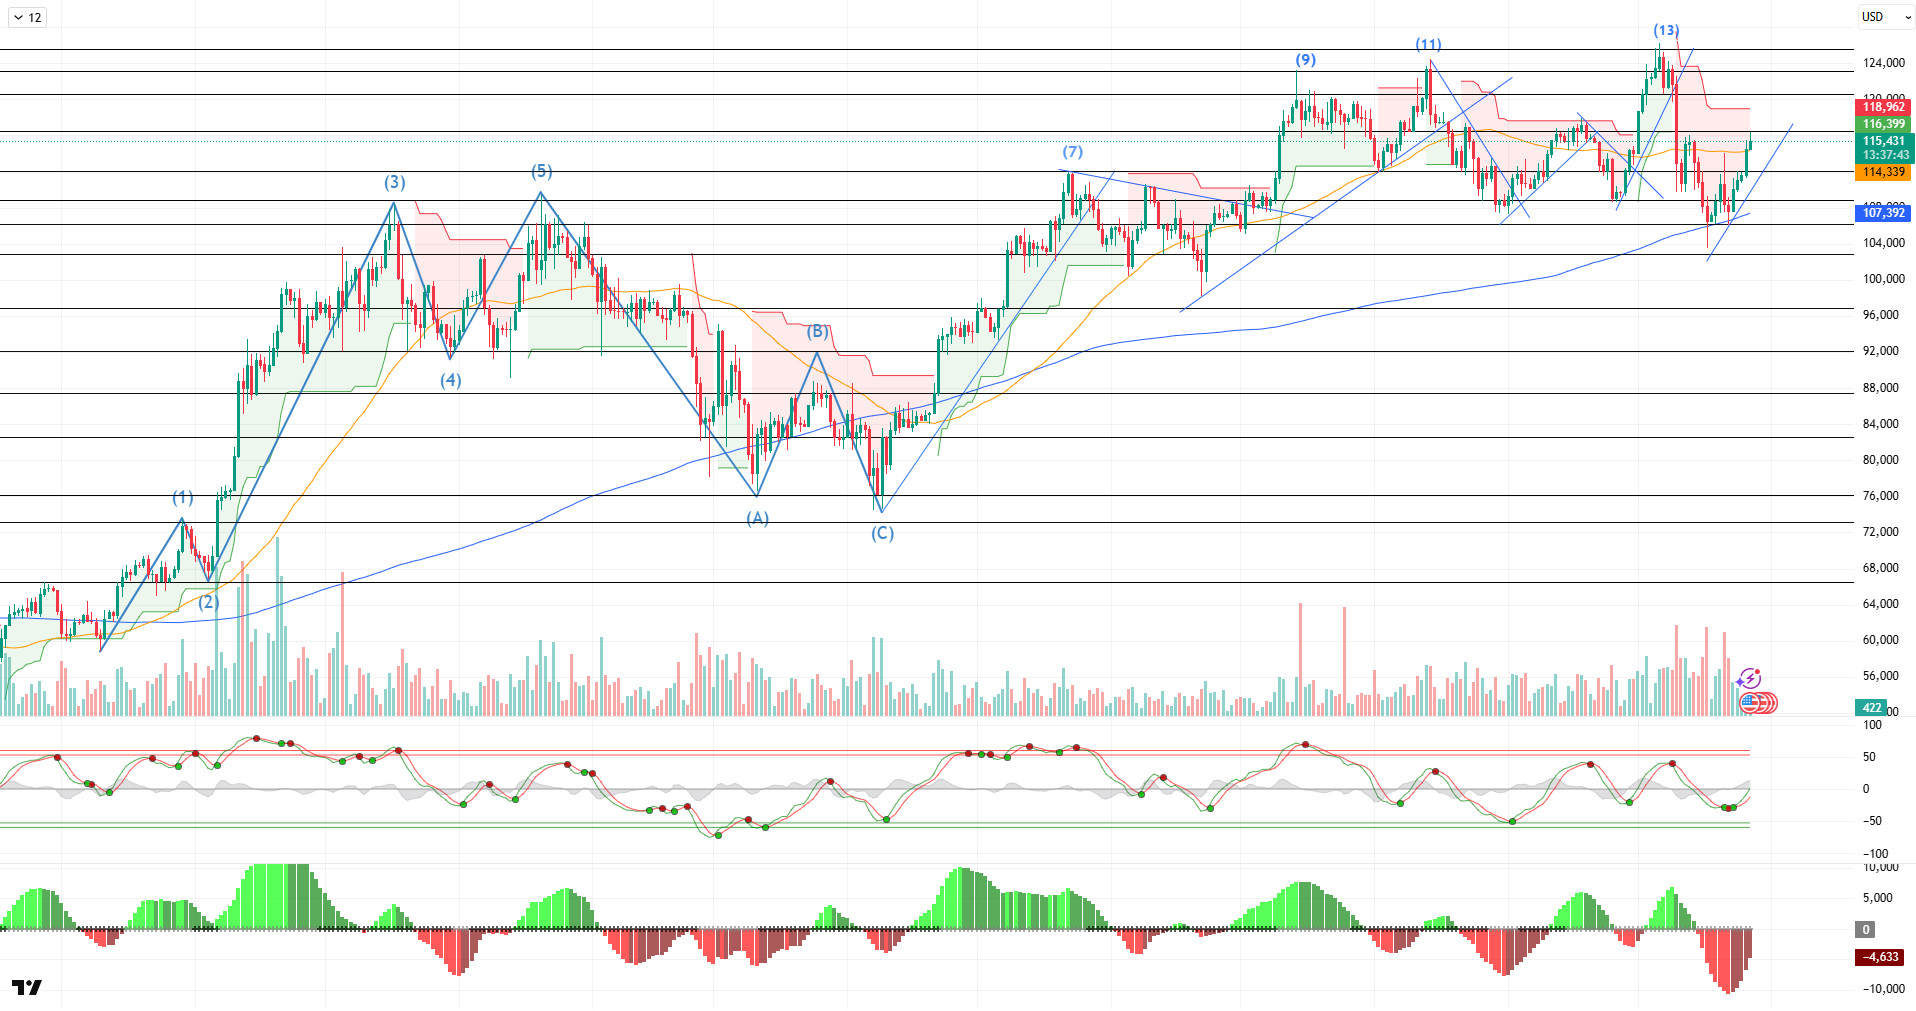
Following all these developments, looking at the daily technical outlook, BTC reached its 13th point with its golden cross formation and pushed its ATH level to 126,200. After consolidating in this region for a while, BTC failed to hold on and lost the 115,000 and then 110,000 levels, returning to the levels it had previously hit and testing the 103,300 (SMA 200) level. The price then managed to recover with the upward channel it formed and returned to the 115,000 level. BTC is set to close the week with a 6.13% increase, and its October return rate has turned positive again.
Looking at the technical indicators, the Wave Trend (WT) oscillator reached the middle band of the parallel channel, parallel to the buy signal it gave just above the overbought zone on a daily basis. The Squeeze Momentum indicator (SM) continues to try to move into positive territory after maximum weakness in the negative zone. In moving averages, the golden cross pattern continues as the 50-day SMA crosses above the 200-day SMA.
When examining weekly liquidity data, the buying level is concentrated in a fragmented manner between 105,000 and 112,000, while the selling level has become sparse with the latest rise.
In summary, developments in the reconciliation process between the US and China have been welcomed positively by the markets, while the agreement will be submitted to the leaders for approval as the final outcome. The lack of concrete developments regarding the reopening of the US government remains another source of uncertainty, while efforts to find a solution on the Russia-Ukraine front, supported by the EU, and EU sanctions against Russia continue. Technically, after losing critical support levels, the price retreated to levels where it had previously formed a wick and then recovered ( ). During this process, bears’ dominance has decreased, bulls have entered the market, and liquidity data has stabilized. In the coming period, holding above the 115,000 reference level is of great importance for the continuation of the rise. Closings above this level could bring a renewed move towards the 120,000 level. In the event of potential selling pressure, the 110,000 level will be monitored as a critical reference zone.
Supports: 115,000 – 110,000 – 105,000
Resistances: 116,500 – 120,500 – 123,000
ETH/USDT
Although the price of Ethereum generally continued its recovery trend last week, both the cautious mood on the macro side and the behavior of institutional investors limited the market’s momentum. In particular, outflows from spot Ethereum ETFs for two consecutive weeks pointed to a significant decline in investor confidence. According to SoSoValue data, a total of $243.9 million in net outflows were recorded in the week ending October 18. This figure follows the $311 million outflow in the previous week. While cumulative inflows into all Ether spot ETFs reached $14.35 billion, total net assets remained steady at $26.39 billion, indicating a slowdown in capital inflows. Considering that these funds account for approximately 5.5% of Ethereum’s total market value, this contraction on the institutional side indicates that the market needs a new wave of capital in the short term. The $100.99 million outflow from BlackRock’s ETHA ETF suggests that some large funds are pursuing profit-taking or risk reduction strategies. However, small inflows into Grayscale’s ETHE and Bitwise’s ETHW funds indicate that cautious buying appetite in the market has not completely disappeared.
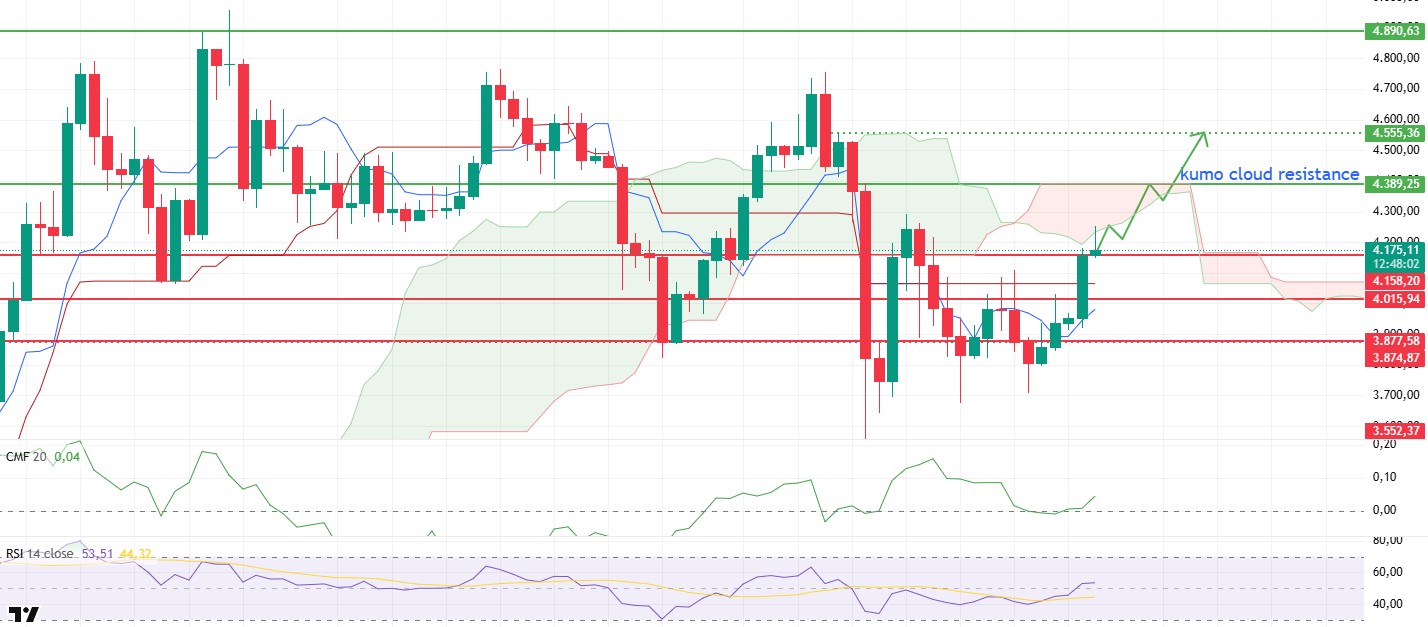
Looking at price movements, ETH started a strong recovery after retreating to the $3,700 level last week. The price tested the $4,000 level in the middle of the week but struggled to break through this area. The break of the $4,158 resistance level over the weekend, driven by increased buyer demand, signaled a short-term shift in the technical outlook back to positive territory. This move indicates that the market has begun targeting the upper band of the $4,389 cloud.
Technical indicators also support this rise. The Relative Strength Index (RSI) moving above both the 50 level and the moving average (MA) line confirms that momentum has strengthened and the rise has gained a technically sound footing. The RSI remaining in this zone is critical for the price to sustain its current upward trend.
The Chaikin Money Flow (CMF) indicator, after trending weakly for a long time, moved upward from the zero line and entered positive territory. This structure indicates that market liquidity has started to flow in the direction of buyers again. The CMF’s continued presence in positive territory is considered a fundamental factor that will enable the price to hold at high levels.
The Ichimoku indicator more clearly reveals the reversal in Ethereum’s technical structure. The price breaking above the Tenkan and Kijun levels indicates that the short-term upward trend has strengthened and the market has regained positive momentum. The price testing and rejecting the lower band of the kumo cloud during the week usually brings with it the possibility of a second test. Therefore, breaking above the upper band of the kumo cloud at the $4,389 level could trigger the start of a new wave of growth. Such a breakout could pave the way for the price to accelerate to the $4,540 and $4,685 levels.
Two critical levels stand out as key to watch throughout the week. The $4,389 level is the most important resistance point for the continuation of the upward movement, and daily closes above this level would confirm a medium-term uptrend for ETH. In a potential downward scenario, the $4,015 level is the first strong support position. Daily closes below this region could bring pullbacks to the $3,874 level.
Overall, Ethereum’s weekly outlook remains positive. Despite ETF outflows, the stability observed in on-chain data and the recovery in technical indicators confirm that the market’s long-term upward structure is still valid. In particular, the continued increase in liquidity inflows and the price targeting the top of the cloud could pave the way for stronger momentum in Ethereum in the coming weeks.
Supports: 4,158 – 4,015 – 3,700
Resistances: 4,389 – 4,555 – 4,890
XRP/USDT
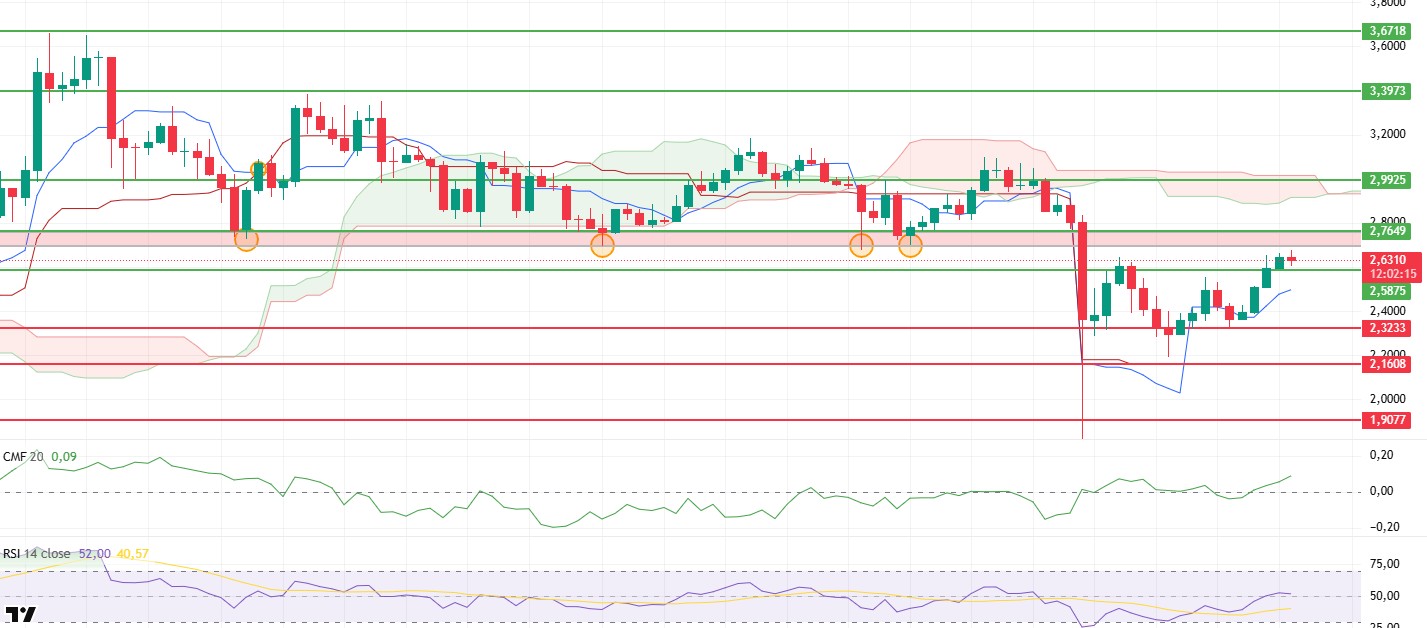
The XRP price, which fell to the $2.32 support level last week, rebounded from this area with strong buying pressure, gaining upward momentum and rising to the $2.67 level by the end of the week. Although the price has not yet reached the resistance area marked by the red rectangle on the chart, this region continues to be monitored as critically important for market direction.
The Chaikin Money Flow (CMF) indicator recorded a sharp rise in positive territory. This outlook indicates a heavy influx of liquidity into the market and a shift in capital flows back towards buyers. The CMF remaining in positive territory provides significant support for the price to hold at current levels.
The Relative Strength Index (RSI) indicator rising above the 50 level confirms that momentum is gaining strength and buyers are regaining dominance in the market. The RSI’s movement in this region indicates that the short-term upward trend is progressing on a healthy footing.
Although the price remains below the Ichimoku cloud, it has risen above the Tenkan and Kijun levels, indicating that the short-term upward trend continues. This structure suggests that the price may continue to test the lower band of the Ichimoku cloud in the coming period as it seeks direction.
Technically, the $2.58 level is an important support point. If the price holds above this level, the $2.76 resistance could be tested during the week. A break above this level could pave the way for the price to accelerate towards the $2.84 region, continuing the upward movement. On the other hand, daily closes below the $2.58 level could cause the price to retreat back to the $2.32 support level.
In general terms, the XRP price is maintaining its positive momentum in the short term. Strengthening in the CMF and RSI indicators confirms the upward movement, while the Ichimoku indicator shows that the price is technically in a recovery phase. Potential attacks on the $2.76 resistance level stand out as one of the most important factors that will determine the market’s direction this week.
Supports: 2.5875 – 2.3233 – 2.1608
Resistances: 2.7649 – 2.9925 – 3.3973
SOL/USDT
Last week in the Solana ecosystem:
- Gemini launched a credit card offering Solana rewards with an automatic staking feature.
- Solana announced its new Chinese name, “Solala,” in a community contest.
- Hong Kong’s first spot Solana ETF will begin trading on October 27.
- Mercer Park Opportunities and Cube Group announced a $3 billion merger. $500 million has been set aside to purchase SOL tokens for the treasury.
- Bitwise Solana Staking ETF (BSOL) has filed Form 8-A to begin trading on the NYSE.
- Fidelity has integrated Solana (SOL) trading into its platforms.
The SOL price showed an upward trend on the daily chart this week. The asset remained in the lower region of the upward trend that began on June 23. Testing the 200 EMA (Black Line) moving average as support, the price gained momentum from there and rose by approximately 7.33%. Currently testing the 50 EMA (Blue Line) moving average as resistance, the asset may test the rising trend line as resistance if the uptrend continues. If a pullback begins, the 200 EMA moving average should be monitored.
The asset is trading between the 50 EMA (Exponential Moving Average – Blue Line) and 200 EMA (Black Line) moving averages, indicating that the asset is in a decision phase. Furthermore, the 50 EMA remaining above the 200 EMA indicates that a “golden cross” formation is continuing from a technical perspective. This shows that the potential for an uptrend in the medium term continues. The RSI (14) has risen from negative to positive levels. At the same time, the indicator remained below the downward trend line that began on July 22. This indicates that buying pressure is not strong. The Chaikin Money Flow (CMF-20) remains in positive territory; however, a decrease in money inflows could push the CMF-20 indicator into negative territory. If macroeconomic data remains positive and developments in the ecosystem continue to be favorable, the first major resistance level of $228.35 could be retested. Conversely, in the event of potential negative news flow or deterioration in macro data, the $185.60 level could be monitored as a potential buying opportunity.
Supports: 185.60 – 162.99 – 150.23
Resistances: 209.39 – 228.35 – 241.14

DOGE/USDT
House of Doge, the corporate arm of the Dogecoin Foundation, announced on Monday that it is now the largest shareholder of the century-old Italian football club U.S. Triestina Calcio 1918, currently ranked last in Serie C.
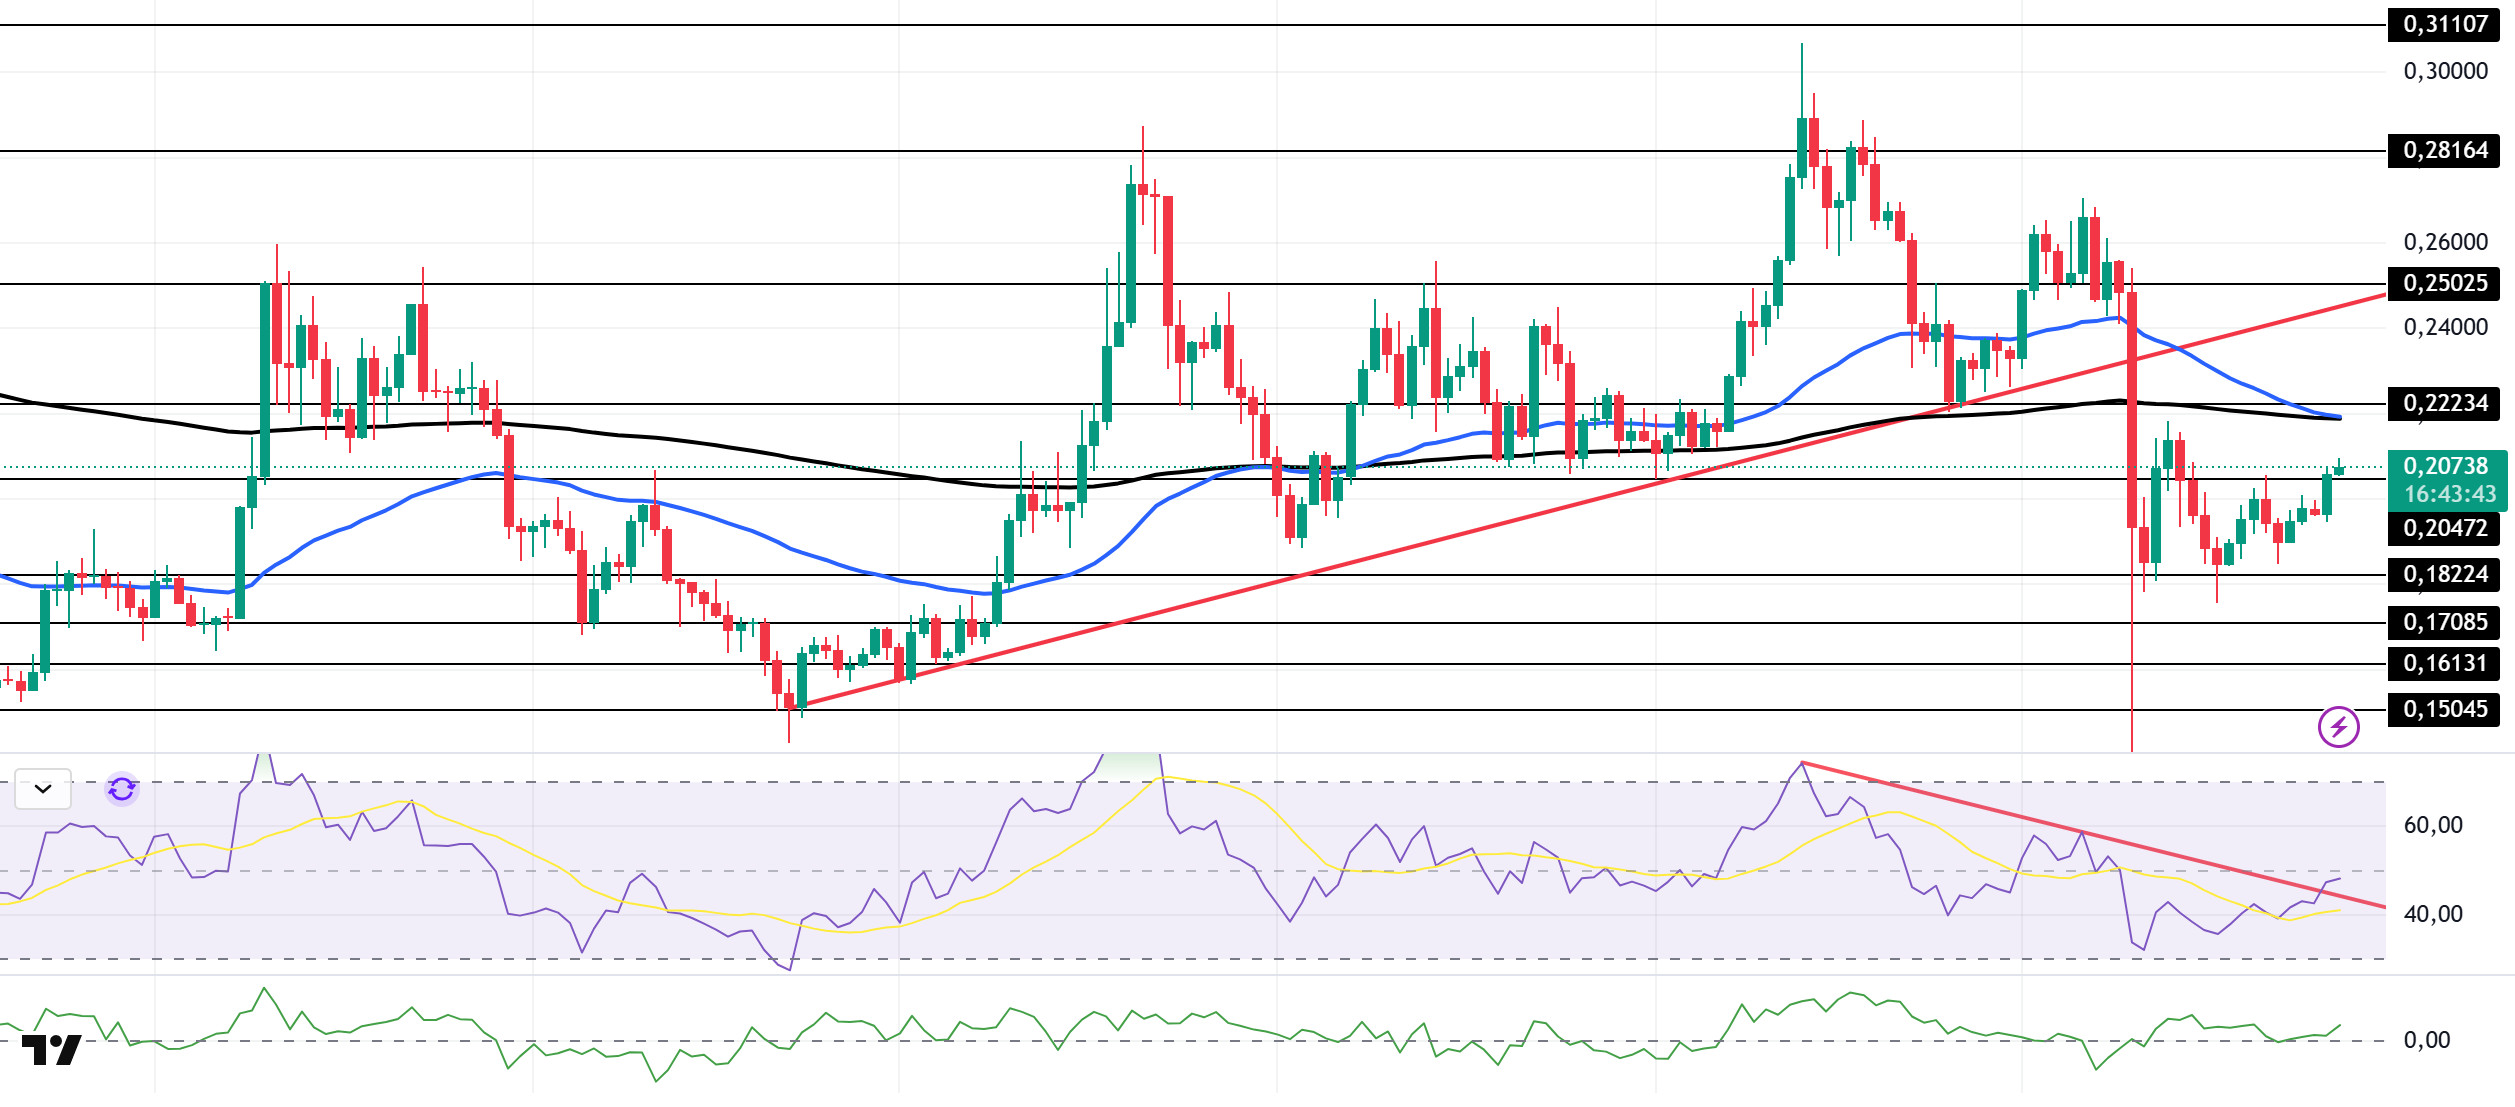
DOGE has seen a slight uptrend on the daily chart since last week. The price tested the strong support level of $0.18224 for the second time and gained upward momentum from there. Currently continuing its upward trend, the asset broke above the strong resistance level of $0.20472. If the upward trend continues, it may test the 200 EMA (Black Line) and 50 EMA (Blue Line) moving averages as resistance. In case of a pullback, the $0.18224 level can be monitored.
The asset continued to trade below the 50 EMA (Blue Line) and 200 EMA (Exponential Moving Average – Black Line) moving averages. This indicates that the asset is trending downward. On the other hand, the 50 EMA crossing above the 200 EMA indicates that the “golden cross” formation has ended. This also signals that the asset has an increased potential to lose value at this point. The Chaikin Money Flow (CMF–20) indicator remained in positive territory. Money inflows, however, continue to decline. This could push the CMF-20 back into negative territory. Looking at the Relative Strength Index (RSI-14) indicator, it has risen from the depths of negative territory towards the neutral level of negative territory. At the same time, it has managed to break above the upper boundary of the downtrend that has been ongoing since September 13. This indicates that buying pressure is building. In the event of macroeconomic risks or negative news from the ecosystem, the $0.18224 level can be monitored as strong support. On the other hand, if the upward movement gains strength, the $0.25025 level comes to the fore as the first strong resistance level.
Supports: 0.20472 – 0.18224 – 0.17085
Resistances: 0.22234 – 0.25025 – 0.28164
TRX/USDT
Over the past week, the TRON network generated a total of $51 million in revenue, continuing to be the highest-earning ecosystem among all blockchain networks. This ongoing positive momentum in TRON’s revenues strengthens the network’s dominance in the DeFi and stablecoin ecosystems.
During the week of October 20-26, 2025, a total of 25 million TRX were burned on the TRON network. Despite this, the circulating supply increased by 1.8 million. The increase in circulating supply is creating inflationary pressure on TRX. Additionally, the total number of addresses also increased by 1.5 million to 341.3 million during the same week.
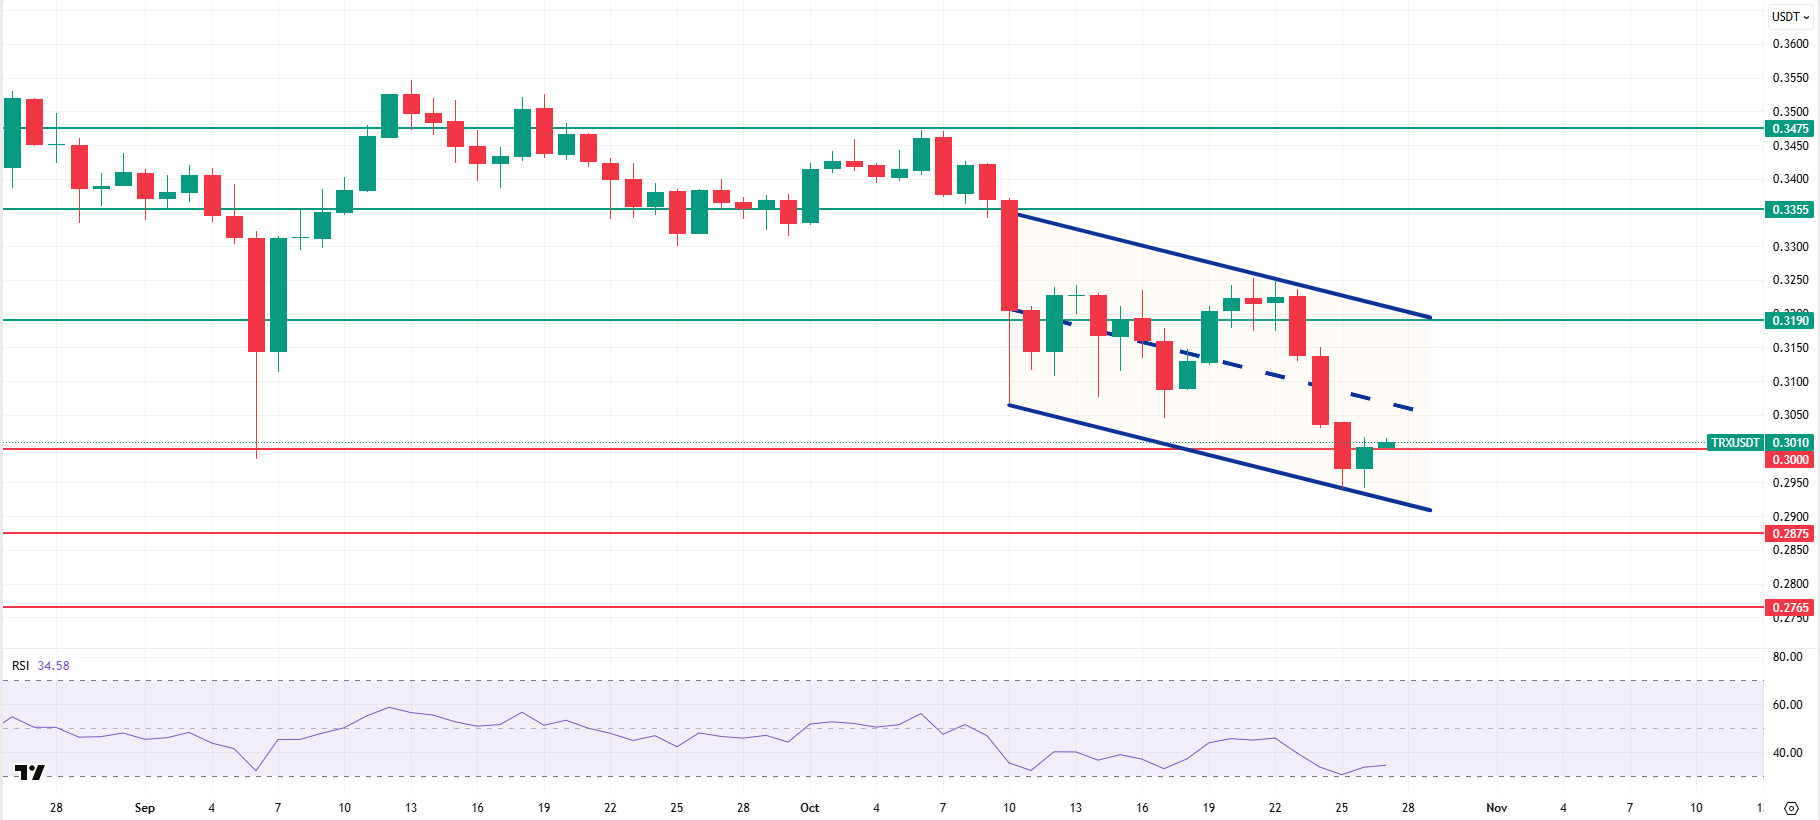
Technically speaking, TRX started the week at 0.3205 and closed the week at 0.3002, falling approximately 6.5% over the course of the week. Thus, TRON, which has completed its third consecutive week of decline, has a market value of $28.4 billion. Currently trading at 0.3010, TRX is just above the lower band of the bearish channel on the daily chart and is hovering close to the 0.3000 support level. The Relative Strength Index (RSI) value is observed to be very close to the oversold zone at 34. Considering its position within the bearish channel and the RSI indicator, the TRX price may be expected to rise. This indicates that it may want to move towards the upper band of the channel. In such a case, it may test the 0.3190 resistance. If it closes above the 0.3190 resistance on a daily basis, it may want to test the 0.3355 resistance. If it fails to close above the 0.3190 resistance level and selling pressure increases in the market, it may decline due to potential selling from this area. In such a case, it may test the 0.3000 and 0.2875 support levels in sequence. The 0.2765 level is being monitored as a critical support point on the daily chart. Sustaining above this level could maintain the upward trend, while closes below it could lead to increased selling pressure and deeper downward price movements.
Supports: 0.3000 – 0.2875 – 0.2765
Resistances: 0.3190 – 0.3355 – 0.3475
AVAX/USDT
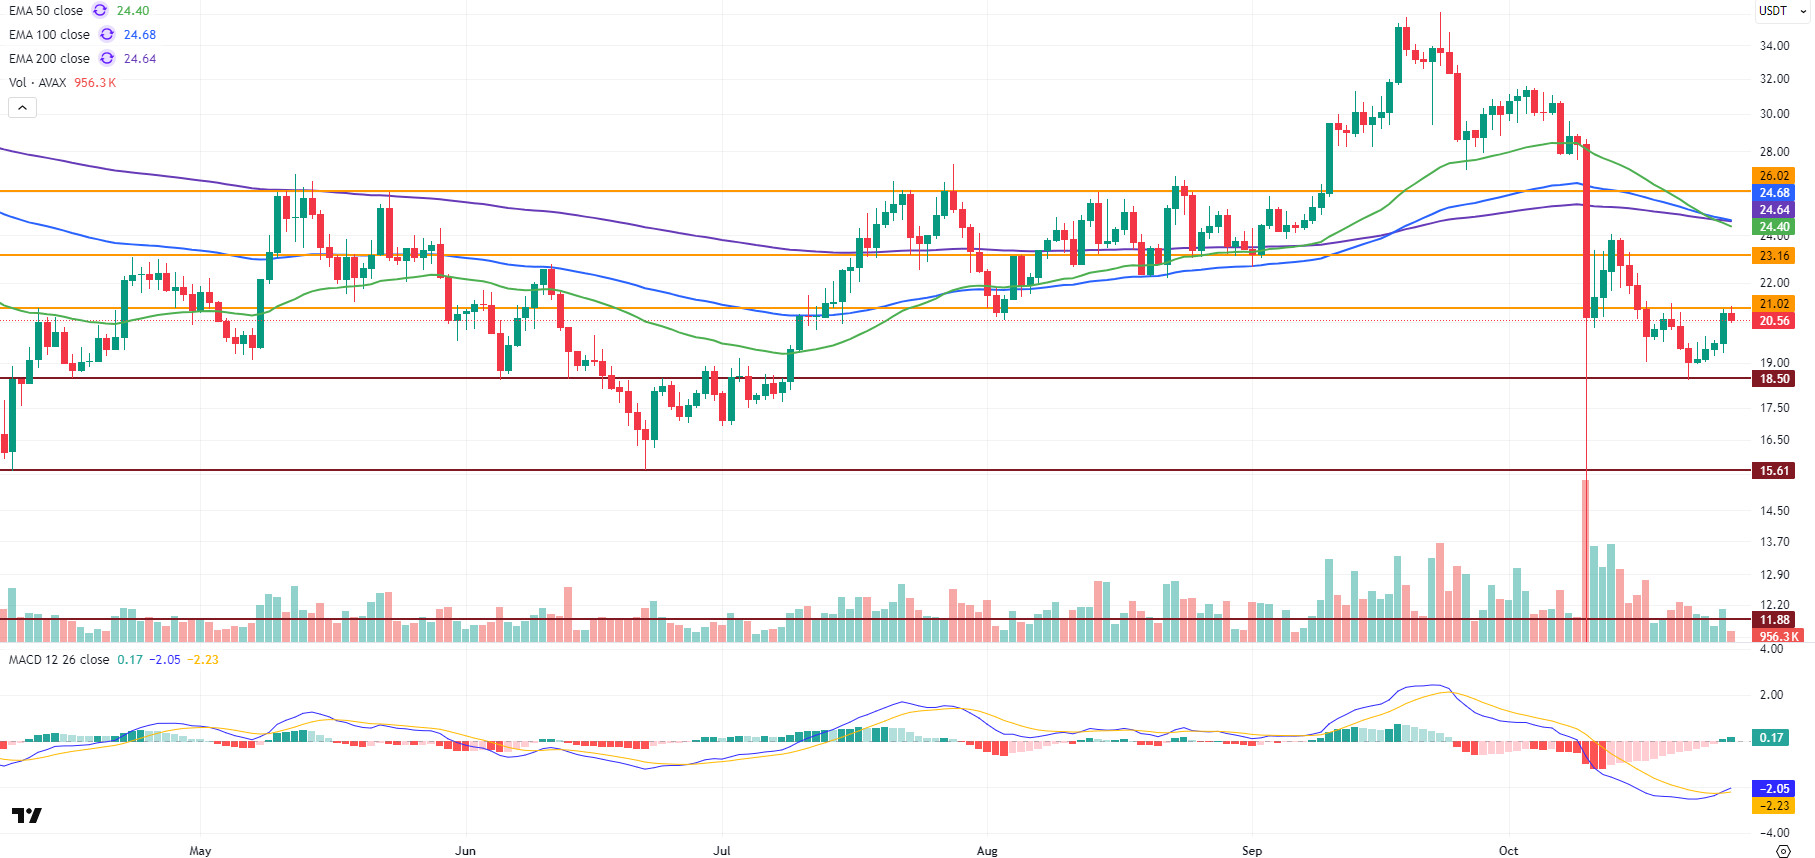
AVAX, which started last week at $20.60, closed the week at $20.82, marking an approximate 1.1% increase in value. Selling pressure was effective in the first half of the week, causing AVAX to fall to the $18.50 support level. However, as buying strengthened towards the end of the week, AVAX tested the $21.02 resistance level and closed the week on a positive note. The acceleration of the rise on the closing day of the week was particularly noteworthy. On the ecosystem side, Avalanche announced last week that $500 million in assets had been tokenized on the Avalanche network through BlackRock’s BUIDL fund. With this development, Avalanche rose to 4th place in the total locked value ranking of Real-World Assets (RWA) across chains. This development represents a significant step forward for the Avalanche ecosystem in terms of institutional adoption and could have a positive impact on the price in the long term.
On the daily chart, following the sharp decline in AVAX in previous weeks, the MACD line had shown a weak appearance in negative territory below the signal line. However, with the recovery seen in the last days of the past week, the MACD line crossed above the signal line. Currently, the MACD is trending upward, indicating that momentum is gaining strength and the positive outlook is maintained in the short term. AVAX continues to trade below all critical Exponential Moving Average (EMA) levels. All critical EMA levels are concentrated in the $24-25 range, forming a strong resistance zone. This band stands out as the most important technical barrier to AVAX’s rise. Although selling pressure is likely to increase as the price approaches this zone, a break above these levels could signal a medium-term trend reversal.
From a technical perspective, AVAX tested the $21.02 resistance level during its rise yesterday and today, but experienced a decline due to selling pressure at this level. It is important for AVAX, which continues to trade below the $21.02 level, to remain above this level for the uptrend to continue. If this level is broken, the $24-25 resistance zone, where critical EMA levels are concentrated, and the $26.02 resistance level emerge as the strongest resistance zones in the short term. Conversely, in a downward movement, the $18.50 level is the first support position. If there are closes below this level, selling pressure could deepen, and AVAX could retreat to the $15.61 and $11.88 levels. In the overall picture, while the MACD indicator is generating positive signals, the EMA structure remains in negative territory. This indicates that a recovery process has begun in the short term, but the overall trend has not yet fully reversed. If trading volumes increase and there are closes above $21, a gradual upward trend for AVAX is expected to strengthen.
(EMA50: Green Line, EMA100: Blue Line, EMA200: Purple Line)
Supports: 18.50 – 15.61 – 11.88
Resistances: 21.02 – 23.16 – 26.02
SHIB/USDT
This week, as the Shiba Inu ecosystem progressed in terms of security and supply management, the combined effect of weak activity on the L2 side and the dampening of flows to exchanges presented a coherent picture. The community-led burn initiative saw the daily rate jump to 1224%, with approximately 920,000 SHIB permanently removed from circulation, demonstrating the strengthening of supply discipline through community action. On the security front, the team issued an official warning against a phishing attempt mimicking fake Shiba Inu interfaces, reminding users not to interact with suspicious links and to revoke any previously granted wallet approvals. This aimed to ensure that the protective measures established after the bridge exploit were maintained not only at the infrastructure level but also in user behavior.
Adoption signals on Shibarium have weakened, with the total locked value falling below $1 million, the number of active addresses remaining at 243, the daily transaction count dropping to 2,300, and fees collected amounting to 115 BONE. This picture emerged as a key factor limiting the efficiency of the mechanism extending from BONE fees to SHIB burning, and it reemphasized the importance of concrete incentives to increase L2 usage. In on-chain flows, SHIB inflows to exchanges dropped 62% in the 24-hour window towards the end of the week, with approximately 1 billion less SHIB transferred to exchanges. Simultaneously, signs that exchange reserves remained flat at around 82 trillion suggested that selling pressure had dissipated and that holding tendencies prevailed. All this flow confirmed the continuation of a strategy that prioritizes integrity and oversight over accessibility, in line with policies such as the recently reactivated Plasma Bridge for BONE, which includes a permanent blacklist and a seven-day finalization delay. On the supply side, it supported the narrative of community-driven tightening, but it also showed that the impact of burn channels may remain limited unless application scenarios that create persistent demand on L2 and programs that increase transaction frequency are implemented.
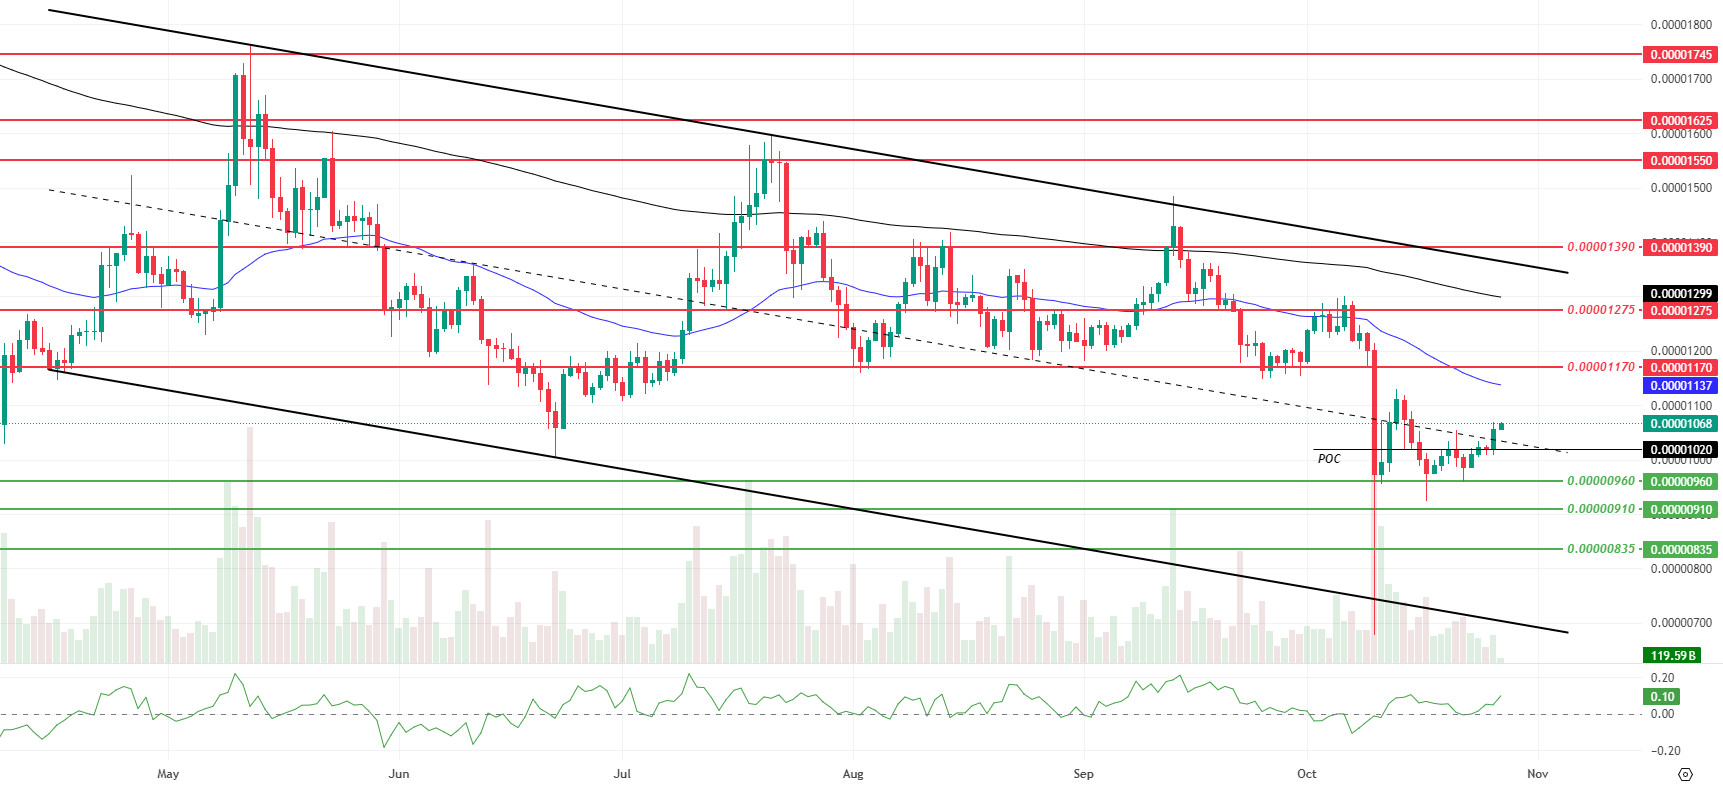
The technical outlook indicates that the post-sharp-sell-off rebound structure is persisting on weak ground. The price rebounded from the $0.00000960 level, but the decline in volume and volatility is limiting the momentum of the move. The price is balancing around the previous week’s Point of Control (POC) value of $0.00001070, with this week’s POC value at $0.00001020. The Money Flow Index (MFI) is in positive territory, indicating continued inflows. However, the price remaining below the 50 EMA and 200 EMA suggests that the rebound has not yet turned into a trend confirmation. The price has managed to stay above the middle band of the descending channel, but confirmation at the level is needed for a continuation towards the upper band.
In terms of upward attempts, closes above $0.00001070 could be supportive, followed by settling above the EMA 50 around $0.00001173 and volume-driven retakes of intermediate resistance levels could strengthen the process. If these conditions are met, 0.00001170 and 0.00001275 could emerge as intermediate targets, followed by the 0.00001319 to 0.00001340 band around the EMA 200 and 0.00001390. Below 0.00001020, a break could accelerate the decline, potentially retesting 0.00000960. Below that, 0.00000910 and 0.00000835 could act as broad support levels. In summary, the price maintains a tight appearance around the POC thresholds. As long as the trend continues below the EMA 50 and EMA 200, upward attempts may retain their corrective character. A significant recovery in volume and volatility could be beneficial for sustainability. (EMA200: Black line, EMA50: Blue line)
Supports: 0.00000960 – 0.00000910 – 0.00000835
Resistances: 0.00001170 – 0.00001275 – 0.00001390
LTC/USDT
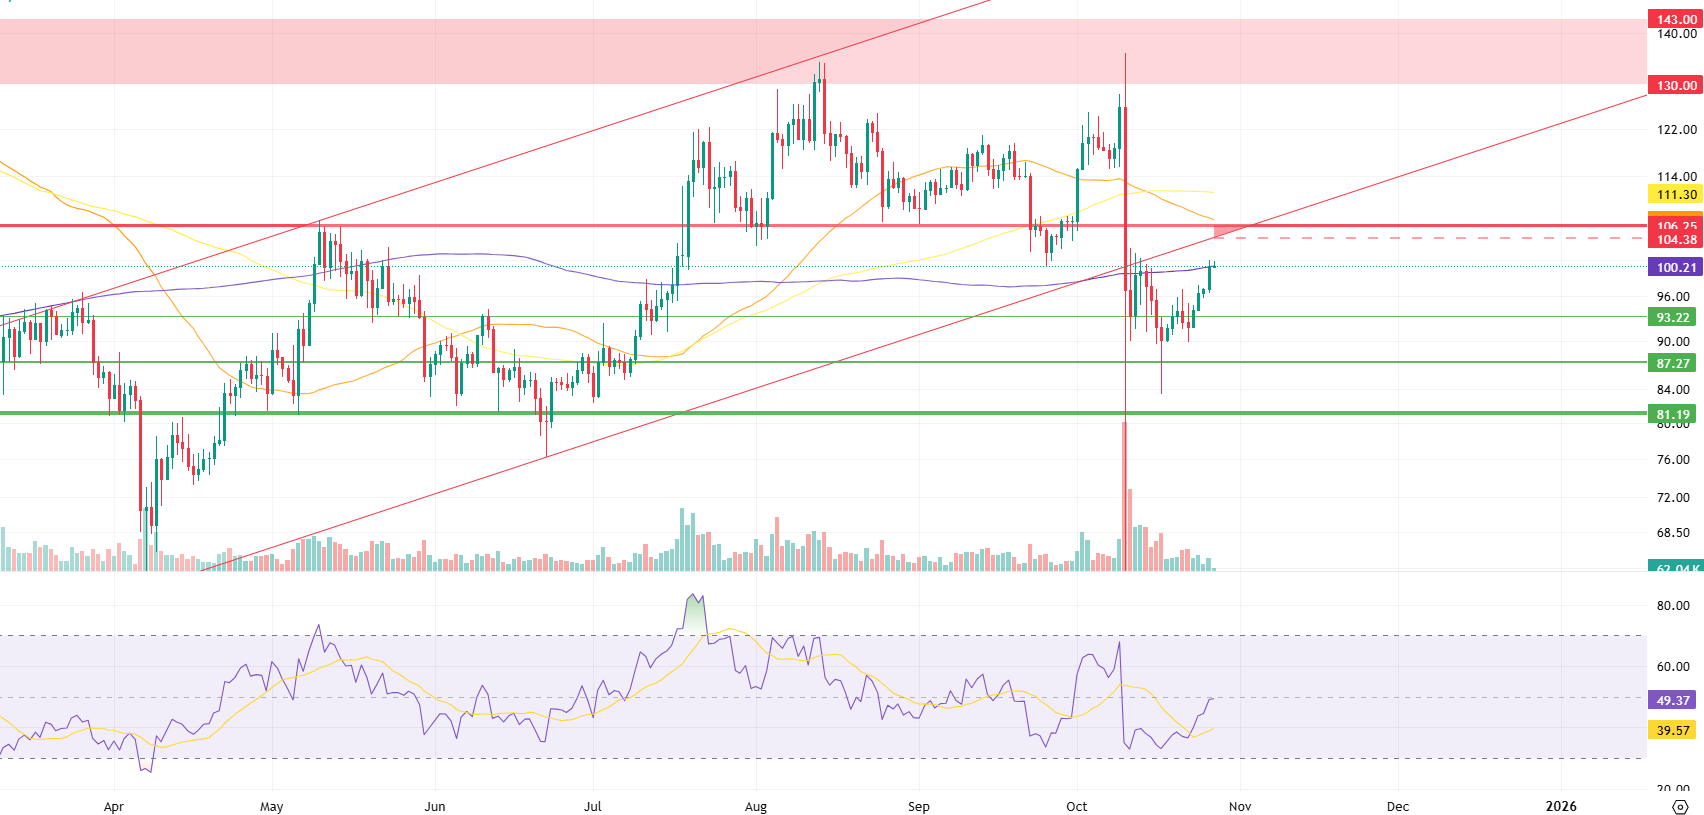
Litecoin (LTC) ended last week with a 7.17% increase and started the new week at $100.02. Gaining 1.86% against Bitcoin during the same period, LTC’s market value reached approximately $7.65 billion ( ). However, this increase did not change the cryptocurrency’s position in the market value ranking, where it remains in 20th place. On the futures side, a significant increase in open positions was observed due to the recovery in the markets. The total open position amount showed a 10% increase compared to the previous week. Funding rates generally remained partially positive, indicating that investors maintain their expectations for short-term growth.
From a technical perspective, Litecoin is still trading below the 50, 100, and 200-period moving averages. Furthermore, the loss of its upward trend support is contributing to the negative outlook. However, the price retesting the lower band of the ascending channel before the decline could be seen as a healthier downward process from a technical standpoint. The first significant resistance in upward movements is the 200-period moving average (purple line) at the $100.21 level. If this level is exceeded, the area where the rising channel’s lower band intersects with the horizontal resistance at the $106.25 level becomes critical. The triangle-shaped resistance area (red triangle) formed by these two levels and the $104.38 trend line could play a decisive role in determining the price direction. A rejection from this area could signal the start of a new trend formation process. In this case, it would be a more prudent strategy for investors trading in the spot market to reduce their risk and wait until potential ETF approvals. On the other hand, if the uptrend becomes permanent, the LTC price is expected to accelerate towards the 100-period moving average (yellow line) resistance at the $111.30 level.
In downward movements, the first minor support is at the $93.22 level. This area, having been a zone where the price has reacted several times in the past, can be monitored as the first line of defense where short-term buyers may re-enter. If this support is broken, the $87.27 level will be the second and stronger support position that could limit the decline. In a deeper pullback, the $81.19 level stands out as a critical threshold. This level is an important area, both because it has been the location of many medium-term bottoms in the past and because weekly moving averages could bring buyers back into play. If the retest attempt from the rising channel’s lower band fails, a pullback to $81.19 could present new buying opportunities for spot market investors and create a suitable environment for profit-taking on existing short positions.
Supports: 93.22 – 87.27 – 81.19
Resistances: 100.21 – 106.25 – 111.30
BNB/USDT
Among the notable developments on the fundamental side last week, BNB Coin saw positive movements of over 5% after US President Trump announced he had pardoned Changpeng Zhao. In addition, many exchanges announced they would add support for the BNB Smart Chain network (BNB).
Furthermore, this week, the TURTLE project was listed in the BNB ecosystem. This listing is expected to increase demand for BNB used in transaction fees and reduce the circulating supply through users staking BNB. This situation is expected to have a generally positive effect on the BNB price.
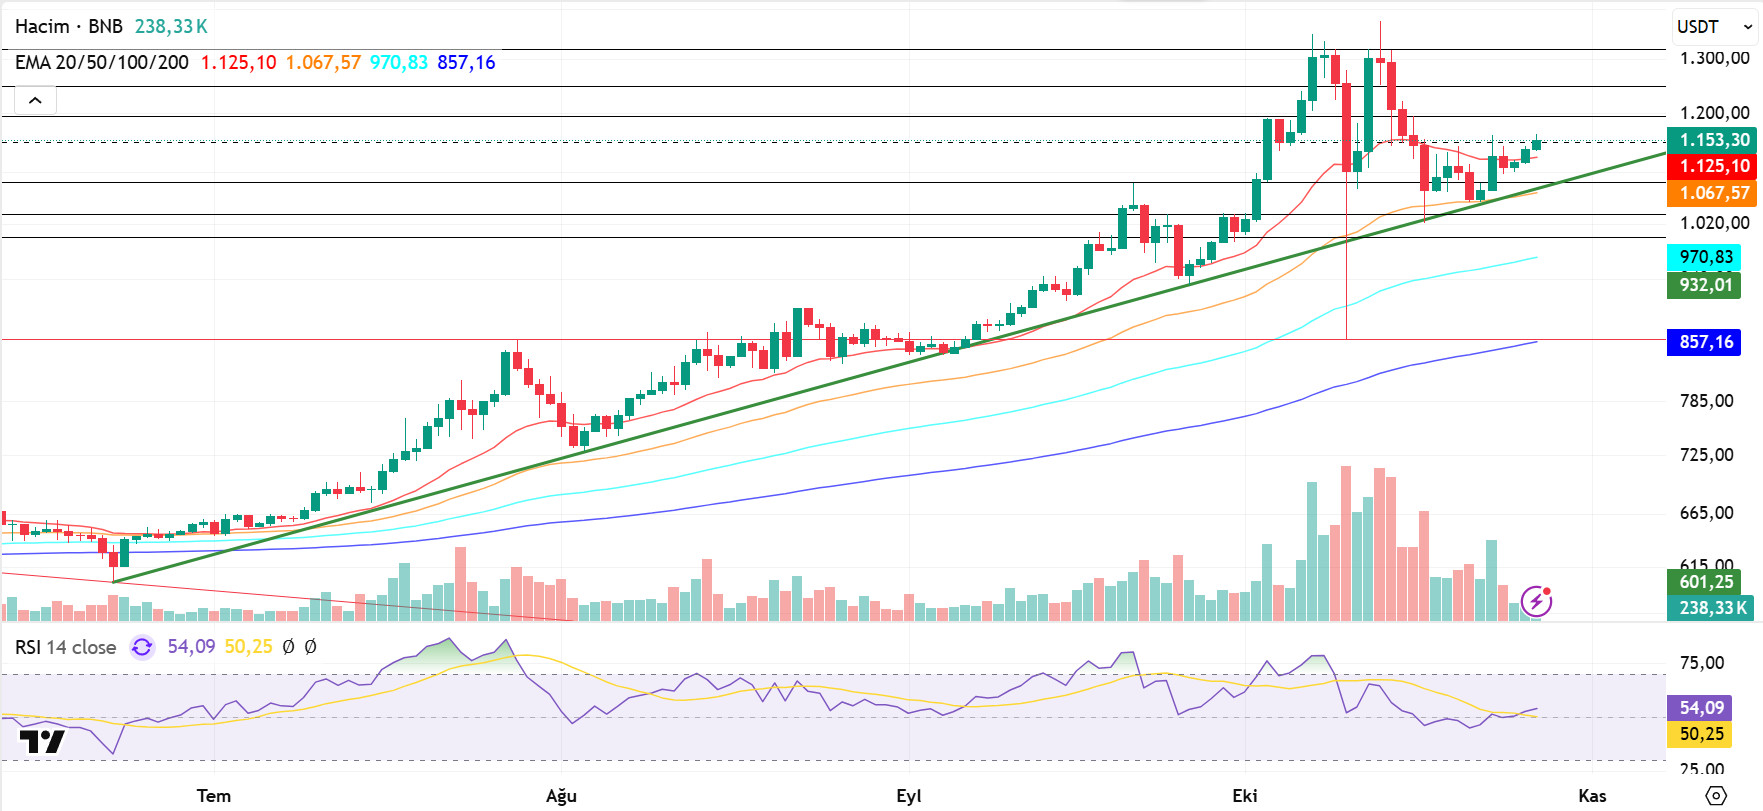
From a technical perspective, the correction movement that started from the all-time high (ATH) of $1,350 ended at the $1,000 level, which is the uptrend zone. Gaining momentum again with strong support from this zone, the BNB/USDT pair tested the $1,150 level once more. This positive outlook has been reinforced by developments on the fundamental side.
Technical indicators for BNB/USDT, currently trading in the $1,100–$1,200 range, show that the recent increase in trading volume has supported buying. This pattern indicates that the positive outlook in the market is gaining strength. Additionally, the Relative Strength Index (RSI) indicator fell below the 50 level following recent pullbacks but found support at this level and resumed its upward trajectory. This technical structure confirms that positive momentum in BNB is strengthening.
Within the current outlook, if buying appetite is maintained, BNB is expected to test the $1,200 resistance level in the first stage. If this level is broken, the price could move towards the $1,250 and $1,320 levels. On the other hand, if selling pressure increases, the price may retreat back to the $1,100 support level. If this level is broken downward, the $1,050 and $1,000 levels emerge as critical areas to monitor.
Supports: 1,100 – 1,050 – 1,000
Resistances: 1,200 – 1,250 – 1,320
LINK/USDT
As part of its new collaboration with UBS and SWIFT, the Chainlink team has developed a solution that will enable financial institutions to access blockchain-based asset transfers without changing their existing system infrastructure. Operating on the ISO 20022 message standard, this system allows tokenized fund transactions to connect directly to the blockchain via the Chainlink Runtime Environment (CRE).
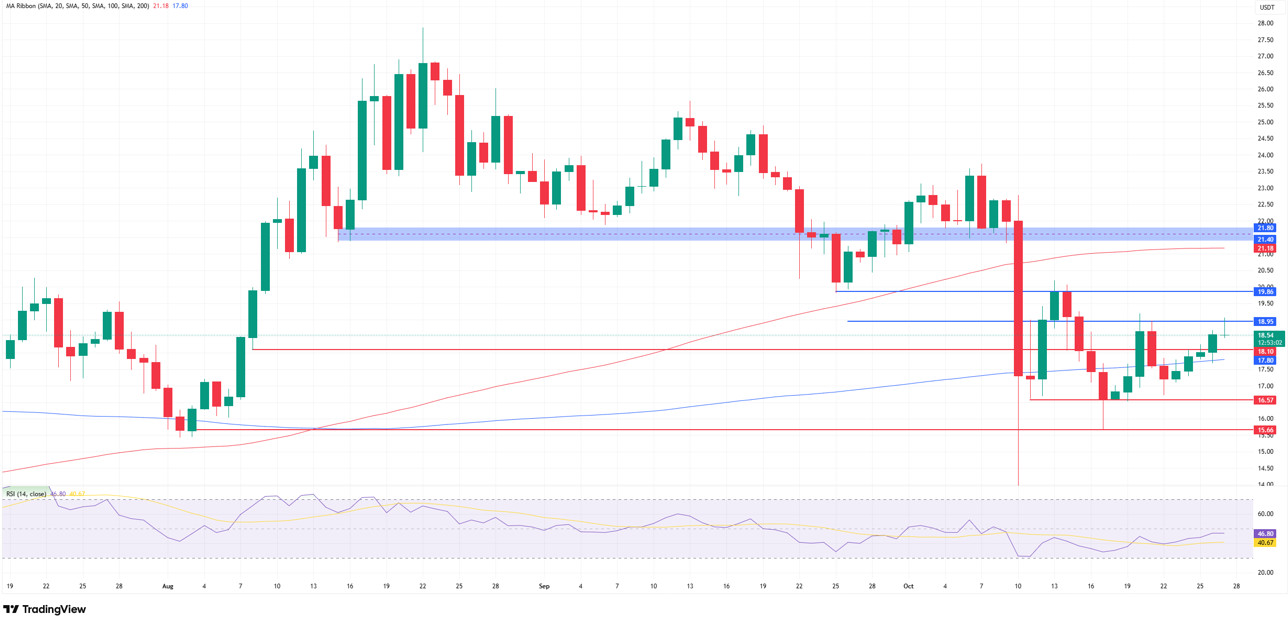
Technically speaking, after hitting a low on October 17, the price rose by approximately 23% to above the $19 level. Although we saw a slight decline afterwards, it attempted to gain a positive outlook by forming a rising low. Despite accompanying the positive price movements in the market on October 27, we are seeing another pullback in the price due to the selling pressure encountered at the $19 level. The $19 level is critically important for us here. A 4-hour close above this level, followed by a possible daily close, could confirm the rising bottom and top structure, signaling the start of a new uptrend and strengthening the $21 scenario.
Additionally, the positive divergence seen in the wave between October 13-20 could support the current outlook and enable the upward movement to continue. However, a daily candle close below the current resistance level could weaken momentum, creating fear in the market and increasing selling pressure, pulling the price first to the $18 level and then to the $16 level. If the $16 level is not maintained, we are likely to face much stronger selling pressure. The $18 level is our primary area to monitor, where we may see rebound buying accompanied by the 200-day moving average.
The Relative Strength Index (RSI) indicator is hovering around 46, in negative territory. With the aforementioned divergence, it is critical for this level to break above 50 and move into positive territory. If price and RSI move in tandem, risk appetite and market confidence could turn positive, and momentum could accelerate upward.
Supports: 18.10 – 16.57 – 15.66
Resistances: 18.95 – 19.86 – 21.40
SUI/USDT
This week, the Sui (SUI) ecosystem attracted attention with significant technological and financial developments, as well as the upturns in the crypto market. In particular, it was reported that substantial funds were raised for the new stablecoin USDi, which will operate on Sui; this stablecoin aims to provide greater stability and security for on-chain transactions. Security measures were also prioritized. Mysten Labs announced a new update that will significantly enhance the security of the Sui ecosystem, including against AI-based threats. This step aims to provide a safer environment for both users and institutional investors on the network.
Furthermore, approximately 43.9 million SUI tokens will enter circulation on November 1, worth approximately $113 million. This planned token unlock process may cause short-term fluctuations in the market. Looking at the overall picture, it appears that Sui continues to take growth-oriented steps despite the market uncertainties experienced during this period. This reinforces positive expectations for the project’s future.
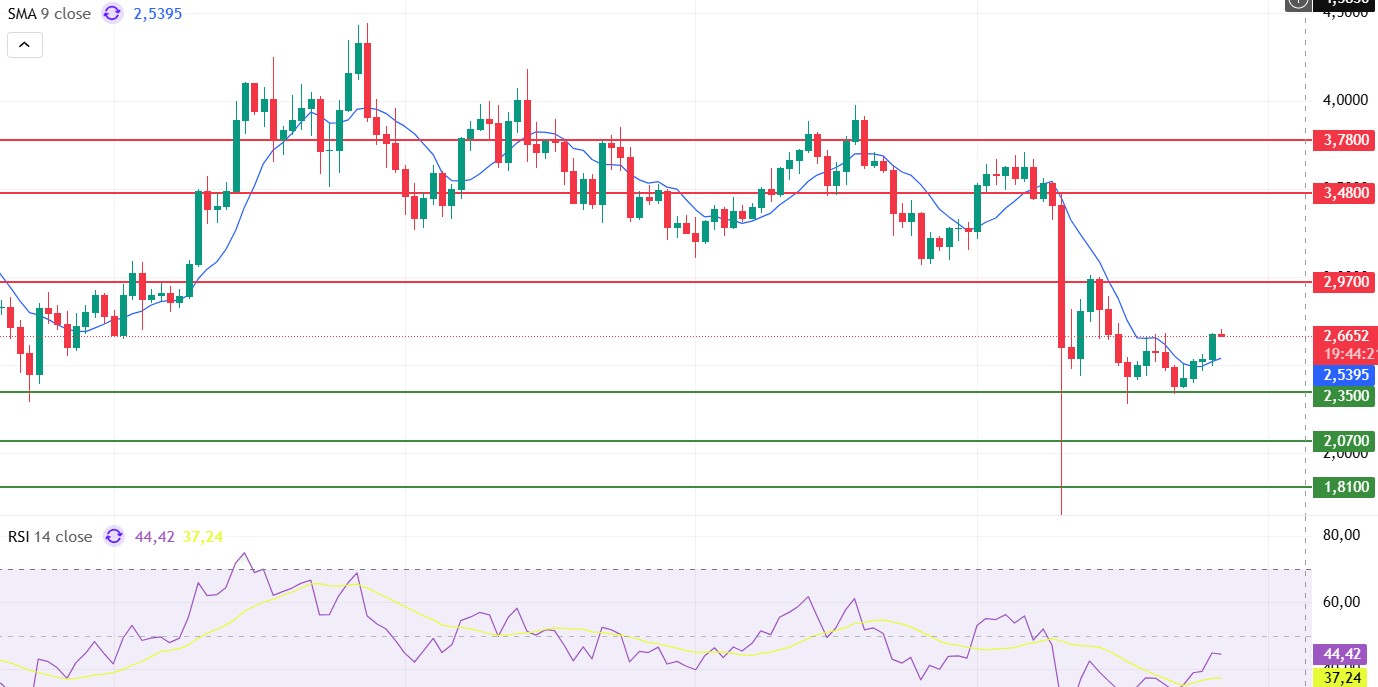
Looking at Sui’s technical outlook following recent developments, we see that the price has been moving sideways at around $2.66 on a weekly basis, influenced by fundamental developments. The Relative Strength Index (RSI) is currently in the range of 44.42 – 37.24. This range indicates that the market is trading close to the buy zone; a drop in the RSI to the 35.00 – 40.00 range could signal a potential buying point. If the price moves upward, the resistance levels of $2.97, $3.48, and $3.78 can be monitored. However, if the price falls to new lows, it could indicate that selling pressure is intensifying. In this case, the support levels of $2.35, $2.07, and $1.94 come to the fore. Based on the trend line, a pullback to $1.81 appears technically possible. According to Simple Moving Averages (SMA) data, Sui’s average price is currently at $2.53. If the price remains above this level, it signals that the current uptrend could technically continue.
Supports 1.81 – 2.07 – 2.35
Resistances 2.97 – 3.48 – 3.78
ADA/USDT
ADA rose 3.78% in 24 hours and 1.62% since last week, reaching $0.6816. Cardano whales, trading between 10 million and 100 million, increased their holdings, raising expectations around the SEC’s upcoming decision on the Grayscale Cardano Trust ETF (GADA). Whales added approximately 50 million ADA, valued at around $32.5 million, over the past 24 hours, boosting ADA trading volume to approximately $1.5 billion.
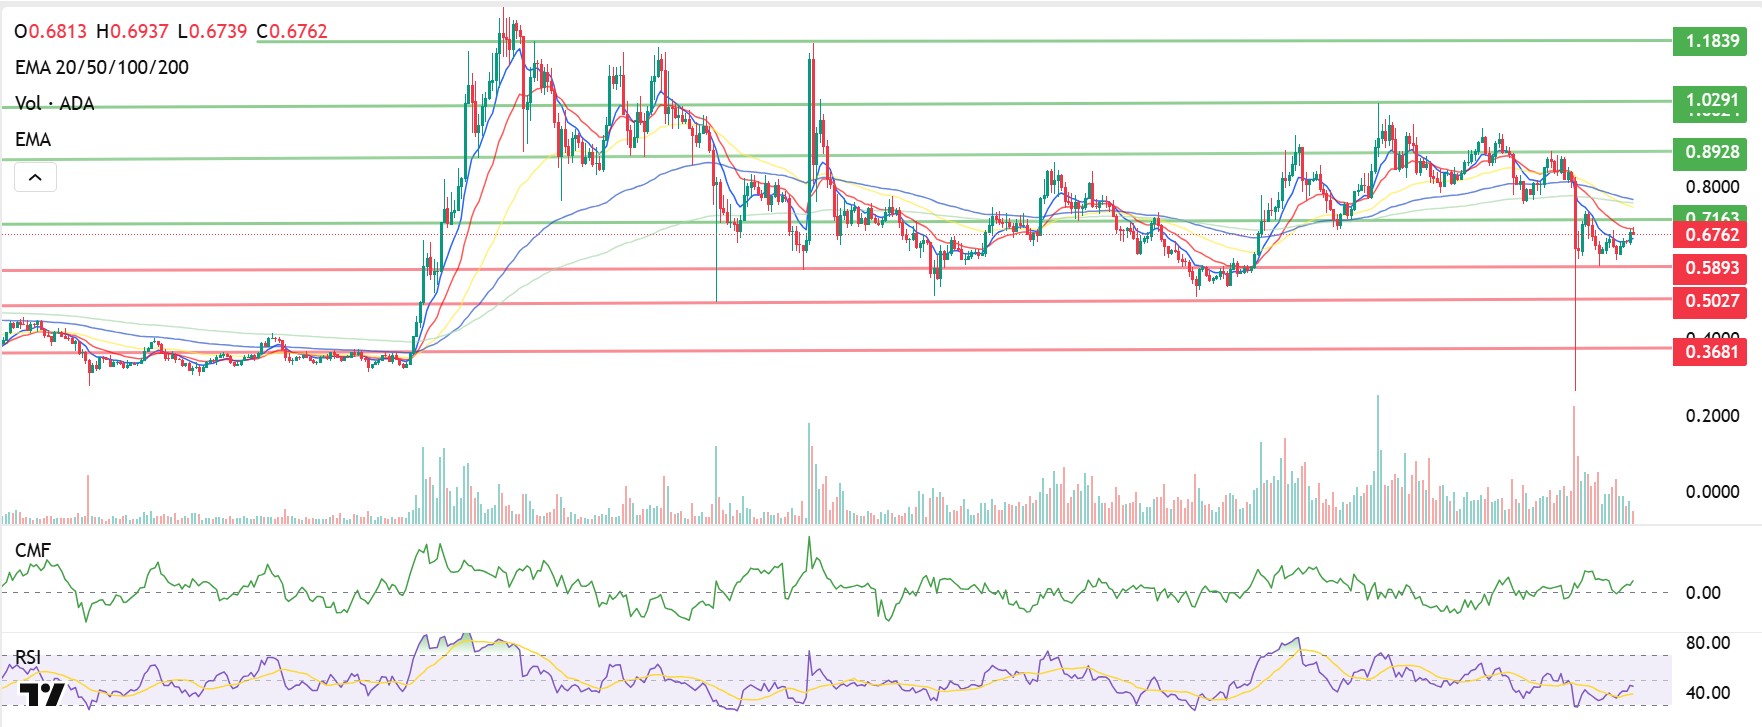
Technically speaking, the ADA price experienced a bullish RSI divergence by forming an Inverse Head and Shoulders pattern. The price managed to rise above $0.6766 and reach the 20-day Exponential Moving Average (EMA 20 – Red Line) level. The price is preparing to close above the 50-day Exponential Moving Average (EMA 50 – Blue Line). If there is a confirmed close above $0.7163, the first target could be $0.8928, and if momentum continues, the $1.0291 level could be our first resistance level in the wide band range. The Relative Strength Index (RSI) continues to move near the sell zone, falling to 40 levels, while the Chaikin Money Flow (CMF-20) has fallen to 0.11 levels, indicating potential for a sell-off. The decrease in money inflows may keep the CMF in negative territory, and the uncertainty between the two indicators could signal a sell-off. With macroeconomic data to be released this week or positive news regarding the Cardano ecosystem, the $0.8928 level may emerge as our strong resistance point. If the decline begins, the $0.5897 level will be the important support level we will follow.
Supports: 0.5893 – 0.5027 – 0.3681
Resistances: 1.1839 – 1.0291 – 0.8928
Legal Notice
The investment information, comments, and recommendations contained in this document do not constitute investment advisory services. Investment advisory services are provided by authorized institutions on a personal basis, taking into account the risk and return preferences of individuals. The comments and recommendations contained in this document are of a general nature. These recommendations may not be suitable for your financial situation and risk and return preferences. Therefore, making an investment decision based solely on the information contained in this document may not result in outcomes that align with your expectations.