
Weekly Technical Analysis Report – December 22–29, 2025
BTC/USDT
Last week was dominated by central bank monetary policy decisions, macroeconomic data from the US, and escalating geopolitical developments. Following the Fed’s rate cut, the BoJ’s shift to tight monetary policy with rate hikes and the ECB’s cautious stance with steady rates highlighted the divergence in global monetary policy. In the US, inflation falling below expectations, rising unemployment, and revisions to non-farm payroll data presented a mixed macroeconomic picture, while disagreements among Fed members deepened. Additionally, escalating geopolitical tensions between the US, China, and Venezuela, and the ongoing process of selecting a new Fed chair are among the topics closely watched by the markets.
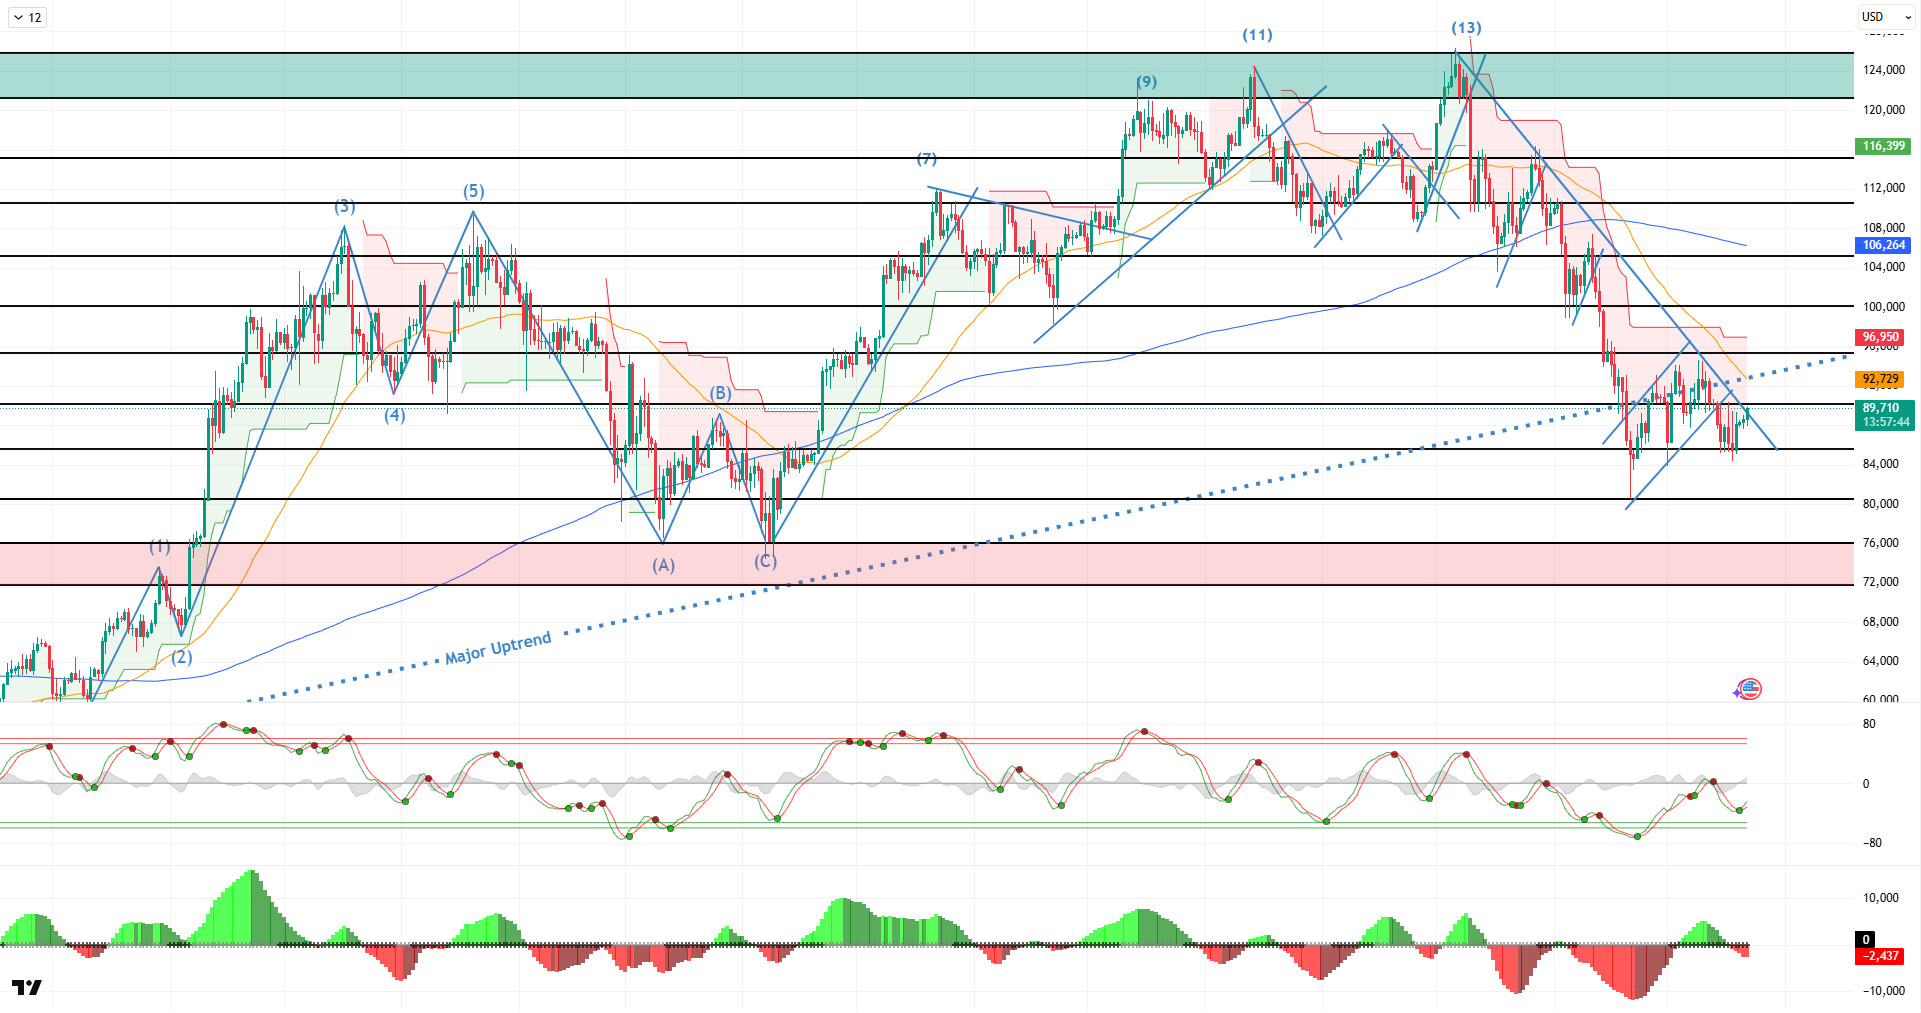
Looking at the daily technical picture following all these developments, BTC continues to deepen the downtrend it started since its ATH level. The price, which recorded a downward breakout with the reverse flag it recently formed, tested the 84,400 levels. Finding support here, the price rebounded and returned to the 90,000 reference level. BTC, which continues to trade below the major uptrend line it formed on the daily chart, is attempting to break above the 90,000 level by challenging the downtrend line. After negative closes in October and November, the price started December with a decline and, at the time of writing, continues to fall by 1% as the month draws to a close.
Looking at technical indicators, the Wave Trend (WT) oscillator is giving a buy signal just below the channel midband on the daily chart, while the Squeeze Momentum (SM) histogram has moved into negative territory. In moving averages, the golden cross structure that began on May 17 was lost when the 50-day SMA crossed above the 200-day SMA. The Supertrend structure continues to maintain its bearish outlook.
Looking at weekly liquidation data, the buying level intensified in the 84,000–86,000 band with the recent rise, while the selling level has formed a fairly dense accumulation in the short term at 90,000 – 91,400, and in the long term at 94,000 – 95,500 and 97,000 – 98,000.
In summary, we have left behind the divergent monetary policies of global banks. As we approach the end of the year, if the picture does not change in the coming days, BTC is preparing to close the year negatively with 4.07%. It can be seen that the price, which closed negatively in 2014, 2018, and 2022, recorded significant increases in the following years.On the technical side, the price, which has managed to hold the new low of 80,500 for now, has started to push towards the 90,000 level again. Liquidity data indicates that buy and sell orders have become targets again. In the coming period, the price could potentially rebound after the recent decline if it breaks above the descending trend line. In this context, if the 90,000 level is broken and closes above it, the 93,000 level will be monitored. On the other hand, with the impact of fundamental developments forming a reverse flag pattern, the price will come under selling pressure again, and 85,000 will be monitored as a critical reference point. If broken, it will be monitored as the last reference point before the price tests the double bottom at 80,000.
Supports: 85,000 – 83,800 – 80,500
Resistances: 90,000 – 95,000 – 98,000
ETH/USDT
Following last week, the picture on the Ethereum front points to a gradual recovery on both the fundamental and technical sides, but this improvement has not yet turned into a strong and clear trend reversal. While technical uncertainties and weak liquidity conditions stood out last week, recent data shows that the market is seeking to rebalance.
The most notable fundamental development was JPMorgan, one of the world’s largest financial institutions, launching a tokenized money market fund on the Ethereum network. This fund, which will trade on the public Ethereum blockchain under the MONY ticker, demonstrates that confidence in Ethereum’s infrastructure among institutional investors remains strong and is even deepening. This move by an institution with $4 trillion in assets under management stands out as a factor strengthening Ethereum’s role in financial infrastructure, independent of short-term price pressures.
However, pressure continues on the spot ETF front. Over the last five trading days, spot ETH ETFs saw a net outflow of $587.4 million, which has been one of the main factors limiting the upside potential for prices in the short term. The fact that most of the outflows originated from the BlackRock ETHA fund suggests that institutional investors remain cautious. The decline in cumulative net inflows to $12.54 billion clearly indicates weak spot demand.
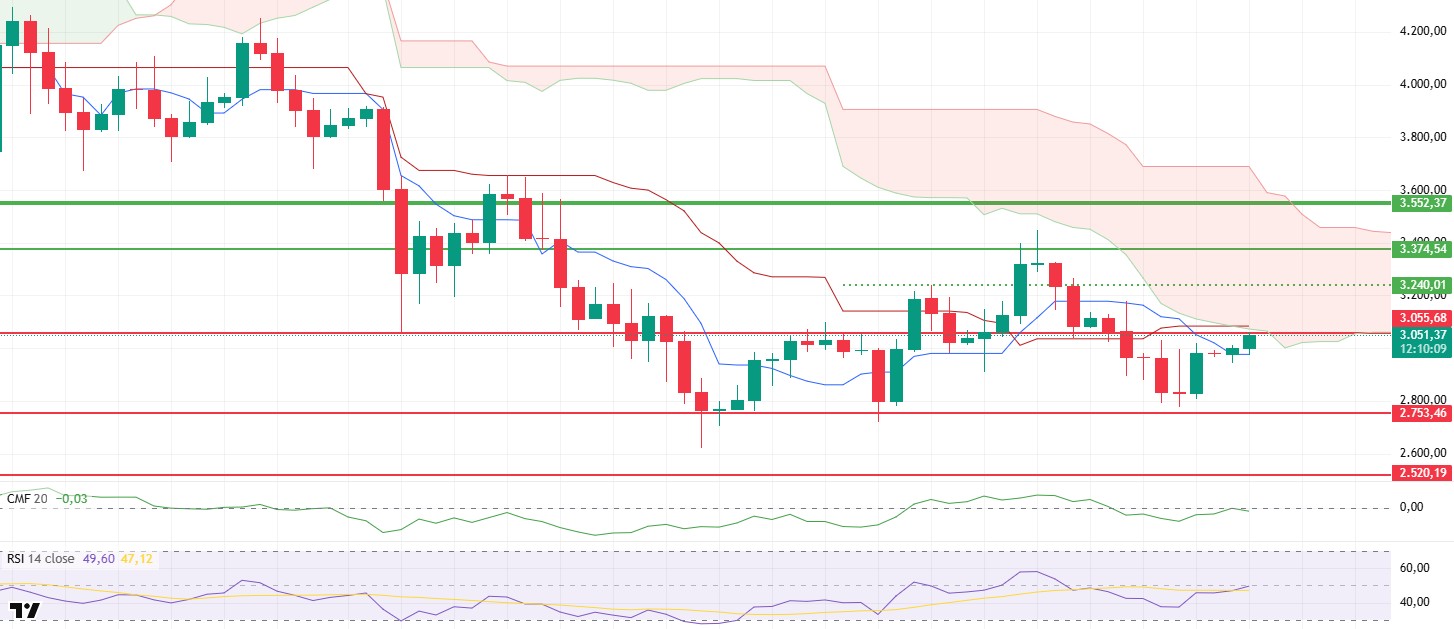
On the price front, a sharp sell-off occurred at the beginning of last week after the $3,055 support level was lost, and ETH retreated to the $2,750 range. Thanks to buying activity from this area, the price recovered to the $3,055 level by the end of the week. This level also acts as strong resistance as it coincides with the lower band of the Kumo cloud on the daily chart. The difficulty of upward movements in this region indicates that caution is warranted from a technical perspective.
On-chain and futures data, however, present a more balanced picture despite technical pressure. The Spot Cumulative Volume Delta (CVD) slowing its decline, coupled with an increase in open interest and the funding rate returning to positive territory, indicates that upward expectations in the market have not completely vanished. This structure creates a foundation that could support upward price attempts in the short term.
Looking at liquidity indicators, the Chaikin Money Flow (CMF) rose to the zero line for the first time since December 14. Although the indicator is still in negative territory, the shift to positive slope signals that liquidity inflows have resumed in the market. If this movement continues, upward price attempts could become more robust.
On the momentum front, the Relative Strength Index (RSI) rose without producing a negative divergence at the 50 level. This indicates that momentum has strengthened significantly compared to the previous week and that buyers have become more eager. However, the RSI’s ability to remain in positive territory will be critical for the continuation of the uptrend.
On the Ichimoku indicator, the price gaining the Tenkan level turns the short-term outlook positive. However, the lower band of the kumo cloud at the $3.074 level remains the most important threshold to overcome. Daily closes above this level could generate a strong signal for the medium-term trend to shift from a negative to a positive outlook.
Looking at the broader picture, there has been a noticeable improvement in technical indicators compared to last week. If this improvement continues, the $3,240 level could come into focus as an intermediate target if prices remain above $3,074. On the downside, the $2,753 level remains a critical support. If prices remain below this band, the technical structure could weaken again. The price reaction around $3,074 in the coming days will be the key factor determining the overall direction for the week.
Supports: 3,055 – 2,753 – 2,520
Resistances: 3,240 – 3,374 – 3,552
XRP/USDT
Following last week, the picture on the XRP side points to a clear divergence in fundamentals and flow, despite weakness on the price front. While the uncertainty highlighted last week persists this week, market dynamics are showing a more complex structure.
A noteworthy development on the institutional side is that despite 20 consecutive days of net inflows into XRP ETFs, the price has lost important technical support levels. This scenario indicates that demand has not completely disappeared, but selling pressure remains strong in both the spot and futures markets. The fact that ETF inflows are not reflected in the price suggests that the market is struggling to generate confidence in the short term and that incoming purchases are largely passive.
On the fundamental front, Ripple Labs’ RLUSD move stands out. The expansion of the USD-backed stablecoin RLUSD to Ethereum layer-2 networks shows that Ripple is not limiting its ecosystem to the XRP Ledger and is strengthening its focus on interoperability. The pilot process launched on Optimism, Base, Ink, and Unichain can be seen as a strategic step that could expand the Ripple ecosystem’s use cases in the long term. However, this development does not appear to be providing direct support for the XRP price in the short term.
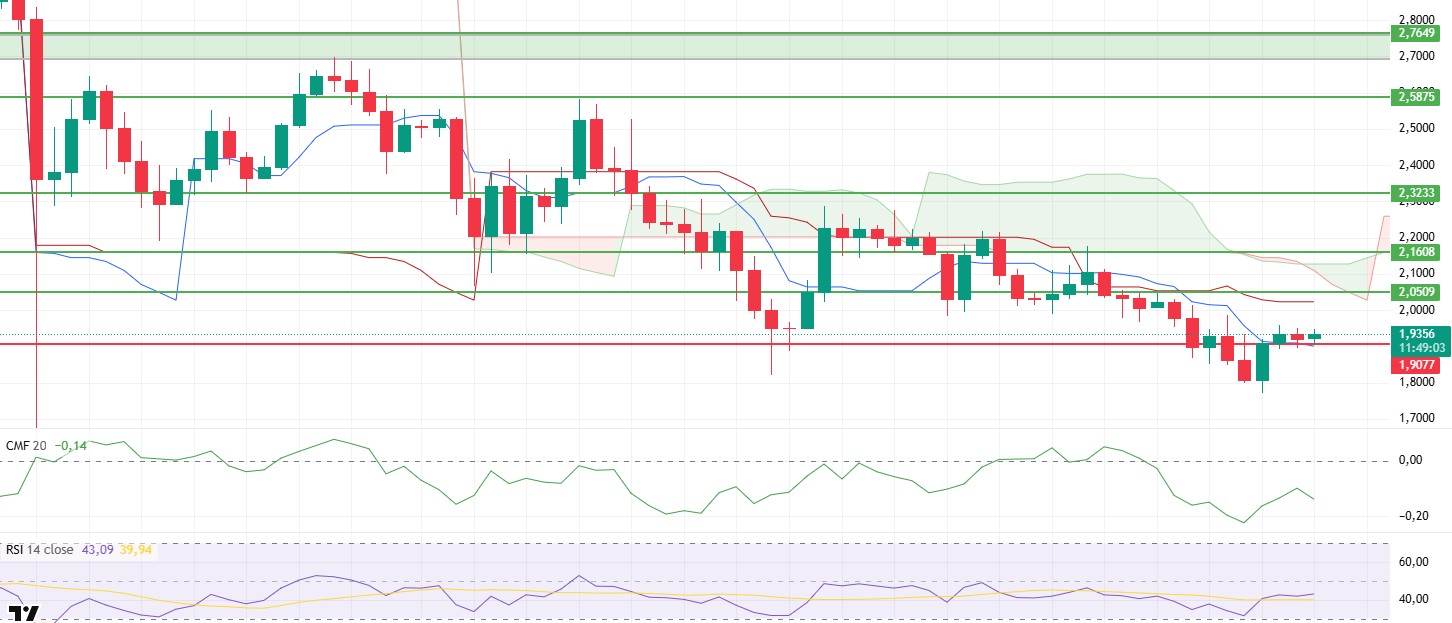
On the price front, last week saw a sharp sell-off following the loss of the $1.90 support level, with the pullback deepening to the $1.77 level. Thanks to buying activity from this region, the price recovered above $1.90 and is currently attempting to stabilize around $1.93. Despite the rebound, the structure remains fragile, and the upward movement appears limited.
On the liquidity side, Chaikin Money Flow (CMF) remains in negative territory. A slight upward slope in recent days indicates that liquidity inflows have started, albeit limited, but this movement does not yet signal a strong recovery. The CMF’s failure to approach the zero line remains one of the main factors explaining why upward attempts have remained weak.
On the momentum front, the Relative Strength Index (RSI) shows a similar picture. Although the RSI shows a slight upward trend, it has not yet generated strong momentum. This outlook reveals that selling pressure has decreased but buyers have not yet gained enough strength to take control.
The overall structure of the Ichimoku indicator has not changed. The price gaining the Tenkan level creates limited positivity in the short term, but the price is still below the kumo cloud and behind the Kijun level. This situation indicates that the medium-term trend remains weak and selling pressure can be easily triggered.
In the overall assessment, the $1.90 level is a critical threshold. If this level is maintained, a recovery attempt towards the $2.05 region may be on the agenda in the short term. Conversely, losing $1.90 again could accelerate selling pressure and bring the risk of a sharp decline back to the forefront. Despite limited improvements in liquidity and momentum, XRP continues to search for direction, and the price’s reaction at these critical levels will determine the overall trend for the week.
Supports: 1.9077 – 1.7867 – 1.6189
Resistances: 2.0500 – 2.1608 – 2.3233
SOL/USDT
Within the Solana ecosystem;
- JPMorgan conducted a Galaxy bond issuance via the Solana-based USCP token.
- Phantom and Visa announced a new Solana-supported bank card. The card is currently available in the US.
- StraitX will launch Singapore and US dollar stablecoins on Solana for fast currency exchange.
- Project Eleven partnered with the Solana Foundation to strengthen the Solana ecosystem against emerging quantum computing threats.
- Solana is entering Brazil’s main exchange as Valour expands its regulated crypto access.
- Phantom is adding prediction markets with Kalshi integration.
- Mangoceuticals is turning to Solana with a $100 million digital asset treasury strategy.
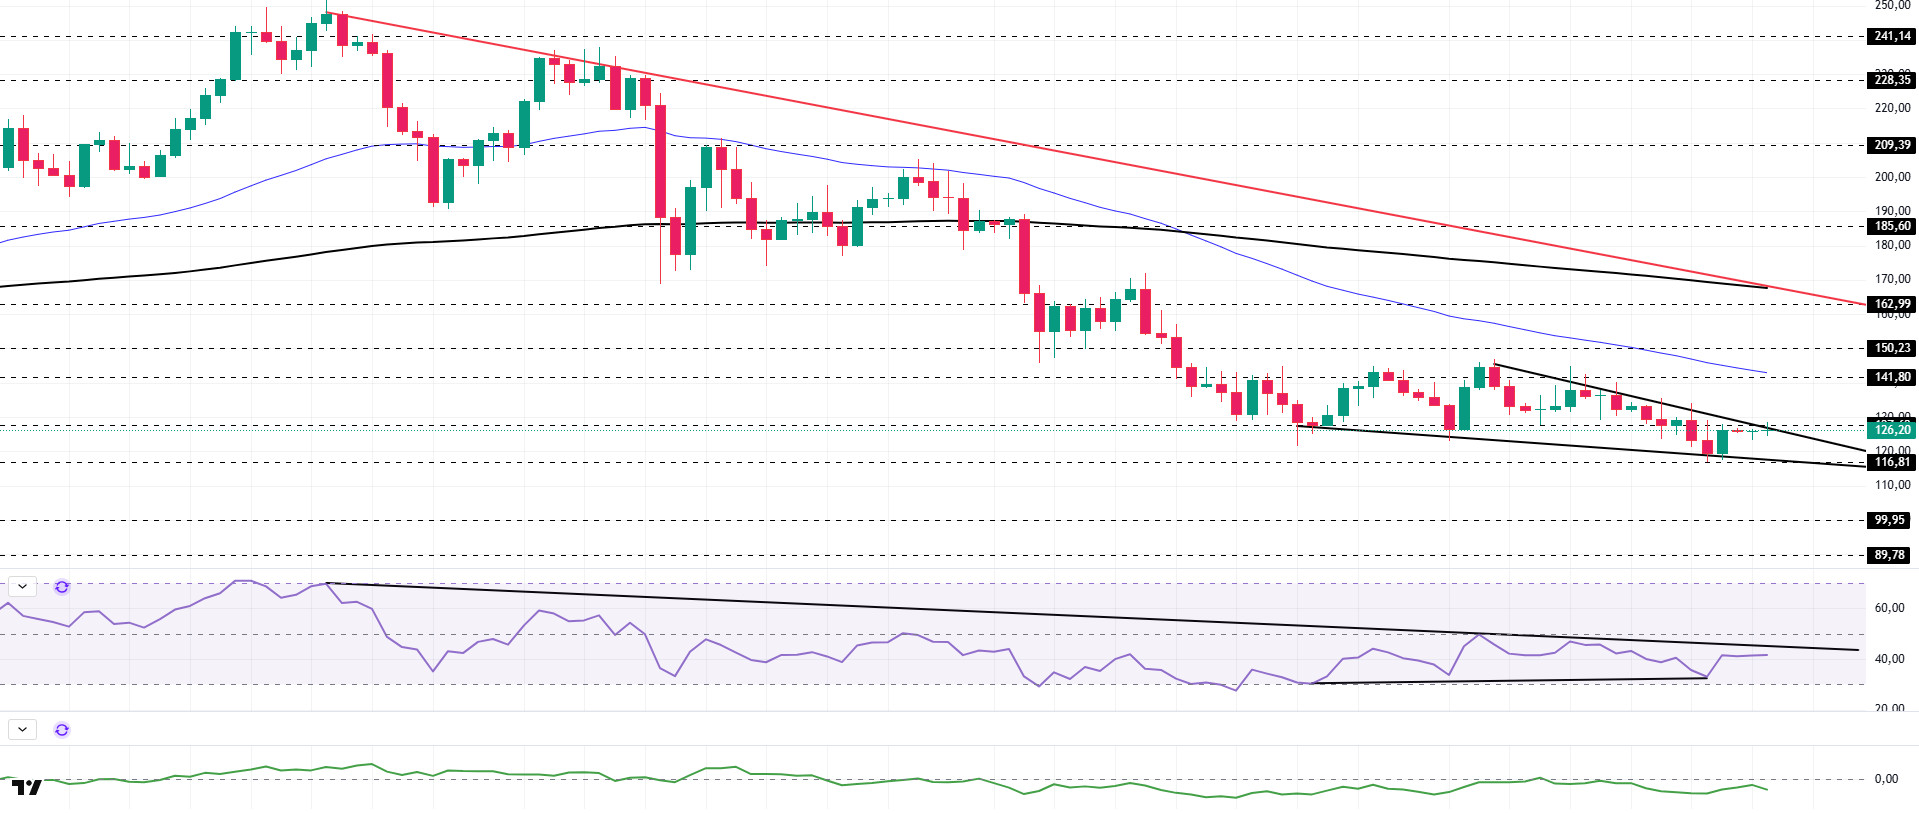
The SOL price followed a volatile trajectory on the daily chart this week. The asset remained in the lower region of the downtrend that began on September 18. Testing the strong support level of $116.81 and the base level of the descending wedge formation as support, the price accelerated upward from there. Currently testing the base level of the descending wedge formation and the resistance level of $127.62, the price may test the 50 EMA (Blue Line) moving average as resistance in candle closes above this level. In case of a pullback, the $116.81 level should be monitored.
The asset is trading below its 50 EMA (Exponential Moving Average – Blue Line) and 200 EMA (Black Line) moving averages, indicating that the asset is trending downward. Furthermore, the 50 EMA remained below the 200 EMA. This indicates that a technical “dead cross” formation is continuing. This also shows that the potential for a decline in the medium term is increasing. The RSI (14) is hovering around the midpoint of the negative zone. At the same time, the indicator has remained below the downward trend line that began on July 22. These factors suggest that selling pressure may continue. The Chaikin Money Flow (CMF-20) has fallen to a negative level. At the same time, an increase in the inflow and outflow of funds on could push the CMF-20 indicator back to a neutral level. If macroeconomic data remains positive and developments in the ecosystem continue to be favorable, the first major resistance level of $162.99 could be retested. Conversely, in the event of potential negative news flow or deterioration in macro data, the $99.95 level could be monitored as a potential buying opportunity.
Supports: 116.81 – 99.95 – 89.78
Resistances: 127.62 – 141.80 – 150.23
DOGE/USDT
House of DOGE announced its merger with NASDAQ and surpassed 730 million DOGE in treasury assets.
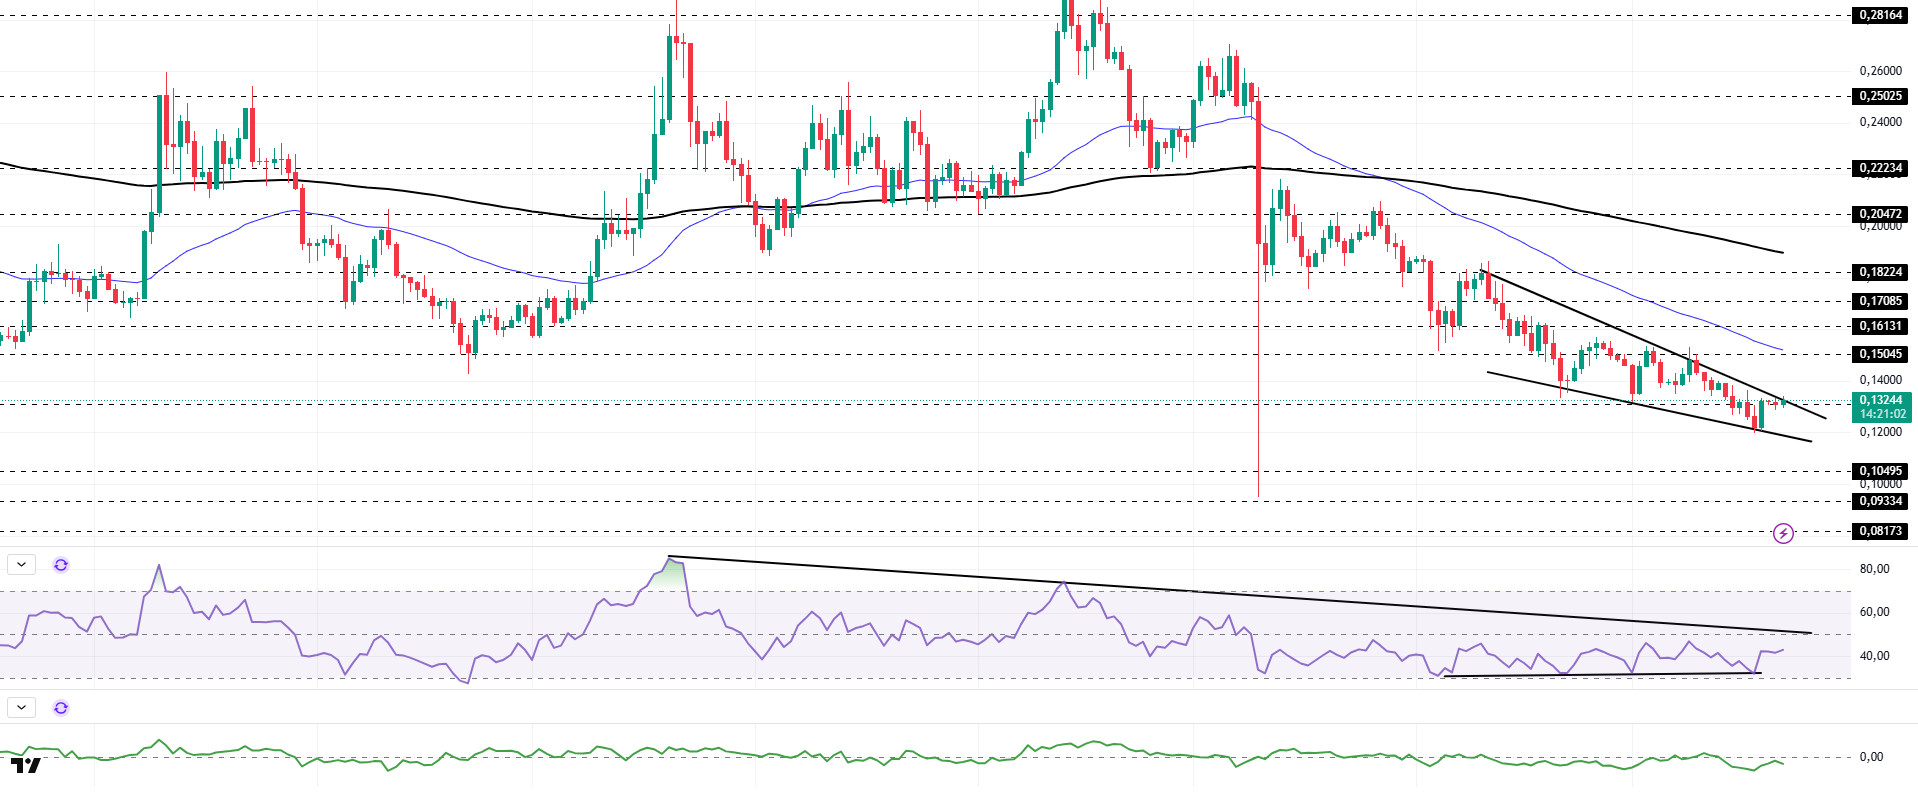
On the daily chart, DOGE has been trading sideways in a narrow range since last week. The asset continued to price within the descending wedge formation that began on November 10. Testing the base level of the wedge formation, which is a strong support level, the price failed to break through this level and showed a slight increase. Currently testing the resistance level of the descending wedge formation’s ceiling, the asset may test the 50 EMA (Blue Line) moving average as resistance in candle closes above this level. In the event of a decline, it may test the $0.10495 level as support.
The asset continued to trade below the 50 EMA (Blue Line) and 200 EMA (Exponential Moving Average – Black Line) moving averages. This indicates that the asset is in a downward trend. On the other hand, the 50 EMA moving average being below the 200 EMA moving average shows us that the “dead cross” formation is continuing. This also indicates that the asset has the potential to lose value at this moment. The Chaikin Money Flow (CMF–20) indicator has fallen into negative territory. Money inflows continue to decline. This could push the CMF-20 deeper into negative territory. Looking at the Relative Strength Index (RSI-14) indicator, it rose from the oversold zone to the middle of the negative zone. At the same time, it remained below the downward trend line that has been in place since September 13. This indicates that selling pressure may continue. However, positive divergence should be monitored. In the event of macroeconomic risks or negative news from the ecosystem, the $0.10495 level can be monitored as strong support. On the other hand, if the upward movement gains strength, the $0.17085 level comes to the fore as the first strong resistance level.
Supports: 0.10495 – 0.09334 – 0.08173
Resistances: 0.13107 – 0.15045 – 0.16131
TRX/USDT
Last week, TRON announced its integration with Base, an Ethereum Layer-2 network developed by Coinbase. This integration enables the easy and seamless transfer of TRON’s native token, TRX, to the Base network. Additionally, TRON announced the integration of Kalshi, the world’s largest prediction market platform, into the TRON blockchain network. This integration provides seamless USDT deposits and withdrawals on TRON while supporting the migration of real-world assets (RWA) to the blockchain infrastructure, strengthening Kalshi’s multi-chain structure and bridging traditional finance with the Web3 ecosystem.
Last week, the TRON network generated a total of $48.3 million in revenue, continuing to be the highest-earning ecosystem among all blockchain networks. This revenue dynamic confirms that TRON’s stablecoin-centric transaction volumes form a strong foundation for the network’s economy.
During the week of December 15-21, 2025, a total of 24.6 million TRX were burned on the TRON network. Despite this, the circulating supply increased by 2.8 million. While the increase in circulating supply may create limited inflationary pressure on TRX in the short term, the continuity of the burning mechanism may contribute to balancing this effect in the medium term. Additionally, the total number of addresses increased by 1.6 million to reach 354.6 million during the same week.
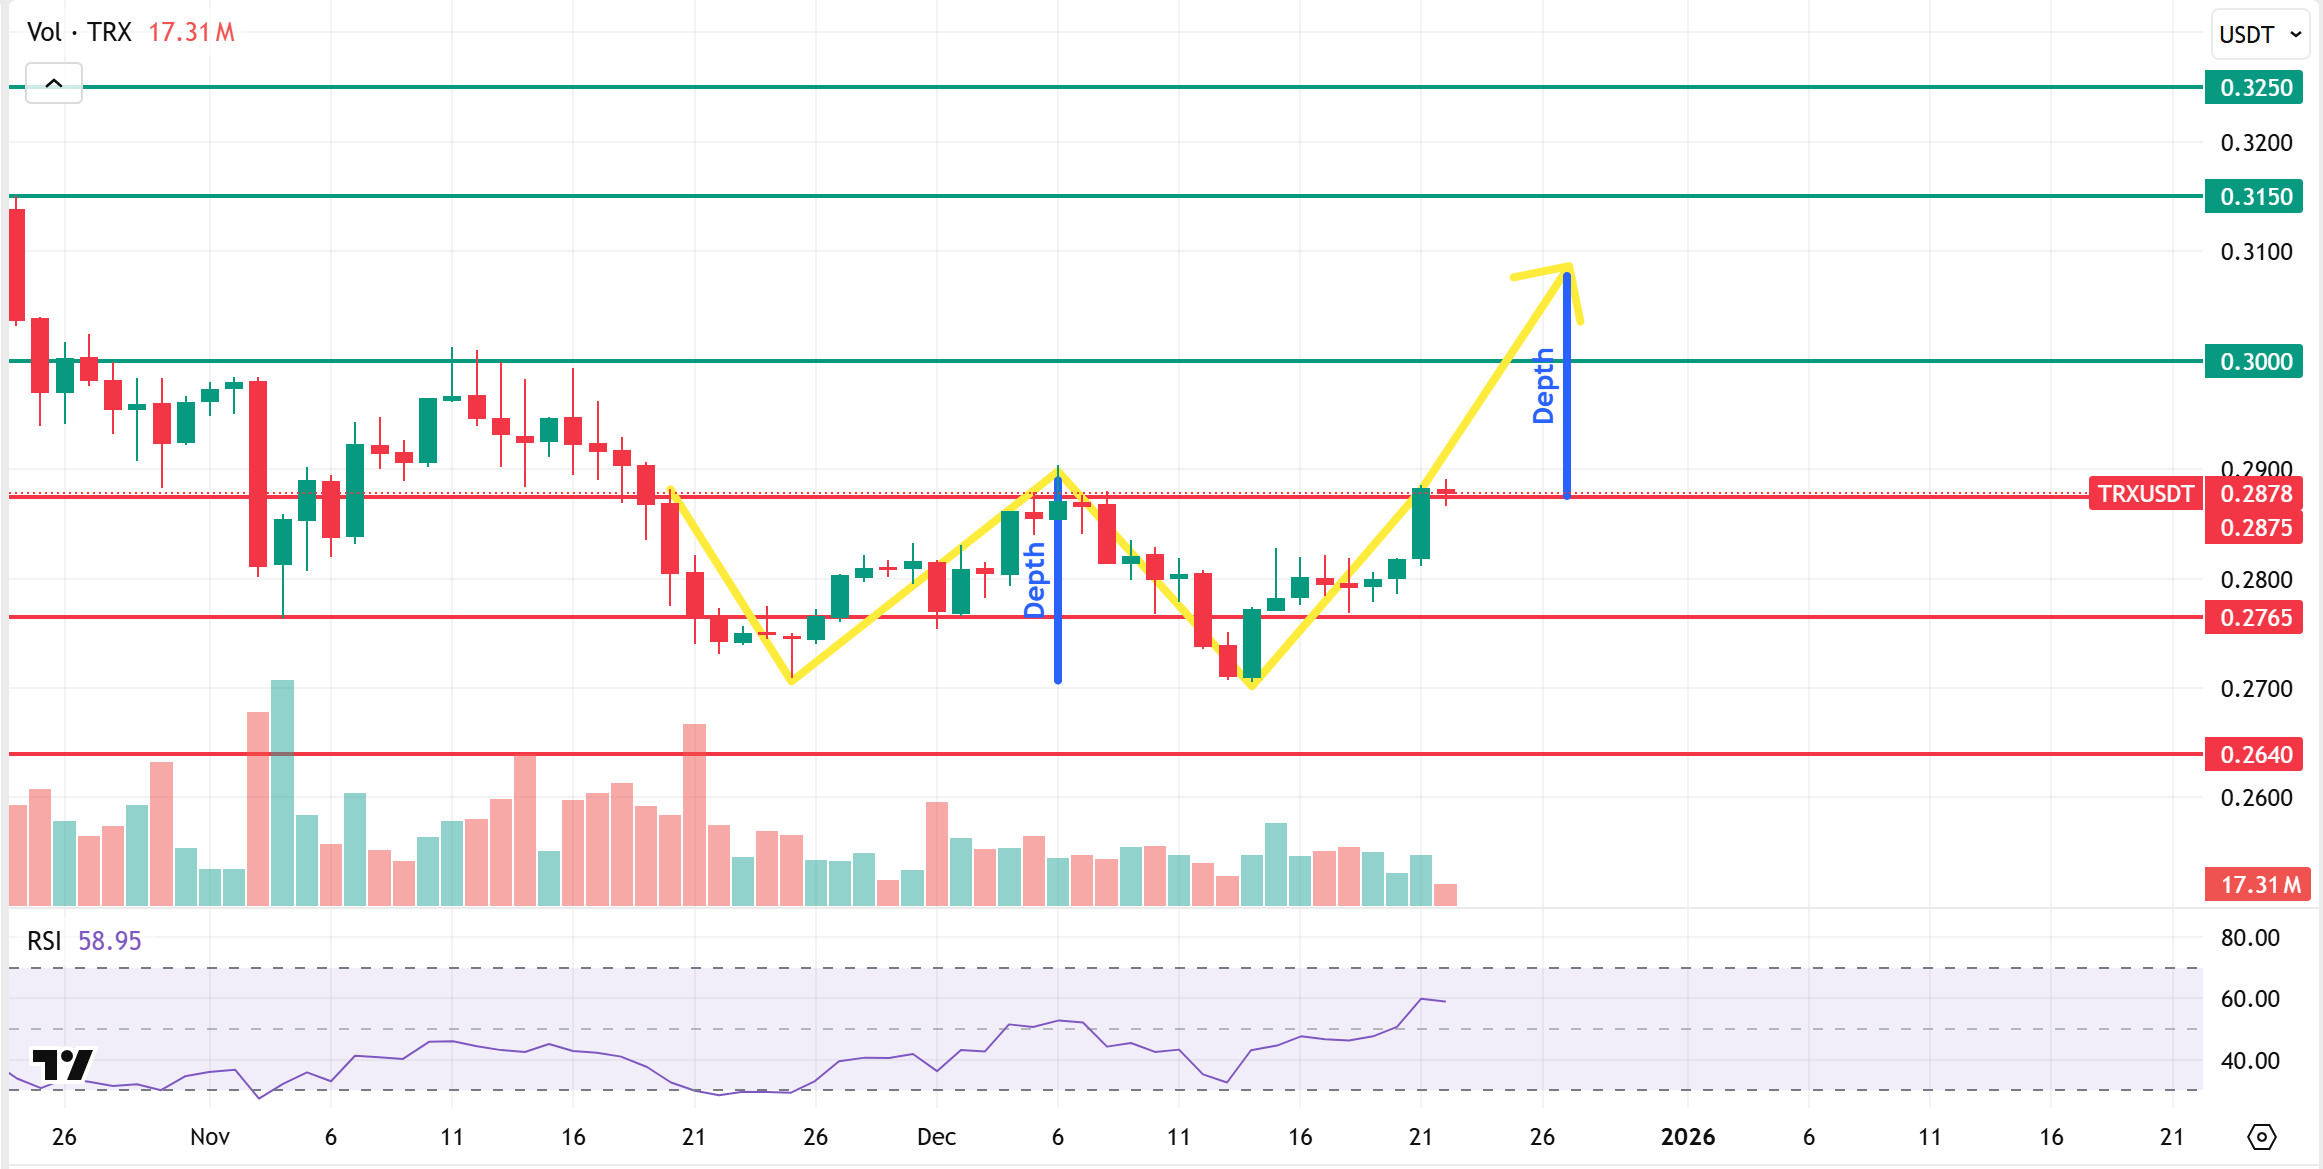
Technically speaking, TRX started last week at 0.2771 and gained approximately 4% in value throughout the week, closing at 0.2883. Thus, TRON ended the week with an increase, bringing its market value to $27.3 billion. With the latest price movement, it has formed a double bottom pattern on the daily chart. Currently trading at 0.2878, TRX is hovering just above the critical support and neckline at 0.2875. Sustained closes above this level ( ) could bring a price movement towards the pattern’s technical target of 0.3080. However, trading volume must be closely monitored for the pattern to gain validity, and strong increases observed in low volume would support an upward movement. If TRX fails to close above the 0.2875 support level and a negative break occurs in market sentiment, a pullback in price could be expected due to selling pressure from this area. In this scenario, the support levels of 0.2765 and 0.2640 may come into play. The 0.2640 level is being monitored as a critical support point on the daily chart. Sustained trading above this level could maintain the upward trend, while closes below it could lead to increased selling pressure and deeper downward price movements.
Supports: 0.2875 – 0.2765 – 0.2640
Resistances: 0.3000 – 0.3150 – 0.3250
AVAX/USDT
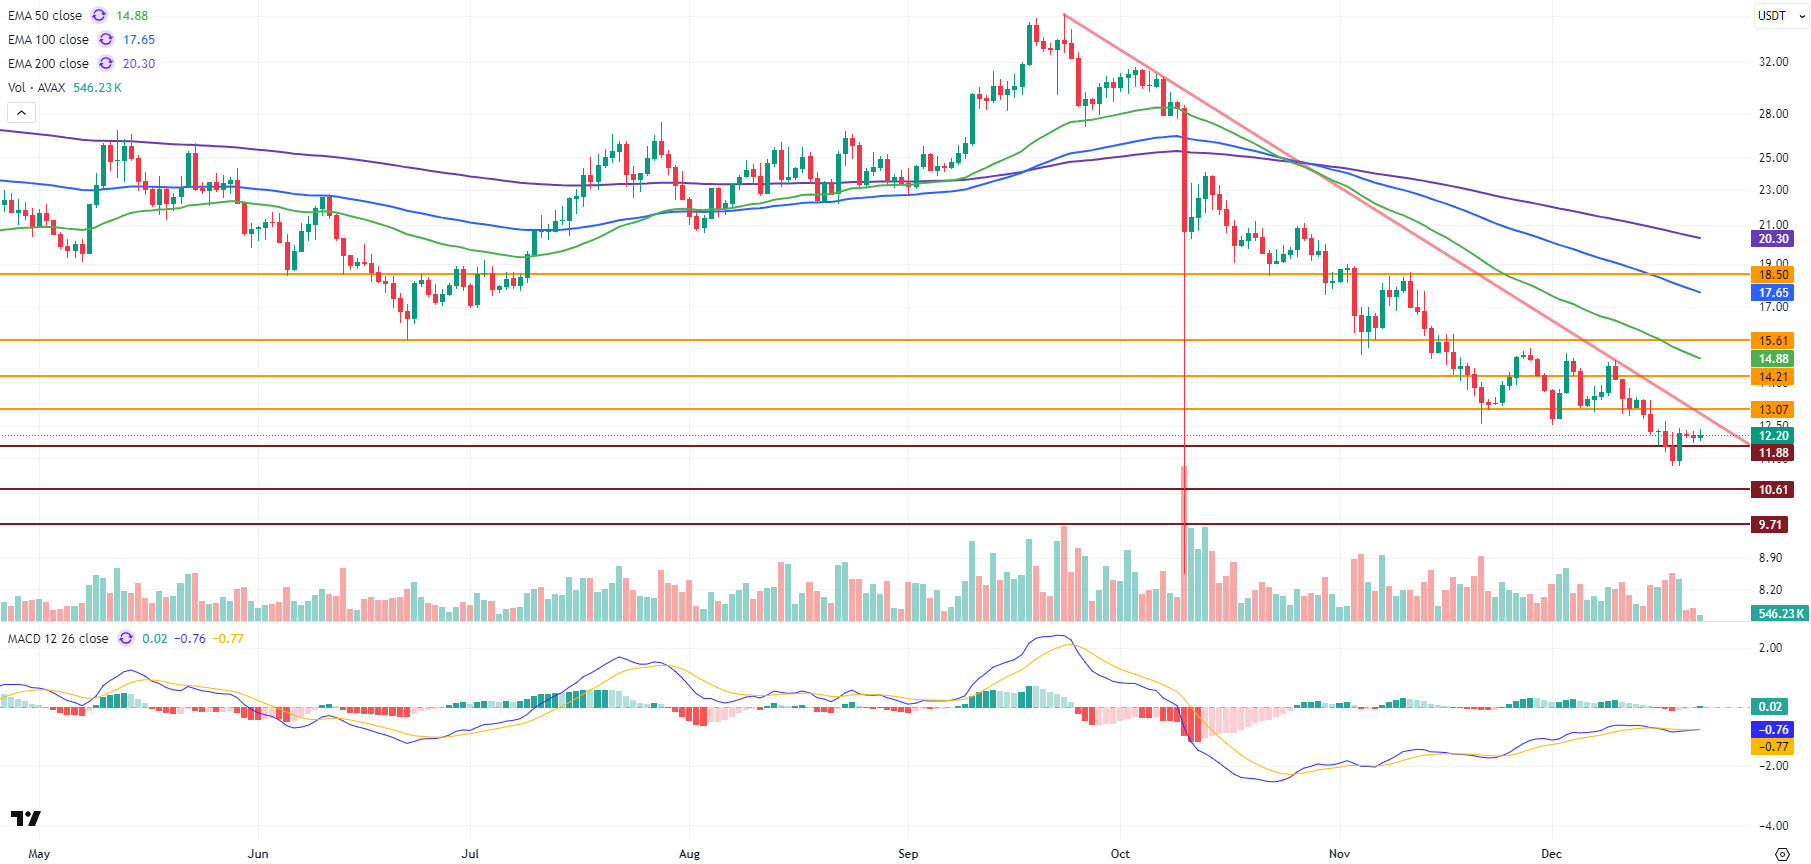
AVAX started last week at $12.88. Testing the $13.07 resistance level at the start of last week, AVAX fell amid selling pressure encountered in this region. During the decline, the $11.88 support level was broken, and AVAX fell to the $11.26 level. AVAX recovered with buying activity in this area and rose above the $11.88 level again, closing the week at $12.14. AVAX lost approximately 5.75% of its value on a weekly basis. Although positive developments in the Avalanche ecosystem and VanEck’s AVAX ETF application attracted attention last week, the ongoing low volume and weak risk appetite in the cryptocurrency market prevented these developments from having a lasting impact on AVAX’s price. AVAX continues to trade within a horizontal band in the first part of the new week, influenced by the horizontal trend seen over the weekend.
On the daily chart, the Moving Average Convergence/Divergence (MACD) line remains above the signal line but is trading in negative territory and trending sideways. This indicates that momentum has not yet shifted to a strong positive structure. The MACD line and signal line are running very close to each other, increasing the likelihood of a directional breakout in the short term. However, the MACD’s failure to move into positive territory indicates that upward attempts remain weak. Strengthening momentum and the MACD moving into positive territory will be critical for AVAX to break through resistance levels. In the opposite scenario, selling pressure that could form at resistance levels may limit the upside again. On the EMA side, AVAX continues to trade below all critical Exponential Moving Average (EMA) levels. The concentration of these EMA levels above the price confirms a strong resistance band while also confirming that the overall trend remains negative. The current technical structure indicates that the rallies are still limited to rebound buying and that an increase in volume and momentum is needed for a sustained trend reversal.
From a technical perspective, the $13.07 level is the first critical resistance for AVAX’s rise. If this level is broken and weekly closes above it occur, the $14.21 and $15.61 resistance levels could come into play. In the medium term, the $18.50 level stands out as a major resistance, and staying above this level is critical to confirm the trend reversal. In a downside scenario, the $11.88 level is the first important support level. If this level is lost again, selling pressure could increase, and AVAX could fall towards the $10.61 and $9.71 support levels, respectively. In the overall outlook, the MACD remaining in negative territory and AVAX trading below all critical EMA levels indicates that pressure continues on a weekly basis. Unless there is a clear strengthening in momentum and closes above resistance levels, recovery attempts are likely to remain limited.
(EMA50: Green Line, EMA100: Blue Line, EMA200: Purple Line)
Supports: 11.88 – 10.61 – 9.71
Resistances: 13.07 – 14.21 – 15.61
SHIB/USDT
This week, the Shiba Inu ecosystem’s agenda revolved around increased visibility in regulated market channels with on-chain activity. A long-dormant Coinbase-sourced wallet becoming active again and withdrawing a large amount of SHIB from the exchange prompted renewed close monitoring of major player movements at . Subsequently, the launch of a US-compliant perpetual-style futures product based on the MarketVector Coinbase 1k SHIB reference rate by Coinbase Derivatives was noted as a step strengthening the ecosystem’s integration into institutional derivatives infrastructure. On the social media front, changes observed in the badge and linked account structure of the official Shib account on X raised questions within the community, but account management emphasized that this was a cost-focused adjustment and that the focus remains on SHIB and ShibArmy. The statements shared by K9 Finance under this heading clarified the communication line regarding the badge discussion and reminded the community that expectations for process clarity remain high following the Shibarium bridge exploit. At the close of the week, on-chain net flow data pointing to supply exiting exchanges emerged as an additional monitoring headline, suggesting that holding behavior may strengthen.
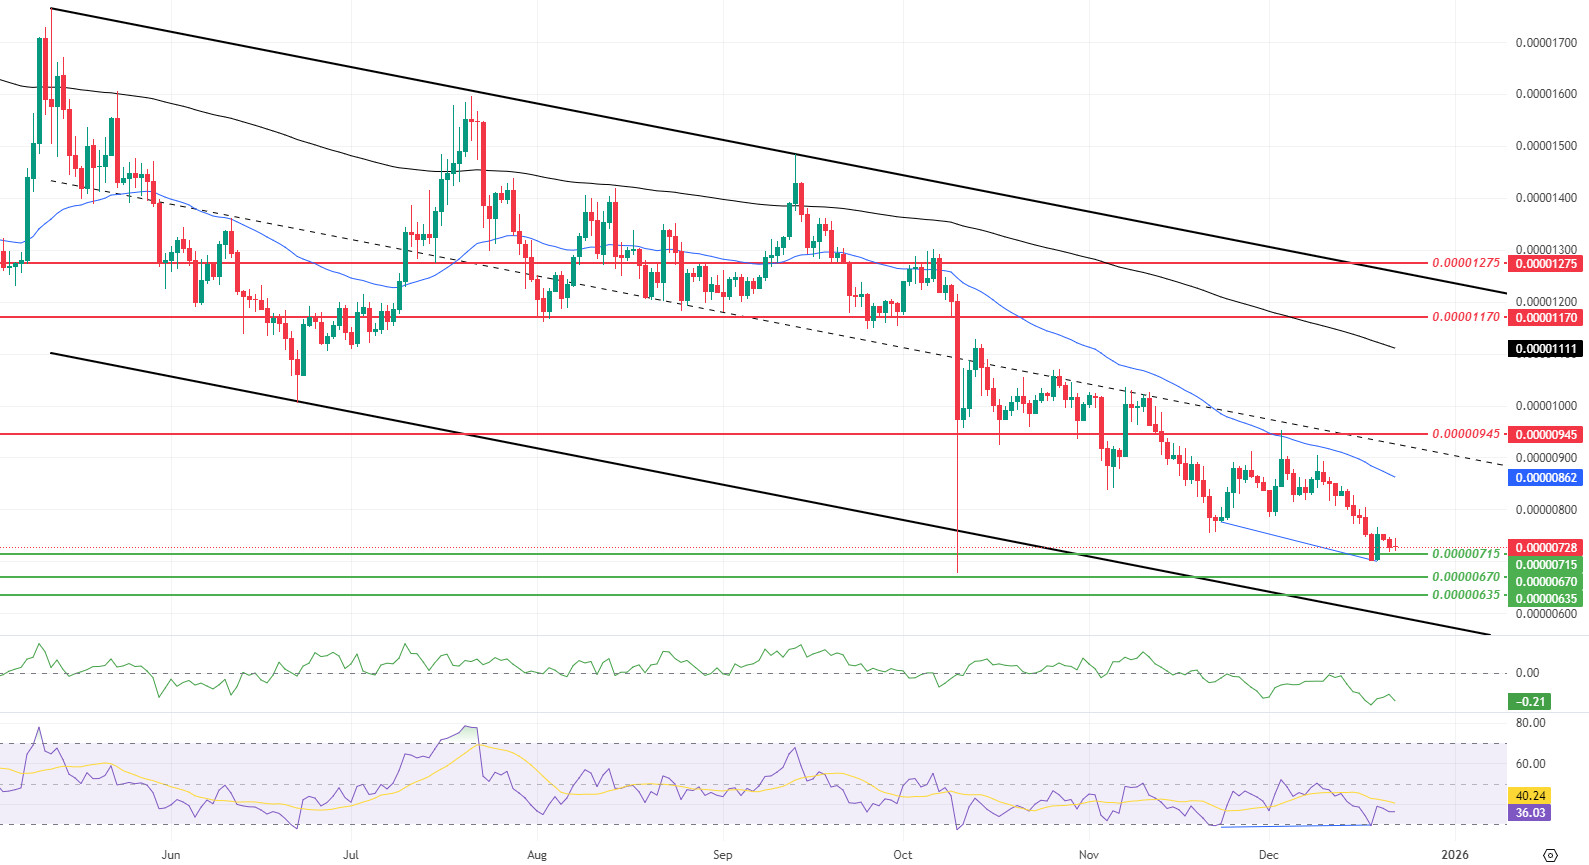
This week’s technical outlook maintains the structure where pressure within the descending channel has become more pronounced and the previous rebound attempt has weakened. The simultaneous decline in volume, momentum, and volatility suggests that selling is proceeding gradually and with low energy rather than aggressive panic, while also indicating that the capacity to generate a rebound remains limited. The Chaikin Money Flow (CMF) indicator remaining in negative territory confirms that buyer liquidity is fragile and that upward attempts are struggling to gain traction. The price continuing to trade below the 50-period Exponential Moving Average (EMA) and 200-period Exponential Moving Average (EMA) signals that the main trend is still downward and that the current movements remain limited waves within the downtrend.
The critical change in the short term was the loss of the main support level at $0.00000760. The price rebounding from the support zone at $0.00000715 indicates a search for temporary equilibrium amid downward pressure, while the positive divergence between the Relative Strength Index (RSI) and the price (Blue Line) produces an early signal that selling momentum is weakening. However, as long as the CMF remains in negative territory and the price trades below the EMA50 and EMA200, this divergence alone may not signal a trend reversal. Should there be consecutive closes below the support at $0.00000715, the levels at $0.00000670 and $0.00000635 are likely to come back into focus. Given the low volatility, it is important to keep in mind that if a break below support occurs, the movement could evolve into a structure that accelerates rapidly in a short time. In a potential upward relief scenario, the first critical threshold is again the region around $0.00000945. Without volume-supported and consecutive closes above this level, it seems difficult for a more meaningful and lasting recovery scenario towards the resistance areas at $0.00001170 and $0.00001275 to gain strength. In the big picture, the price moving above EMA50 and then EMA200, along with the CMF producing a recovery signal towards the zero line, remain fundamental conditions for a trend breakout. (EMA200: Black line, EMA50: Blue line)
Supports: 0.00000715 – 0.00000670 – 0.00000635
Resistances: 0.00000945 – 0.00001170 – 0.00001275
BNB/USDT
The latest BNB Chain data shows that high activity across the BNB Chain has been maintained compared to the previous week. The average daily active user count on BSC reaching 2.41 million indicates that it has remained above the 2 million mark, similar to the previous week. On the opBNB side, the DAU level of 1.65 million shows that high user participation continues compared to the previous week. In terms of total transaction numbers, BSC remained close to the previous week’s level of around 100 million transactions, with approximately 99.3 million transactions. opBNB’s 21.7 million transactions show a stable and flat picture compared to the previous week. The total transaction volume of $32.5 billion indicates no significant deviation from the previous week, suggesting that economic activity on the chain is maintained at similar levels. On the total value locked (TVL) side, the $10.7 billion level shows a flat trend with limited change compared to the previous week, indicating that capital locked in the ecosystem continues to be preserved.
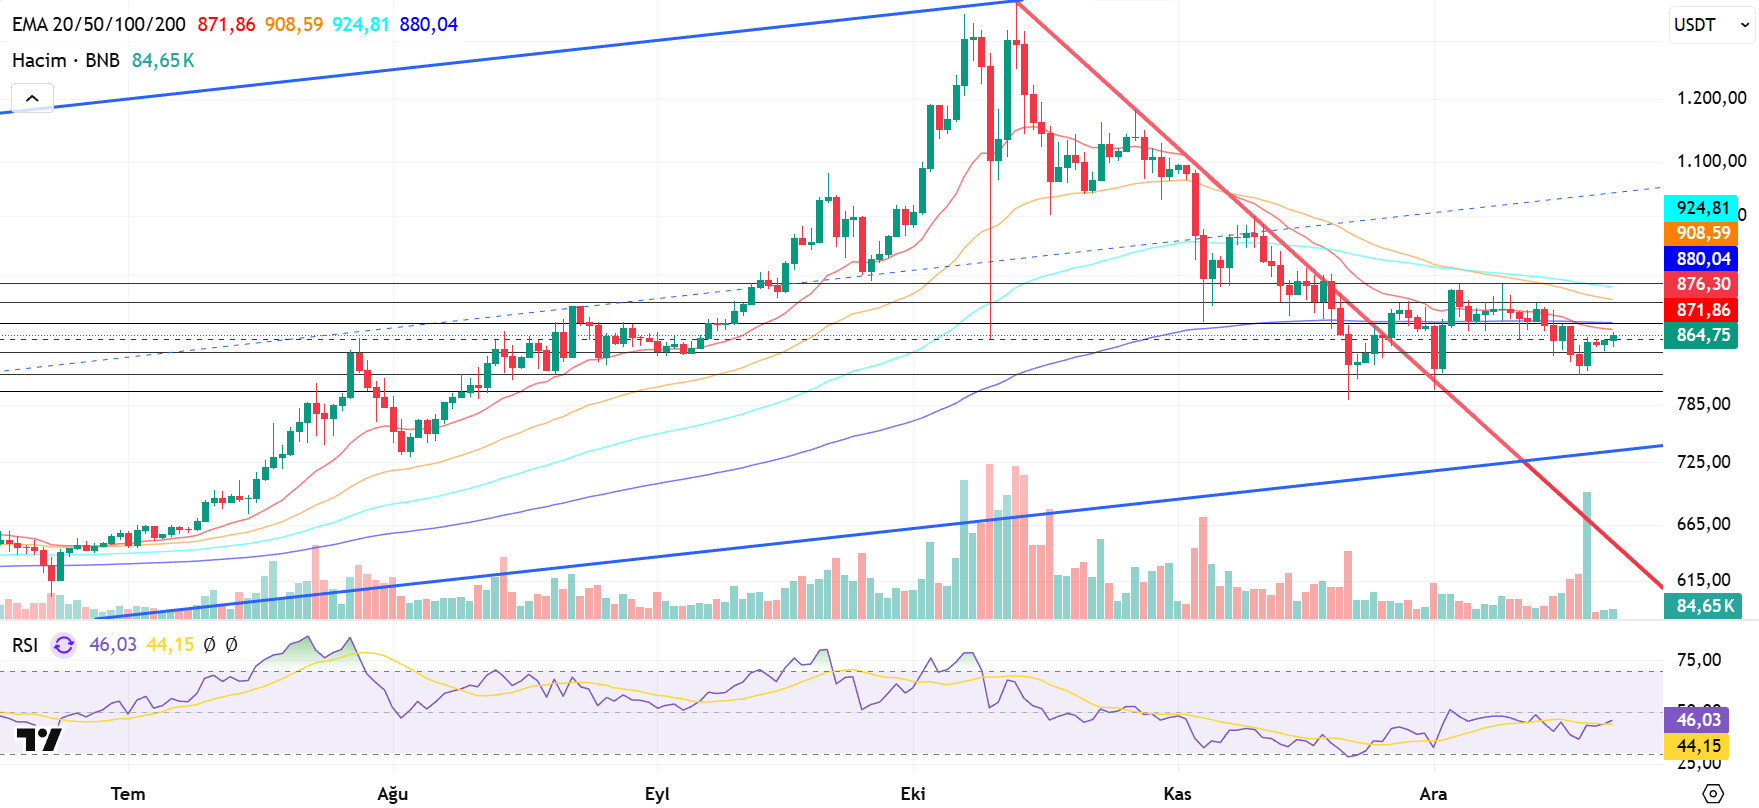
From a technical perspective, the correction that began after the all-time high (ATH) retreated to the $790 support zone identified in previous analyses. After seeking support at these levels for a while, BNB ended its downward momentum with the candlestick formations that formed and turned its direction upward again. With this recovery, the price gained positive momentum towards the descending trend line and, with the support of new candles, broke the descending trend upwards, rising to the $940 level. Although some pressure was seen in this region depending on market conditions, the overall positive outlook was maintained.
The current outlook for BNB/USDT is generally positive. However, the price moving within a horizontal band raises questions about which direction it will continue in the coming period. Upward price movements are expected to reinforce the current positive outlook.
Technical indicators for BNB, currently trading in the $845-$880 range, show that low trading volumes are limiting the upward momentum. In addition, the RSI indicator appears to be hovering at relatively low levels due to weak momentum.
According to the technical picture, if buying appetite is maintained and market momentum strengthens, BNB is expected to retest the $880 resistance level in the first stage. If this level is exceeded, it appears likely that the falling trend line will be broken. If the trend is broken and the price remains above this level, a rise towards the $905 and $930 levels appears technically possible. Conversely, if selling pressure increases, the price is expected to retest the $845 support level. If this level is broken, a pullback towards the $820 and $800 support zones will likely occur.
Supports: 845 – 820 – 800
Resistances: 880 – 905 – 930
LTC/USDT
Litecoin (LTC) ended the past week with a 2.75% decline against USDT, starting the new week at $76.79. LTC also lost 3.24% against Bitcoin during the same period, marking another negative week in terms of price performance. The six-week-long decline in LTC/BTC brought us to nearly the lowest levels in the pair. Currently, Litecoin’s total market capitalization stands at approximately $5.9 billion. With this pullback, Litecoin lost the one-step advantage it had gained last week and is trying to hold on to 19th place in the cryptocurrency market rankings, where it fell last week. On the futures front, the total open interest declined by 1.5% compared to the beginning of last week. Additionally, the long/short ratio remaining at 0.9869 for positions opened at the start of the new week indicates that derivatives market participants are slightly more moderate in their downward expectations.
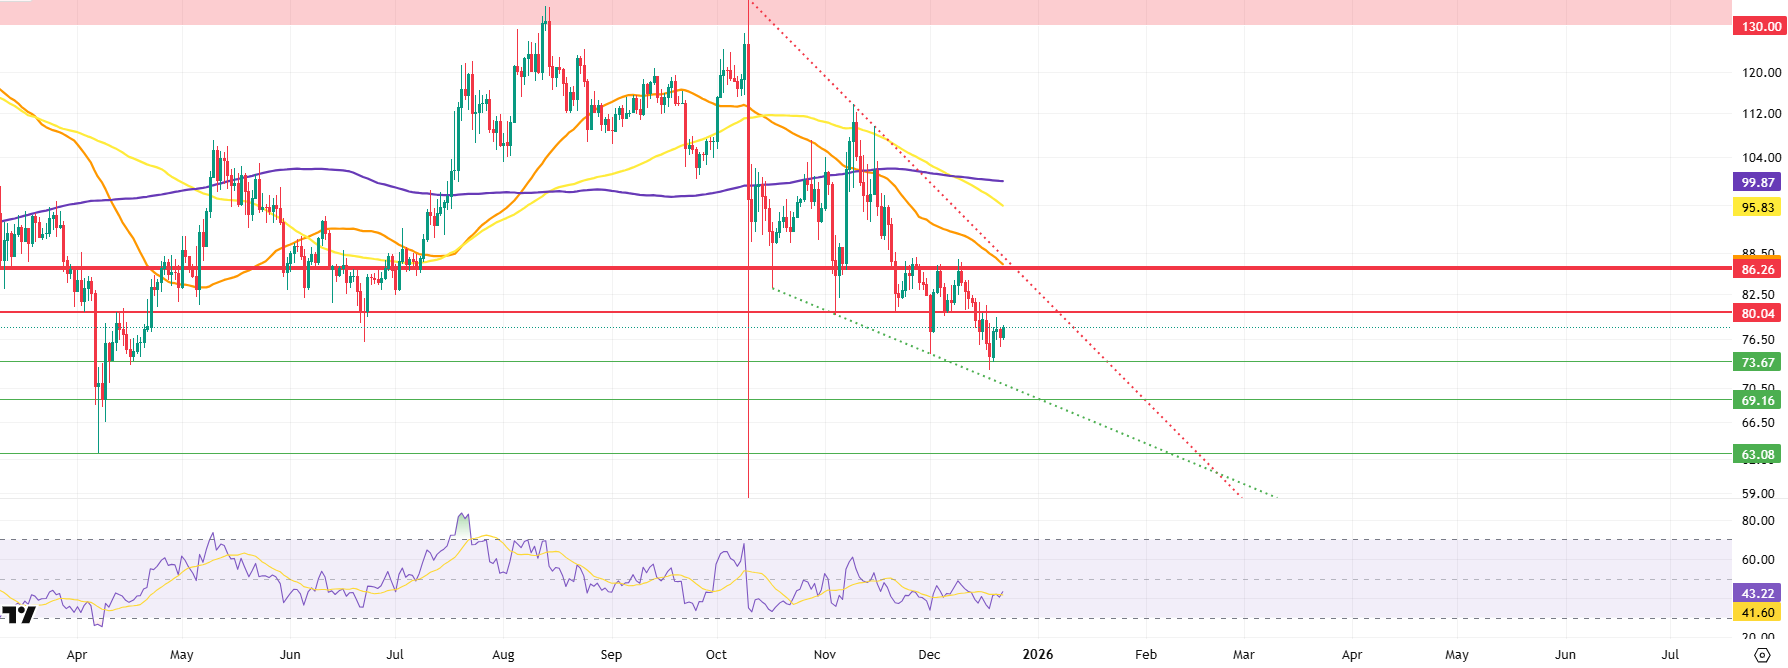
Looking at the daily candlestick chart, the Litecoin price continues to trade below the 100-period (yellow), 50-period (orange), and 200-period (purple) moving averages. This outlook can be seen as an indicator confirming that selling pressure has not yet been overcome in both the short and long term. Last week’s downward price movement, combined with a loss of volume in futures trading, is causing increased market anxiety, which is keeping buyers on the sidelines. The current structure indicates that more attractive technical formations for sell positions continue to develop.
On the chart, levels with the potential to pause or form local peaks during an uptrend this week stand out at 80.04, 86.26, and 99.87. It is clearly visible that the price has been moving within a descending wedge formation that has been narrowing significantly for a long time. While such structures statistically often result in an upward breakout, the significant narrowing of the area on the downside also suggests that selling pressure is weakening. In addition, the fact that there has not yet been a meaningful rebound against the ongoing downtrend strengthens the possibility of a short-term rise from current levels, which could be considered a technical rebound. At this point, the 80.04 level is a minor horizontal resistance that is likely to be broken. However, the truly critical zone is the 86.26 level. This level is an extremely strong resistance zone because it is where the 50-period moving average is located and coincides with the upper band of the descending channel (dashed red line). If this zone is broken with high volume, it is technically possible that the price will rise in stages towards the 200-period moving average, which is currently at the purple line at 99.87.
On the other hand, in the downward scenario predominantly priced by derivatives market participants, potential pullback levels where buying interest could emerge are highlighted as 73.67, 69.16, and 63.08, respectively. Of these levels, 73.67 is the key point in the current balanced price structure and could act as a mid-level support. Maintaining this region is critical for the current squeeze to continue unbroken. The lower level of 69.16 offers a technically stronger support area. This level coincides with the lower band of the descending channel (green dotted line) and is considered a relatively high probability area for a rebound due to its history of high trading volume and intense price reactions, making it a “crowded” zone. Finally, the 63.08 level acts as the “last line of defense” in the technical outlook. A break below this support would be critical enough to raise the possibility of a scenario that could seriously undermine the likelihood of a healthy recovery in the long term. However, it should also be noted that if the price falls to this area due to sharp and panic selling, significant opportunities could arise for long positions with a high risk-reward ratio.
Supports: 73.67 – 69.16 – 63.08
Resistances 80.04 – 86.26 – 99.87
LINK/USDT
Chainlink, working with over 30 banks as part of SWIFT’s tokenization-focused efforts, has developed a blockchain registry system that connects tokenized assets. Considering that SWIFT’s annual transaction volume exceeds $150 trillion, the fact that this development was carried out by Chainlink demonstrates that institutional trust is concentrated on Chainlink. Additionally, these partnerships also mean “recurring revenue” for Chainlink. Using a portion of its generated revenue, Chainlink regularly purchases Link tokens for the Chainlink Reserve, creating positive pressure on the price.
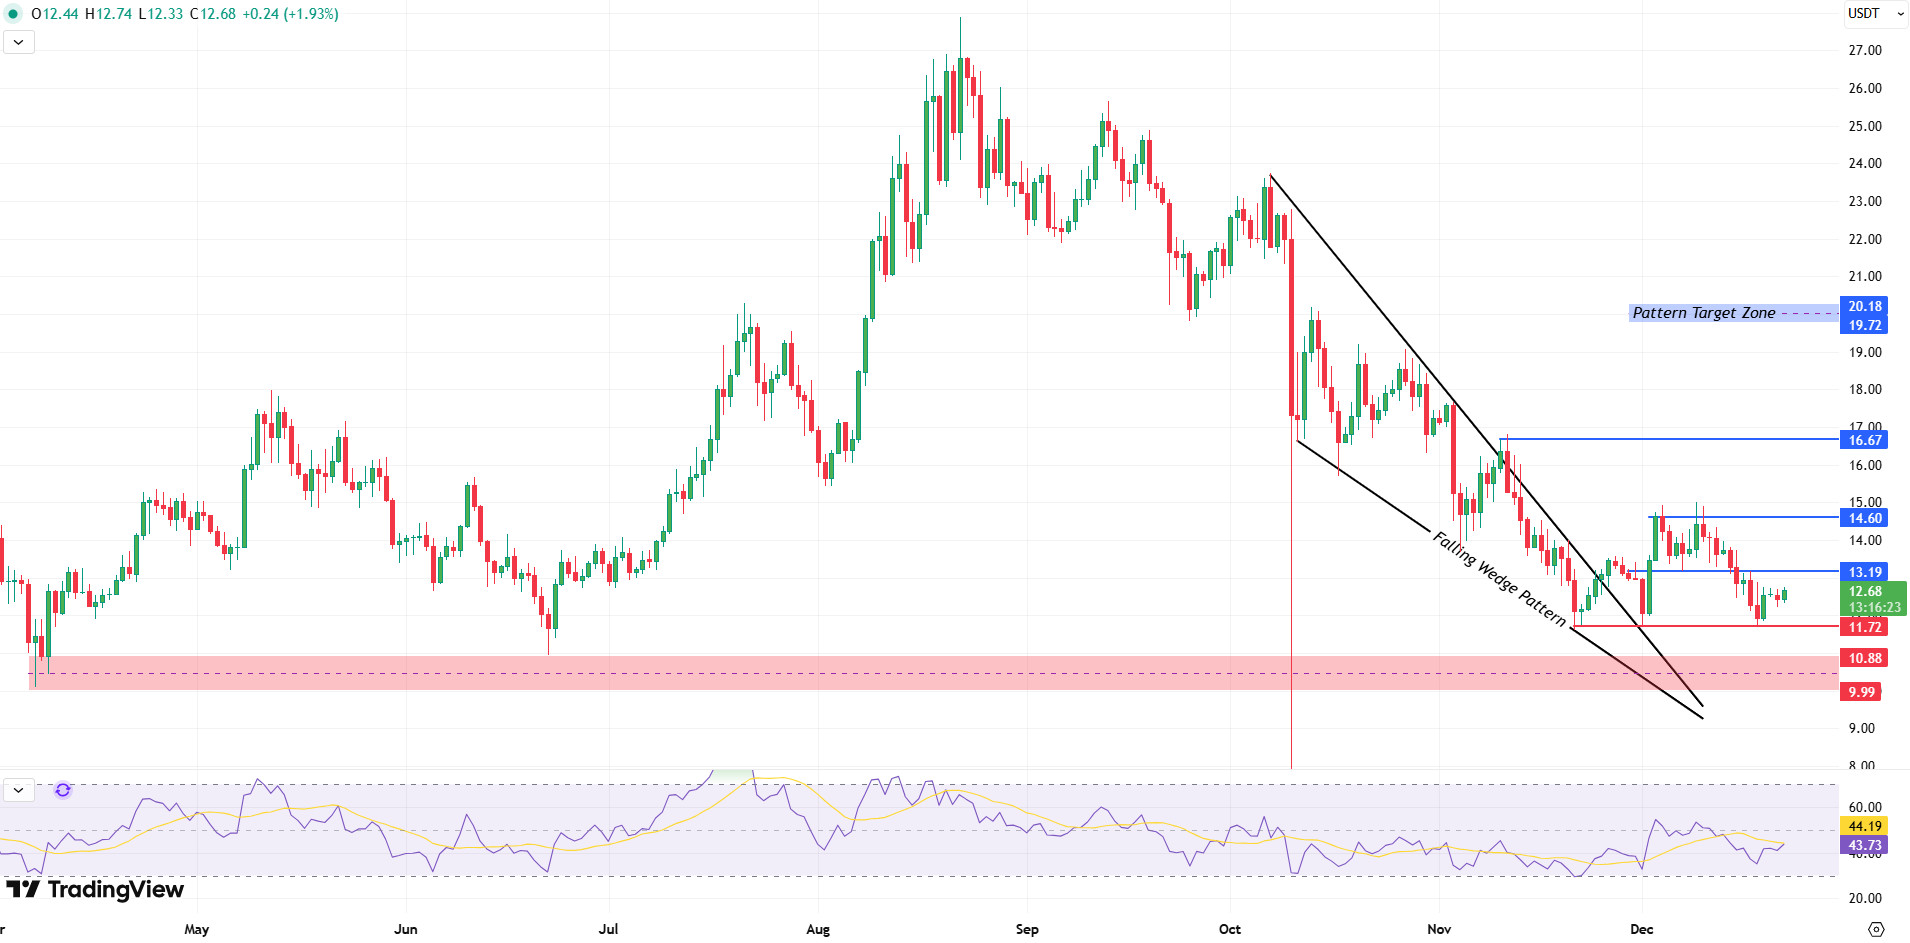
Looking at the current price structure, Link is showing horizontal movements in the $11-14 range. This area is both the region where the pullback after the formation breakout occurred and the main area where buyers are currently defending the price. Sustaining above this band could indicate aggressive buyers, potentially pushing the price back above $14. Otherwise, if we see dips below this zone, we may witness deep declines due to increased seller pressure and the loss of the defense line.
In the upside scenario, after clear closes above $13.19, the first critical threshold will be the $14.60 level. This level is a strong intermediate resistance due to both the previous horizontal structure and the concentration of short-term sellers in this area. If $14.60 is exceeded and a daily close is achieved above it, we can expect the price to move primarily towards the $16.67 level. If this level is also broken, the formation target zone of $19.72 – $20.18 will come back into focus. Reaching this zone could trigger profit-taking and lead to pullbacks in the price.
In the downside risk scenario, the $11.72 level remains the main defense line. Daily closes below this level could accelerate the weakening of the current structure and cause the price to retreat towards the $10.88 – $9.99 support band. In such a scenario, we can say that the buyers have lost considerable strength and that medium-term positive expectations may be replaced by downward expectations in favor of sellers.
The Relative Strength Index (RSI) is hovering in the 43–45 band, i.e., in the neutral to slightly negative zone. The RSI settling above the 50 level could be a factor that increases risk appetite for upward movement. Any rises before this happens may continue to be technically corrective in nature.
Supports: 11.72 – 10.88 – 9.99
Resistances: 13.19 – 14.60 – 16.67
SUI/USDT
This week, there were significant and noteworthy developments in the Sui (SUI) ecosystem. Bitwise filed a spot ETF application for SUI, and this development is creating a short-term reaction in the SUI price. The ETF application could increase institutional investor interest and boost liquidity.
Meanwhile, Sui’s Total Value Locked (TVL) remained strong this week, staying above $1 billion. The TVL staying at high levels indicates continued interest in DeFi protocols on the Sui network and that users are willing to keep their assets within the ecosystem.
When the growing institutional interest is evaluated alongside strong TVL data, the Sui ecosystem presents a positive outlook in terms of both financial infrastructure and users. Developments related to the ETF process and Sui’s growth in DeFi may continue to be decisive for ecosystem dynamics in the coming period.
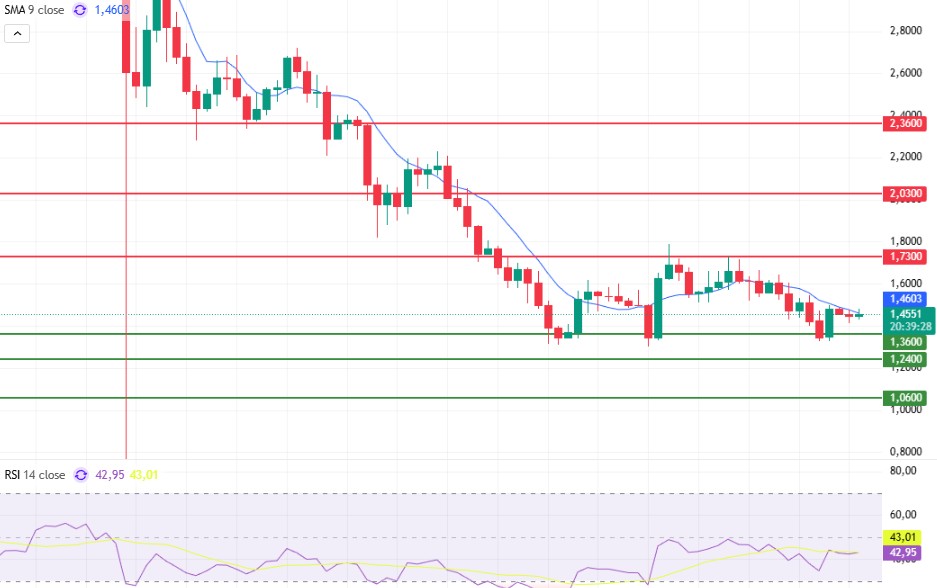
Looking at Sui’s technical outlook following recent developments, we see that the price has been moving sideways around the $1.45 level on a weekly basis, influenced by fundamental developments. The Relative Strength Index (RSI) is currently in the 43.01 – 42.95 range. This range indicates that the market is trading close to the buy zone; the RSI continuing in this range between 40.00 – 45.00 could signal a potential buying point. If the price moves upward, the resistance levels of $1.73, $2.03, and $2.36 can be monitored. However, if the price falls to new lows, it may indicate that selling pressure could deepen. In this case, the support levels of $1.36, $ , $1.24, and $1.06 come to the fore. Based on the trend line, a pullback to $1.06 appears technically possible. According to Simple Moving Averages (SMA) data, Sui’s average price is currently at $1.46. The price remaining close to this level indicates that the current uptrend could technically continue.
Supports: 1.06 – 1.24 – 1.36
Resistances: 1.73 – 2.03 – 2.36
ADA/USDT
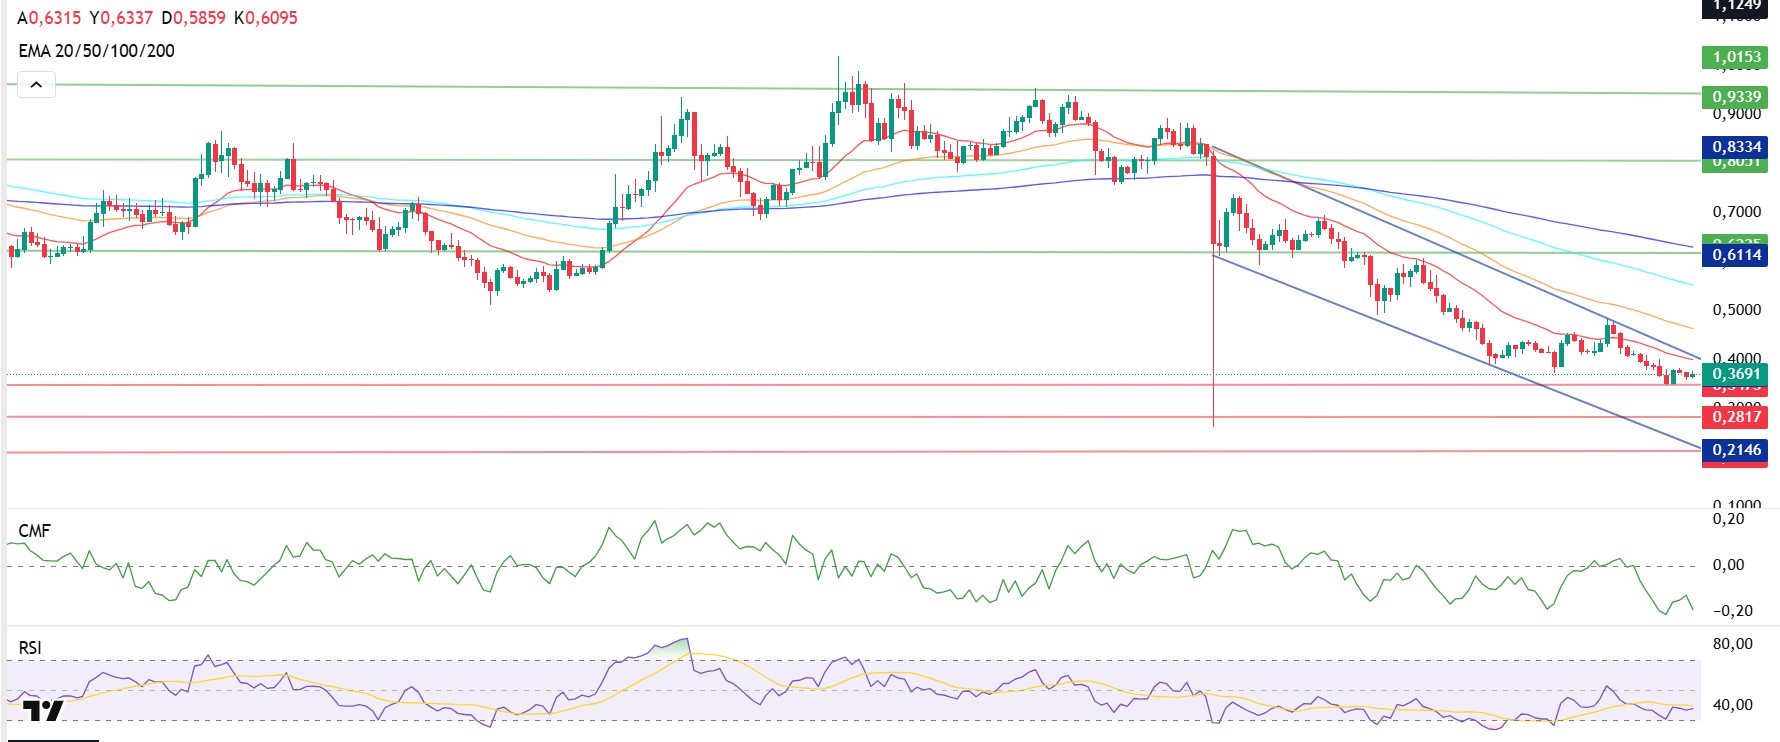
Since last week, the ADA price has lost 8% in value, rising to $0.3684.
Cardano’s privacy-focused token Midnight reached record levels in trading volume, liquidity, and investor interest with its listing on exchanges, despite ADA’s sluggish DeFi activity.
The Midnight project was introduced as a new generation freedom and privacy-focused blockchain project linked to the Cardano ecosystem. The official launch of the Midnight token on December 8 supported positive capital inflows and limited selling pressure on the ADA coin. Investors betting on Charles Hoskinson’s ecosystem-linked zero-knowledge privacy infrastructure via Polymarket indicates that capital is shifting from Cardano DeFi to Midnight. Derivative data shows that leverage usage is moderate, which reduces the risk of sudden liquidation in the event of a price decline.
Technically, the ADA price continues to trade below the 20-day and 50-day Exponential Moving Average (EMA 20 – Red Line) (EMA 50 – Orange Line). If the price rises to the resistance point of the downtrend at $0.6203, the second resistance point at $0.7329 can be tracked. These levels indicate that ADA buyers are willing to buy at higher prices, showing that buyer pressure is increasing over time. A retest of this region could play a critical role in completing the downward channel. If the price breaks above the 20-day Exponential Moving Average (EMA 20 – Red Line), it is expected to close above the 50-day Exponential Moving Average (EMA 50 – Blue Line). The Relative Strength Index (RSI) continues to hover near the sell zone at 39 levels, while the Chaikin Money Flow (CMF-20) remains at -0.10 levels, indicating that the price is operating in the sell- . If the price falls as a result of the macroeconomic data expected to be announced this week and the statements to be made by US President Trump, the important level we will follow is $0.3732, which is the bottom of the downtrend. In the event of closes below this level, the $0.2817 to $0.2146 band can be followed as a support level.
Supports: 0.3732 – 0.2817 – 0.2146
Resistances 1.0153 – 0.9339 – 0.8334
Legal Notice
The investment information, comments, and recommendations contained in this document do not constitute investment advisory services. Investment advisory services are provided by authorized institutions on a personal basis, taking into account the risk and return preferences of individuals. The comments and recommendations contained in this document are of a general nature. These recommendations may not be suitable for your financial situation and risk and return preferences. Therefore, making an investment decision based solely on the information contained in this document may not result in outcomes that align with your expectations.

