
Weekly Technical Analysis Report
BTC/USDT
Last week’s global agenda was shaped by the economy, central bank policies, and geopolitical developments. While the candidates for Fed chairmanship were narrowed down to four names, the Trump administration is monitoring the process and appointed Landry as special envoy to Greenland. The US third quarter GDP exceeded expectations at 4.3%, while durable goods orders fell. The probability of the Fed keeping interest rates unchanged at its January meeting is 82.8%. Among international developments, the conclusion of the US-China chip trade investigation and the US airstrike against ISIS in Nigeria stood out. The Trump-Zelensky meeting in Florida signaled progress in the Ukraine peace process.
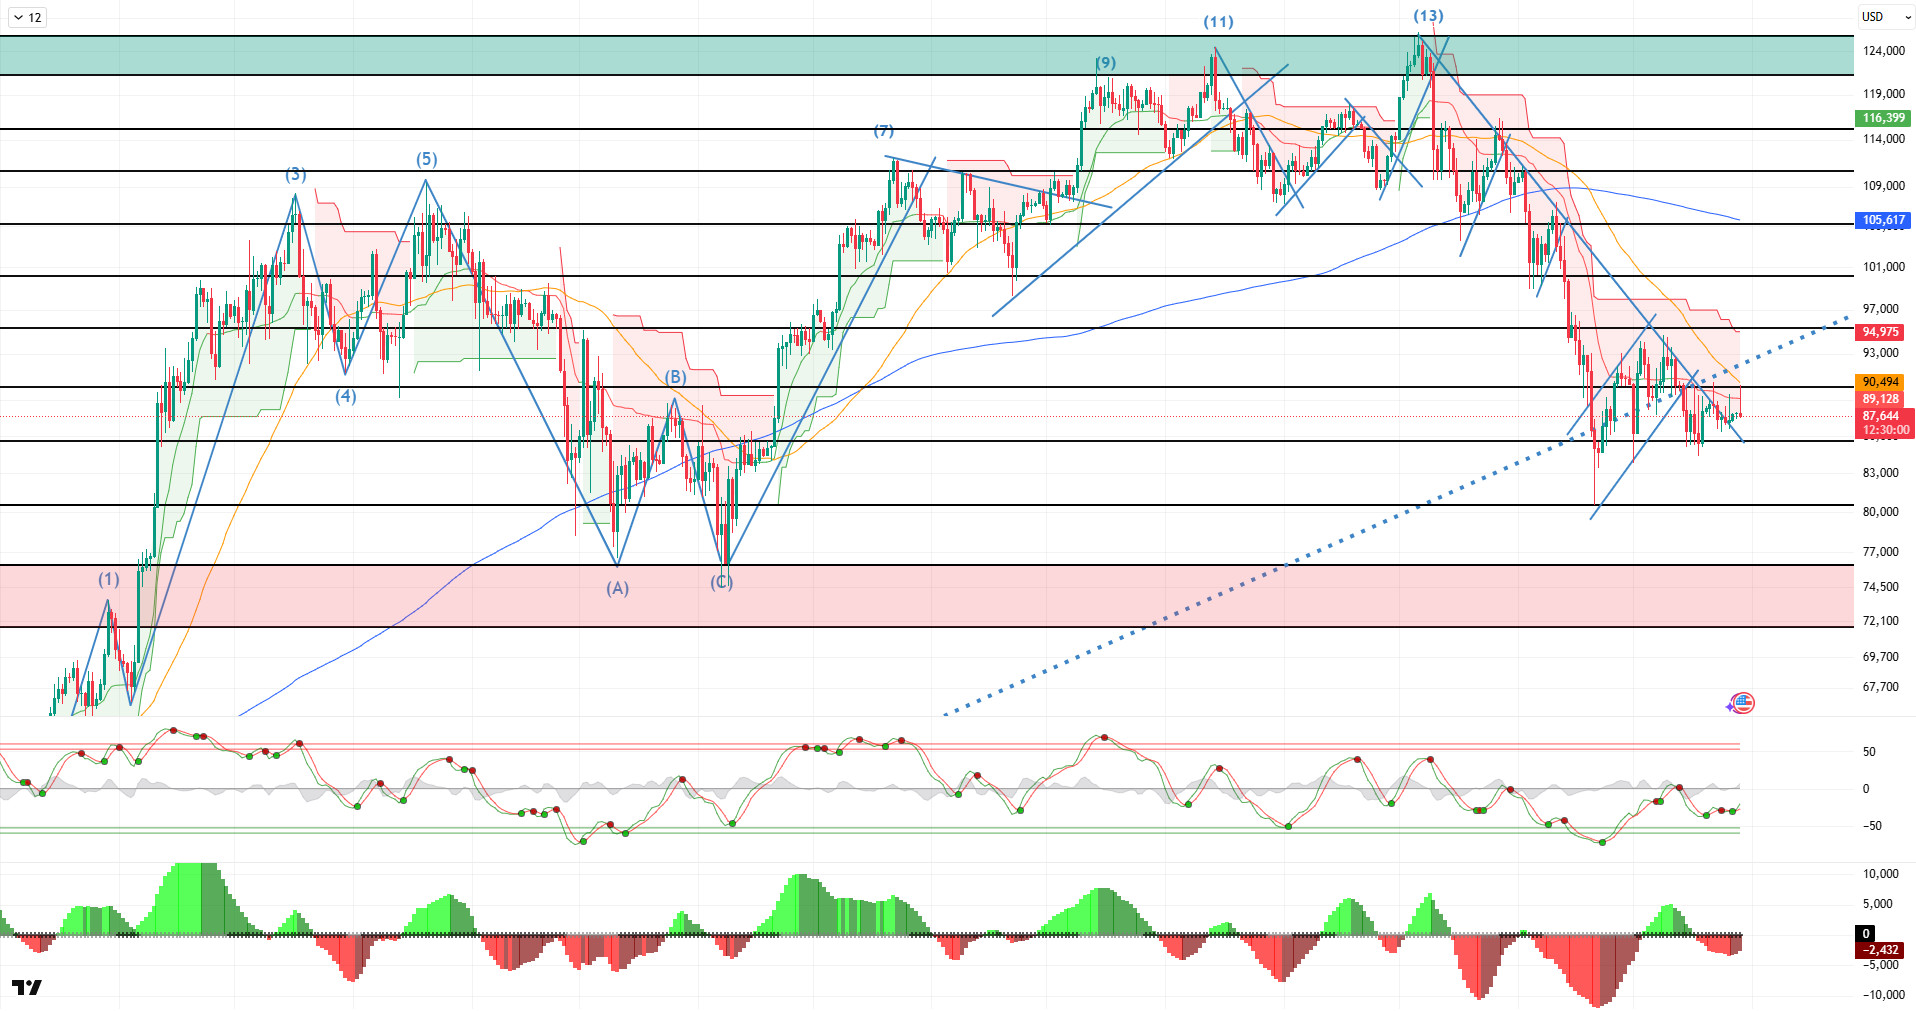
Looking at the daily technical outlook after all these developments, BTC is trying to shift the downtrend it started since the ATH level to a horizontal band range. The price, which recorded a downward breakout with the reverse flag it recently formed, tested the 84,400 levels. Finding support here, the price rebounded and tested the 90,000 reference level several times, but has not yet achieved a clear breakout. Continuing to trade below the major uptrend line it formed on the daily chart, BTC is preparing to close the year in negative territory, but an upward attack in its price could be seen in the first days of the new year.
Looking at technical indicators, the Wave Trend (WT) oscillator is giving a buy signal just below the channel’s middle band on the daily chart, while the Squeeze Momentum (SM) histogram has moved into negative territory. In moving averages, the golden cross structure that began on May 17 was lost when the 50-day SMA crossed above the 200-day SMA. The Supertrend structure continues to maintain its bearish outlook.
Looking at weekly liquidation data, the buying level intensified in the 84,000–86,000 band with the recent rise, while the selling level has formed a fairly dense accumulation in the short term at 90,600 – 91,400 and in the long term at 94,000 – 95,500 and 97,000 – 98,000.
In summary, the global agenda continues to be shaped by the Fed chairmanship, geopolitical developments, and US macroeconomic data. While the catalyst for prices continues to be lacking in the final days of the year, momentum may be seen with the SEC’s crypto legislation efforts in the new year.On the technical side, the price, which has managed to hold the new low of 80,500 for now, has attempted to break through the 90,000 level again but has failed to achieve a clear breakout. Liquidity data shows that while buy orders are sparse, sell orders continue to maintain their intensity. In the coming period, the price may rebound after the recent decline if it breaks above the downtrend line. In this context, a break above the 90,000 level and subsequent closes above it will be followed by a move toward the 93,000 level. On the other hand, with the price coming under selling pressure again due to fundamental developments, 85,000 will be monitored as a critical reference point, and in the event of a breakout, it will be monitored as the last reference point before the price tests the double bottom at 80,000.
Supports: 85,000 – 83,800 – 80,500
Resistances: 90,000 – 95,000 – 98,000
ETH/USDT
The picture emerging on the Ethereum front since last week indicates a reshaping of the balance of power in the market rather than pointing to a single direction. Price movement is still volatile and has not produced a clear trend, but the underlying data contains noteworthy signals, especially from a medium-term perspective. While downward pressure remains in the short term, developments limiting the downward scenario in the overall market structure are coming to the fore.
On the institutional side, Bitmine’s moves were one of the most noteworthy headlines this week. The company’s latest $40 million purchase, which pushed its Ether reserves above the 4 million token threshold, shows that Ethereum continues to be preferred not only as a transaction vehicle but also as a balance sheet asset. According to Lookonchain data, Bitmine’s latest purchase alone stands at 13,412 ETH. The average cost of this accumulation, which reached approximately 100,000 ETH last week, is $2,991, indicating that the current price range is attractive to long-term investors. Such purchases create a foundation that supports Ethereum’s fundamental narrative, independent of short-term price fluctuations.
On-chain data also presents a similarly constructive backdrop. A shift in balance not seen in the Ethereum staking queue for a long time has occurred. For the first time in about six months, the amount of ETH waiting to be staked has significantly exceeded the amount of ETH seeking to exit the network. There is over 745,000 ETH in the entry queue, while approximately 360,000 ETH is in the exit queue. This picture shows that staking demand on the validator side has increased and that long-term expectations have not completely deteriorated. Although it does not have a direct impact on the price in the short term, this trend on the supply side is important for medium-term balance.
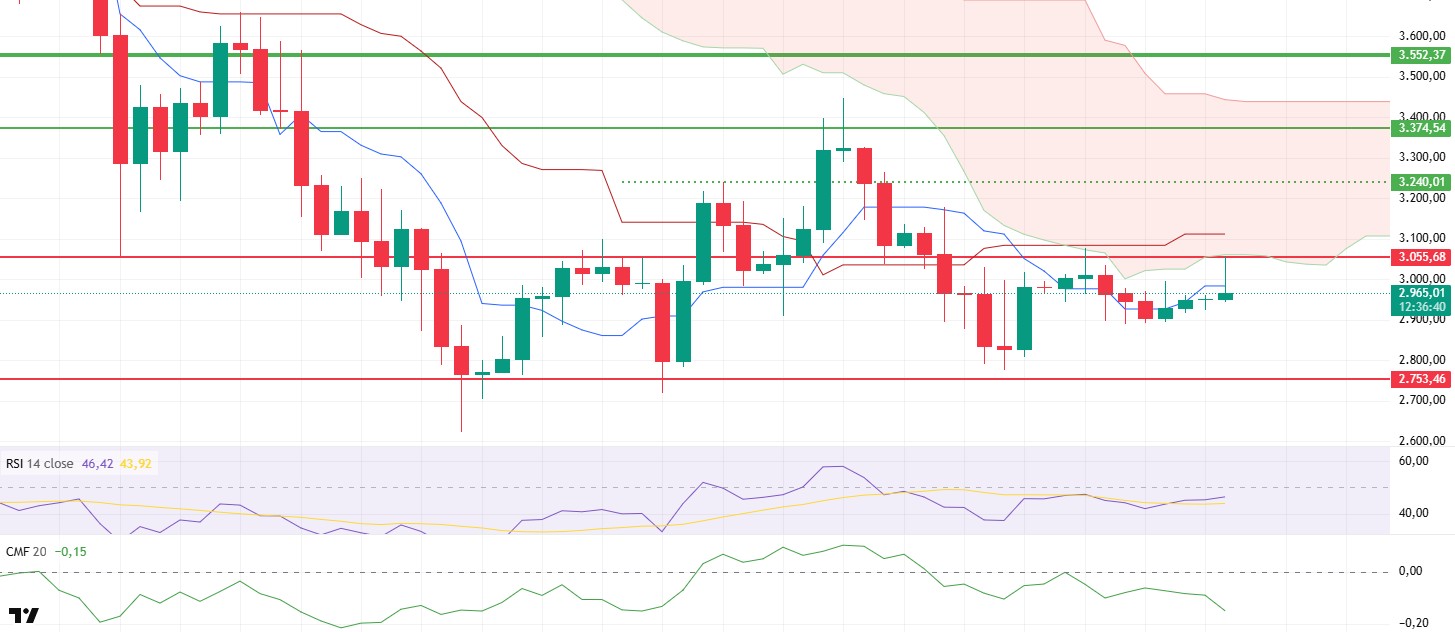
On the price front, the technical structure remains challenging. Ethereum tested the $3,074 level last week, which corresponds to the lower band of the cloud, but pulled back to around $2,890 due to selling pressure in that region. Afterwards, a horizontal equilibrium formed around $2,930. Although there was another attempt to reach the same area after the weekly close at $ , the price failed to hold in this area and experienced a decline. These repeated reactions clearly show that the $3,055–$3,074 range is still functioning as a strong selling zone.
On the volume and trading side, the picture remains weak. Cumulative Volume Delta (CVD) data shows that upward moves have largely come from futures trading, while appetite on the spot side has remained limited. The increase in open interest and the funding rate remaining in positive territory make it difficult to say that expectations have completely dissipated. However, rallies that are not accompanied by spot buying tend to be short-lived, which explains why the price struggles at resistance levels.
On the liquidity side, the Chaikin Money Flow (CMF) indicator continuing its negative trajectory supports this picture. The downward trend in CMF clearly shows that the money entering the market is still insufficient and why upward attempts are losing steam. Without a clear recovery on the liquidity side, it seems difficult for upward movements to become sustainable.
The momentum side, however, is producing more positive signals compared to other indicators. On the daily chart, the Relative Strength Index (RSI) continues its upward movement and presents a healthier outlook compared to the previous week. The start of momentum recovery indicates that selling pressure has weakened and buyers have not completely withdrawn. However, it is clear that this improvement alone is not sufficient and needs to be confirmed by other indicators.
On the Ichimoku indicator side, there is no clear change in the outlook yet. The price is still trading below the kumo cloud, and the Tenkan and Kijun levels have not been gained. This structure indicates that the trend is still technically in negative territory and that the rallies are merely corrective for now. It is difficult to talk about a medium-term trend reversal without seeing a clear improvement on the Ichimoku side.
Looking at the overall picture, despite a limited recovery in technical indicators following a week of low volume, a strong reversal signal has not yet formed. Liquidity is insufficient, spot demand is weak, and critical resistance levels continue to hold. However, institutional accumulation, the shift in balance on the staking side, and the recovery in the RSI indicate that downside risks are not as high as before. If Ethereum manages to stay above the lower band of the cloud, equivalent to $3,055, upward movements could gain more meaningful ground. On the downside, the $2,753 level remains an important key support, and its behavior will continue to be decisive in any potential pullbacks.
Supports: 3,753 – 2,520 – 2,208
Resistances: 3,055 – 3,240 – 3,374
XRP/USDT
Following last week, the picture for XRP remains fragile. While the price weakness persists, flow and fundamental data indicate that this weakness has not yet been balanced. Although there is no obvious panic in the market, the reluctance of buyers is noteworthy.
Sales accelerated with the loss of the main support level at $1.90 at the beginning of last week, and the price retreated to the $1.82 level. After a rebound from this level, the price tested $1.90 again after the weekly close, but this attempt was not sustained. Selling pressure from this level pushed the price back down to around $1.87. The failure to break above $1.90 again indicates that upward attempts are still meeting resistance and that the market does not view this area as safe.
The liquidity picture remains weak. The Chaikin Money Flow (CMF) continues its negative trajectory, maintaining a downward trend. The insufficient amount of money entering the market clearly explains why upward attempts fizzle out quickly. Unless there is a noticeable appetite on the buyer side, it seems difficult for the price to find upward momentum.
On the momentum side, a limited recovery is noticeable. Although the Relative Strength Index (RSI) is moving slightly upward, this recovery has not turned into strong momentum. This RSI outlook suggests that selling pressure has decreased somewhat, but buyers are still not strong enough to take control. Even if momentum has recovered, it is not yet strong enough to push the price upward.
The technical outlook has not changed significantly from the Ichimoku indicator perspective. Although the price is trading close to the Tenkan level, it remains below the Kijun and kumo cloud. This structure indicates that the medium-term trend is still in negative territory and that upward movements remain fragile. It is difficult to talk about a trend reversal without seeing a clear improvement on the Ichimoku side.
In the broader picture, the $1.90 level retains its importance. As long as this area is not breached, downside risks are expected to remain on the table. If the price breaks through this level with volume, a more meaningful upward movement could occur. In the current scenario, liquidity is weak, the technical structure is under pressure, and buyers are cautious. Therefore, volatile pricing and continued directional uncertainty seem more likely for XRP in the short term.
Supports: 1.7867 – 1.6189 – 1.4062
Resistances: 1.9077 – 2.0500 – 2.1608

SOL/USDT
In the Solana ecosystem;
- Circle minted an additional $500 million in USDC on the Solana network.
- The Solana Foundation launched Kora, a fee relay and signature node.
- OpenEden announced that it has brought cUSDO, a regulated and yield-generating stablecoin fully backed by tokenized US Treasury bonds, to the Solana ecosystem.
- Solana Treasury company Upexi applied for a $1 billion capital increase.
- Streamflow announced USD+, a Solana stablecoin backed by U.S. Treasury Bills and offering yields.
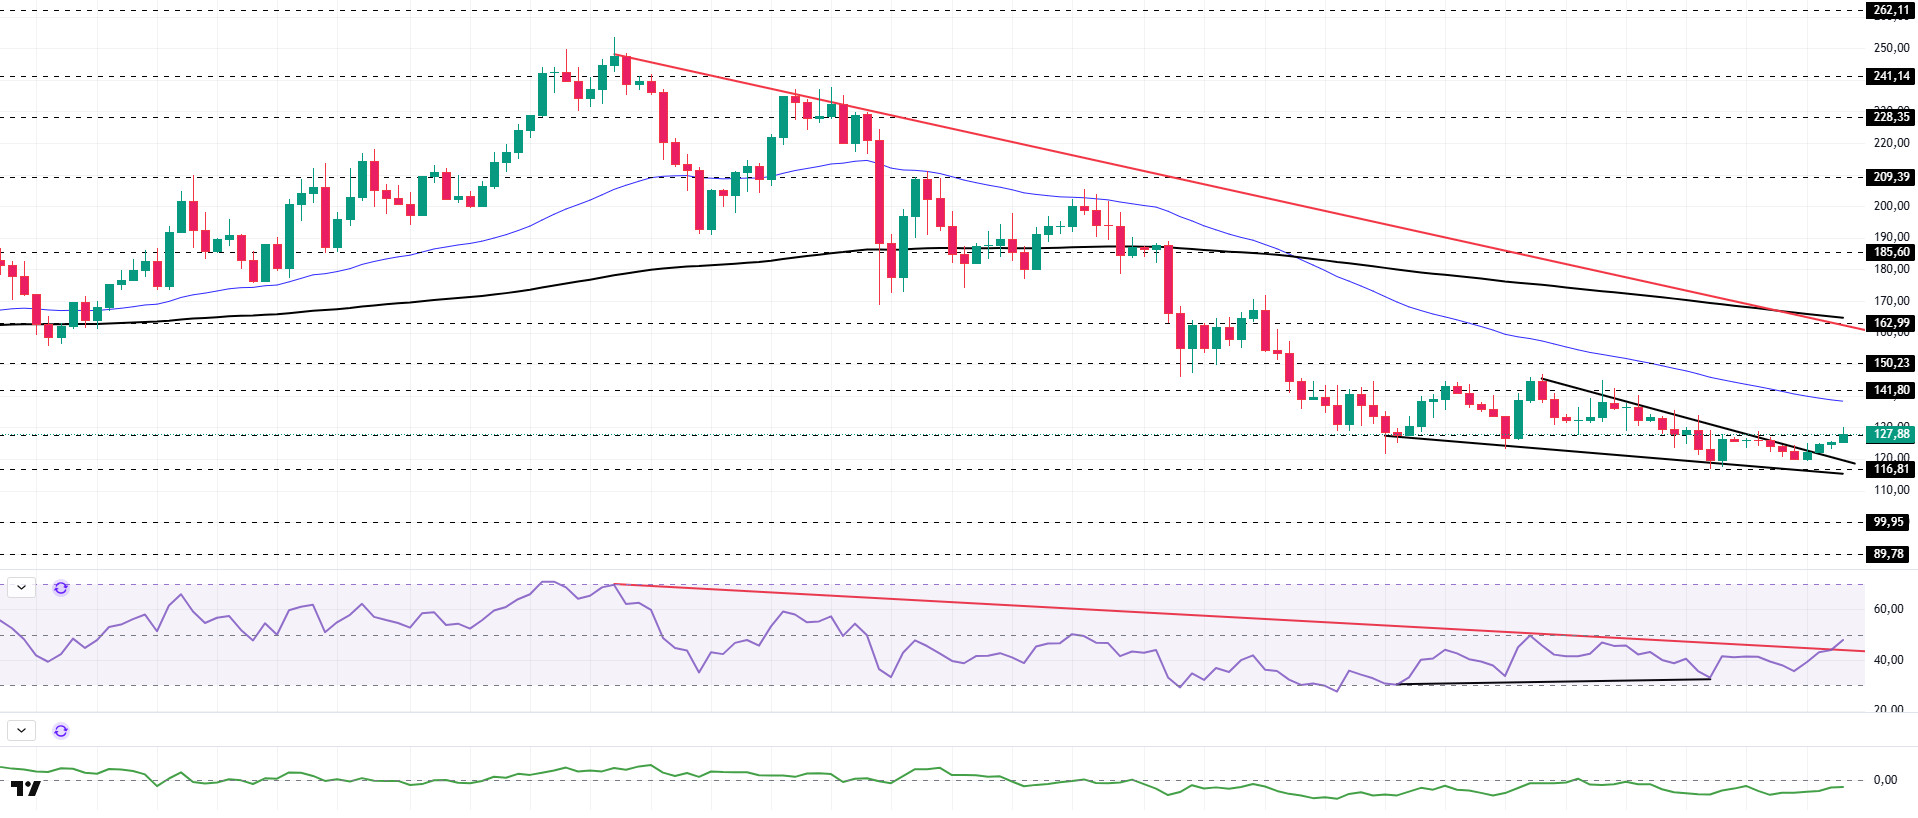
The SOL price experienced a slight increase on the daily chart this week. The asset remained in the lower region of the downtrend that began on September 18. Testing the strong support level of $116.81 and the base level of the descending wedge formation as support, the price accelerated from there and broke above the descending wedge formation. Currently trading in the upper region of the descending wedge formation, the price may test the 50 EMA (Blue Line) moving average as resistance if the uptrend continues. In the event of a pullback, it may test the ceiling level of the descending wedge formation as support.
The asset is trading below the 50 EMA (Exponential Moving Average – Blue Line) and 200 EMA (Black Line) moving averages, indicating that the asset is in a downtrend. Furthermore, the 50 EMA remained below the 200 EMA. This indicates that a “dead cross” formation is continuing from a technical perspective. This also indicates that the potential for a decline in the medium term continues. The RSI (14) rose from the middle of the negative zone towards the neutral level. At the same time, the indicator broke above the downward trend that began on July 22, signaling that buying pressure may be building. The Chaikin Money Flow (CMF-20) remained in negative territory. However, an increase in money inflows could push the CMF-20 indicator to neutral levels. If macroeconomic data remains positive and developments in the ecosystem continue to be favorable, the first major resistance level of $162.99 could be retested. Conversely, in the event of potential negative news flow or deterioration in macro data, the $99.95 level could be monitored as a potential buying opportunity.
Supports: 116.81 – 99.95 – 89.78
Resistances: 127.62 – 141.80 – 150.23
DOGE/USDT
21Shares submitted its sixth amendment proposal regarding the Dogecoin ETF.
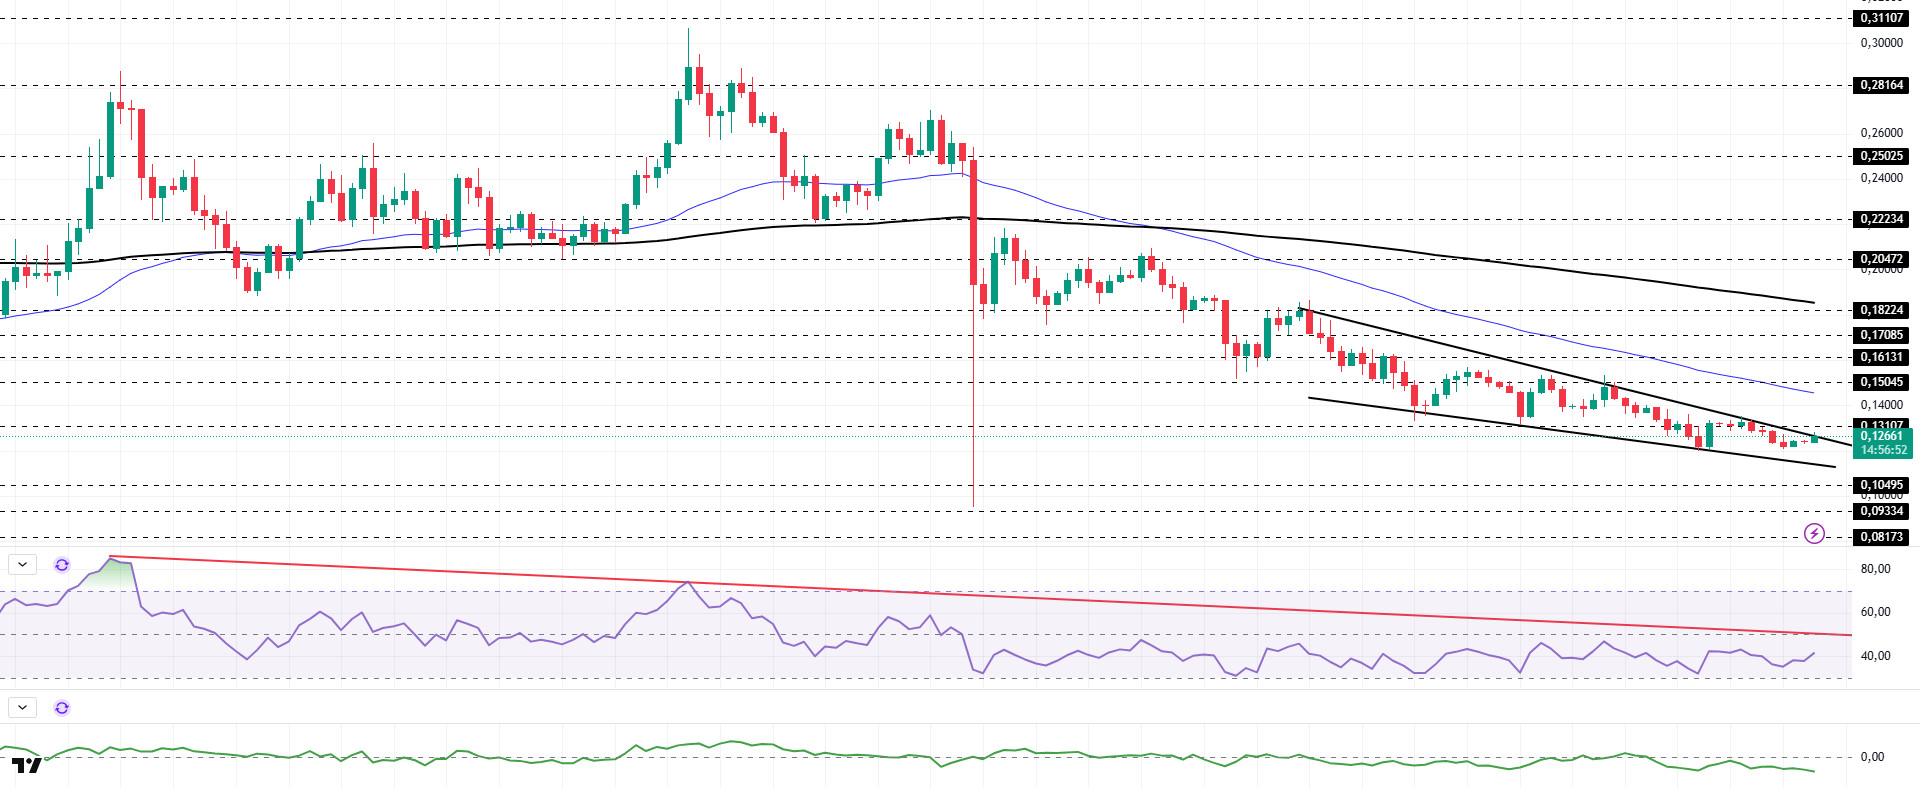
DOGE has been trading sideways in a narrow range on the daily chart since last week. The asset continued to price within the descending wedge formation that began on November 10. Testing the base level of the wedge formation, which is a strong support area, the price failed to break through this level and showed a slight increase. Currently testing the resistance level of the descending wedge formation, the asset may test the 50 EMA (Blue Line) moving average as resistance in candle closes above this level. If it experiences a decline, it may test the $0.10495 level as support.
The asset continued to trade below the 50 EMA (Blue Line) and 200 EMA (Exponential Moving Average – Black Line) moving averages. This indicates that the asset is in a downward trend. On the other hand, the 50 EMA moving average being below the 200 EMA moving average shows us that the “dead cross” formation is continuing. This also indicates that the asset has the potential to lose value at this moment. The Chaikin Money Flow (CMF–20) indicator remained in negative territory. Money inflows continue to decline. This could push the CMF-20 deeper into negative territory. Looking at the Relative Strength Index (RSI-14) indicator, it rose from the oversold zone to the middle of the negative zone. At the same time, it remained below the downward trend line that has been in place since September 13. This indicates that selling pressure may continue. In the event of macroeconomic risks or negative news from the ecosystem, the $0.10495 level can be monitored as a strong support. On the other hand, if the upward movement gains momentum , the $0.17085 level comes to the fore as the first strong resistance level.
Supports: 0.10495 – 0.09334 – 0.08173
Resistances: 0.13107 – 0.15045 – 0.16131
TRX/USDT
According to an announcement by TRON, RealOpen allows home buyers to purchase any property using USDT on the TRON network and make payments directly from their TRON wallets at closing. This eliminates banking processes and delays, making real estate transactions faster and more practical.
Last week, the TRON network generated a total of $44.7 million in revenue, continuing to be the highest-earning ecosystem among all blockchain networks. This performance demonstrates that TRON has established a stable revenue structure thanks to its intensive network usage.
During the week of December 22–28, 2025, a total of 21.7 million TRX were burned on the TRON network. Despite this, the circulating supply increased by 5.8 million. While the increase in supply has the potential to create limited pressure on TRX in the short term, the steady continuation of the burning process stands out as a balancing factor in the medium term. Additionally, the total number of addresses increased by 1.5 million to reach 356.1 million during the same week.
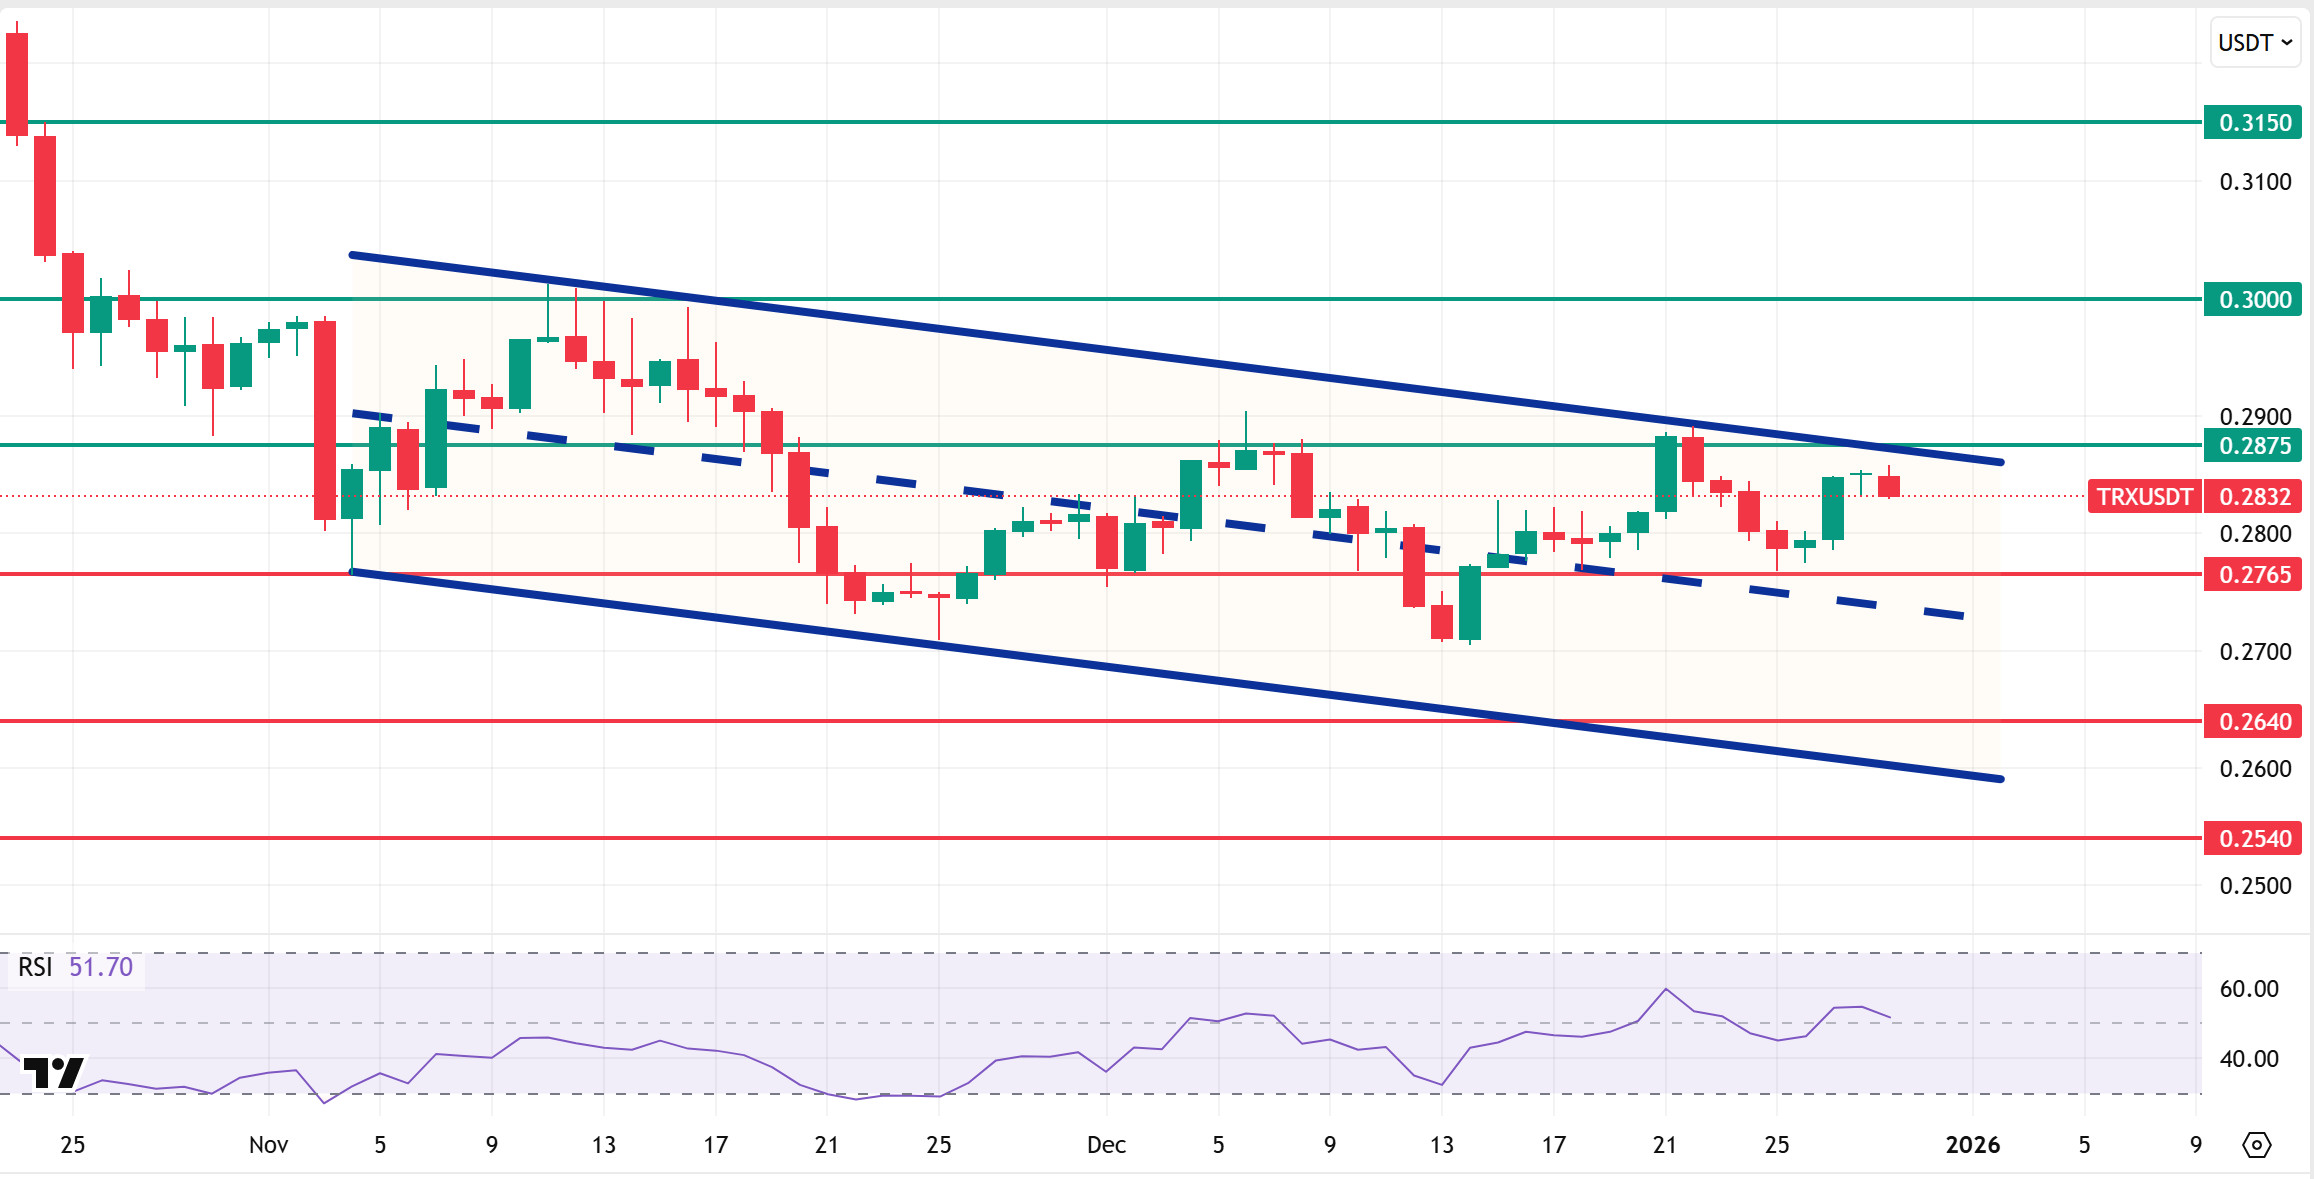
Technically speaking, TRX started the week at 0.2882 and closed the week at 0.2850, losing approximately 1% in value throughout the week. Thus, TRON ended the week with a decline, and its market value was $27 billion. Currently trading at 0.2832, TRX is in the upper band of the bearish channel on the daily chart. The Relative Strength Index (RSI) value is observed to be at 51. Considering its position within the bearish channel and the RSI indicator, the TRX price may pull back slightly. This suggests it may move towards the middle band of the channel. In such a case, it may test the 0.2765 support level. If it closes below the 0.2765 support level, it may test the 0.2640 support level. If it fails to close below the 0.2765 support level and there is a positive break in market sentiment, it may rise with potential buying from this area. In such a case, it may attempt to break the upper band of the bearish channel and test the 0.2875 and 0.3000 resistance levels in sequence. The 0.2540 level is being monitored as a critical support point on the daily chart. Holding above this level could signal a continuation of the positive trend, while downward closes could lead to intensified selling pressure and an acceleration of the downward movement.
Supports: 0.2765 – 0.2640 – 0.2540
Resistances: 0.2875 – 0.3000 – 0.3150
AVAX/USDT
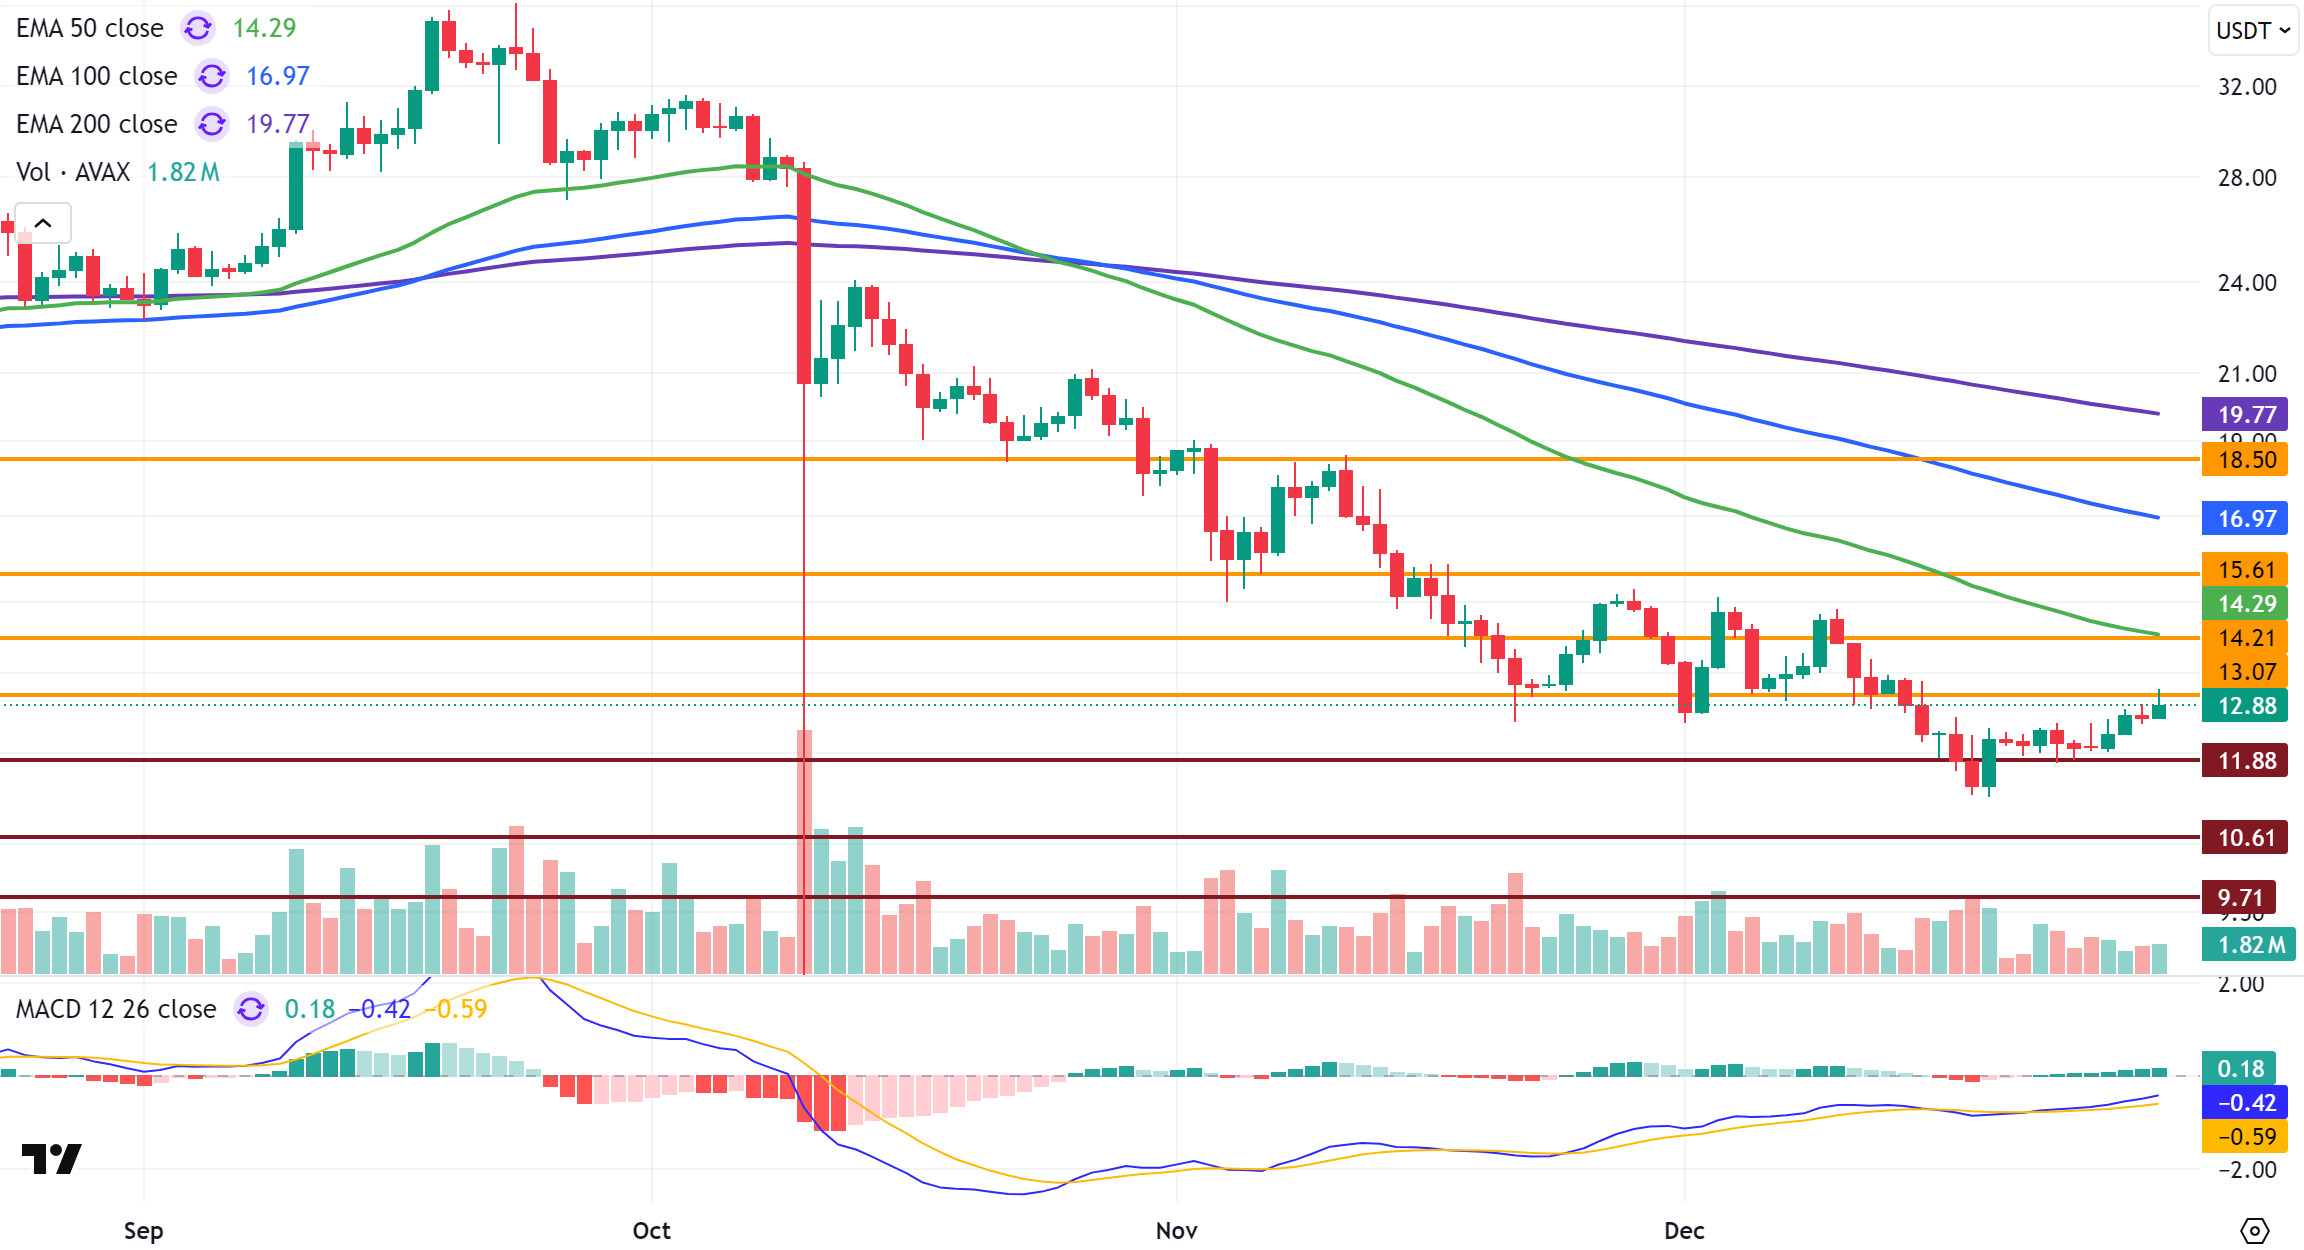
Starting last week at $12.14, AVAX tested the $11.88 support level following a decline at the beginning of the week. Buying activity at this level pushed AVAX higher, resulting in a weekly close of $12.64. The AVAX price increased by approximately 4.1% on a weekly basis. AVAX started the new week with an upward trend, testing the $13.07 resistance level, but experienced a decline due to selling pressure in this region. Despite the upward momentum, a strong momentum has not yet formed. On December 26, 2025, the Avalanche Network surpassed a total of 10 billion transactions across all Layer-1 networks, once again demonstrating the ecosystem’s usage and scaling power. Despite this strong growth in on-chain activity, the ongoing low volume in the cryptocurrency market meant that this positive development did not have a significant short-term impact on the AVAX price.
On the daily chart, the Moving Average Convergence/Divergence (MACD) line remains above the signal line but in negative territory. While the MACD turning upward points to potential for a short-term recovery, its continued presence in negative territory indicates that a strong trend reversal has not yet been confirmed. The MACD outlook is neutral at this stage. For momentum to strengthen, it is critical for the MACD to move into positive territory. Otherwise, selling pressure that could build in resistance zones may limit any upward attempts. Furthermore, AVAX continues to trade below critical Exponential Moving Average (EMA) levels. The critical EMA levels above the AVAX price create a strong resistance band for upward movements. This confirms that the overall trend remains in the negative zone. Unless the EMA levels are breached, current upward movements may encounter selling pressure at resistance zones and remain limited.
From a technical perspective, the $13.07 level is the first critical resistance level for AVAX’s rise. If this level is broken and closes above it, the $14.21 and $15.61 resistance levels may come into play. In the medium term, the $18.50 level stands out as a major resistance, and staying above this level is important for a clear confirmation of the trend reversal. In a downside scenario, the $11.88 level is the first important support position. If closes occur below this level, selling pressure may increase. In this case, AVAX may test the $10.61 and $9.71 support levels in turn as the decline continues. In the overall picture, the MACD being in negative territory and AVAX trading below all critical EMA levels indicates that the pressure has not completely ended on a weekly basis. Therefore, unless we see high-volume closes above resistance levels, recovery attempts are likely to remain limited.
(EMA50: Green Line, EMA100: Blue Line, EMA200: Purple Line)
Supports: 11.88 – 10.61 – 9.71
Resistances: 13.07 – 14.21 – 15.61
SHIB/USDT
This week, the Shiba Inu ecosystem’s agenda was defined by a renewed focus on trust and governance issues on the Shibarium side, at a time when on-chain supply behavior has become more sensitive to price. Within the K9 Finance DAO community, the idea of switching to an alternative chain after the Shibarium bridge exploit is gaining traction. This demonstrates that ecosystem projects are becoming better at managing risks. The project side’s main goal was to clarify the post-hack recovery architecture and advance the governance process, not to rush into a decision to switch.
SHIB burn dynamics changed throughout the week. There were days when the burn rate declined, but around Christmas, there was a short-term increase in the burn rate. This movement was notable in terms of community participation and sentiment rather than creating a significant change in the total supply. By the end of the week, flows showing significant SHIB outflows from exchanges indicated that some liquidity had been withdrawn from the spot market. In the short term, this may have facilitated selling, but it also reminded us that we need to examine both on-chain net flow data and derivatives market positioning together to confirm the trend.
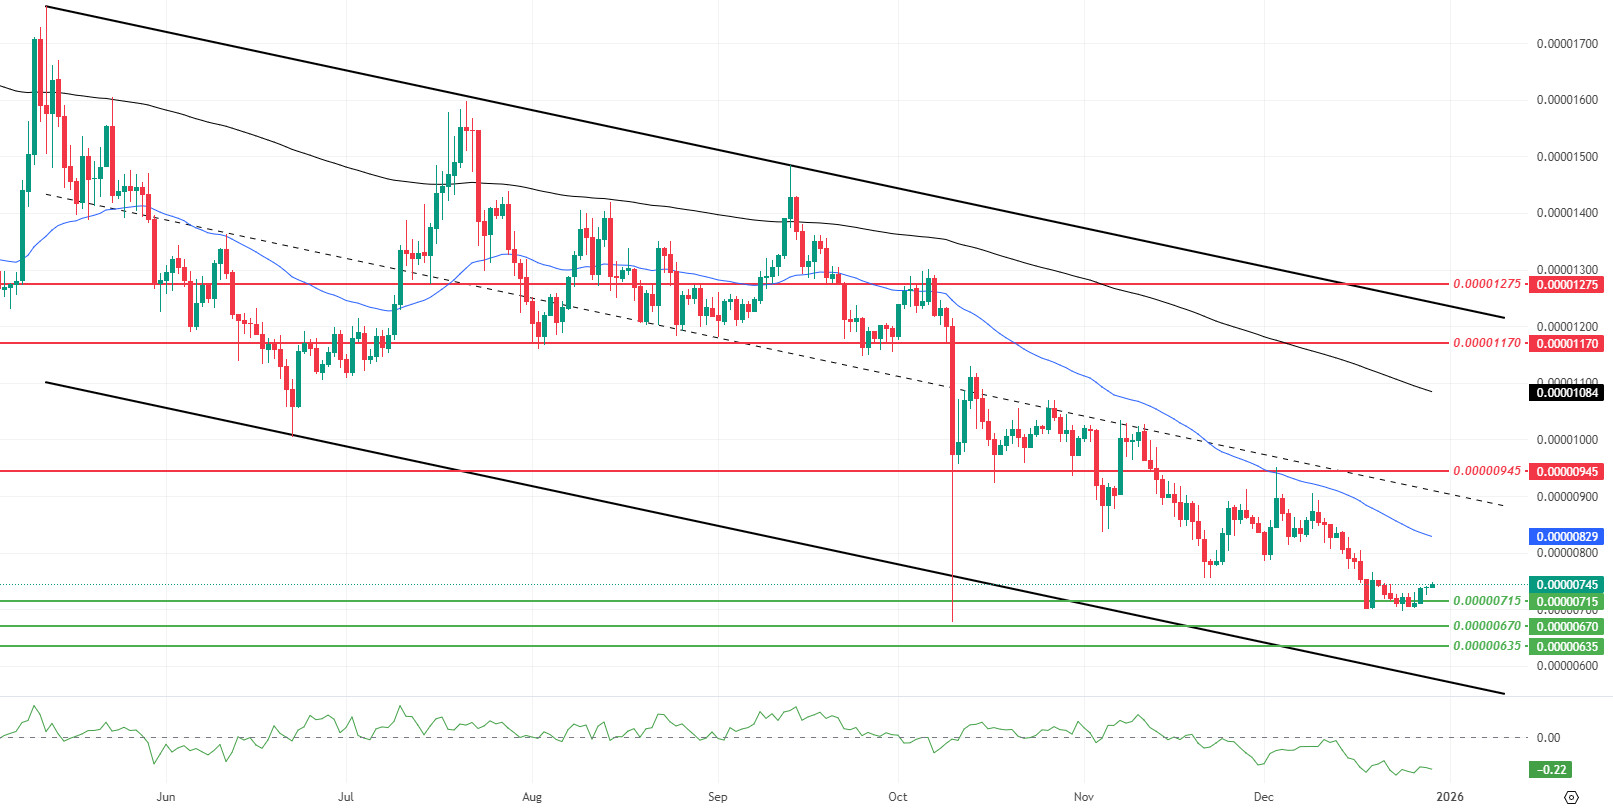
This week’s technical chart reveals a structure where the downward trend’s pressure has not entirely subsided, but the ability to recover in the near term has clearly strengthened. As both volume and momentum rise, the decline in volatility indicates that the upward initiative is supported by more controlled buying rather than panic-driven congestion. However, the Chaikin Money Flow (CMF) indicator remaining negative suggests that net buyer liquidity entering the market is still weak and that capital inflows need to strengthen for the upward movement to continue. The price being below the 50-period Exponential Moving Average (EMA) and the 200-period Exponential Moving Average (EMA) also indicates that the main trend is still downward and that the recent movement is more of a reaction wave within the downtrend than a reversal of the trend. The fact that the $0.00000715 support zone has not been broken and that the price has reacted from this level and moved rapidly towards $0.00000740 indicates that sellers’ energy is waning and that the market is seeking equilibrium in the bottom zone. However, even if the market is not very volatile, it is important to remember that this reaction could lead to a rapid price change after the squeeze ends. If the price closes below $0.00000715 for several days in a row, the support levels of $0.00000670 and $0.00000635 will regain importance. (EMA200: Black line, EMA50: Blue line)
Supports: 0.00000715 – 0.00000670 – 0.00000635
Resistances: 0.00000945 – 0.00001170 – 0.00001275
BNB/USDT
The latest BNB Chain data shows that user and transaction activity in the BNB ecosystem has strengthened compared to the previous week, while capital has taken a more cautious stance, as seen in the . During this period, BSC’s average daily active user count rose by 5.2% to 2.54 million, while opBNB recorded a limited but steady 2.4% increase in DAU. Similarly, transaction counts also rose on both networks, with a 6% increase on BSC and an 8% increase on opBNB. In contrast, total transaction volume declined by 2.8% on a weekly basis to $31.6 billion, indicating that the average transaction size decreased despite the increase in transaction counts. On the other hand, the total value locked (TVL) declined by 5.6% to $10.1 billion, indicating a trend of profit realization and risk reduction in DeFi.
From a technical perspective, the correction that began after the all-time high (ATH) retreated to the $790 support zone identified in previous analyses. After seeking support at these levels for a while, BNB ended its downward momentum with the candlestick formations that formed and turned its direction upward again. With this recovery, the price gained positive momentum towards the descending trend line; with the support of new candles, it broke the descending trend upwards and rose to the $930 level. However, increased selling pressure was observed in this region, depending on market conditions. With the effect of increased selling pressure, the asset appears to have continued its movement within a descending channel for some time.
However, BNB, which reversed its direction upward with support from the middle band of the descending channel, gained positive momentum by breaking above the upper band of the channel. Accordingly, the asset rose above the previously determined target level of $860 to reach the $870 level. Although partial pressure is seen at these levels, the overall technical outlook is considered to maintain its positive structure.
In this context, BNB/USDT presents a positive picture in terms of the overall outlook. If upward price movements gain strength, the current positive outlook is expected to be supported.
Currently trading in the $850–$880 range, technical indicators for BNB show that low trading volume is limiting the upward momentum. Additionally, the RSI indicator reaching the 70 level with the recent increases and reacting from this level indicates that a limited correction movement may continue in the short term.
Within the technical outlook, if selling pressure increases, the price is expected to retest the $850 support level. If this level is broken downward, a pullback towards the $835 and $820 support zones could come into play.
On the other hand, if buying appetite is maintained and market momentum strengthens, BNB is expected to retest the $880 resistance level in the first stage. Breaking above this level could push the price above the downtrend line. If the trend breakout is confirmed and the price manages to stay above this level, a rise towards the $905 and $930 levels is technically possible.
Supports: 850 – 835 – 820
Resistances: 880 – 905 – 930

LTC/USDT
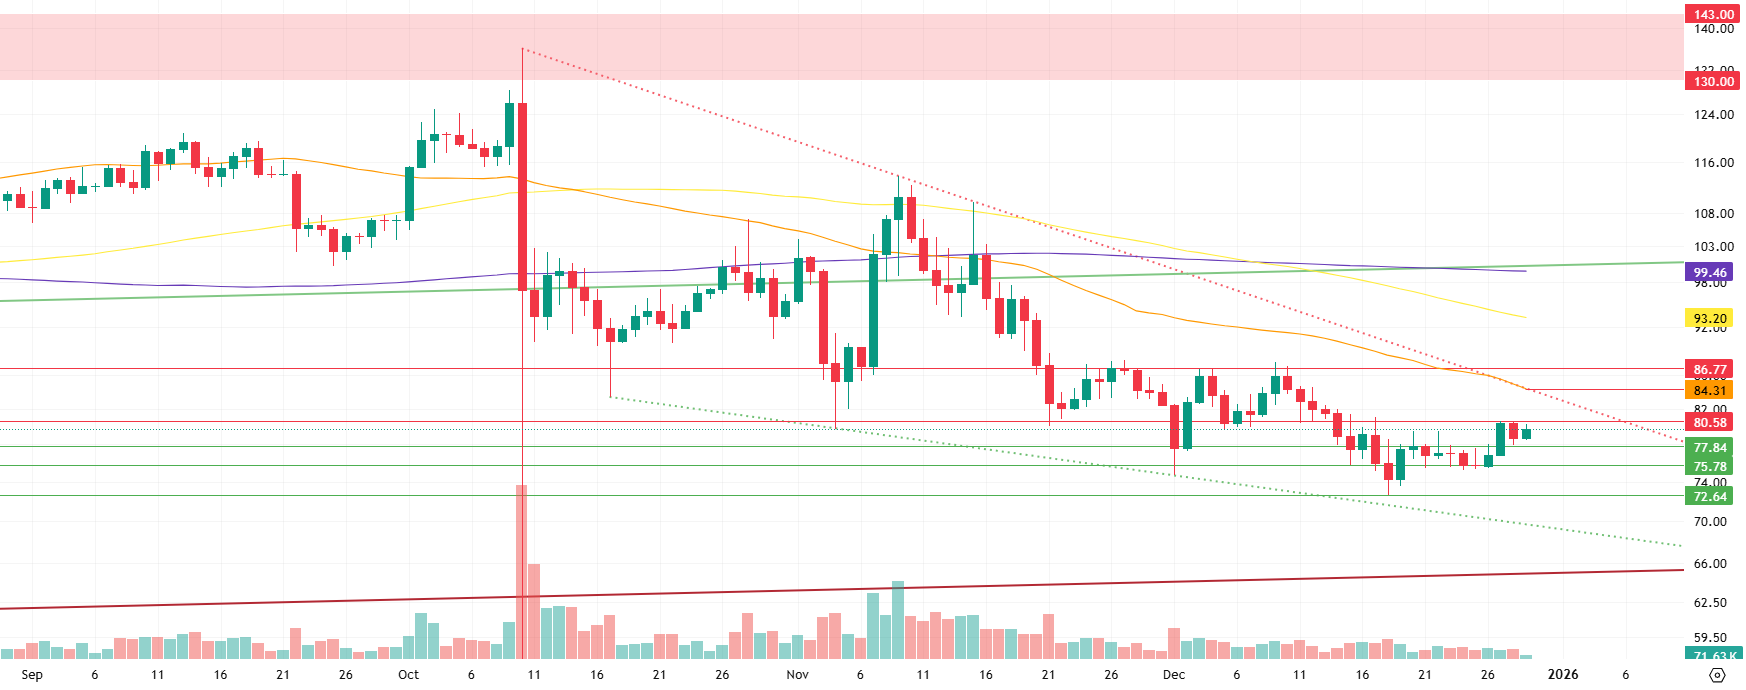
Litecoin (LTC) ended last week with a 2.53% increase against USDT, starting the new week at $78.73. LTC also gained 3.35% against Bitcoin during the same period, marking a positive week in terms of price performance and ending the six-week-long downward trend in LTC/BTC. Currently, Litecoin maintains its 19th position in the market with a total market capitalization of approximately $6.1 billion. On the futures front, the total open interest increased by 7% compared to the beginning of last week. In addition, the long/short ratio of 1.0313 at the beginning of the new week indicates that derivatives market participants are more neutral about the upside potential.
Looking at the daily candlestick chart, the Litecoin price continues to trade below the 100-period (yellow), 50-period (orange), and 200-period (purple) moving averages. This outlook can be seen as an indicator confirming that selling pressure has not yet been overcome in both the short and long term.
In line with the expectations of derivatives market participants, the 80.58 horizontal resistance level stands out as the level with the potential for the first pause or local peak formation during this week’s upward movement. If this region is breached, the 84.31 level rises to become the strongest resistance area of the week, as it coincides with the falling trend line and is the point where the 50-period moving average passes. If the upward movement continues, the 86.77 level, where local peaks have frequently formed in the past, can be monitored as the final and critical resistance for the week.
On the other hand, contrary to general expectations, support levels where buying interest could be expected in the event of pullbacks are 77.84, 75.78, and 72.64, respectively. Among these levels, 77.84 is the key threshold of the current balanced price structure and acts as a moderately reliable support. Maintaining this region is critically important for the upward scenario to continue healthily. The 75.78 level, located in a lower zone, offers a technically stronger and more active support area, while the 72.64 level is essentially the “last line of defense” in the technical outlook. A downward breach of this level could drag the price into a new wave of decline towards the descending trend support and fundamentally alter the current technical picture.
Supports: 77.84 – 75.78 – 72.64
Resistances: 80.58 – 84.31 – 86.77
LINK/USDT
Last week, Chainlink ETFs saw cumulative inflows of $2.32 million, reaching a total of $58.61 million, compared to outflows of $9.49 million and a total trading volume of $73.10 million, indicating that institutional interest remains strong in the short term, albeit volatile. In particular, the positive net inflows prove that demand for the ecosystem remains strong even during price pullbacks.
Looking at the reserve side, Chainlink Reserve data shows that the accumulation strategy is continuing: The total USD value of the reserve is $16.4 million, the amount of LINK held in reserve is 1.32 million, and the average cost of this accumulation is $17.41. Chainlink continues to directly convert its revenue sources into token reserves, creating a tightening effect on the circulating supply in the medium to long term.
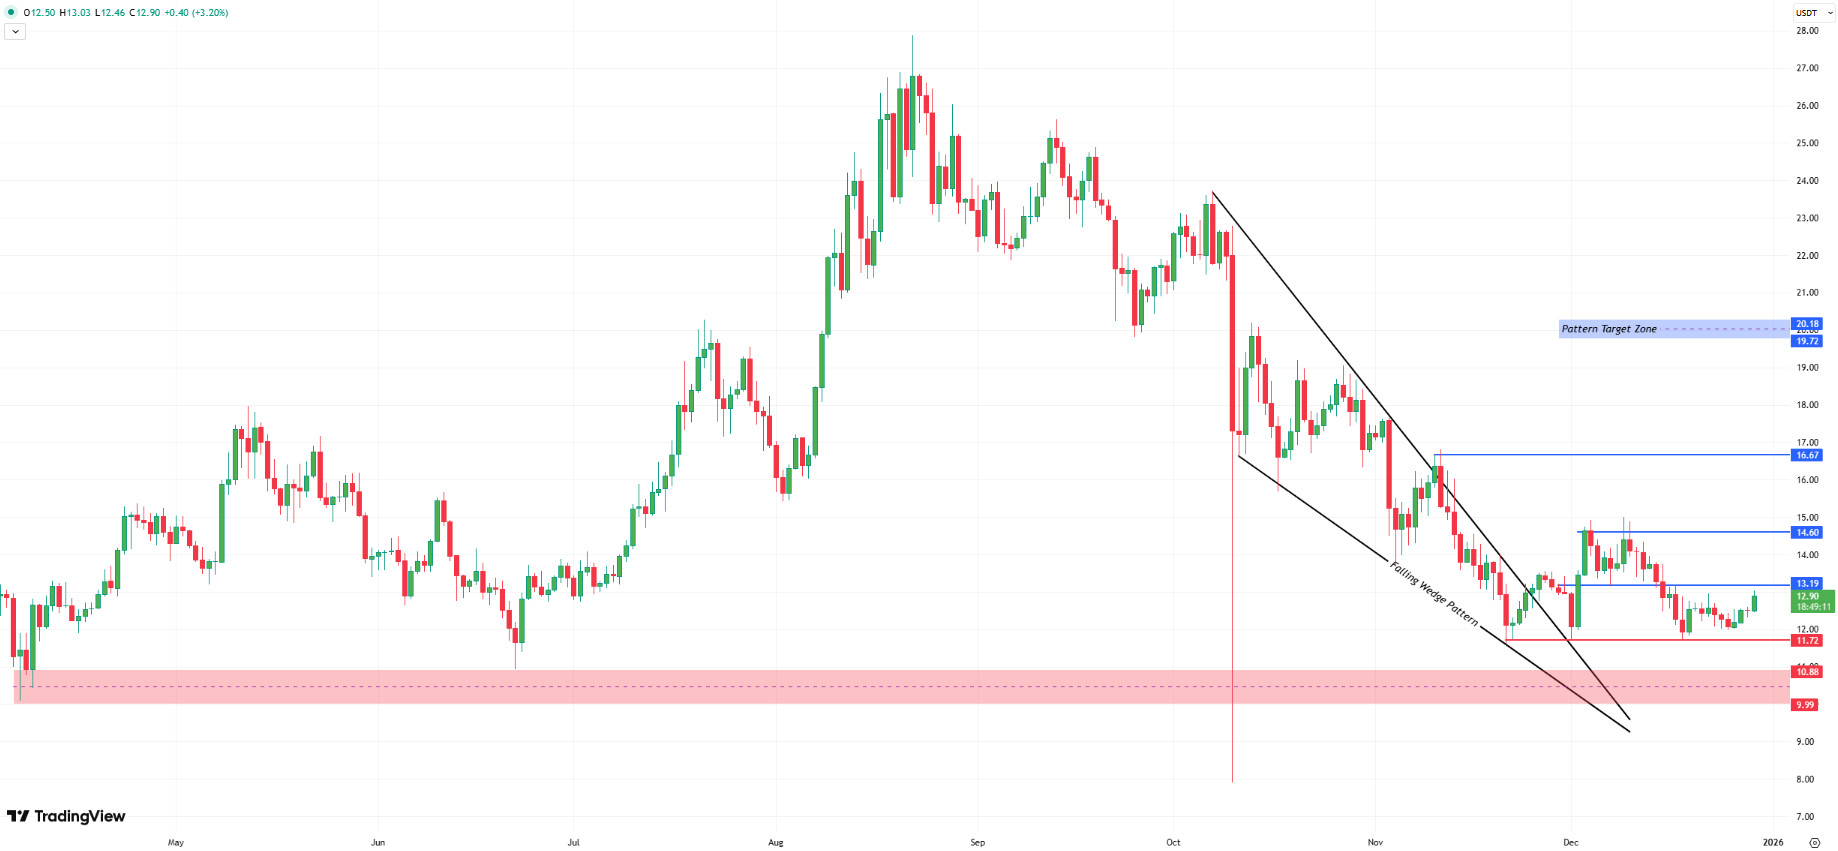
Looking at the current picture, the price has been moving sideways for about two weeks in the $11.72–$13.19 range. The $11.72 level is the main support zone where the incoming selling pressure has been absorbed at this stage. As long as it remains above this level, it would be healthier to evaluate the current sideways movement as an accumulation effort. The $13.19 level stands out as a strong resistance point that buyers have not yet been able to overcome. A breakout above this resistance with high volume would be a critical threshold for determining the short-term direction and would increase positive expectations.
For the upward scenario to gain strength, we need to see clear and sustainable closes above $13.19. When this condition is met, the first significant resistance will be the $14.60 level, where the price has previously faced strong selling pressure twice. This area, which has seen heavy supply in the past, could naturally slow down the price. However, daily closes above $14.60 could shift market sentiment to a more constructive ground, paving the way for the $16.67 level to come back into focus.
In a downside risk scenario, losing the $11.72 level could intensify selling, disrupt the current equilibrium, and accelerate a pullback towards the $10.88–9.99 support band. Such a move could reshape short- and medium-term expectations in favor of sellers and lead to pessimism regarding the price.
The Relative Strength Index (RSI) is slightly negative at 49. The RSI settling above the 50 level could be a factor that increases risk appetite for upward movement. Without this happening, any future rises may continue to be technically corrective in nature.
Supports: 11.72 – 10.88 – 9.99
Resistances: 13.19 – 14.60 – 16.67
SUI/USDT
This week, there were significant and noteworthy developments in the Sui (SUI) ecosystem. Following leveraged SUI ETFs in Europe, 21Shares began offering institutional custody services.
Additionally, Sui released an update called the “Trust Layer,” which enables AI agents to make secure and verifiable payments.
Sui is evolving beyond being merely a technical success story to become the new “hub” for institutional finance on the blockchain. When the record-breaking TVL (Total Value Locked) data is considered alongside the growing institutional interest, it is evident that the network has proven its quality in terms of both reliability and operational capacity.
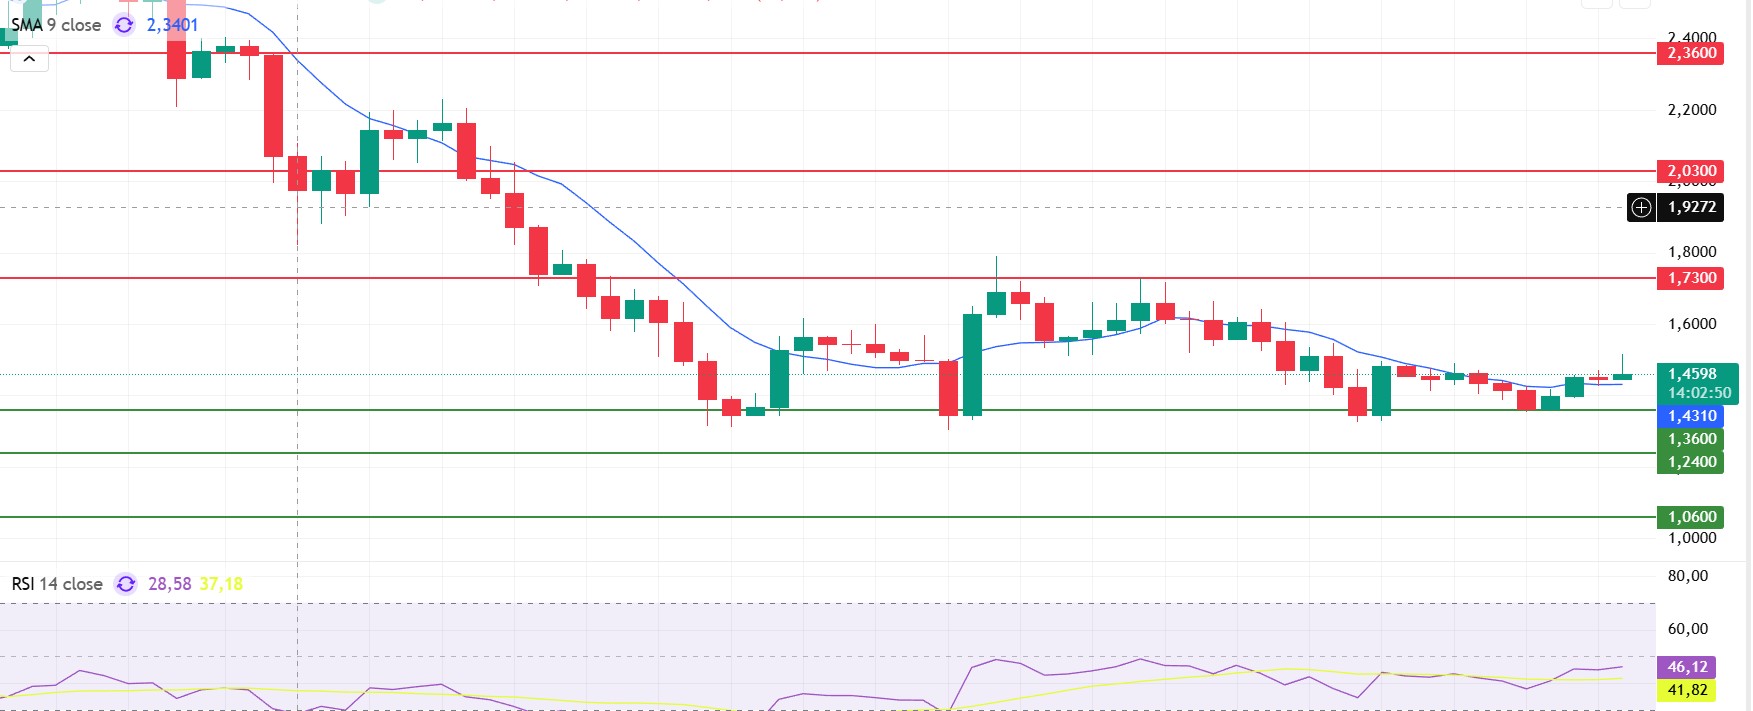
Following recent developments, when we look at Sui’s technical outlook, we see that the price has been moving sideways at around $1.45 on a weekly basis, influenced by fundamental developments. The Relative Strength Index (RSI) is currently in the range of 46.12 – 41.82. This range indicates that the market is trading close to the buy- e zone; the RSI continuing close to the 40.00 – 45.00 range in these areas may signal a potential buying point. If the price moves upward, the resistance levels of $1.73, $2.03, and $2.36 can be monitored. However, if the price falls to new lows, it may indicate that selling pressure could deepen. In this case, the support levels of $1.36, $1.24, and $1.06 come to the fore. Based on the trend line, a pullback to $1.06 appears technically possible. According to Simple Moving Averages (SMA) data, Sui’s average price is currently at $2.34. If the price remains below this level, it signals that the current uptrend will not continue technically.
Supports: 1.06 – 1.24 – 1.36
Resistances: 1.73 – 2.03 – 2.36
ADA/USDT
Since last week, the ADA price has fallen by 1.63% to $0.3746. With three days left until the end of the year, Cardano continues to trade below market expectations. Cardano is preparing for its fourth monthly close below $0.5000 since August, with a 10.97% decline in December. Although Cardano is poised to close 2025 with a 57.3% decline on an annual basis, it achieved institutional adoption this year and laid the groundwork for the next phase of activation in 2026. More than 50 spot altcoin ETFs and more than 50 crypto ETFs (excluding spot single-coin products) are expected to be launched in the US. The SEC continues to review ETF applications for ADA, which is expected to have a Cardano ETF in 2026.
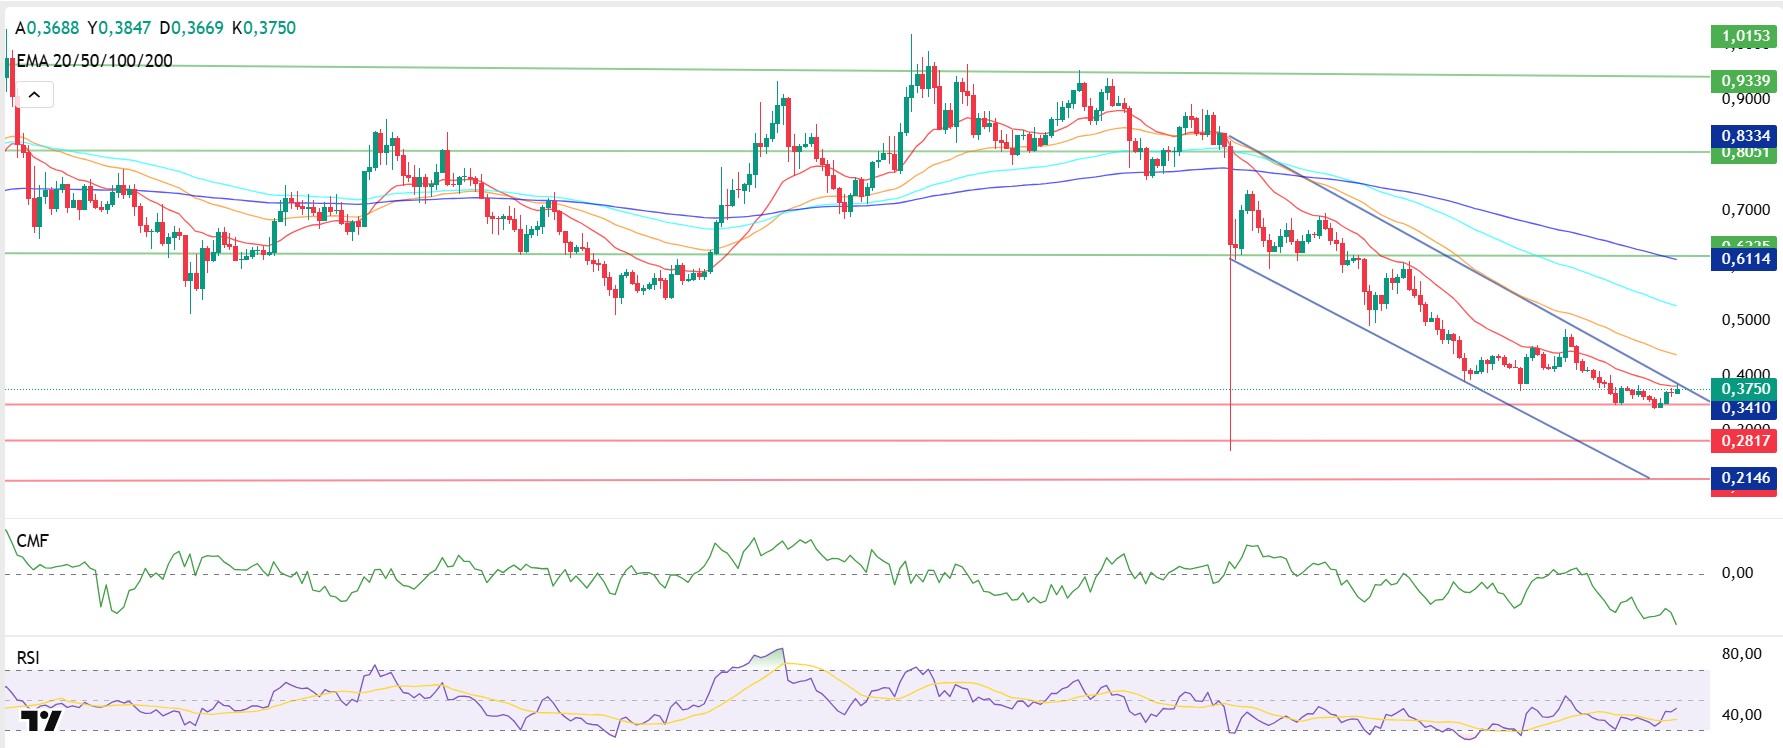
Although it continues to trade below the 50-day and 200-day Exponential Moving Average (EMA 50 – Orange Line) (EMA 200 – Blue Line), it intersects with the 20-day EMA (Red Line). If the price remains above the 20-day moving average, the $0.4270 level can be monitored as the first resistance level. With the reaction it receives from here, the continuation of the upward movement to the $0.6203 level, which is the peak of the downtrend, can be expected. These levels appear as an area indicating that ADA buyers are willing to buy at higher prices and that buyer pressure is increasing over time. The retest of this area may play a critical role in completing the downtrend channel. If the price breaks above the 20-day Exponential Moving Average ) level, it is expected to close above the 50-day Exponential Moving Average (EMA 50 – Blue Line). The Relative Strength Index (RSI) continues to hover near neutral territory at 44 levels, while the Chaikin Money Flow (CMF-20) remains at -0.25 levels, indicating that the price is operating in the sell zone. If the price falls as a result of the macroeconomic data expected to be announced this week and the statements to be made by US President Trump, the important levels we will follow are the bottom of the downtrend at $0.3732. In the event of closes below this level, the support level can be followed at the $0.2817 to $0.2146 band.
Supports: 0.3732 – 0.2817 – 0.2146
Resistances: 0.8334 – 0.6203 – 0.4270
Legal Notice
The investment information, comments, and recommendations contained in this document do not constitute investment advisory services. Investment advisory services are provided by authorized institutions on a personal basis, taking into account the risk and return preferences of individuals. The comments and recommendations contained in this document are of a general nature. These recommendations may not be suitable for your financial situation and risk and return preferences. Therefore, making an investment decision based solely on the information contained in this document may not result in outcomes that align with your expectations.

