BTC/USDT
We left behind another week of intense developments regarding Bitcoin. At the beginning of the week, Time magazine selected Donald Trump as the 2024 “Person of the Year”. Following this development, Trump made a remarkable statement stating that “Great Things” will happen in the cryptocurrency space. Later in the week, ahead of the FED’s interest rate meeting, inflation data released in the US came in line with expectations. This caused the expectation of a 25 basis point rate cut to rise to 98%. Institutional investors’ interest in Bitcoin continued. While MicroStrategy and Marathon Digital Holdings increased their Bitcoin purchases, Microsoft’s proposal to invest in Bitcoin was rejected in a vote. On the other hand, Iran and Ukraine continued their preparations for cryptocurrency regulations, while the Argentine government allowed spot Bitcoin ETF investments.
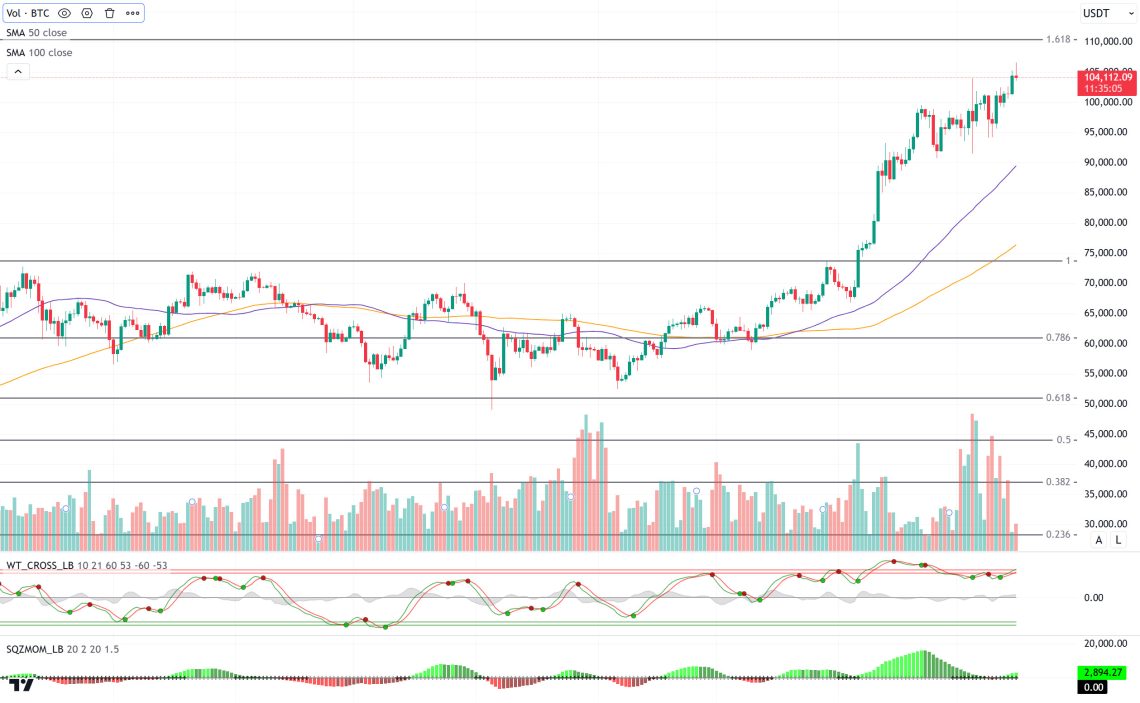
With all these developments, BTC closed last week with a 2.56% increase compared to the previous week, testing the new ATH level of 106,500, although the BTC price occasionally dipped down. In BTC, which is currently trading at 104,000, technical oscillators on the daily chart draw attention to the trading signals it has been giving for a long time in the overbought zone, while the momentum indicator is gaining strength again. In the continuation of the rise in the new week, the Fibonacci 1.618 (110,000) level appears as a resistance point, while in a possible selling pressure, the 90,000 level, where the 50 SMA line crosses, can be seen as the new bottom zone. Later in the week, eyes will be on the FED interest rate meeting decision and Powell’s statements.
Supports 103,000 – 100,000 – 95,000
Resistances 106,500 – 110,000 – 115,000
ETH/USDT
The Ethereum ecosystem continues to exhibit a strong outlook in terms of both technical and fundamental data. On the DeFi side, stablecoin transaction volumes and Total Value Locked (TVL) growth have been more stable compared to last week. However, the growth in Base and Linea networks makes it clear that the Ethereum ecosystem continues to expand. The NFT market has reignited trading volume on the Ethereum network amid increased user interest. Especially after Abstract announced that it will go mainnet in February, the demand for NFT collections created on the platform is noteworthy. This stands out as an important development that strengthens the long-term demand base for Ethereum.
The increase in ETH staked on Eigen Layer and Beacon Chain demonstrates investors’ continued confidence in Ethereum. This increase supports the stability of the network’s underlying metrics and reinforces the adoption of Ethereum as a store of value.
According to Cumulative Volume Delta (CVD) analysis, the rally in spot markets after the recent decline suggests that buyers are regaining strength and the price has the potential to move higher in the coming weeks.
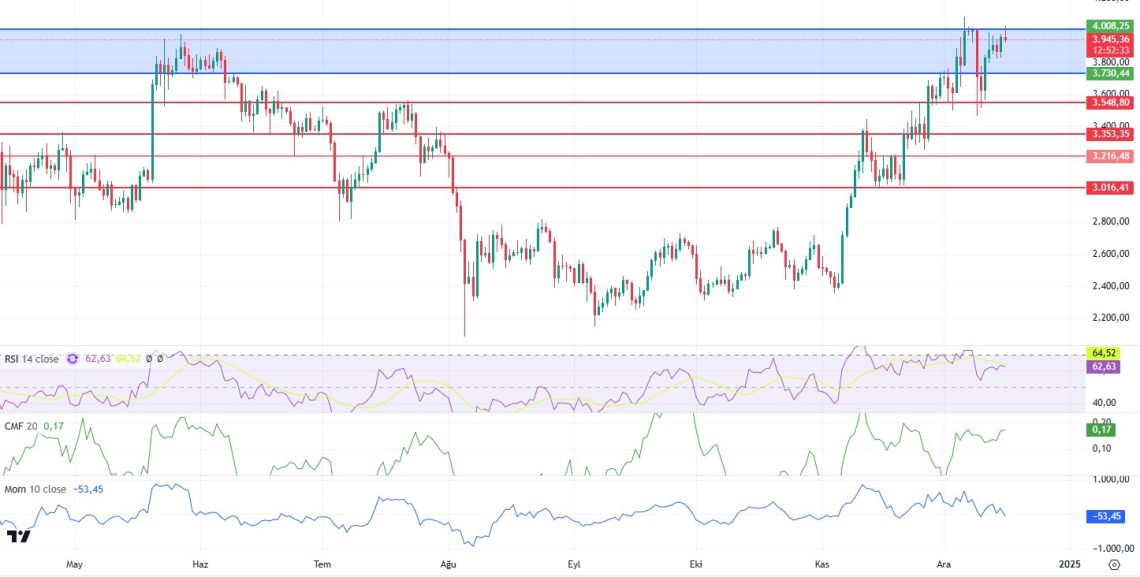
In last week’s correction, Ethereum retreated to $3,548 support, then gained bullish momentum and managed to reach $4,000 levels again. However, at this critical resistance point, it faced strong selling pressure.
Although momentum weakness persists, the Relative Strength Index (RSI) has broken out of the overbought zone and formed a positive mismatch. This suggests a positive outlook and signals that the upward movement may continue. CMF continues to rise, keeping a positive outlook on the market. This suggests that buyers are still strong and demand for Ethereum continues.
A break of the $4,008 resistance could pave the way for a strong upside move in Ethereum. In this case, the first target could be set at $4,374. If this region is exceeded, it is possible to reach higher levels. The loss of the $3,730 level could lead Ethereum to experience a deeper retracement. In this case, the price can be expected to test the $3,548 support again.
Ethereum offers a positive long-term outlook with strong fundamental and technical indicators. In the short term, however, it is crucial for the price to break through the $4,000 resistance. The expansion of the ecosystem, the activity in the NFT market and the increase in the amount of ETH staked continue to support Ethereum’s potential. A recovery in momentum and an increase in trading volume could put this uptrend on a firmer footing.
Supports 3,730 – 3,551 – 3,353
Resistances 4,008 – 4,374 – 4,610
XRP/USDT
Ripple continues to attract attention with its steps to grow its global ecosystem. In particular, its deepening cooperation with Japan-based SBI Holdings underlines its goal of increasing the use of XRP in the Asia-Pacific region. At the same time, speculation that SEC Chairman Gary Gensler may step down has strengthened the perception that the regulatory pressure on Ripple may decrease. Such positive news flows have increased interest in XRP and continue to have an impact on price movements.
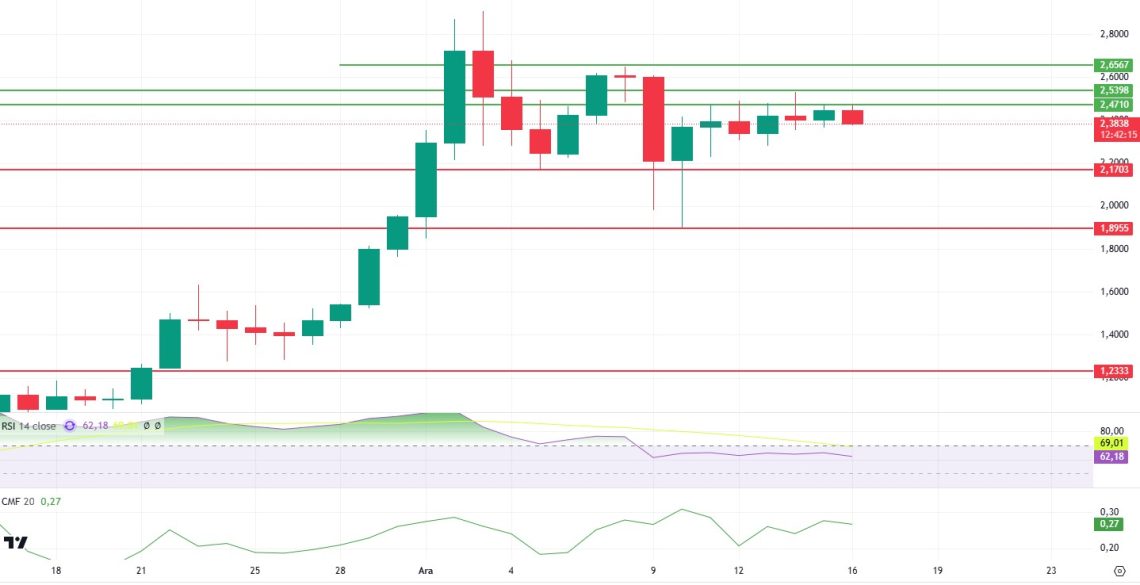
There has been a remarkable period of accumulation in the XRP price recently. Trading in the $2.19-2.65 band, the price continues to consolidate within this wide range. This situation ensures that medium and long-term positive expectations are maintained. However, in order for the price to start an upward movement, it is of great importance to break the resistance of $ 2.65. If this resistance is overcome, it may be possible for the price to reach the $2.85 level and then the $3.00 region in the short term.
Looking at the technical indicators, RSI continues its downward trend this week after falling as low as 67 last week. However, the current range of 60-62 indicates a balanced structure and the potential for upside remains. Chaikin Money Flow (CMF) continues to move in positive territory, indicating that buyer interest remains strong. However, the weakness in trading volume stands out as a factor that may limit price movements in the short term.
Despite the weakness in momentum indicators, XRP’s continued stay in the accumulation band is positive. This process shows that the price has found strong support and could form the basis for upward movements in the coming period. However, it should be kept in mind that a deeper correction could occur if the price slips below the $2.19 support. In such a scenario, the $2.05 and $1.90 levels could emerge as important support points, respectively.
In summary, Ripple’s strategic steps and the reduction of regulatory uncertainties strengthen XRP’s long-term outlook. A close above the $2.65 level is crucial for the price to start an uptrend. However, price movements in the accumulation band continue to offer opportunities for medium and long-term positions. In the short term, volume and momentum recovery will be the key factors supporting the bullish potential.
Supports 2.1703- 1.8955- 1.2333
Resistances 2.4710 – 2.5398 – 2.6567
SOL/USDT
Last week, Solana-based memecoin launchpad platform Pump Fun was banned in the UK. Since the platform is based in the UK, uncertainty continues to dominate. Meanwhile, in figs, TVL reached a new ATH of $8.98 billion. In the $1.6 billion liquidation wave, the asset was one of the most resistant tokens to the market downturn. Data from Coinglass showed that total liquidations for leveraged long positions on Solana reached $57 million on December 10. This marks the highest volume of SOL long liquidations in more than five months. Solana’s active addresses, a key indicator of user engagement, fell to the lowest point in December, further reinforcing concerns that interest is waning. This decline in user activity could further weaken Solana’s market position. Without a revival in user activity, pressure on Solana’s price may continue. The Solana price, increased interest in Solana meme coins such as WIF and a potential ETF approval are among the positive data. Grayscale’s recent ETF filing with the SEC has boosted investor enthusiasm, in line with growing demand in the altcoin markets. Moreover, Coinglass’ SOL Long/Short ratio reached 0.9984 in the last 24 hours, its highest level since early November 2024. In addition, the DeFi protocol on the Solana X platform announced that Definitive has become part of the Solana ecosystem. Definitive is known for its advanced features such as multi-pool routing, gasless swaps, and automated TWAP/limit orders. This integration is expected to enhance the capabilities of the Solana network, providing users with more efficient and cost-effective decentralized finance solutions.
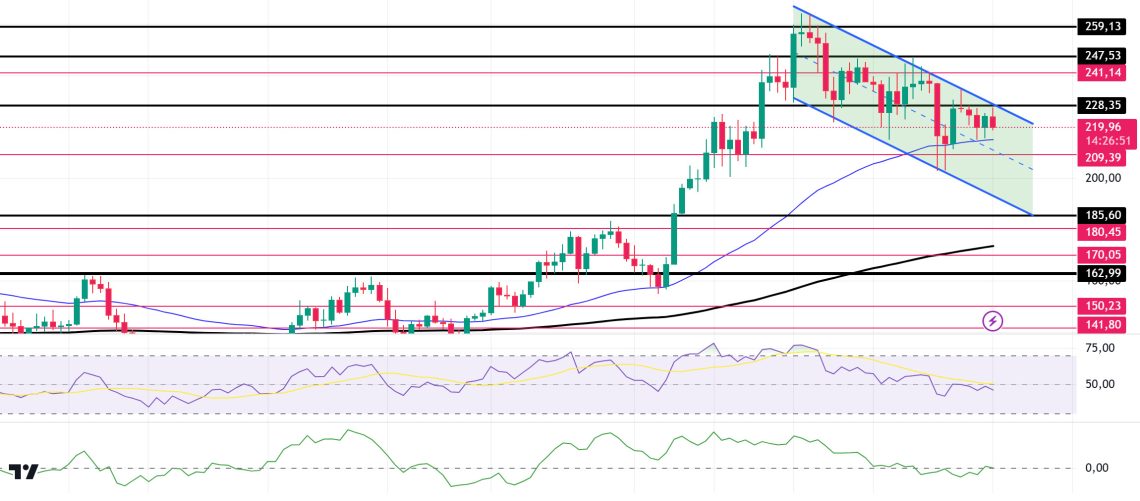
When we look technically, it has broken the 247.53 support, which is a strong resistance place, and made this level a resistance place. This is an important resistance level for the continuation of the rise. On our daily chart, the 50 EMA (Blue Line) continues to accelerate upwards from the 200 EMA (Black Line). This shows that the trend is bullish. Since November 21, the asset, which has been in a downtrend since November 21, continued to move by maintaining this trend. The Relative Strength Index (RSI) has accelerated towards the 14 overbought zone. Moreover, Solana’s daily RSI (14) remains neutral. On the other hand, Chaikin Money Flow (CMF)20 indicator showed that money inflows started to increase, albeit negatively. If the positive results in macroeconomic data and positive developments in the ecosystem continue, it may test the first major resistance level of 247.53. In case of declines due to political developments or negative news in the Solana ecosystem, the 185.60 level can be followed and a buying point can be determined.
Supports 209.39 – 185.60 – 180.45
Resistances 228.35 – 241.14 – 247.53
DOGE/USDT
Last week, Dogecoin (DOGE) Foundation Director Marshall Hayner announced the launch of the DOGE DAO Dashboard via a post on the X platform. Along with this, the Dogecoin Foundation said it aims to expand adoption with the Dogebox Decentralized Infrastructure System for enterprises in 2025. In an important update for the Dogecoin community, an important reminder was made to Dogecoin node operators. Dogecoin node operators were urged to take immediate action to upgrade their systems following the release of Dogecoin Core 1.14.9. On the other hand, SEC Chairman Gary Gensler launched an investigation into Elon Musk’s Neuralink, reviving an investigation into security allegations. On the onchain side, Dogecoin’s Open Interest (OI) reached an all-time high of $4.45 billion on December 9, after tripling in less than a month amid increased speculative interest in memecoin. It bought 210 million DOGE during the recent price correction. The move shows that large investors are using correction periods as an opportunity to accumulate. At the same time, data from IntoTheBlock shows that the large trading volume for DOGE increased to $10.40 billion, indicating increased participation from whales and institutions. In addition, 60,000 new user wallets purchased DOGE, bringing the total number of owner addresses to 6.86 million on December 11. At the same time, DOGE’s 30-day Market Value-to-Realized Value (MVRV) ratio reached 0.69%, moving from negative to positive territory. This ratio is an important metric to understand whether an asset is undervalued or overvalued.
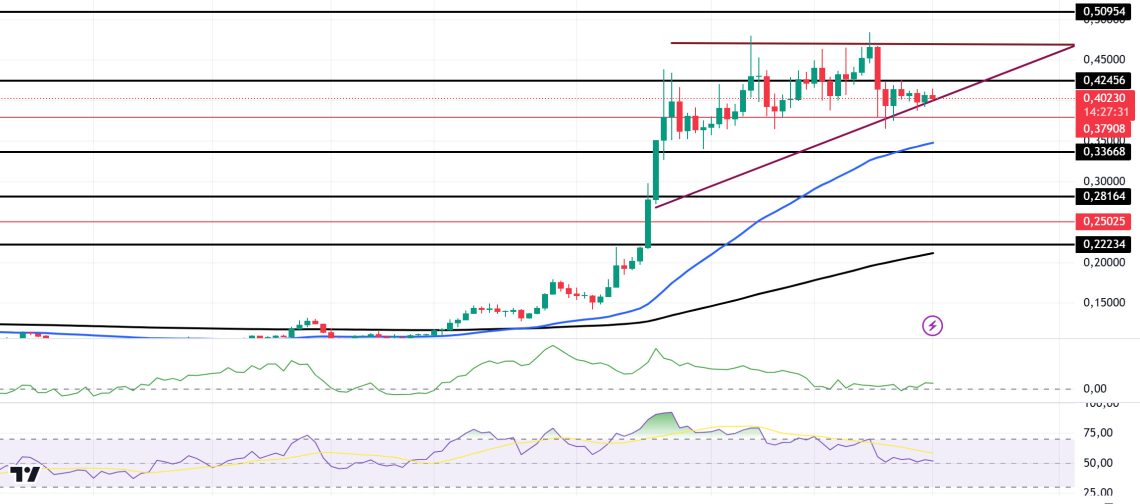
When we look at the daily chart, although the 50 EMA (Blue Line) continues to stay above the 200 EMA (Black Line), the difference between the two averages is 65.23%, increasing the possibility of a retracement. This also shows us that DOGE coin is bullish. In addition, although the difference is starting to close, the asset’s preservation of its price can be considered as an upward signal. If we look at the liquidity zone of DOGE, there is a liquidation place of approximately 191 million dollars in the short position at 0.3830. When we look at the Chaikin Money Flow (CMF)20 indicator, money inflows approached the neutral zone. Relative Strength Index (RSI)14 fell from overbought to neutral territory. Although this shows that the price has risen, it seems to have reduced the bullishness by creating an accumulation here. On the other hand, the ascending triangle pattern should be taken into consideration. If this pattern works, the $1 target may be realized. In case of possible macroeconomic conditions and negative developments in the ecosystem and retracements, 0.33668 can be followed as a strong support. In case of continued rises, 0.50954 should be followed as a strong resistance.
Supports: 0.37908 – 0.33668 – 0.28164
Resistances: 0.42456 – 0.50954 – 0.58043
TRX/USDT
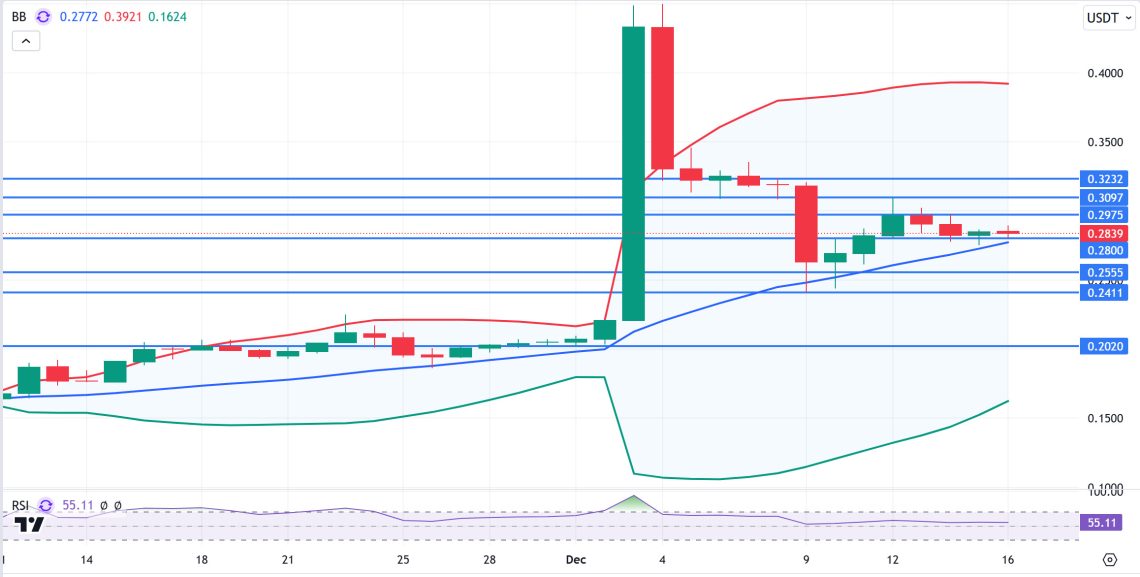
TRX, which started last week at 0.3182, fell about 10% during the week and closed the week at 0.2853. This week, retail sales, FED interest rate decision, gross domestic product, unemployment benefit applications will be announced on the US side. In addition, FED chairman Powell will deliver a speech after the interest rate decision. If the FED cuts interest rates by 25 basis points in line with expectations, it will be welcomed by the markets. Volatility in the market may increase as soon as the interest rate decision is announced and during Powell’s speech afterwards.
TRX, currently trading at 0.2839, is in the Bollinger middle band on the daily chart. With a Relative Strength Index value of 55, it can be expected to rise slightly from its current level and move towards the Bollinger upper band. In such a case, it may test the 0.2975 and 0.3097 resistances. If it cannot close daily above the 0.2975 resistance, it may decline with the selling pressure that may occur and may want to move towards the Bollinger lower band. In such a case, it may test the 0.2800 and 0.2555 supports. As long as it stays above 0.2020 support on the daily chart, the bullish demand may continue. If this support is broken, selling pressure may increase.
Supports: 0.2800 – 0.2555 – 0.2411
Resistances: 0.2975 – 0.3097 – 0.3232
AVAX/USDT
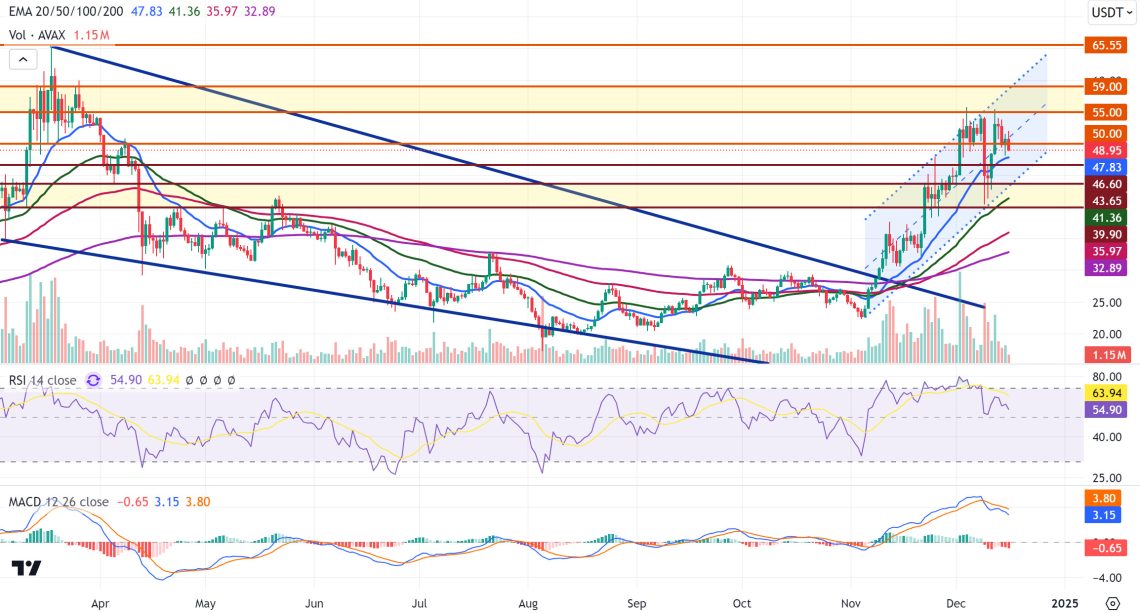
AVAX, which started last week at 54.02, fell as low as 39.6 with the effect of the sharp decline in BTC and the crypto market. In the recovery process after this decline, Avalanche announced a 250 million dollar private locked token sale led by Galaxy Digital, Dragonfly and ParaFi Capital. After this investment news, AVAX rose to 55.4. AVAX, which declined with the subsequent sales, closed the week at 50.76 with a weekly loss of 6% on a weekly basis.
AVAX, which started the new week with a decline, continues to be in the bullish channel. After testing the critical 55.00 resistance level with its rise, AVAX fell with the sales and fell below the 50.00 support level. Exponential moving average (EMA) levels converged closer to AVAX compared to last week and the buying pressure lost strength. Moving Average Convergence/Divergence (MACD) broke the bullish momentum in the positive zone, indicating that buying pressure is weakening. Relative Strength Index (RSI) value fell below 60 and is another data indicating that the buying pressure is decreasing. If the decline in AVAX continues, it may test the 46.60 support level in its decline. If this support level is broken, the decline may deepen and test the 43.65 and 39.90 support zone.
The Avalanche network is going live with a major update, Avalanche9000, on December 16, 2024. With this important update, Avalanche aims to provide a more efficient and flexible platform to developers and users by expanding the performance and use cases of the network. After this update goes live, an increase in AVAX value can be observed. If it starts to rise, it may test the 50.00 resistance level with its rise. If it breaks the resistance level in question, it may test the 55.00-59.00 resistance zone in the continuation of the rise.
Supports : 46.60 – 43.65 – 39.90
Resistances : 50.00 – 55.00 – 59.00
SHIB/USDT
Shiba Inu’s (SHIB) burn rate increased by 515% to 72.8 million SHIB in the last 24 hours. While the weekly burn rate remains low, this deflationary mechanism may create the potential for price increases. The SHIB community was warned about the risks of fraud on the Shibarium network. In particular, research is advised before investing in new projects.
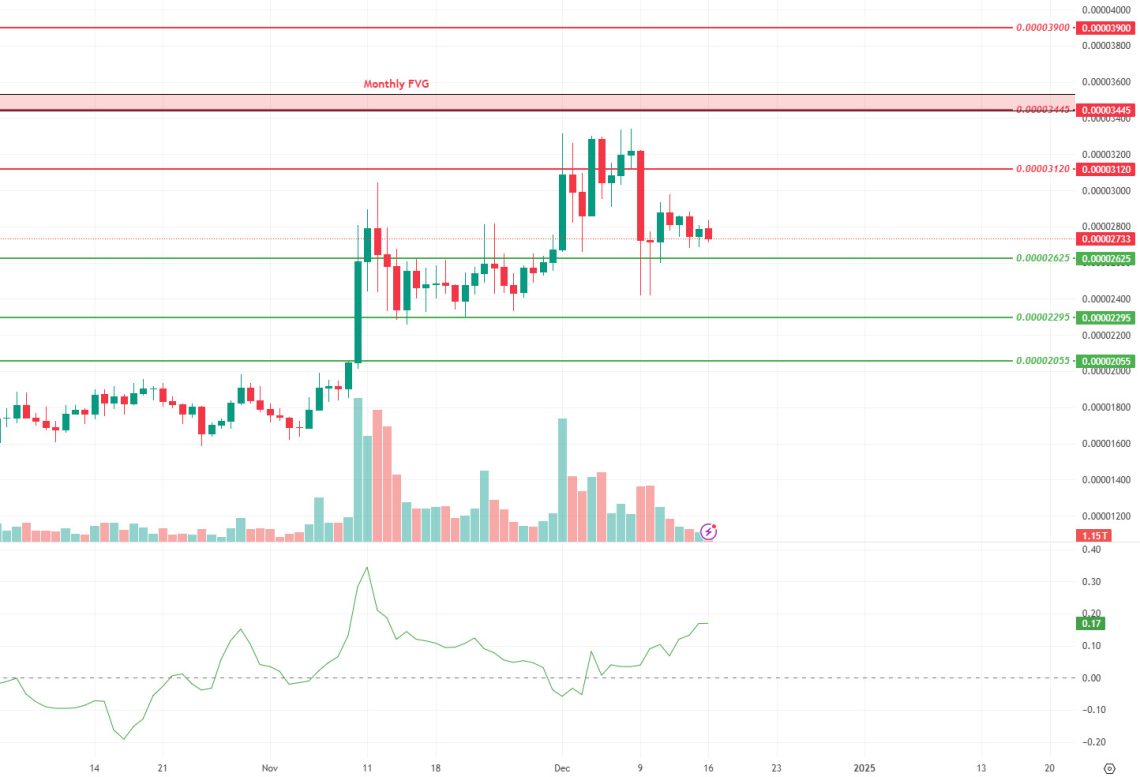
Technically, Shiba Inu (SHIB) price seems to have retreated to the 0.00002625 support level. When we analyze the Chaikin Money Flow (CMF) oscillator, we see that the buyer pressure has increased compared to last week. If the price can maintain above the 0.00002625 level, a rise towards the 0.00003120 resistance levels can be seen. Candle closures above the 0.00003120 level may bring a rise towards the Monthly Fair Value Gap (FVG) levels. In the negative scenario, if the 0.00002625 level is lost, the price may retreat towards 0.00002055 levels.
Supports 0.00002625 – 0.00002295 – 0.00002055
Resistances 0.00003120 – 0.00003445 – 0.00003900
LINK/USDT
On November 15, World Liberty Financial signed a cooperation agreement with Chainlink (LINK), clearly demonstrating its trust and support for the project. This collaboration was seen as an important step for LINK to gain wider acceptance at the institutional level. Then, on December 12, World Liberty Financial made a $2 million purchase of LINK, demonstrating both confidence in the project and a strong belief in LINK’s future potential. As of December 13, LINK’s price approached $30, while the open interest (OI) on its futures exceeded $860 million, a record high. All these developments have increased LINK’s attractiveness for both institutional and retail investors, proving once again the project’s strategic importance in the ecosystem.
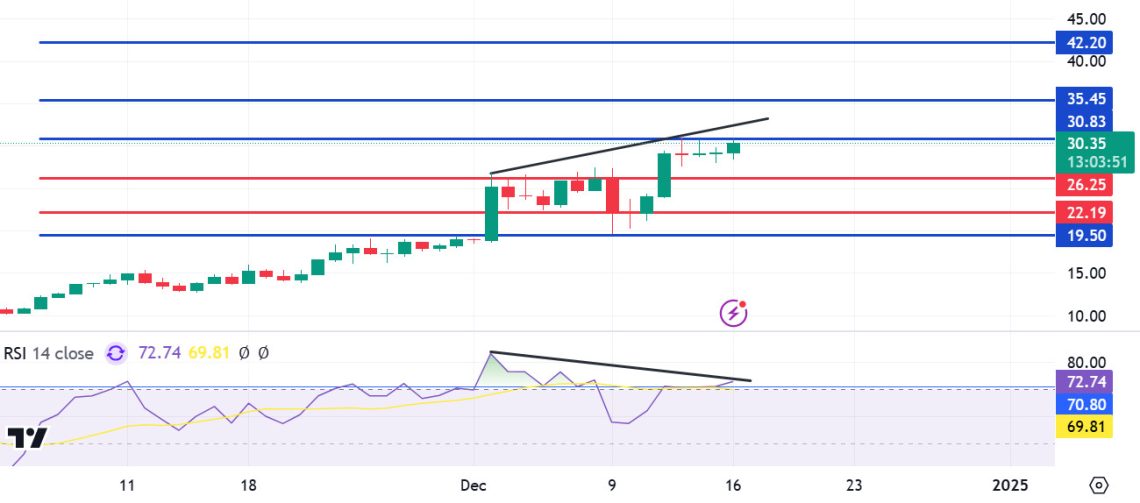
As of December 16, Chainlink continues its upward movement and is testing the key resistance point at $30.83 for the fourth time. Daily closes above this level could allow the momentum to strengthen and target the $35.45 level. In the next step, the probability of the price reaching the $42.20 level will also increase.
On the other hand, the Relative Strength Index (RSI) indicator is exhibiting negative divergence at the current level. This suggests that the risk of the price moving down from these levels is increasing. In possible pullbacks, $26.25 is the first support level, while the $19.50 level should be monitored as a critical support point. If the price falls below this critical support point, the decline is likely to gain momentum. It would be beneficial in terms of risk management to be prepared for possible corrections by carefully monitoring whether the price remains above the resistance levels.
Supports 26.25 – 22.19 – 19.50
Resistances 30.83 – 35.45 – 42.20
LTC/USDT
Litecoin’s 5-week bullish streak ended with last week’s negative close. When LTC transactions on exchanges are analyzed, according to IntoTheBlock data, there was an open futures position of approximately 497 million dollars at the beginning of last week, while this figure decreased to 151.25 million dollars at the end of the week. Although there was a decrease in position sizes in futures transactions, $ 44.26 million worth of LTC was transferred from exchanges to wallets when looking at the net flow in the market. When the mobility in wallets is analyzed, it is seen that 78% of LTC’s circulating supply has been waiting in wallets for more than 1 year. This shows that there is an expectation of a rise in Litecoin in the medium-long term and that investors continue to invest even if prices fall. On the other hand, looking at the closed futures positions and the negative week brought by them, it can be said that investors in the spot markets seem to prefer to wait a while longer for profit realization.
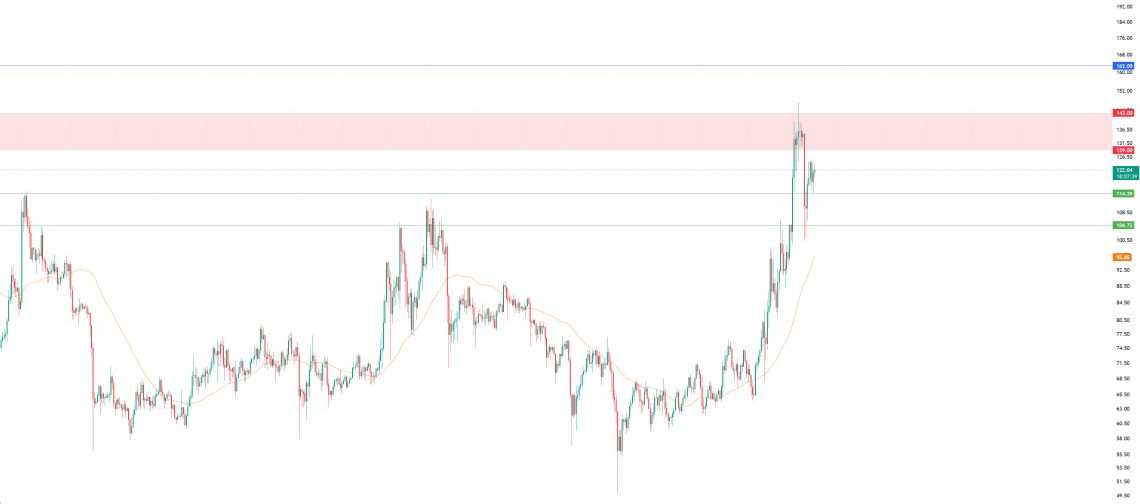
When LTC is analyzed on the daily chart, if the intermediate horizontal supports of 114.39 and 104.73 are broken downwards, the 50-day periodic average (orange line) passing through 95.85 may work as a strong support for the price to hold. In bullish situations, it can be expected that there is an important resistance zone in the 129.00 and 143.00 band and that the movement towards the intermediate resistance level of 163.00 can be expected to start with the exceeding of this zone.
Resistances:129.00 – 143.00 – 163.00
Supports: 114.39 -104.73- 95.85
LEGAL NOTICE
The investment information, comments and recommendations contained in this document do not constitute investment advisory services. Investment advisory services are provided by authorized institutions on a personal basis, taking into account the risk and return preferences of individuals. The comments and recommendations contained in this document are of a general type. These recommendations may not be suitable for your financial situation and risk and return preferences. Therefore, making an investment decision based solely on the information contained in this document may not result in results that are in line with your expectations.


