Active Addressees
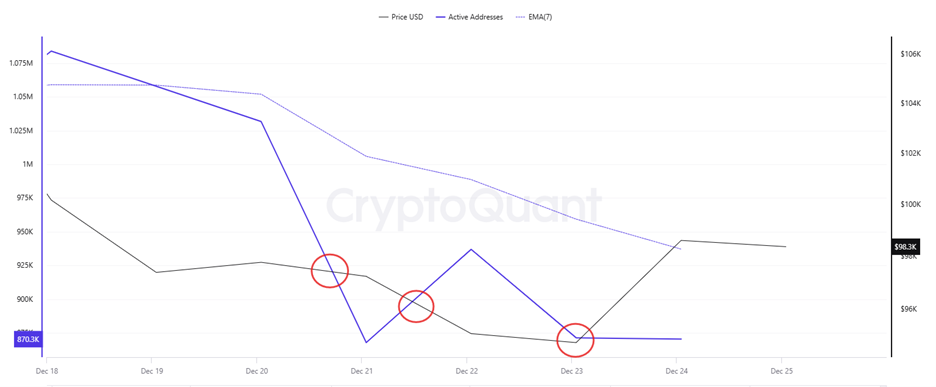
This week, $871,000 in active addresses entered exchanges between December 18 and December 25, 2024. Bitcoin fell from a price of $107,000 to a price of $94,000 during this period. The intersection of price and the number of active addresses in the area marked on the chart of addresses ready to trade, the lowest number of active addresses since December, supported Bitcoin purchases as of December 23. After December 24, the price has been generally trending upwards. This may indicate that the market is strengthening, and investors are showing more interest. When we follow the 7-day simple moving average, we have the impression that this average is also trending upwards. Bitcoin reached 937,039,887 in correlation with the active address EMA (7). This triggered the rise of the Bitcoin price to $98,000.
 On the exits, there was a significant increase towards December 12, with the Black Line (price line) and then a decline. On the day of the price high, active shipping addresses rose as high as 722,707, suggesting that buyers may have sold their long positions out of fear and outflows may have occurred. The rise in active shipping addresses marks the day when the Bitcoin price started to fall to around $92,000. Looking at these metrics, we can see that the price has been quite volatile during this period and investors have been reducing their bitcoin positions. If there is a decrease in the number of active addresses, this could trigger further price declines
Breakdowns
MRVR
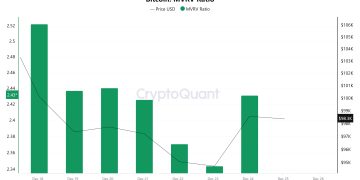 As of December 24, Bitcoin price decreased to 98,601 while MVRV Ratio decreased to 2.43. This represents a decrease of 7.09% in Bitcoin price and a decrease of 9.33% in MVRV Ratio since December 17.
This decline in price and MVRV Ratio suggests that market participants are turning towards profit realization in the short term and confidence in valuations has weakened somewhat. In particular, the decline in the MVRV Ratio to 2.43 may indicate that the market has become less valued compared to the previous week and that investors are cautious about the sustainability of current price levels.
However, the fact that MVRV did not reach extreme low or overvalued levels suggests that the selling pressure remained limited and the market continued to search for balance in general. This may indicate that investors are closely monitoring the current dynamics of the market and are cautious against a sudden change in direction.
The fact that the MVRV remains at moderate levels despite the downturn in Bitcoin’s price action may indicate that the market may be in a correction but long-term confidence is not completely shaken.
Realized Price
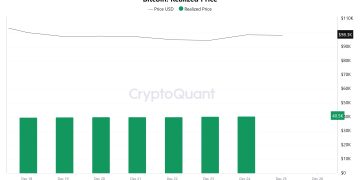 As of December 24, Bitcoin price decreased to 98,601 while Realized Price increased to 40,451. The 7.09% decrease in price and 1.91% increase in Realized Price suggests that the sell-off may have been driven by short-term investors.
The fact that the Bitcoin price is approaching the Realized Price suggests that confidence in market valuation may be waning. However, the increase in the Realized Price may indicate continued support for the market from long-term investors.
Spent Output Profit Ratio (SOPR)
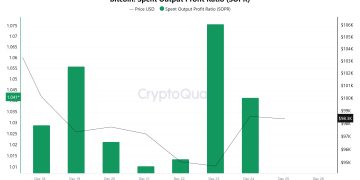 As of December 24, Bitcoin price decreased to 98,601, while the SOPR (Spent Output Profit Ratio) metric reached 1.04. During this period, the Bitcoin price decreased by 1.56% since December 18, while the SOPR increased by 1.96%. A rise in SOPR may indicate that investors are continuing profit realizations and market participants are generally profitable. As the SOPR value continues to remain above 1, it may indicate that the market is in a profitable environment and investor sentiment remains positive. However, an increase in SOPR despite a decline in price may suggest that profit realizations are not excessive and market dynamics are relatively balanced.
Derivatives
Open Interest
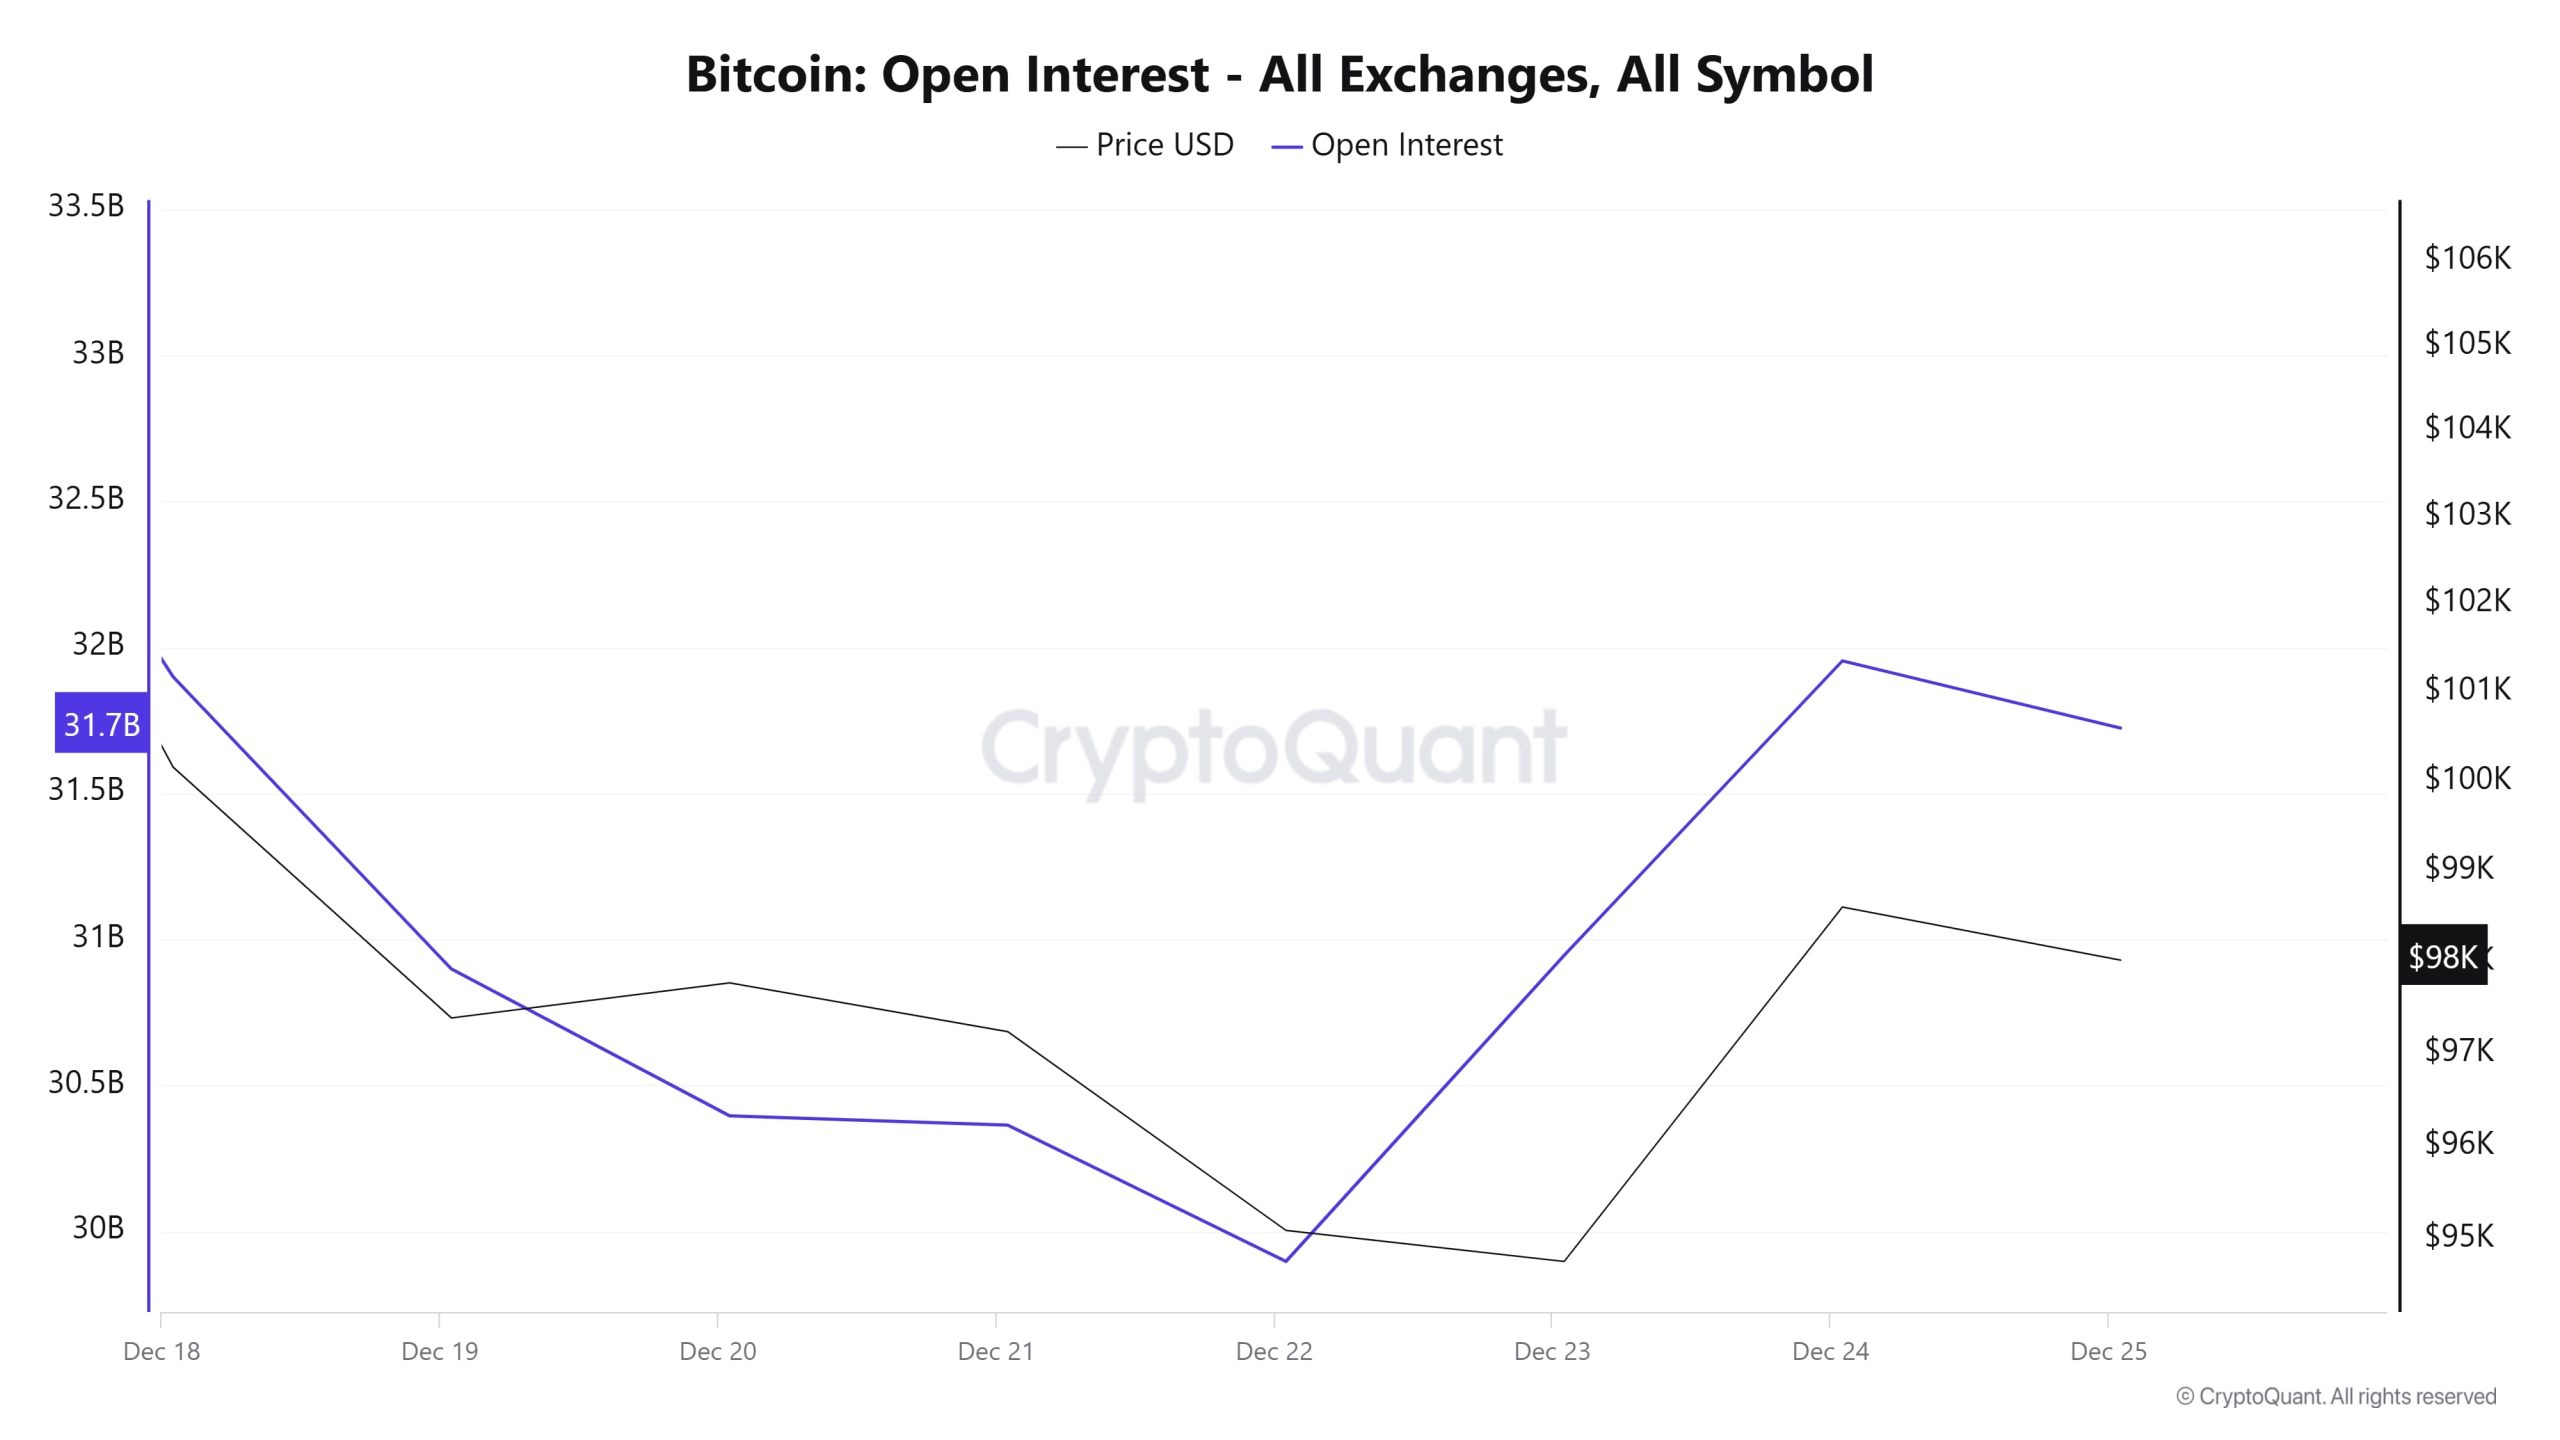 The chart shows a striking relationship between Bitcoin price and open interest (OI). Between December 19 and 22, both the price and OI declined. This indicates that traders are closing their positions, and the market is experiencing a lack of confidence. The price moved with weak trading volume during this period.
In the period December 22-24, there is a strong increase in OI and prices. This suggests that the market is regaining traction and investors are opening positions in anticipation of a rise. However, on December 25, the rate of increase in OI slowed down. This could be a sign that bullish momentum is starting to weaken. The price also shows a more limited movement at this point.
This data calls into question whether the uptrend can maintain its strength. If the price continues to rise, the trend will be supported, but if the price enters a correction, it could be considered short-term. Price and OI movements need to be carefully monitored for the next direction of the market.
Funding Rate
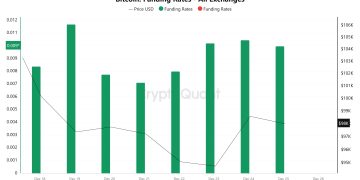 The chart shows the dynamics of Bitcoin price and funding rates. Between December 19 and 22, funding rates were positive but showed a slight downward trend. The downward movement of the price during this period indicates that despite the dominance of long positions in the market, the price did not meet expectations and investors face the risk of loss.
After December 22, there is a significant increase in funding rates. With this recovery, the price is also on the rise. We observe that funding rates reached their peak especially between December 23-24. This shows that the bullish expectation in the market has strengthened considerably, and long positions have increased their dominance. However, such a rise in funding rates suggests that excessive long accumulation has started, and the market has become unbalanced. During the period of December 24-25, funding rates remained at high levels, but the price started to follow a more horizontal course. This reflects that although long positions remain dominant, price momentum is weakening, and investors are indecisive despite bullish expectations. If the price declines in the meantime, there could be another wave of liquidation in the market due to relatively high funding rates. In general, funding ratios have been consistently positive and at high levels, indicating that bullish sentiment prevails in the market.
Long & Short Liquidations
Bitcoin’s sharp decline on December 19-20 caused serious fluctuations in the crypto market. In this process, especially long positions were largely liquidated. The total amount of liquidations over the past week exceeded 270 million dollars, clearly demonstrating the impact of volatility on investors. In particular, highly leveraged traders were left unprotected against the sudden movements of the market. The majority of these liquidations took place when Bitcoin’s price took an unexpected plunge.
Although there was a more limited amount of liquidation in short positions, it is possible to say that long position holders suffered mainly as the overall market trend was bearish. This once again highlights the importance of risk management in the market
| History | Long Amount (Million $) | Short Amount (Million $) |
|---|---|---|
| December 19 | 87.76 | 18.09 |
| December 20 | 51.23 | 20.32 |
| December 21 | 8.69 | 12.91 |
| December 22 | 16.64 | 4.77 |
| December 23 | 18.98 | 8.65 |
| December 24th | 10.18 | 14.39 |
| Total | 193.48 | 79.13 |
Supply Distribution
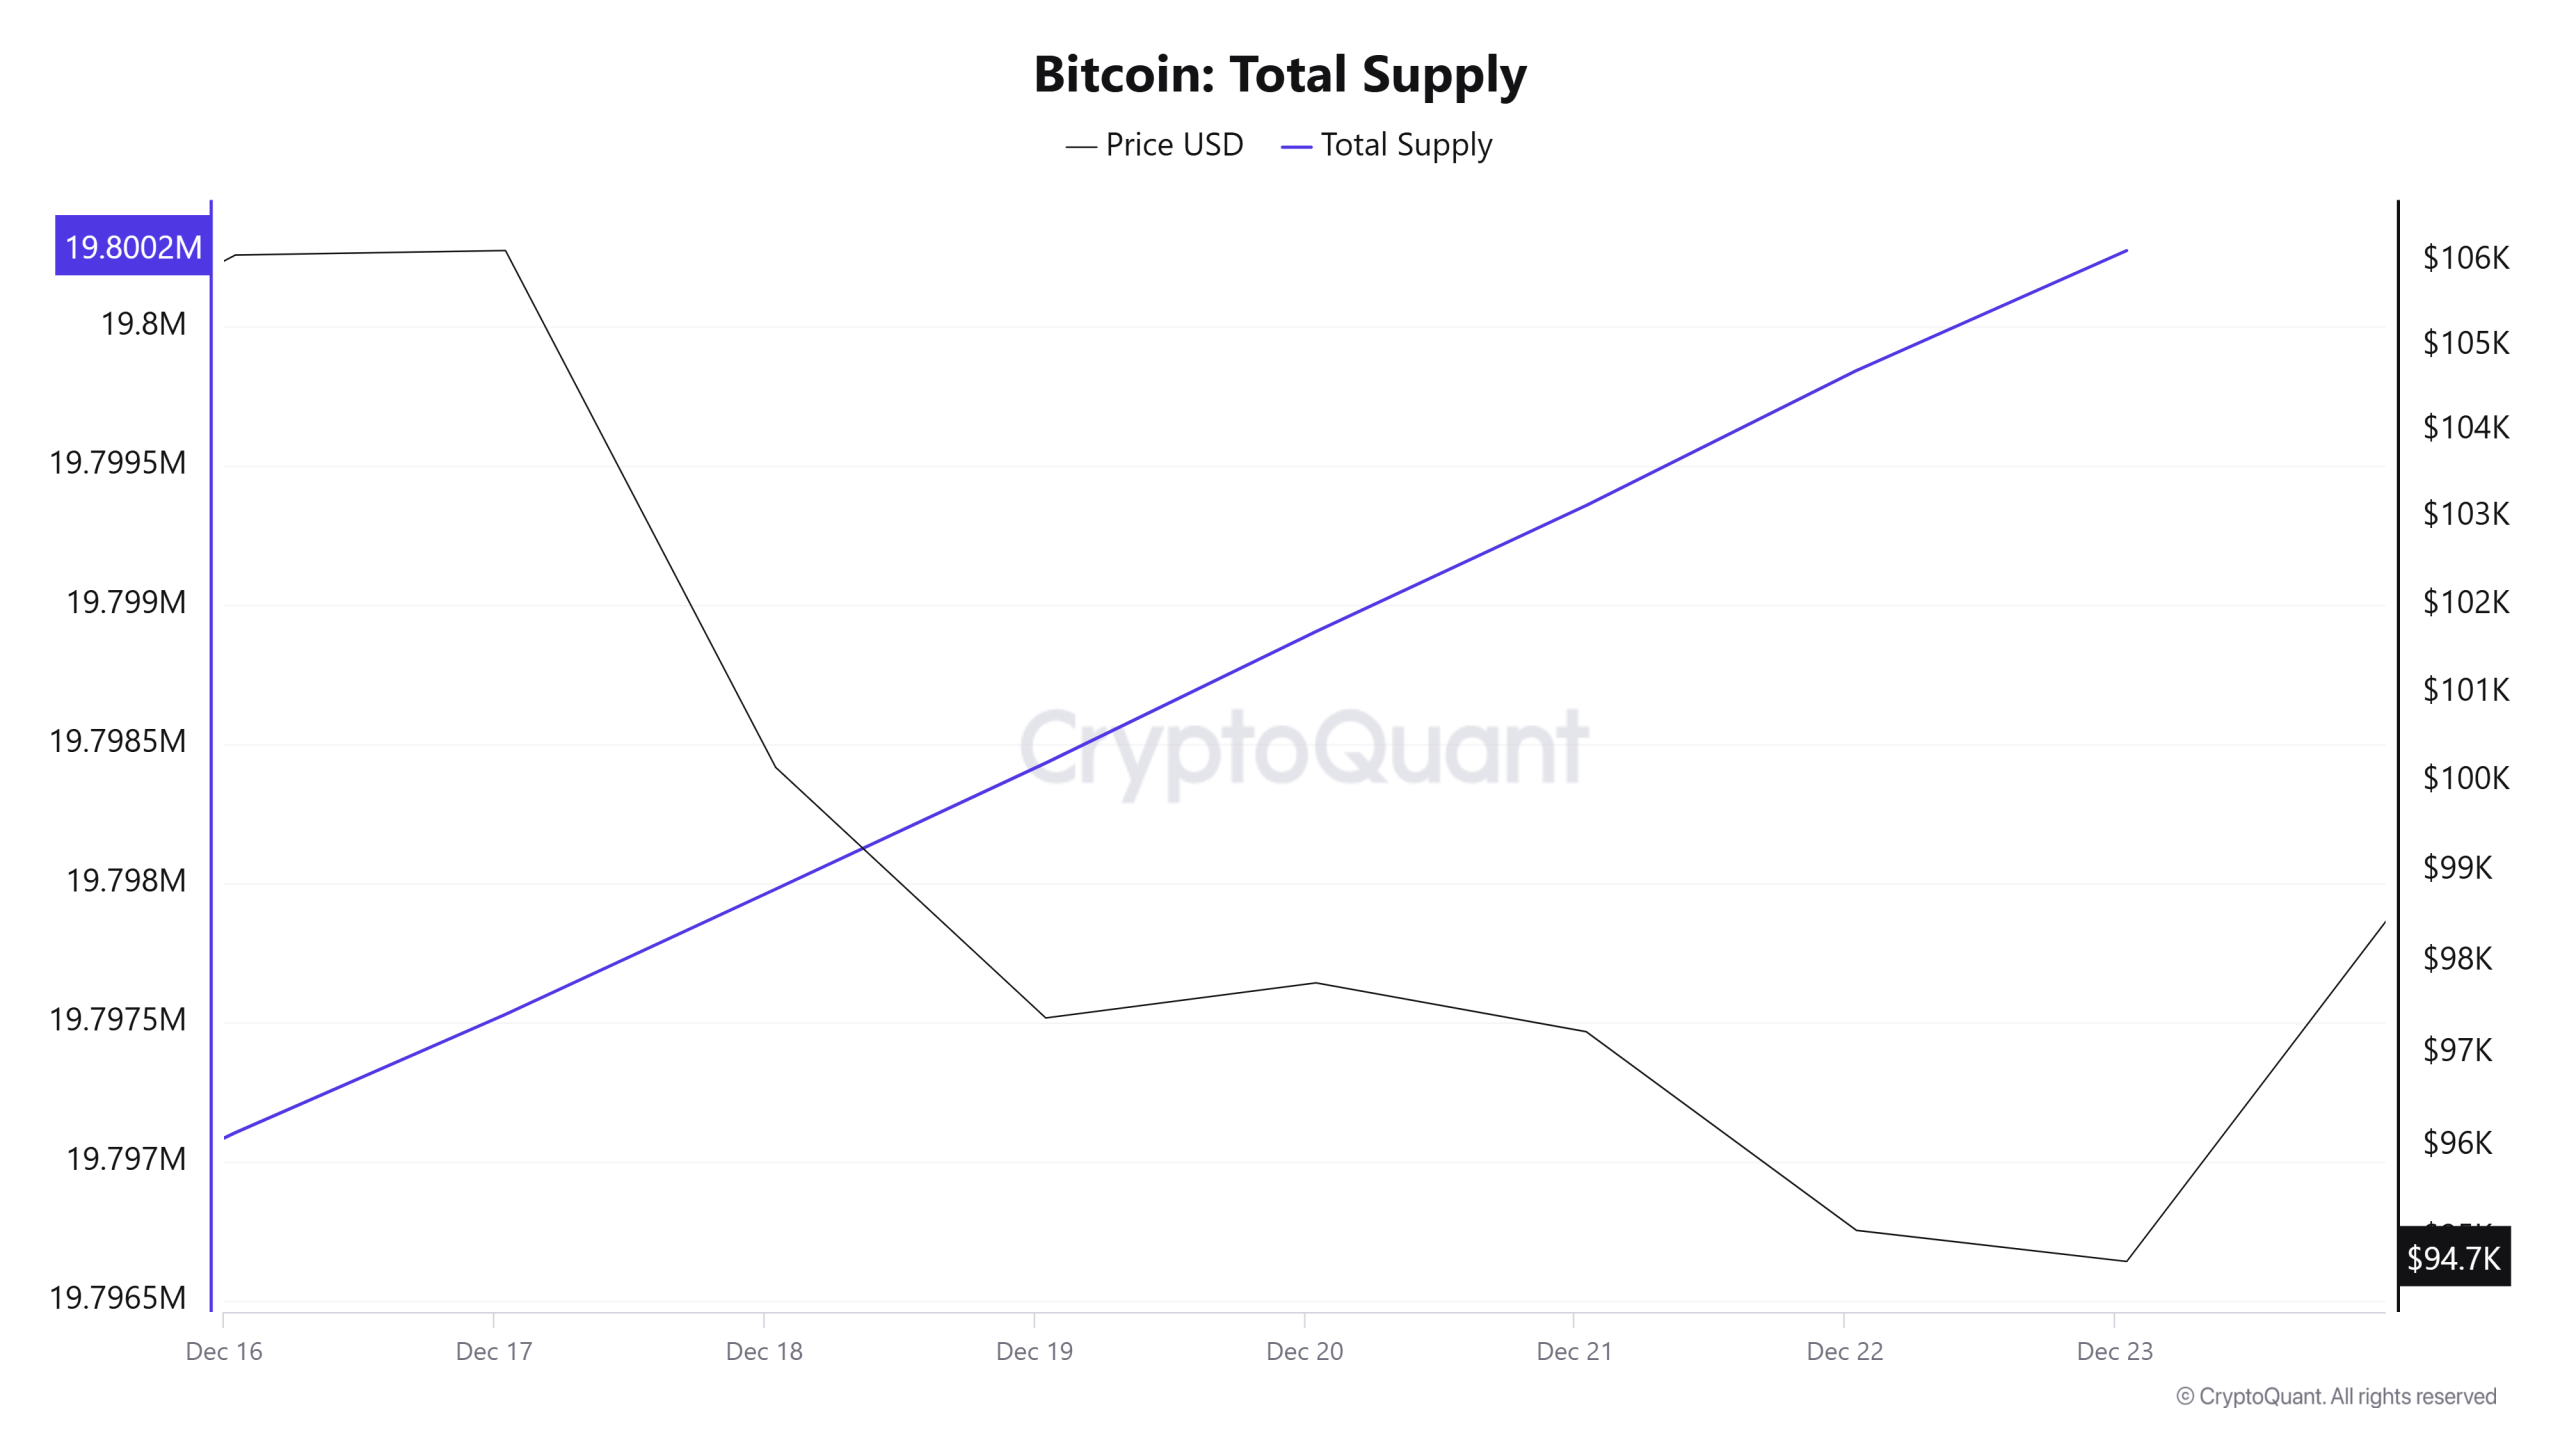
- Total Supply: It reached 19,800,274 units, up about 0.016% from last week.
- New Supply: The amount of BTC produced this week was 3,169.
- Velocity: A small increase was observed in the data compared to last week
| Wallet Category | 16.12.2024 | 23.12.2024 | Change (%) |
|---|---|---|---|
| < 0.1 BTC | 1.606% | 1.596% | -0.623% |
| 0.1 – 1 BTC | 5.421% | 5.417% | -0.0738% |
| 1 – 100 BTC | 32.307% | 32.261% | -0.1426% |
| 100 – 1k BTC | 22.128% | 22.553% | 1.921% |
| 1k – 100k BTC | 35.259% | 34.901% | -1.025% |
| > 100k BTC | 3.277% | 3.272% | -0.152% |
Evaluation
The distribution of Bitcoin supply shows a decline in the share of small investors, while the share of institutional investors holding 100-1k BTC has increased. Despite a slight decrease in medium-sized wallets (1-100 BTC), this category appears to be open to active trading activity. Small declines in the large whales and largest investor categories may indicate a cautious approach or portfolio rebalancing. Total supply reached 19,800,274 BTC with new production and a slight increase in velocity. Overall, the market dynamics are characterized by an increasing influence of institutional investors and a decreasing weight of small investors.
Exchange Reserve
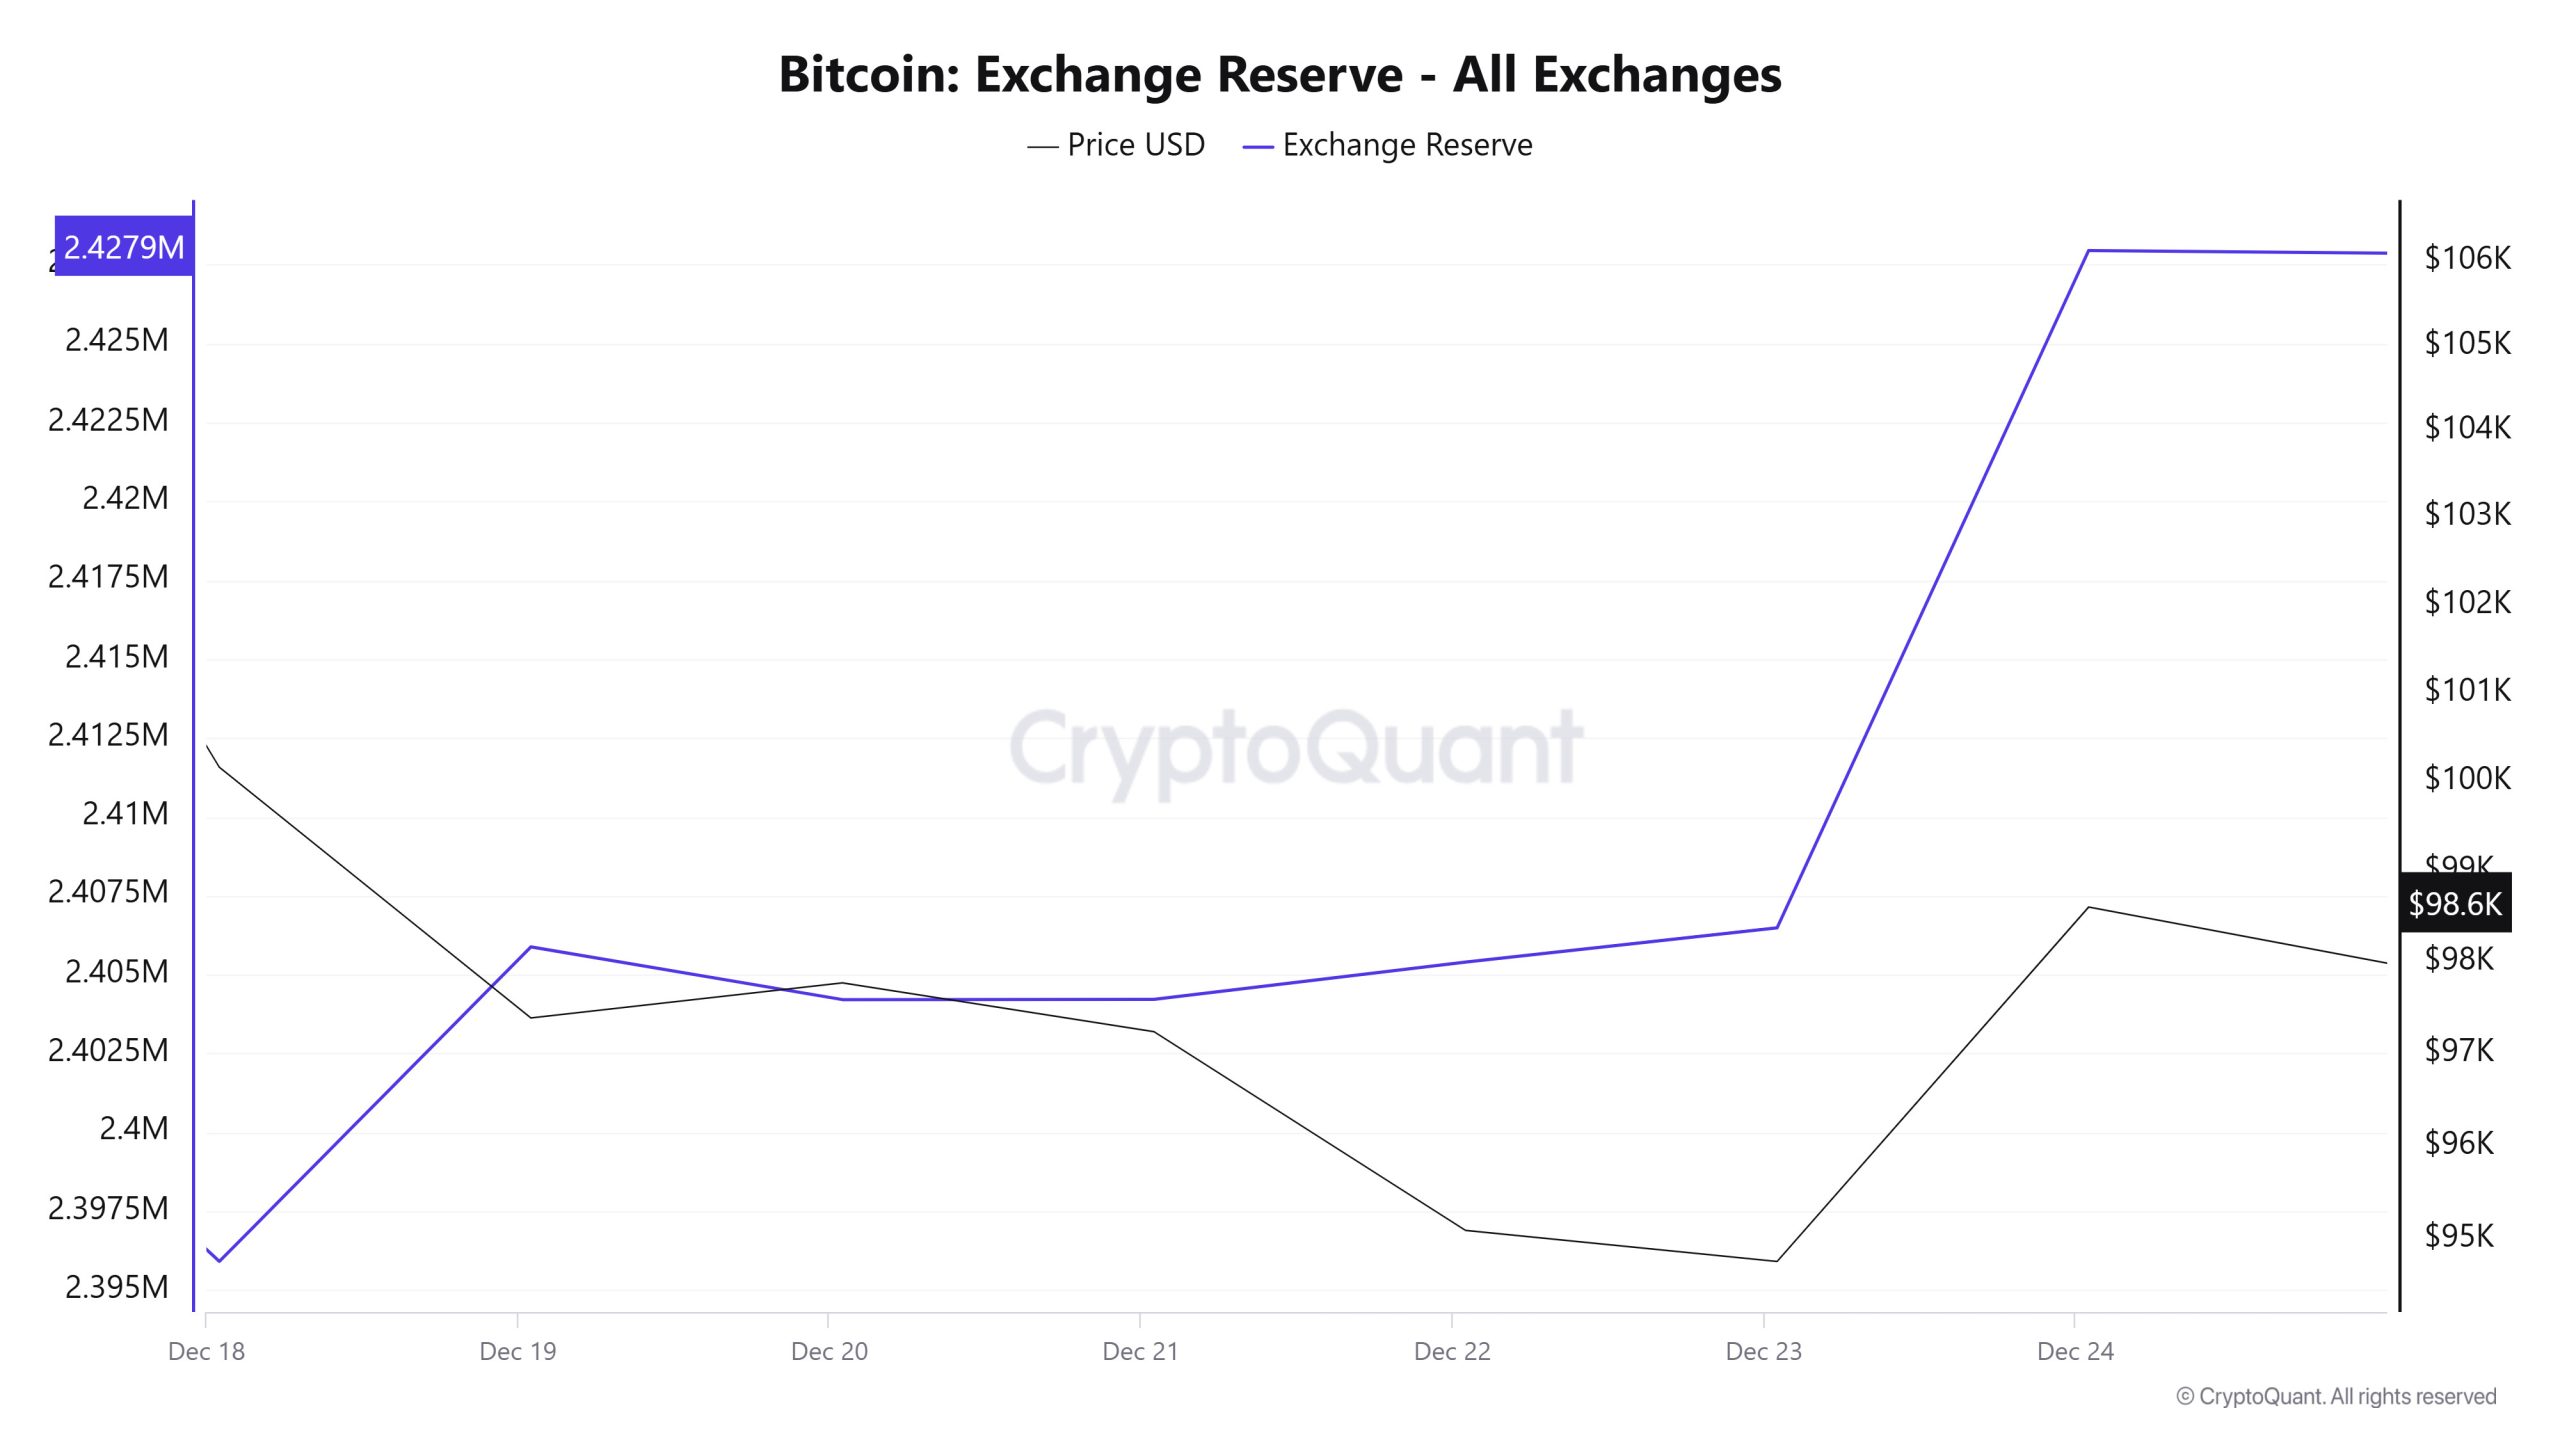 Between December 18-24, 2024, Bitcoin inflows to exchanges attracted attention. The total net inflow to exchanges during this period was 22,844 Bitcoins and the total Bitcoin reserves of the exchanges increased by 0.95%. This increase in reserves signaled that the market could be under potential selling pressure. While the Bitcoin reserves of the exchanges increased, the Bitcoin price followed a volatile course in this process. Bitcoin, which started at $106,000 on December 18, 2024, fell to $92,200 on December 20, 2024. Bitcoin, which showed a recovery trend afterwards, closed at $ 98,600 on December 24, 2024.
| Date | 18 Dec | 19 Dec | 20 Dec | 21 Dec | 22 Dec | 23 Dec | 24 Dec |
|---|---|---|---|---|---|---|---|
| Exchange Inflow | 54,599 | 55,083 | 58,666 | 19,307 | 16,059 | 50,932 | 56,056 |
| Exchange Outflow | 63,787 | 45,115 | 60,338 | 19,297 | 14,877 | 49,849 | 34,594 |
| Exchange Netflow | -9,188 | 9,968 | -1,672 | 10 | 1,181 | 1,083 | 21,462 |
| Exchange Reserve | 2,395,912 | 2,405,880 | 2,404,208 | 2,404,218 | 2,405,399 | 2,406,482 | 2,427,944 |
| BTC Price | 100,159 | 97,384 | 97,767 | 97,234 | 95,094 | 94,763 | 98,602 |
Although increased Bitcoin inflows to exchanges may indicate that market participants may increase profit realization or selling pressure, Bitcoin rebounded from its fall to 92,200 to 99,000. This indicates that the market is reacting in the direction of buying. Bitcoin’s recovery trend, especially the closing at 98,600 on December 24, 2024, despite the reserve increase, reveals that the market has strong demand and investors’ long-term expectations remain positive. This may indicate that Bitcoin may be able to shake off the declines and re-enter an uptrend.
Fees and Revenues
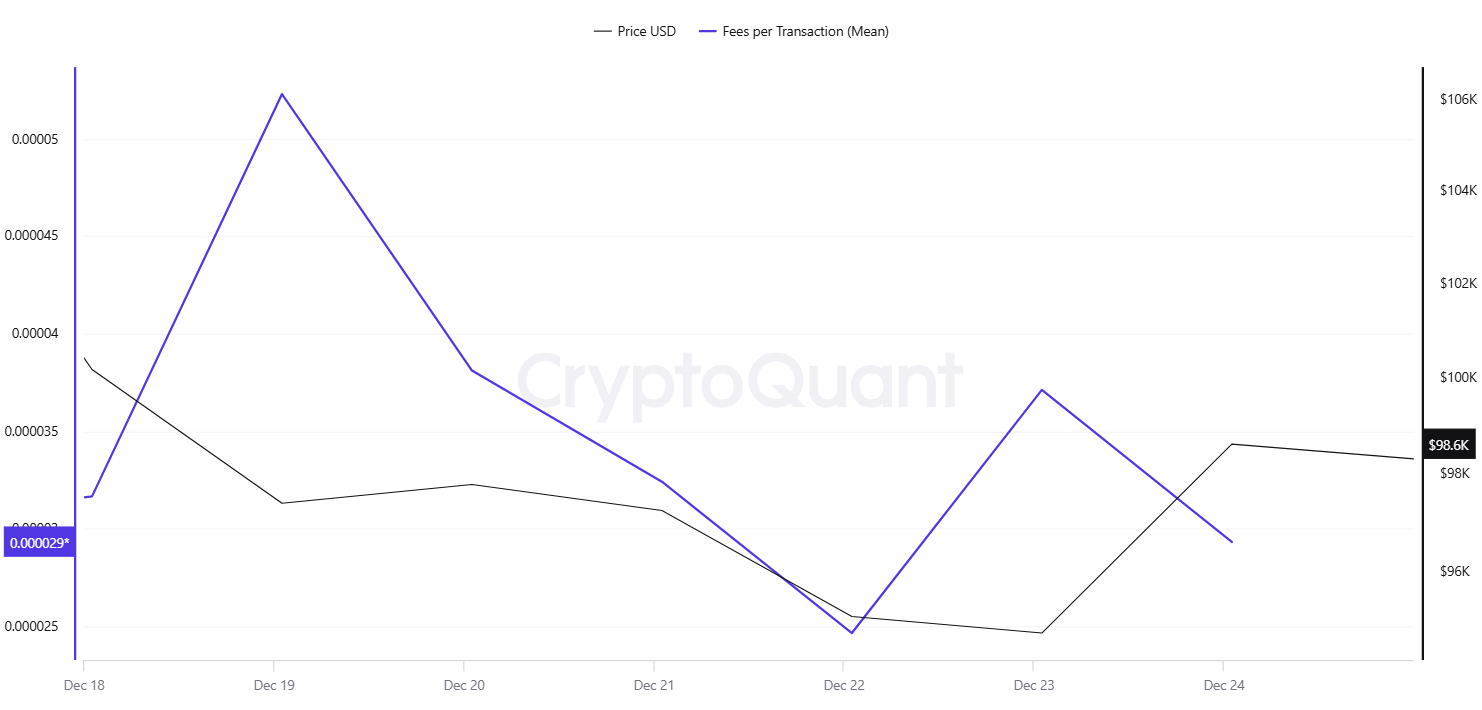
Analysing Bitcoin Fees per Transaction (Mean) data between December 18-24, it was observed that after Bitcoin reached a new all-time high (ATH) on December 17, the Fees per Transaction (Mean) value, which was at 0.00003166 on December 18, increased on December 19 with increasing volatility and reached 0.00005229. This value was also recorded as the highest level of the week.
As the volatility in the Bitcoin price relatively decreased later in the week, Fees per Transaction (Mean) followed a more stable course and stood at 0.00002932 on December 24.
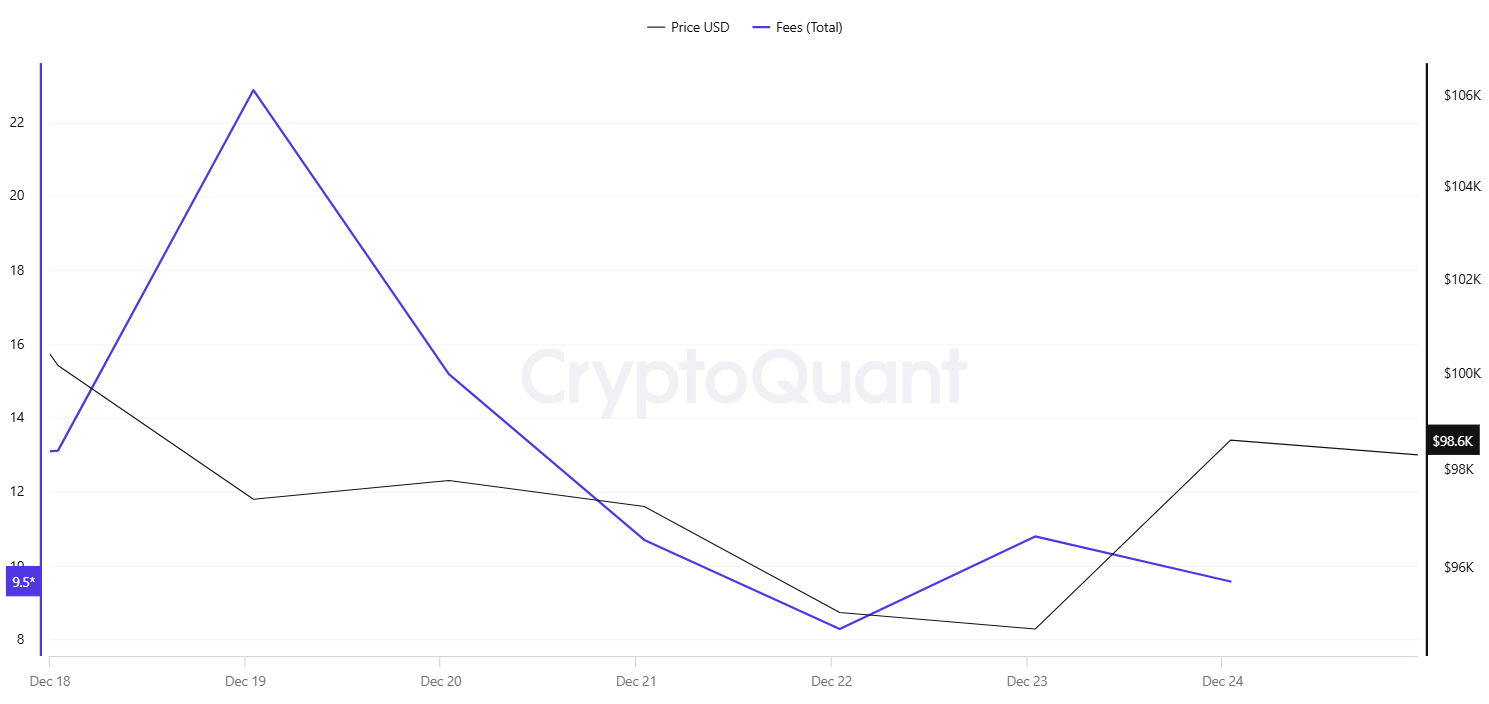
Similarly, when Bitcoin Fees (Total) data between December 18-24 are analyzed, it is seen that the Fees (Total) value, which increased with the negative acceleration that started in Bitcoin price on December 18, reached 22.87270158 on December 19, reaching the highest value of the week.
Fees (Total), which stabilized later in the week as the volatility in Bitcoin price decreased, was realized at 9.57170242 on December 24.
Miner Flows
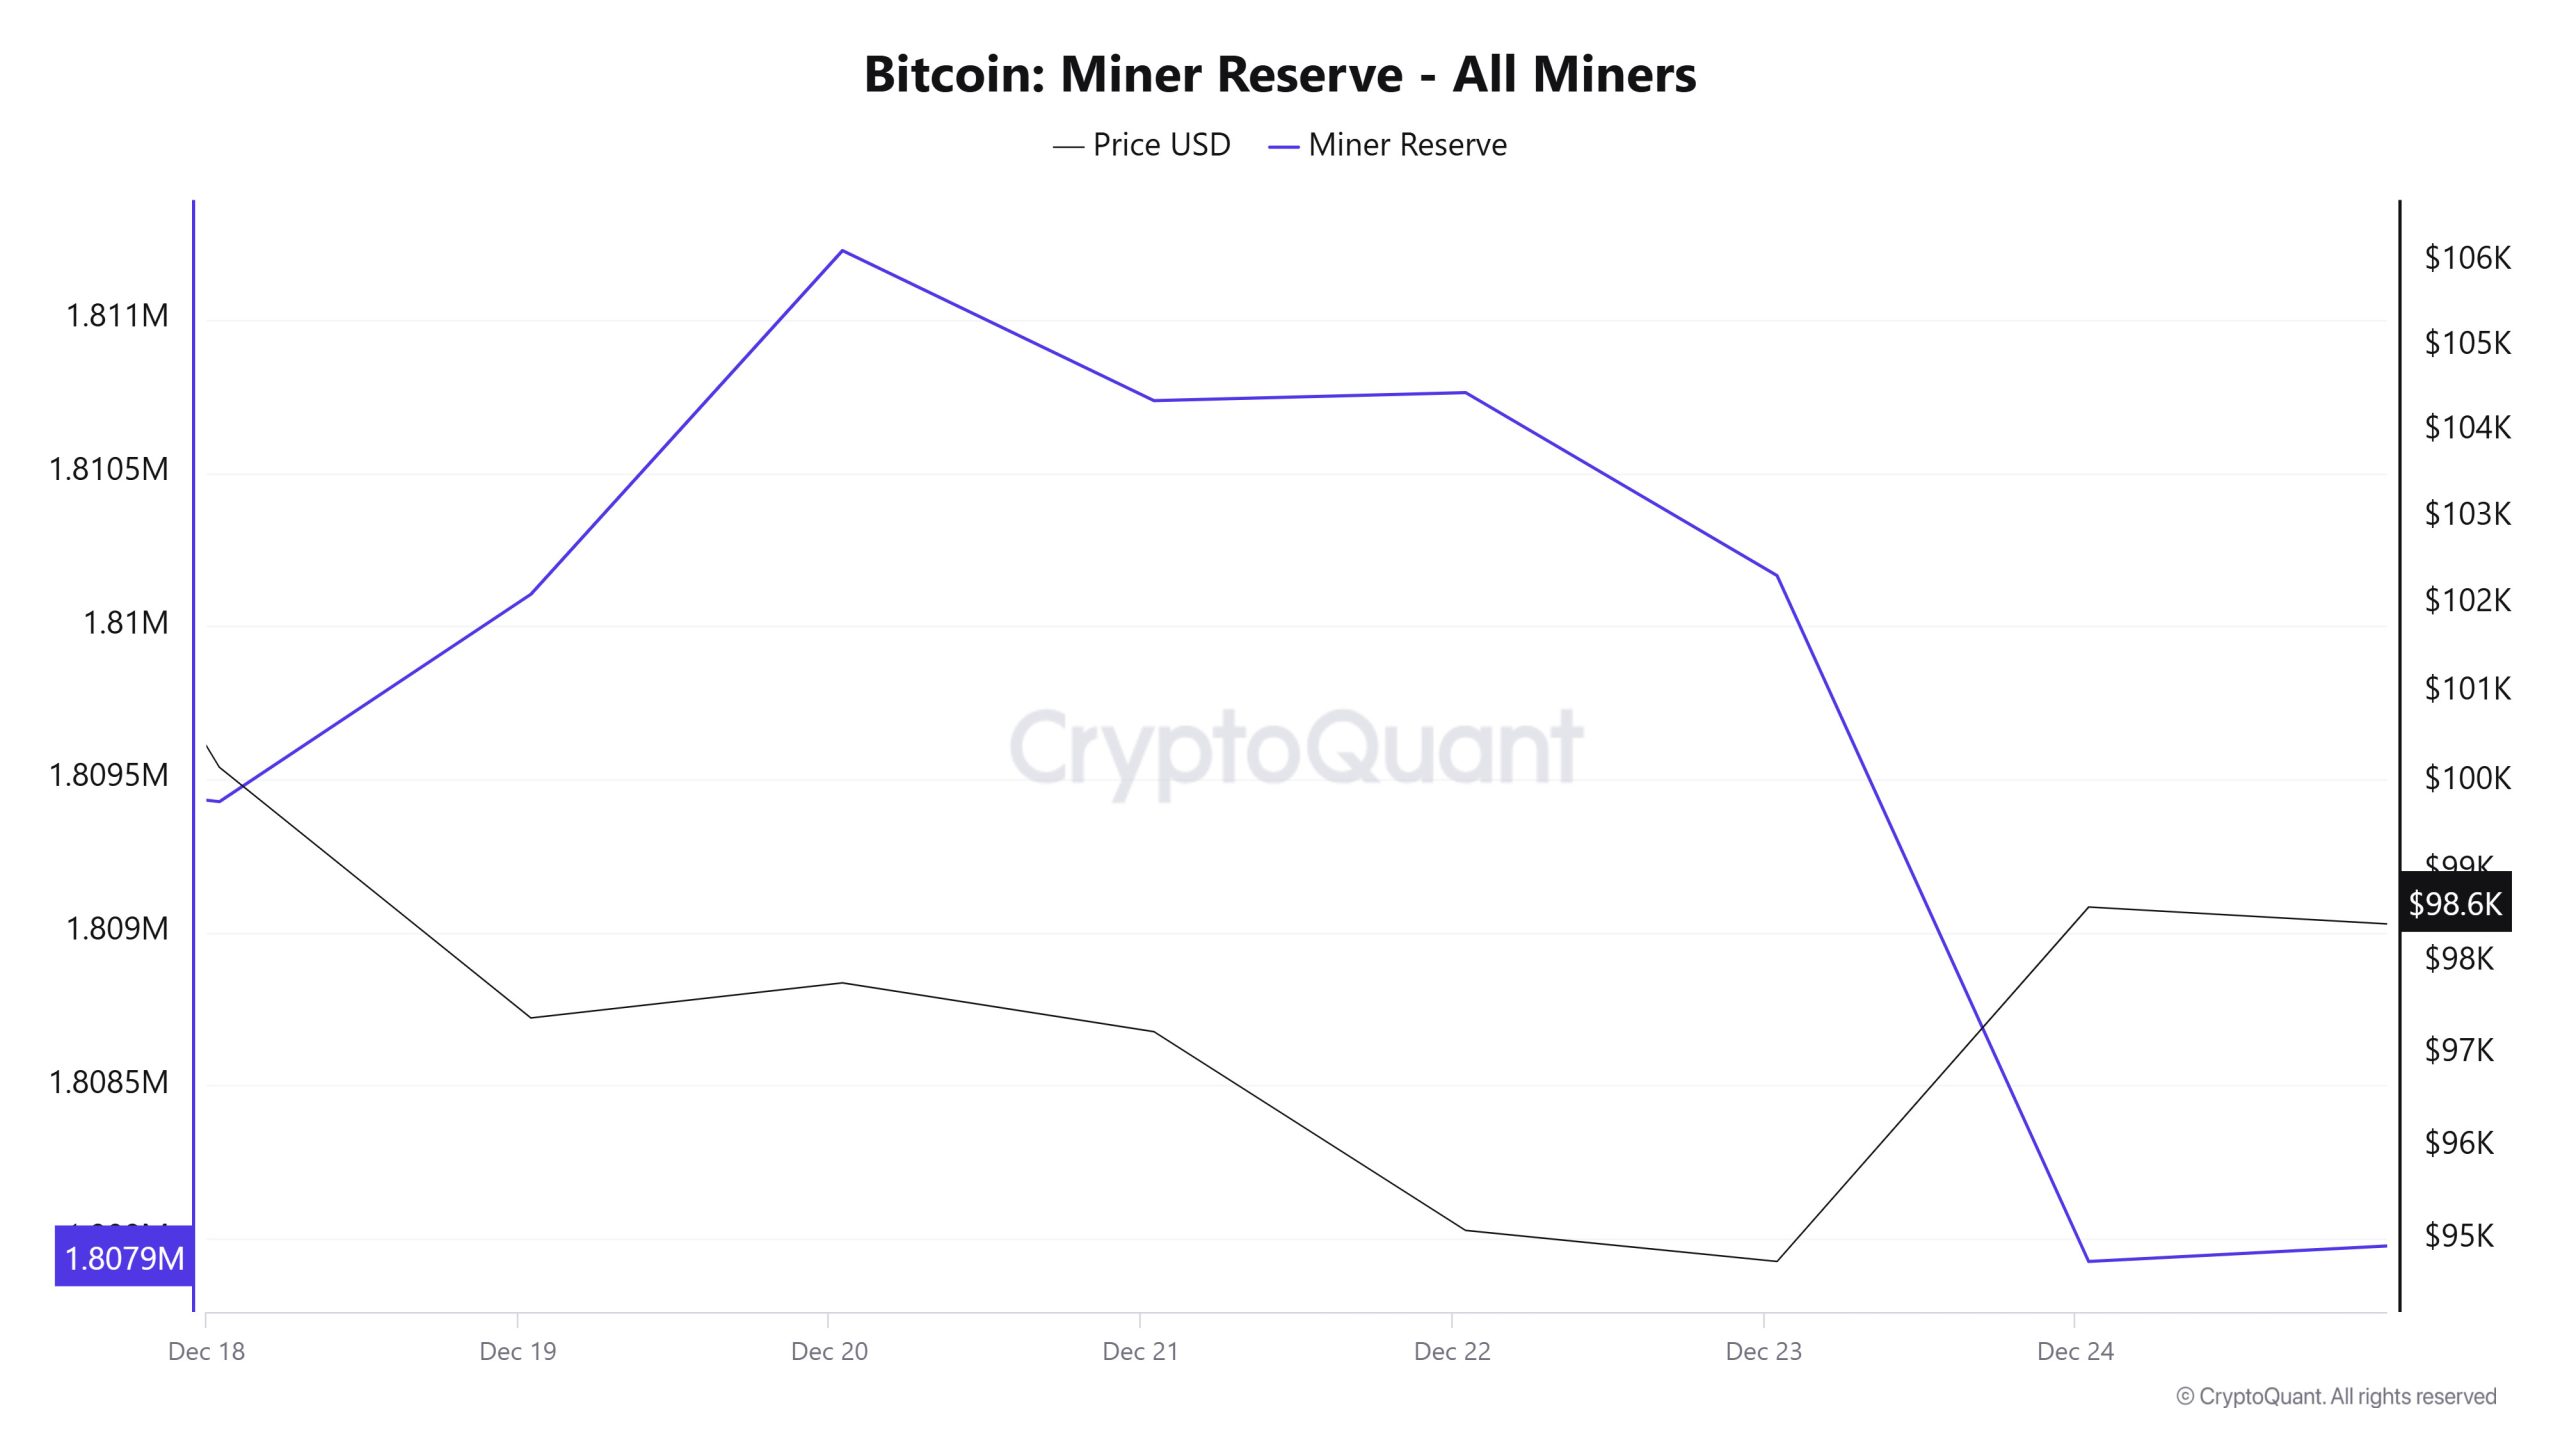
As can be seen in the Miner Reserve table, the number of Bitcoins in miners’ wallets increased at the beginning of the week but decreased in the following days. Miner Reserve and Bitcoin price were negatively correlated at the beginning of the week and positively correlated in the middle of the week and negatively correlated again on the last day.
Miner Inflow, Outflow and Netflow
Between December 18th and 24th, 55,923 Bitcoins exited miners’ wallets, and 54,304 Bitcoins entered miners’ wallets between the same dates. This week’s Miner Netflow was – 1,618 Bitcoin. On December 18, the Bitcoin price was $100,158, while on December 24 it was $98,601.
During the week, Bitcoin inflow into miner wallets (Miner Inflow) was less than Bitcoin outflow from miner wallets (Miner Outflow), resulting in an overall negative net flow (Miner Netflow).
If the recent negative correlation between Miner Reserve and Bitcoin price continues in the coming week, increased outflows from miner wallets may create a buying reaction in the market, and possible declines in Miner Netflow may cause the Bitcoin price to rise.
| Date | 18 Dec | 19 Dec | 20 Dec | 21 Dec | 22 Dec | 23 Dec | 24 Dec |
|---|---|---|---|---|---|---|---|
| Miner Inflow | 7,934.35 | 14,293.58 | 11,519.88 | 3,747.33 | 3,876.18 | 7,568.63 | 5,364.77 |
| Miner Outflow | 8,051.97 | 13,616.46 | 10,397.99 | 4,237.19 | 3,849.94 | 8,166.23 | 7,603.39 |
| Miner Netflow | -117.62 | 677.12 | 1,121.88 | -489.86 | 26.24 | -597.60 | -2,238.63 |
Transaction
Transaction Count
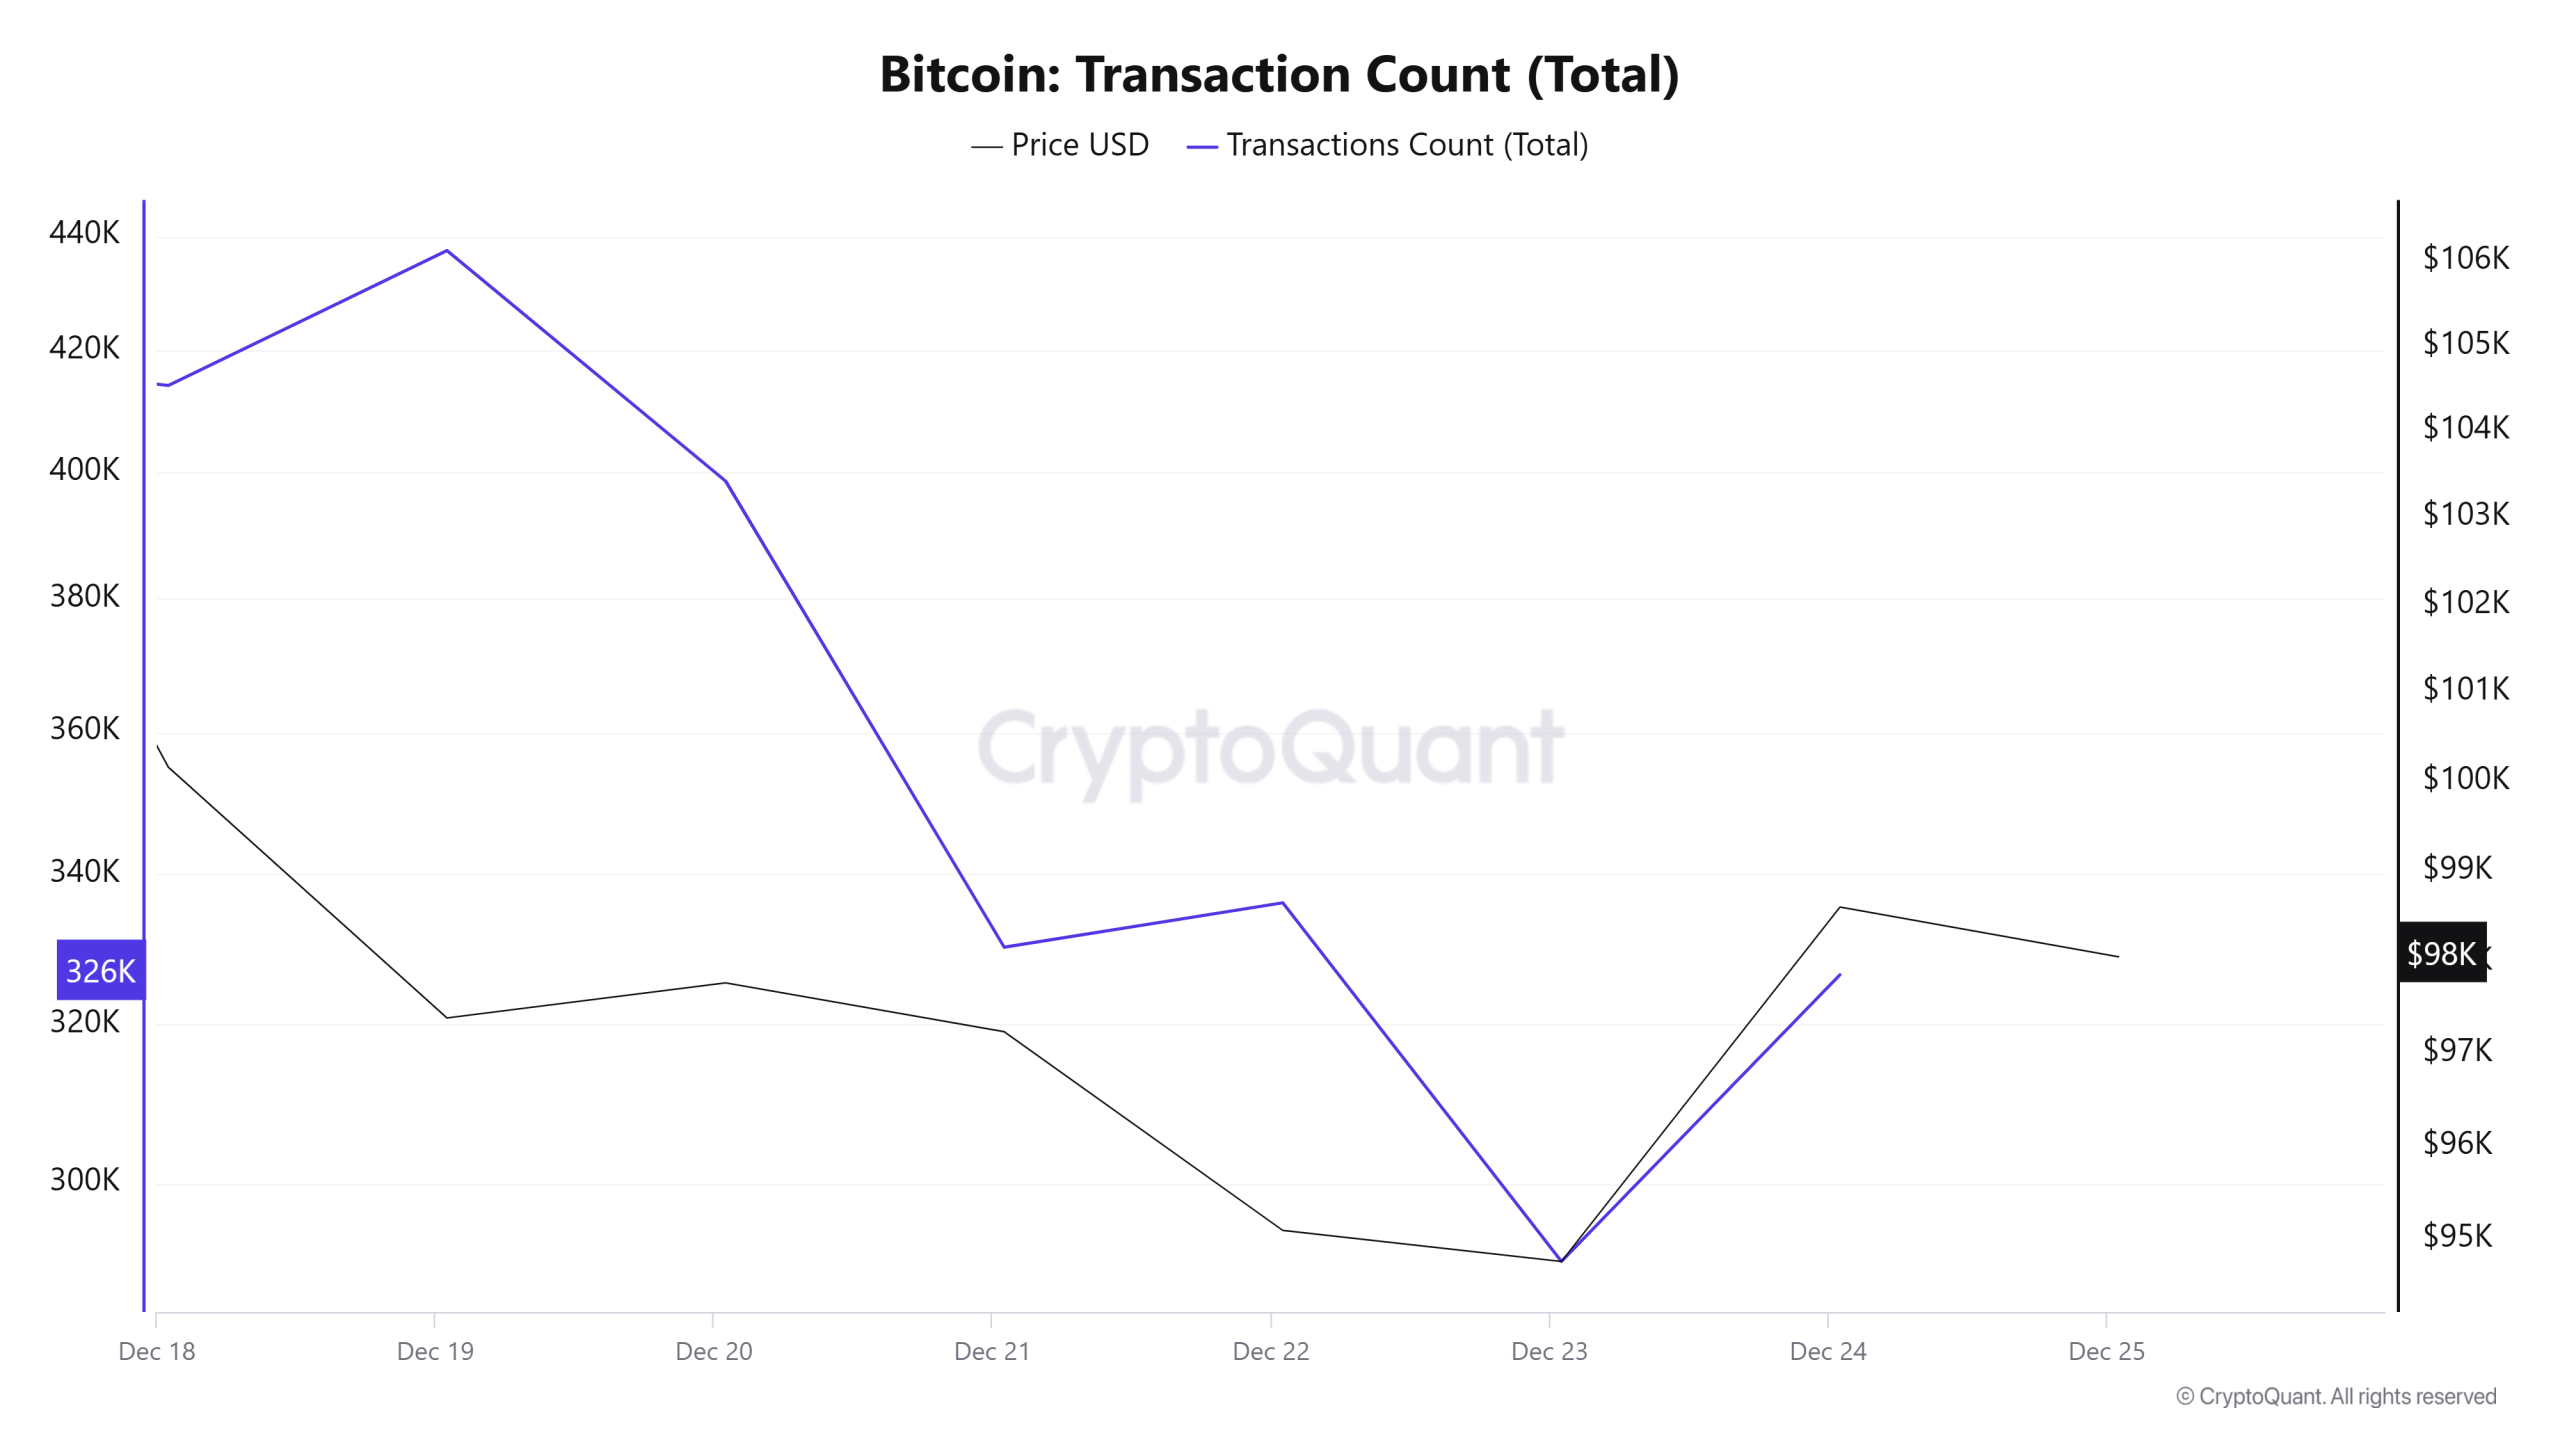
When Bitcoin transfers made between December 18-24 are analyzed, a general decrease is observed in Bitcoin price and the number of transfers on the network. On December 19, the number of daily transfers was recorded as 440 thousand, while on December 23, the number of daily transfers decreased to around 290 thousand due to factors such as the decrease in the volume of transactions on the network on weekends, the approach of the end of the year and the effect of the Christmas holiday.
Looking at the number of transfers as well as the amount of Bitcoins transferred per day, it was observed that only on December 21-22, i.e. the weekend, there was a decrease in the amount of Bitcoins transferred. On other days, although the number of transfers decreased, the number of Bitcoins transferred increased. This data suggests that although the number of transfers decreased, the amount of Bitcoins transferred increased and that transactions involving large amounts of Bitcoin were more intense than in previous weeks, especially in transfers made this week
Tokens Transferred Mean
Between December 18 and 24, the average amount of Bitcoin transferred over the weekend ranged between 1.36 and 1.09, while on weekdays it ranged between 2.01 and 3.26. The rise in the average on weekdays and the fall over the weekend can be attributed to the large volume of transactions from institutional investors.
Whale Activities
CryptoQuant shared data revealing a major movement of a long-running BTC whale. More than 72,000 BTC were transferred. This raised speculation that it could signal a market top. Historically, such large moves by early movers often precede critical price shifts as their actions affect market sentiment and liquidity. At the same time, this is a move that came at the time of the Fed’s rate cut, which could be decisive for BTC’s short-term trajectory in the coming days. Alternatively, these moves could indicate that whales are rebalancing their portfolios and preparing to pour capital into altcoins as they expect the market to shift towards altcoin rallies, also known as all-season. Whales, or large market players with significant holdings, can often manipulate the market to trigger panic among traders.
Whale Activities Data
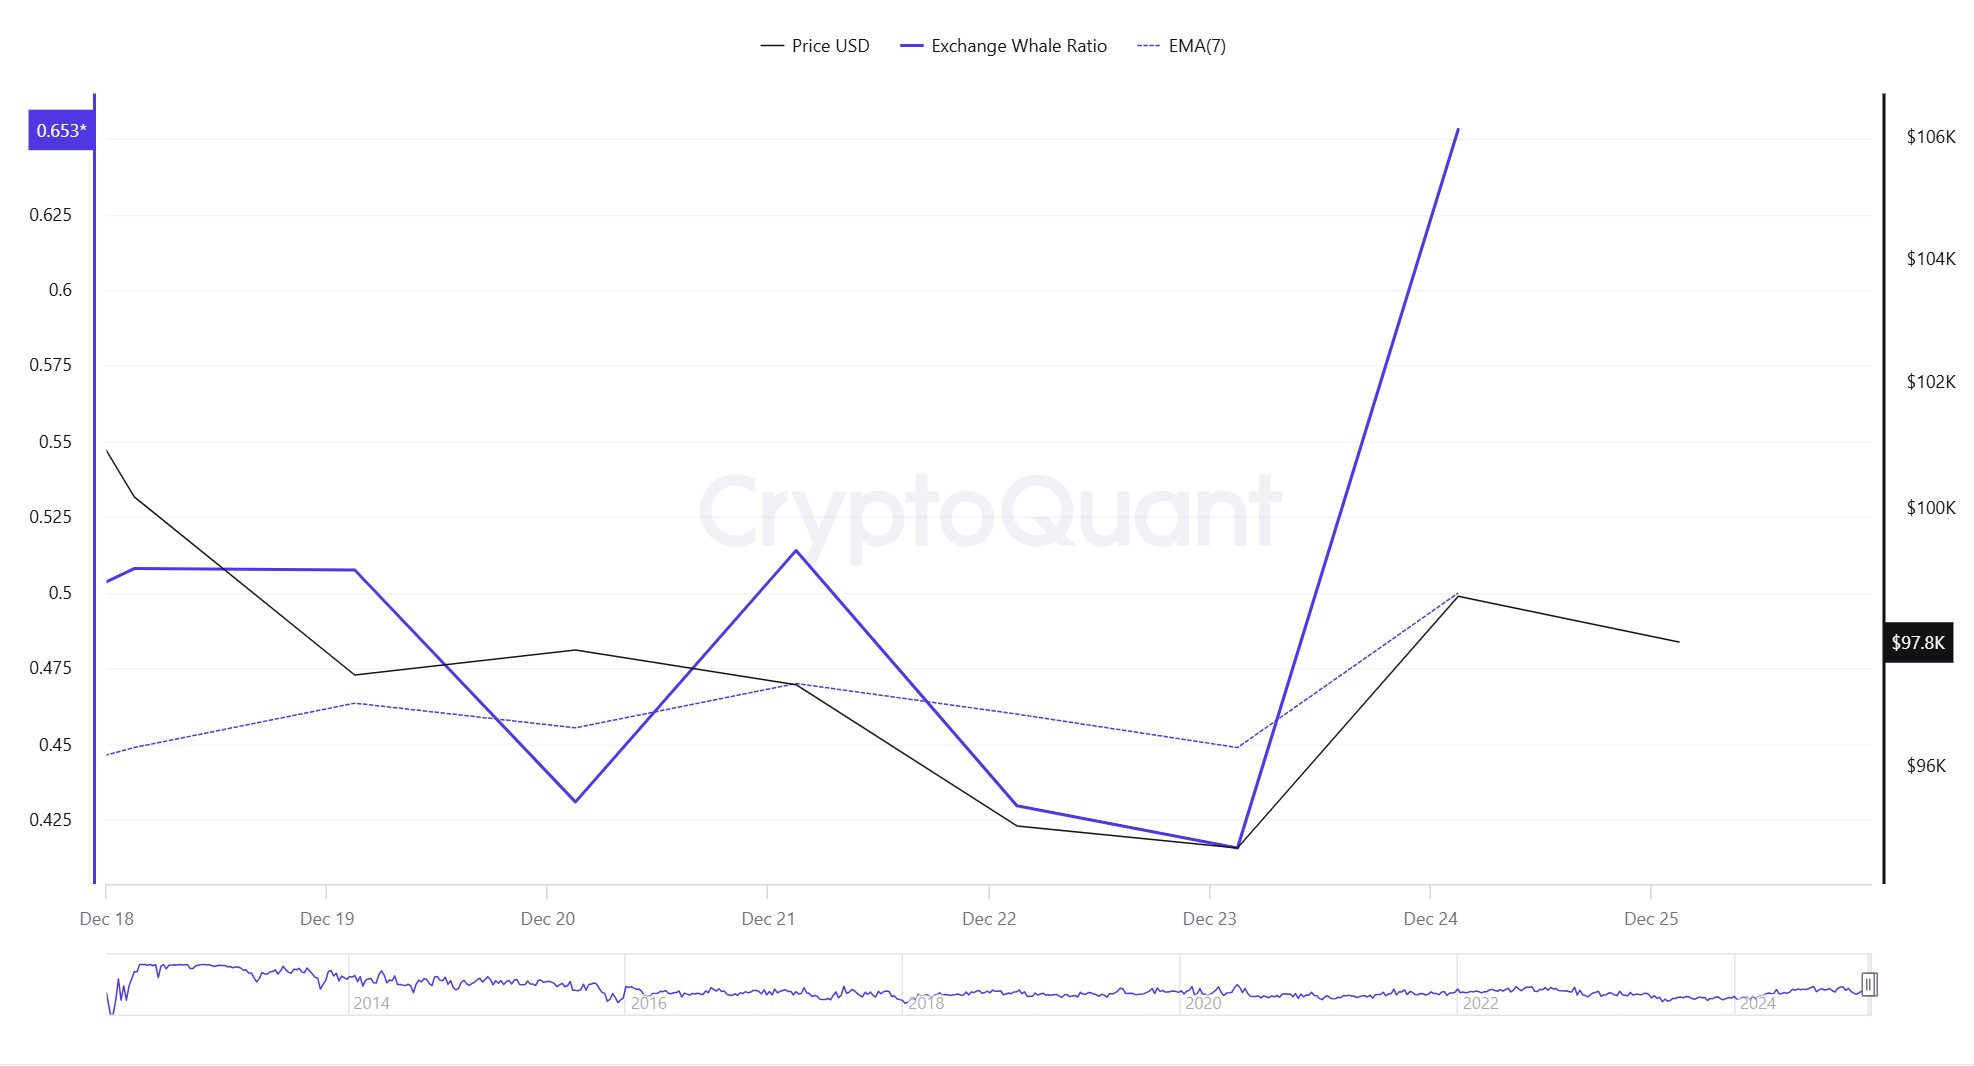
When we look at one-week whale movements, it shows that central exchanges are used by whales in an excessive way. When we look at this ratio, it is seen at a rate of 0.653. When this ratio is above 0.350, it usually means that whales often use central exchanges. Although this means that there may be selling pressure at any time, it is seen that centralized exchanges are used more for BTC purchases this week. At the same time, when we look at the total BTC transfer, it has increased compared to last week and it is seen that 5,196,040 BTC has moved.
LEGAL NOTICE
The investment information, comments and recommendations contained in this document do not constitute investment advisory services. Investment advisory services are provided by authorized institutions on a personal basis, taking into account the risk and return preferences of individuals. The comments and recommendations contained in this document are of a general type. These recommendations may not be suitable for your financial situation and risk and return preferences. Therefore, making an investment decision based solely on the information contained in this document may not result in results that are in line with your expectations.
NOTE: All data used in Bitcoin onchain analysis is based on Cryptoqaunt.


