
Breakdowns
MVRV
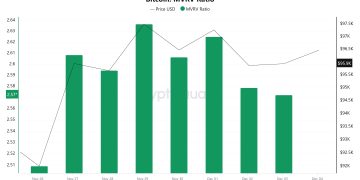
On November 26, the Bitcoin price was at 92,001 and the MVRV Ratio was 2.50. On November 27, the price rose to 95,940 and the MVRV Ratio was 2.60. As of December 2, the price decreased to 95,862 while the MVRV Ratio dropped to 2.57. During this period, the Bitcoin price increased by 4.19% and the MVRV Ratio by 2.8%.
Price appreciation outpacing the MVRV may indicate that the market is generally appreciating but the majority of investors have not yet reached profit maximization levels. This may indicate that the market has not yet reached a saturation point and that confidence in price appreciation is limiting selling pressure. However, the fact that the price action is faster than the MVRV ratio may suggest that volatility may increase in the short term.
Realized Price
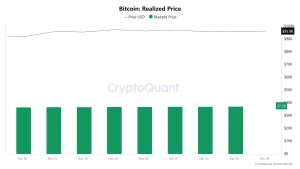
On November 26, when the Bitcoin price was at 92,000, the Realized Price was 36,664. On December 2, the price rose to 95,862 while the Realized Price reached 37,175. The 4.19% increase in price and 1.39% increase in Realized Price suggests that the price action may be driven by new demand and that existing investors are holding their positions. While this may indicate that the upward trend may continue in the short term, the increase in Realized Price may indicate that a healthy market foundation has been established in the long term. However, an increase in the difference between price and Realized Price may bring the risk of profit realization pressure.
Spent Output Profit Ratio (SOPR)
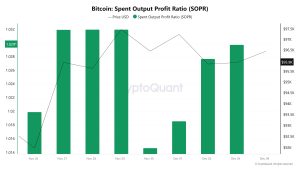
Between November 26 and December 2, the Bitcoin price increased by 4.19% to 95,862, while the SOPR metric increased by 0.78% from 1,019 to 1,027. This may suggest that profit-taking continues in the market and the overall market sentiment is positive.
Derivatives
Open Interest
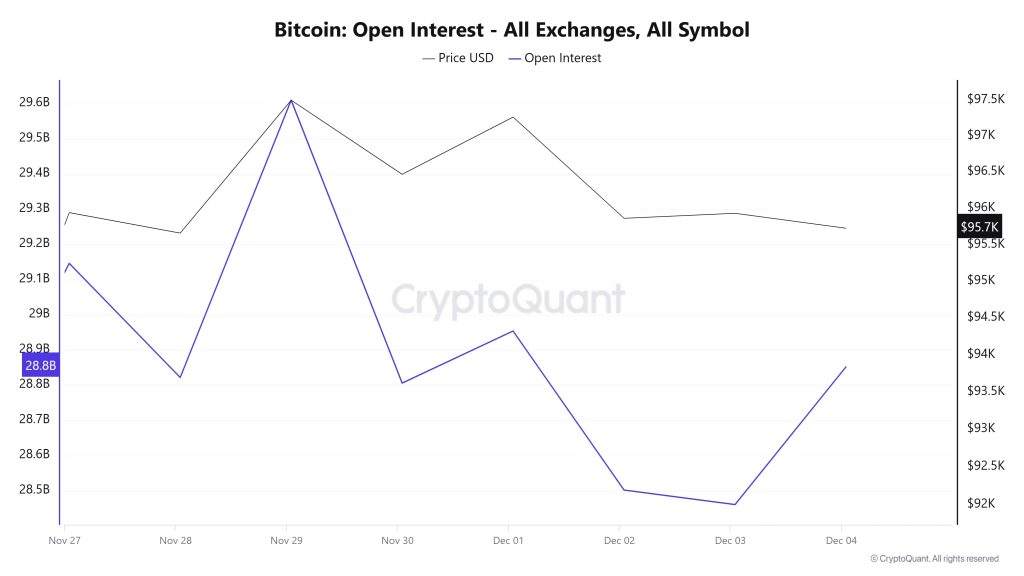
Open interest for Bitcoin, which moved horizontally between 93,000 and 98,500 levels in the last week, entered a downtrend and fell to 28,378 levels. With the Korean crisis yesterday, it is seen that open interest increased in the rising market and the downtrend was broken. However, it is seen that the volume data does not meet the increase in price and open interest. This situation, which can be considered as a daily negative, may bring a new ATH level for BTC in the week with the fall in open interest and the rise after the re-test.
Funding Rate
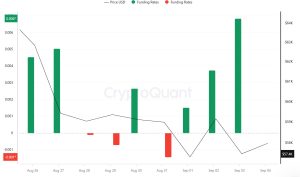
In this period when the funding rate is in the positive area between 0.0150 – 0.0310, it can be said that the upward price movement may continue as the price accelerates upwards and buyers start to dominate on the CVD spot side. Especially after yesterday’s decline, the funding rate rose above 0.03 and then recovered rapidly, indicating that the interest in BTC is quite strong. Although a prolonged positive funding rate indicates that the market is dominated by buy positions and that retail investors in particular are showing a lot of interest in the market and buying is becoming increasingly risky, it should be noted that an extremely positive funding rate usually brings the risk of a correction. This can lead to liquidation of long positions, which can cause a rapid decline.
Long & Short Liquidations
If we examine the Liquidations Map; The 96,000 – 99,000 band stands out as the region with the highest liquidation accumulation in the market. These levels can be considered as areas where price movements tend to attract liquidity. On the lower side, around $ 93,000 stands out as a strong support point. Each time the price fell to this level, it reacted upwards after clearing liquidity.
There are periods when the price made sharp and sudden moves to clear liquidated positions. In particular, on December 2, the price fell as low as
93,000, gathered liquidity, and then recovered. There are certain periods when the price moves in a narrow range and gathers liquidity (for example, November 30 and December 3). If the price manages to stay above 96,000, this level may strengthen as an area of support and provide a continuation of upward movement. However, a break below it increases the likelihood of a pullback towards the 93,000 area. If the price clears liquidity above 99,000, the upside momentum can be expected to accelerate. These levels may create a liquidation area that forces short positions in the market.
| Date | Long Amounts (M $) | Short Amounts (M $) |
|---|---|---|
| November 28 | 6.07 | 6 |
| November 29 | 10.78 | 17.65 |
| November 30 | 4.12 | 3.93 |
| December 01 | 7.04 | 8.5 |
| December 02 | 14.18 | 9.86 |
| December 03 | 15.15 | 7.99 |
| Total | 57.34 | 53.93 |
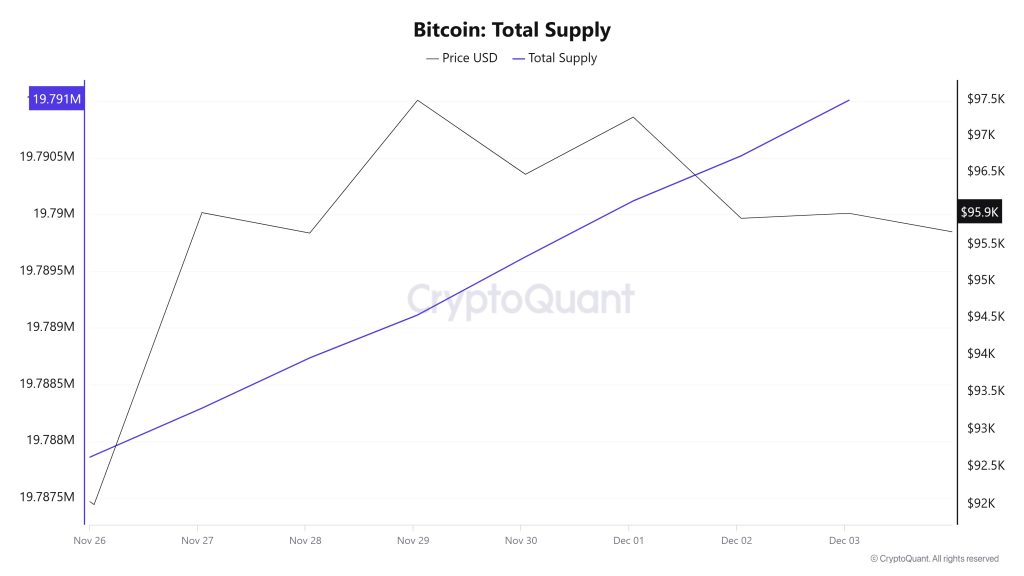
Supply Distribution
| Wallet | 26.11.2024 | 02.12.2024 | Change | Analysis |
|---|---|---|---|---|
| < 0.1 BTC | 1.619% | 1.617% | -0.002% | There was a slight decrease among the smallest investors. |
| 0.1 – 1 BTC | 5.464% | 5.455% | -0.009% | Small investors showed a very small decrease in this range as well. |
| 1 – 100 BTC | 32.365% | 32.353% | -0.012% | There was a small decline in the share of mid-level wallet holders. |
| 100 – 1k BTC | 21.557% | 21.779% | 0.222% | The increase in holders of large wallets is much higher than in other groups. |
| 1k – 100k BTC | 35.720% | 35.521% | -0.199% | A slight decrease among whales may signal profit realization. |
| > 100k BTC | 3.275% | 3.274% | -0.001% | The proportion of large whales has barely changed. |
While there were very slight decreases among small investors, large wallet holders preferred to grow their portfolios by continuing their purchases despite the rising Bitcoin price. The slight decreases among whales may be due to the tendency of these wallets to realize profits. When we look at the large whales, there was almost no change, indicating that there was no market-driving movement, and the market confidence index was still strong.
Exchange Reserve
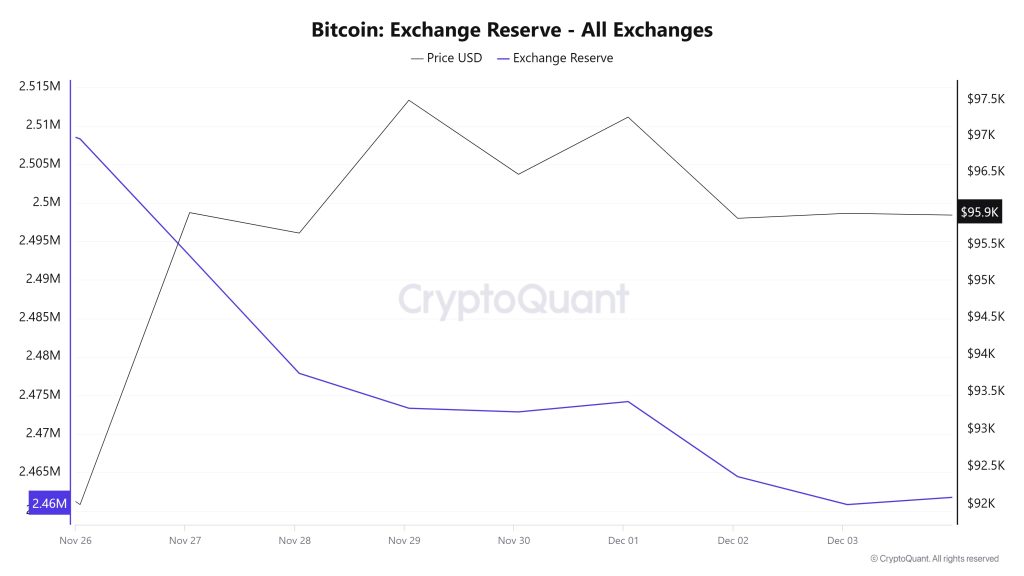
Between November 26 and December 03, 2024, approximately 47,500 Bitcoins exited the exchanges. This also had an impact on the Bitcoin price. Bitcoin, which fell to $ 92,000, rose again to $ 96,000. The decline in the Bitcoin reserve of the exchanges shows that the interest of institutional and individual investors in Bitcoin has increased and investors are attracting Bitcoins to personal or corporate wallets with a longer-term investment approach.
| 27/11/2024 | 28/11/2024 | 29/11/2024 | 30/11/2024 | 01/12/2024 | 02/12/2024 | 03/12/2024 | |
|---|---|---|---|---|---|---|---|
| Exchange Inflow | 48,591.21 | 31,313.81 | 46,333.36 | 20,142.42 | 15,784.35 | 54,453.36 | 56,823.38 |
| Exchange Outflow | 63,752.37 | 46,577.23 | 50,859.13 | 20,617.17 | 14,445.92 | 64,193.93 | 60,451.40 |
| Exchange Netflow | -15,161.16 | -15,263.42 | -4,525.77 | -474.75 | 1,338.42 | -9,740.56 | -3,628.02 |
| Exchange Reserve | 2,493,141.93 | 2,477,878.51 | 2,473,352.74 | 2,472,877.99 | 2,474,216.41 | 2,464,475.85 | 2,460,847.83 |
| BTC Price ($) | 95,940.60 | 95,658.72 | 97,501.06 | 96,469.48 | 97,265.07 | 95,862.15 | 95,931.01 |
The largest net outflows from exchanges have been observed since June 2023. Although investors withdrawing their Bitcoins from exchanges to their wallets causes the supply on exchanges to shrink, this may have an upward effect on the Bitcoin price in the coming period. The increase in Bitcoin price may increase the interest of institutional and individual investors in Bitcoin. This may cause an increase in Bitcoin outflows from exchanges in the future.
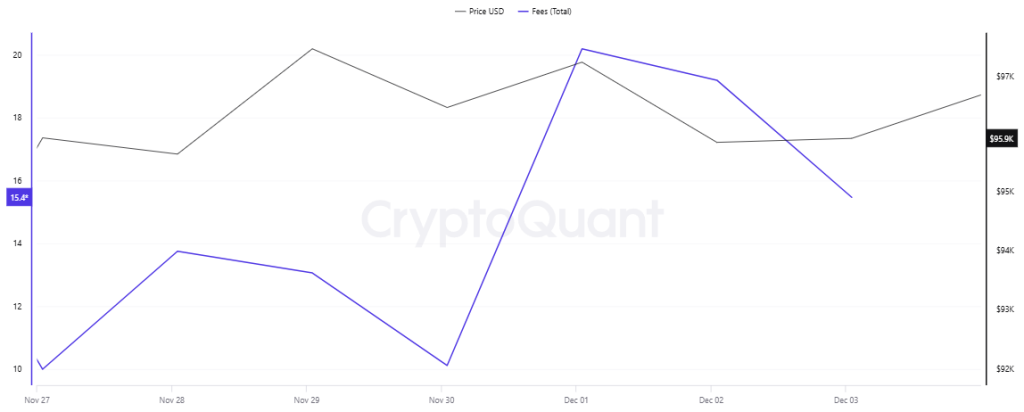
Fees and Revenues
When the Bitcoin Fees per Transaction (Mean) data between November 27 and December 3 is analyzed, it is observed that Fees, which was 0.00003619 on November 27, moved in correlation with the Bitcoin price movement until November 30. On November 30, as prices started to rise again, it increased and reached its peak level of 0.00006157 on December 02. Fees, which retreated after the peak, was last realized at 0.00003521 on December 03.
Bitcoin: Fees (Total)Similarly, Bitcoin: Fees (Total) data between November 27 and December 3, Total Fees, which increased on November 30, peaked at 20.18743206 on December 01. Total Fees, which retreated after the peak, was finally realized at 15.46875251 on December 03.
Miner Flows
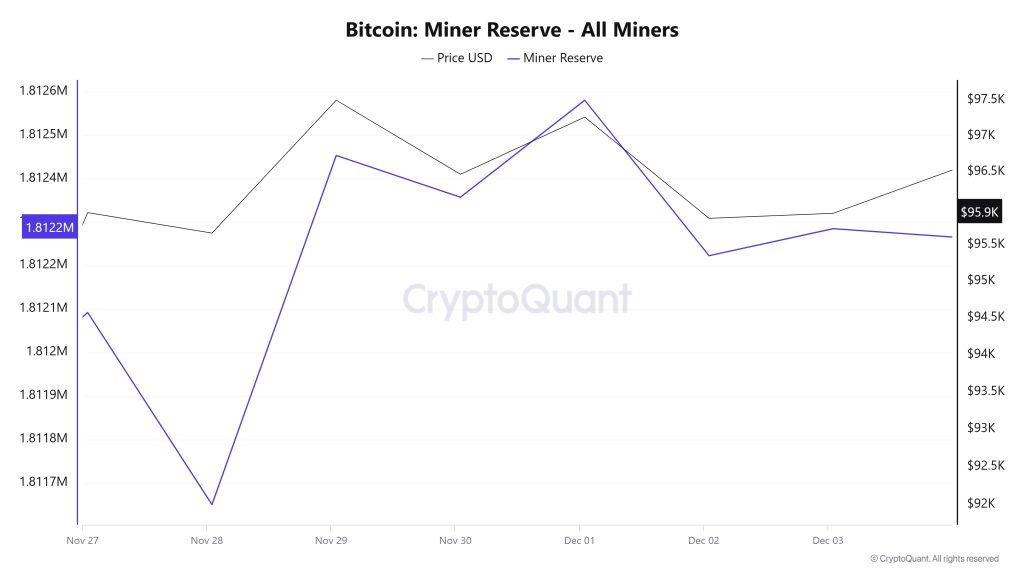
As can be seen in the Miner Reserve table, the number of Bitcoins in miners’ wallets increased at the beginning of the week and then decreased slightly. Miner reserve and Bitcoin price had a positive correlation throughout the week, but the correlation turned negative on the last day.
Miner Inflow, Outflow and NetFlowBetween November 27 and December 3, 54,515 Bitcoins exited miners’ wallets, and 54,957 Bitcoins entered miners’ wallets between the same dates. Miner netflow for this week was 44 Bitcoin. On November 27, the Bitcoin price was $95,940, while on December 3 it was $95,931.
At the beginning of the week, Bitcoin inflow into miner wallets (Miner Inflow) exceeded Bitcoin outflow from miner wallets (Miner Outflow), resulting in a positive net flow (Miner Netflow). However, as December 3 approached, this situation reversed, and Miner Netflow turned negative.
If the positive correlation between miner reserve and Bitcoin price does not continue in the coming week, increased inflows to miner wallets may create selling pressure in the market and possible increases in miner NetFlow may cause the Bitcoin price to fall.
| Nov. 27th | Nov. 28th | Nov. 29th | Nov. 30th | Dec. 1st | Dec. 2nd | Dec. 3rd | |
|---|---|---|---|---|---|---|---|
| Miner Inflow | 7,637.01 | 5,199.98 | 8,040.65 | 6,131.55 | 4,746.16 | 10,405.72 | 12,796.02 |
| Miner Outflow | 7,387.68 | 5,641.82 | 7,237.65 | 6,227.45 | 4,523.07 | 10,763.36 | 12,733.88 |
| Miner NetFlow | 249.33 | -441.84 | 803.00 | -95.91 | 223.10 | -357.64 | 62.15 |
Transaction
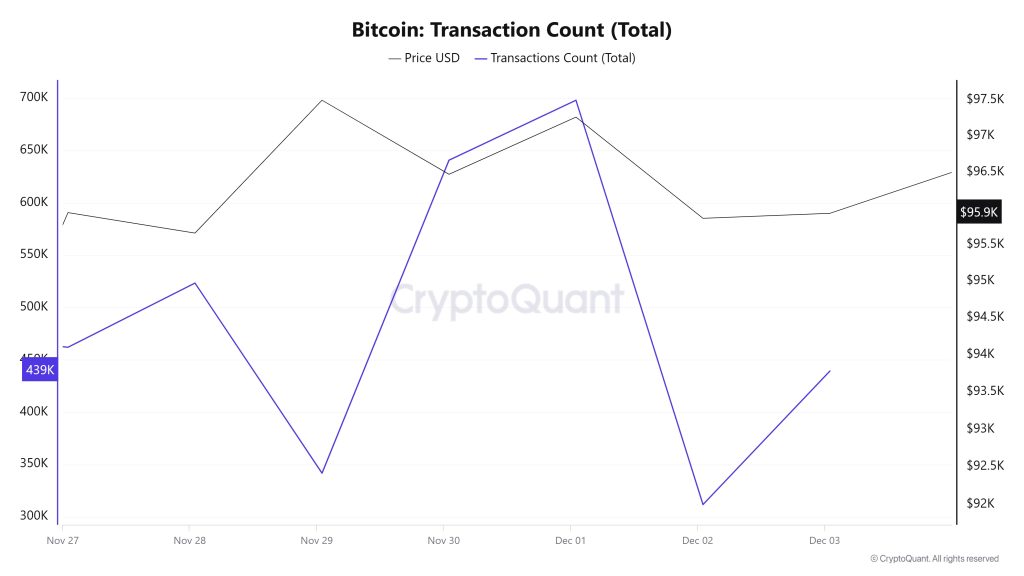
An analysis of Bitcoin transfer data between November 27 and December 3 shows that daily transfers ranged from approximately 311,000 to 698,000. This shows that the daily transaction volume fluctuated significantly, and transaction volatility was high. For example, on some days, the number of Bitcoin transfers was up to double compared to other days.
When the relationship between the number of Bitcoin transactions and Bitcoin price is analysed, it is noteworthy that the negative correlation that started on November 27 turned into a positive correlation as of November 30. This suggests that there is a time-varying relationship between the number of Bitcoin transactions and Bitcoin prices. It can be said that the negative correlation was seen during the declines on November 27, but after November 30, the price increased, and a parallel relationship was established with the number of transactions. Such a shift may indicate that market participants’ interest in Bitcoin is increasing or decreasing in line with price movements.
Whale Activities
Whales are strengthening their positions during the market correction. Wealthy investors once again showed their interest in Bitcoin by buying significant amounts during the recent price drop. On November 29, BTC rebounded by 6.25% from $90,742 to over $96,000. On-chain data shows that whales took advantage of the market correction to accumulate 16,000 BTC, equivalent to about $1.5 billion. Meanwhile, on December 2, an unidentified crypto whale deposited 1,000 Bitcoin (about $97.5 million) on a centralized exchange.
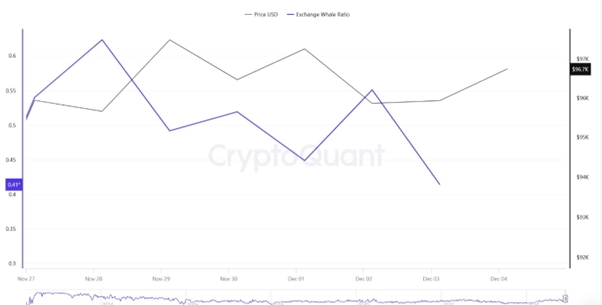
Cryptoquant Data: When we look at the ratio of one-week whale movements on central exchanges, it is seen at a rate of 0.41. When this ratio is above 0.35, it usually means that whales want to dispose of BTC. The ratio of 0.41 means that the BTC price is bearish. At the same time, when we look at the total BTC transfer, it is seen that 4,726,429 BTC has moved in the last 1 week.
LEGAL NOTICE
The investment information, comments and recommendations contained in this document do not constitute investment advisory services. Investment advisory services are provided by authorized institutions on a personal basis, taking into account the risk and return preferences of individuals. The comments and recommendations contained in this document are of a general type. These recommendations may not be suitable for your financial situation and risk and return preferences. Therefore, making an investment decision based solely on the information contained in this document may not result in results that are in line with your expectations.
NOTE: All data used in Bitcoin onchain analysis is based on Cryptoquant.
