
Active Addresses
In terms of the number of active addresses, there were 959,211 active entries to the BTC network between April 9 and April 16, 2025 this week. During this period, Bitcoin rose to $84,581. In the region marked on the chart, where the price and the number of active addresses intersect, we see that Bitcoin purchases have changed direction. When we follow the 7-day simple moving average, it is observed that the price follows an upward trend on the dates when this average cuts the price. This situation indicates that the Bitcoin price is experiencing entries from the $79,000 levels.
Active Sending Addresses
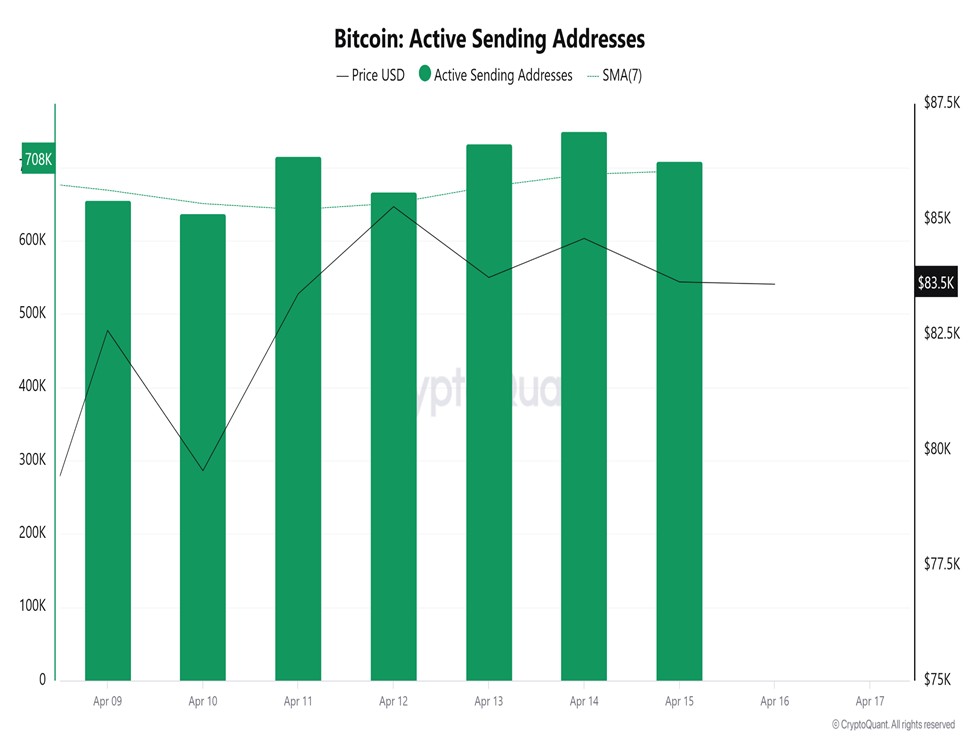
With the Black Line (price line) in active shipping addresses, there has been a significant drop in active shipping addresses after April 9. On the day when the price hit its lowest point, active sending addresses rose as high as 749,416 , indicating that buyers sold their positions as Bitcoin stayed around the $79,000 level for a while. As a result, price drops seem to cause an acceleration in sending addresses.
Active Receiving Addresses
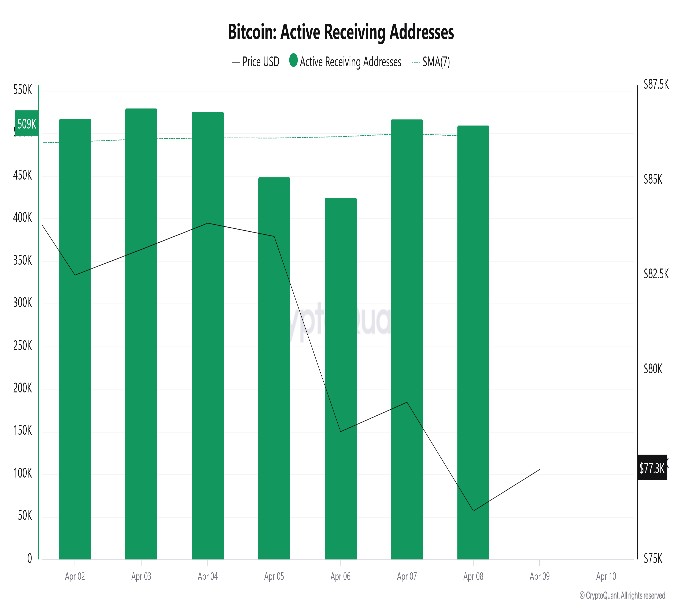
With the Black Line (price line) in active shipping addresses, there has been a significant drop in active shipping addresses after April 11. On the day when the price hit its lowest point, active shipping addresses rose as high as 515,565, indicating that buyers took their positions at Bitcoin’s $83,000 levels.
Breakdowns
MRVR
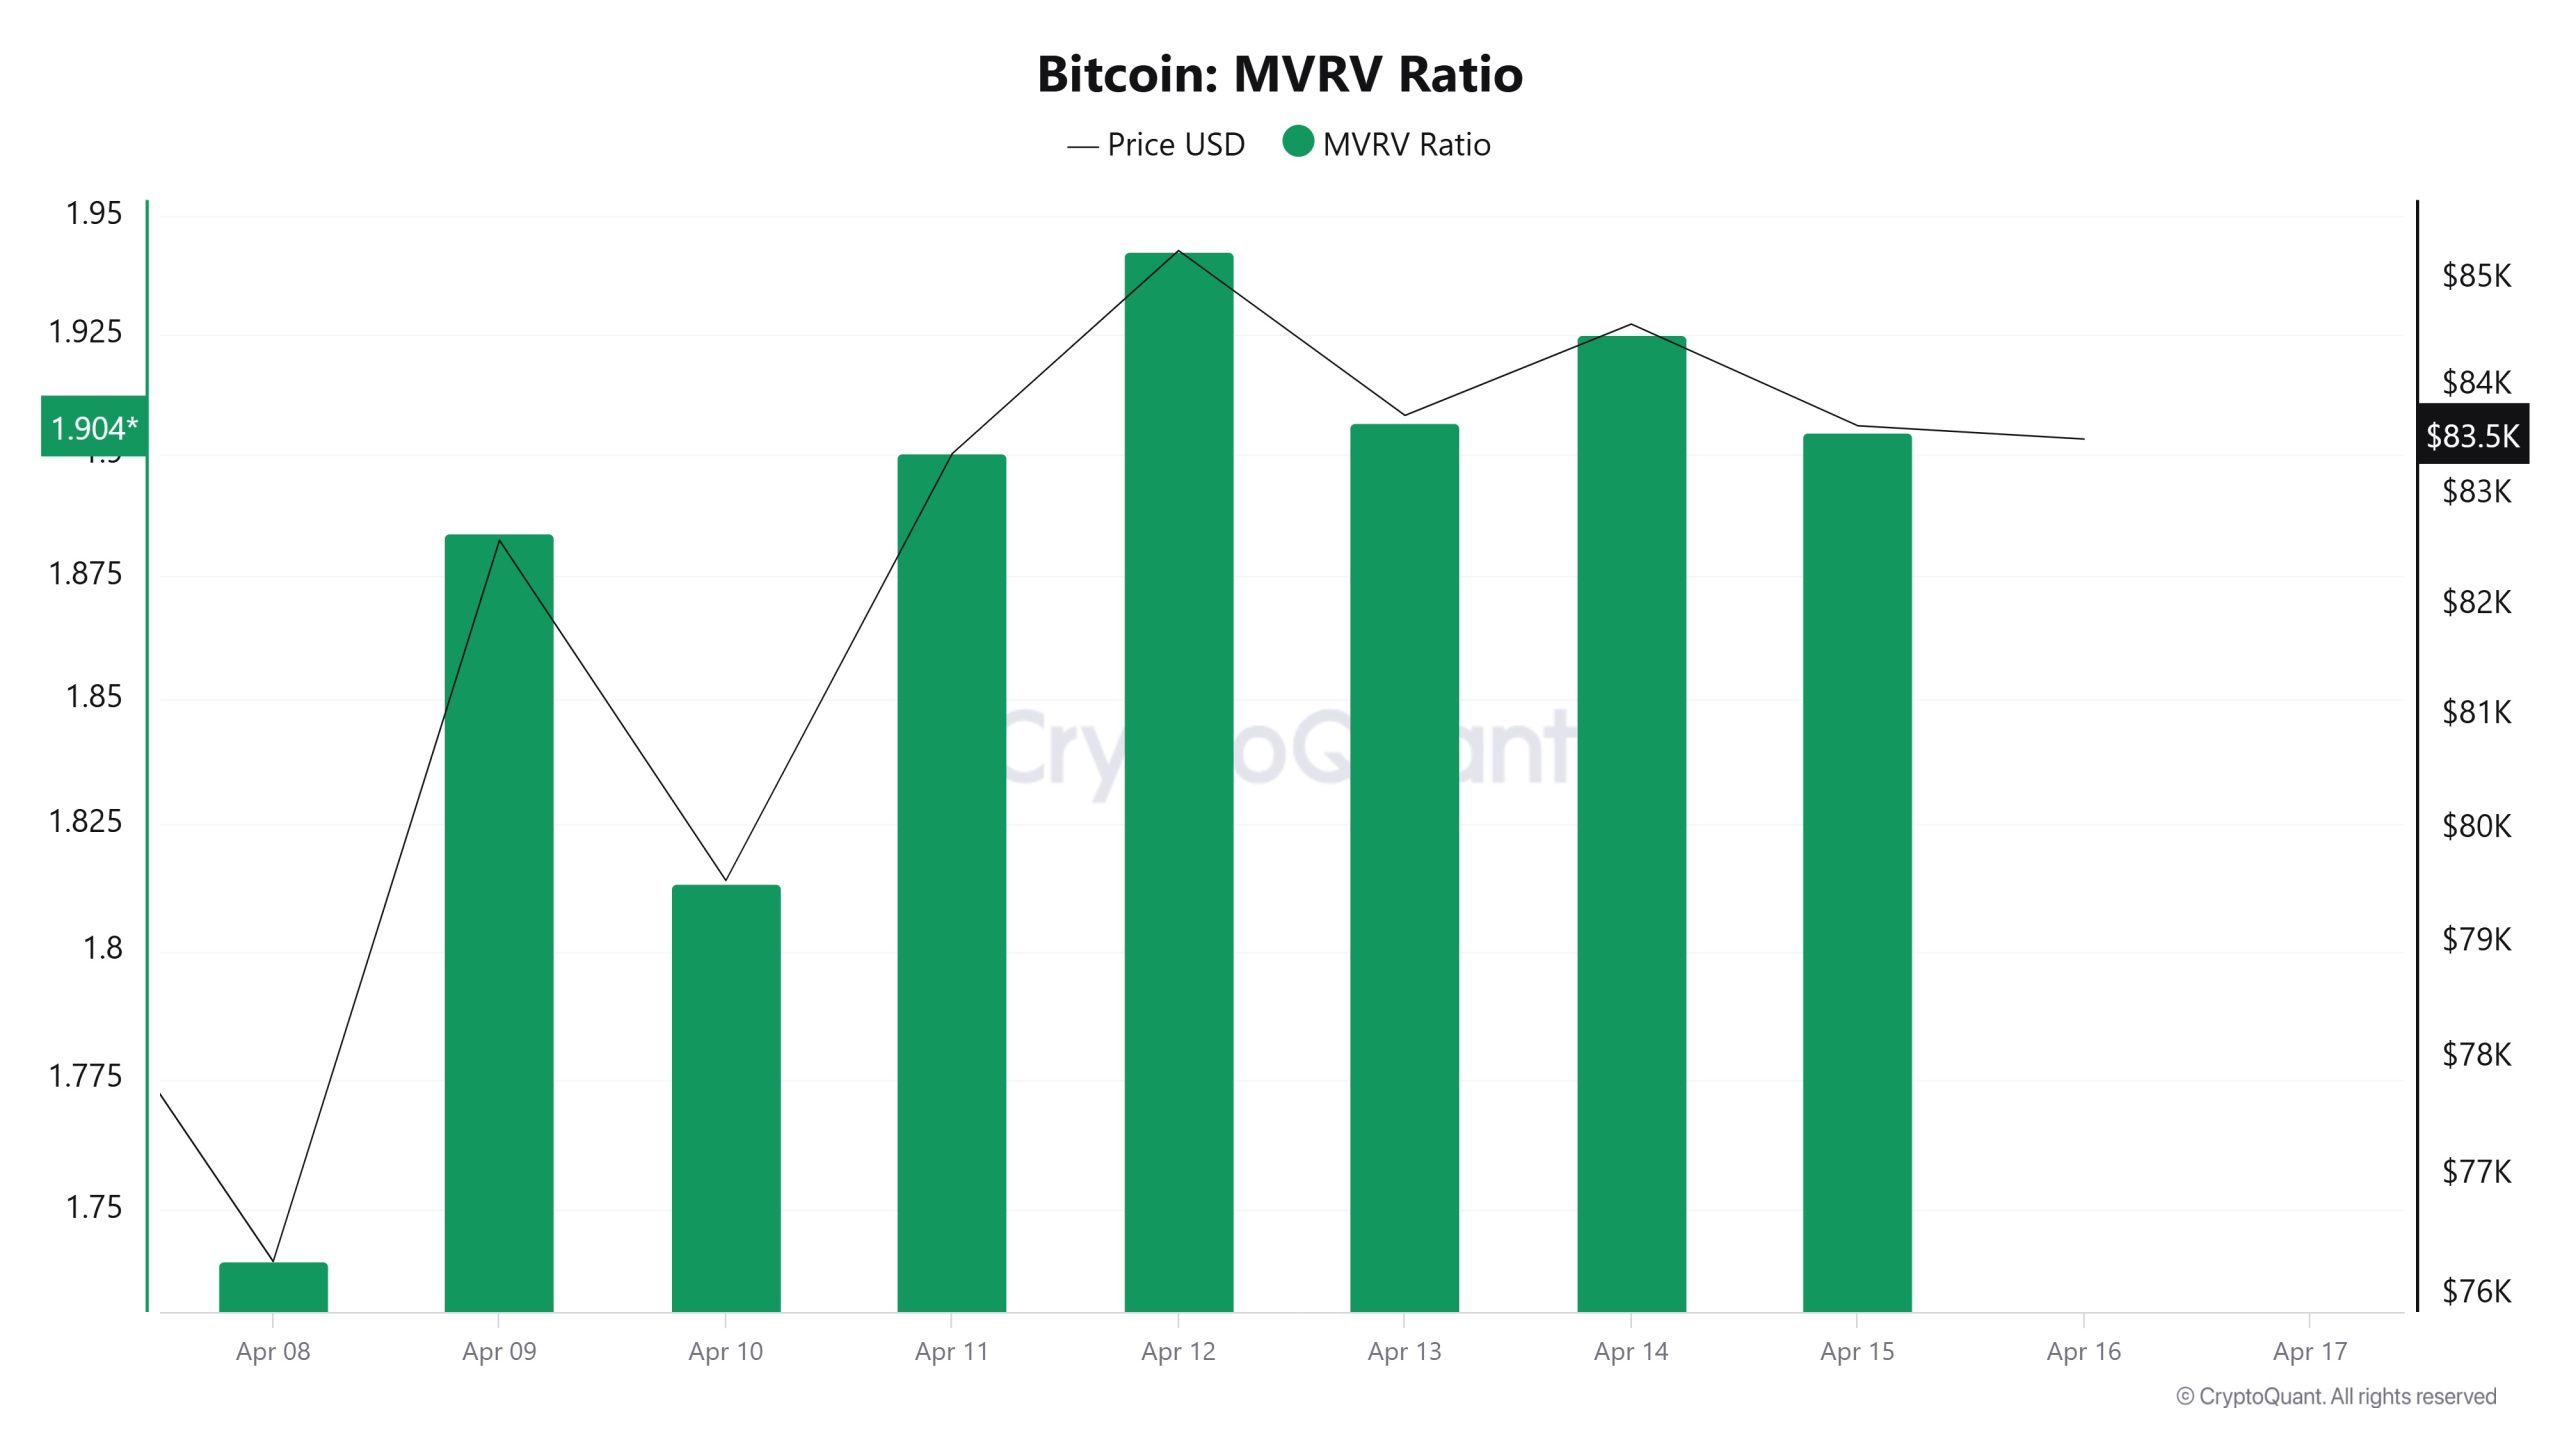
On April 9, the Bitcoin price was 82,589 while the MVRV Ratio was 1.88. As of April 15, the Bitcoin price was at 83,639, while the MVRV Ratio was at 1.90. Compared to last week, there was a 1.27% increase in Bitcoin price and a 1.06% increase in MVRV Ratio.
Realized Price
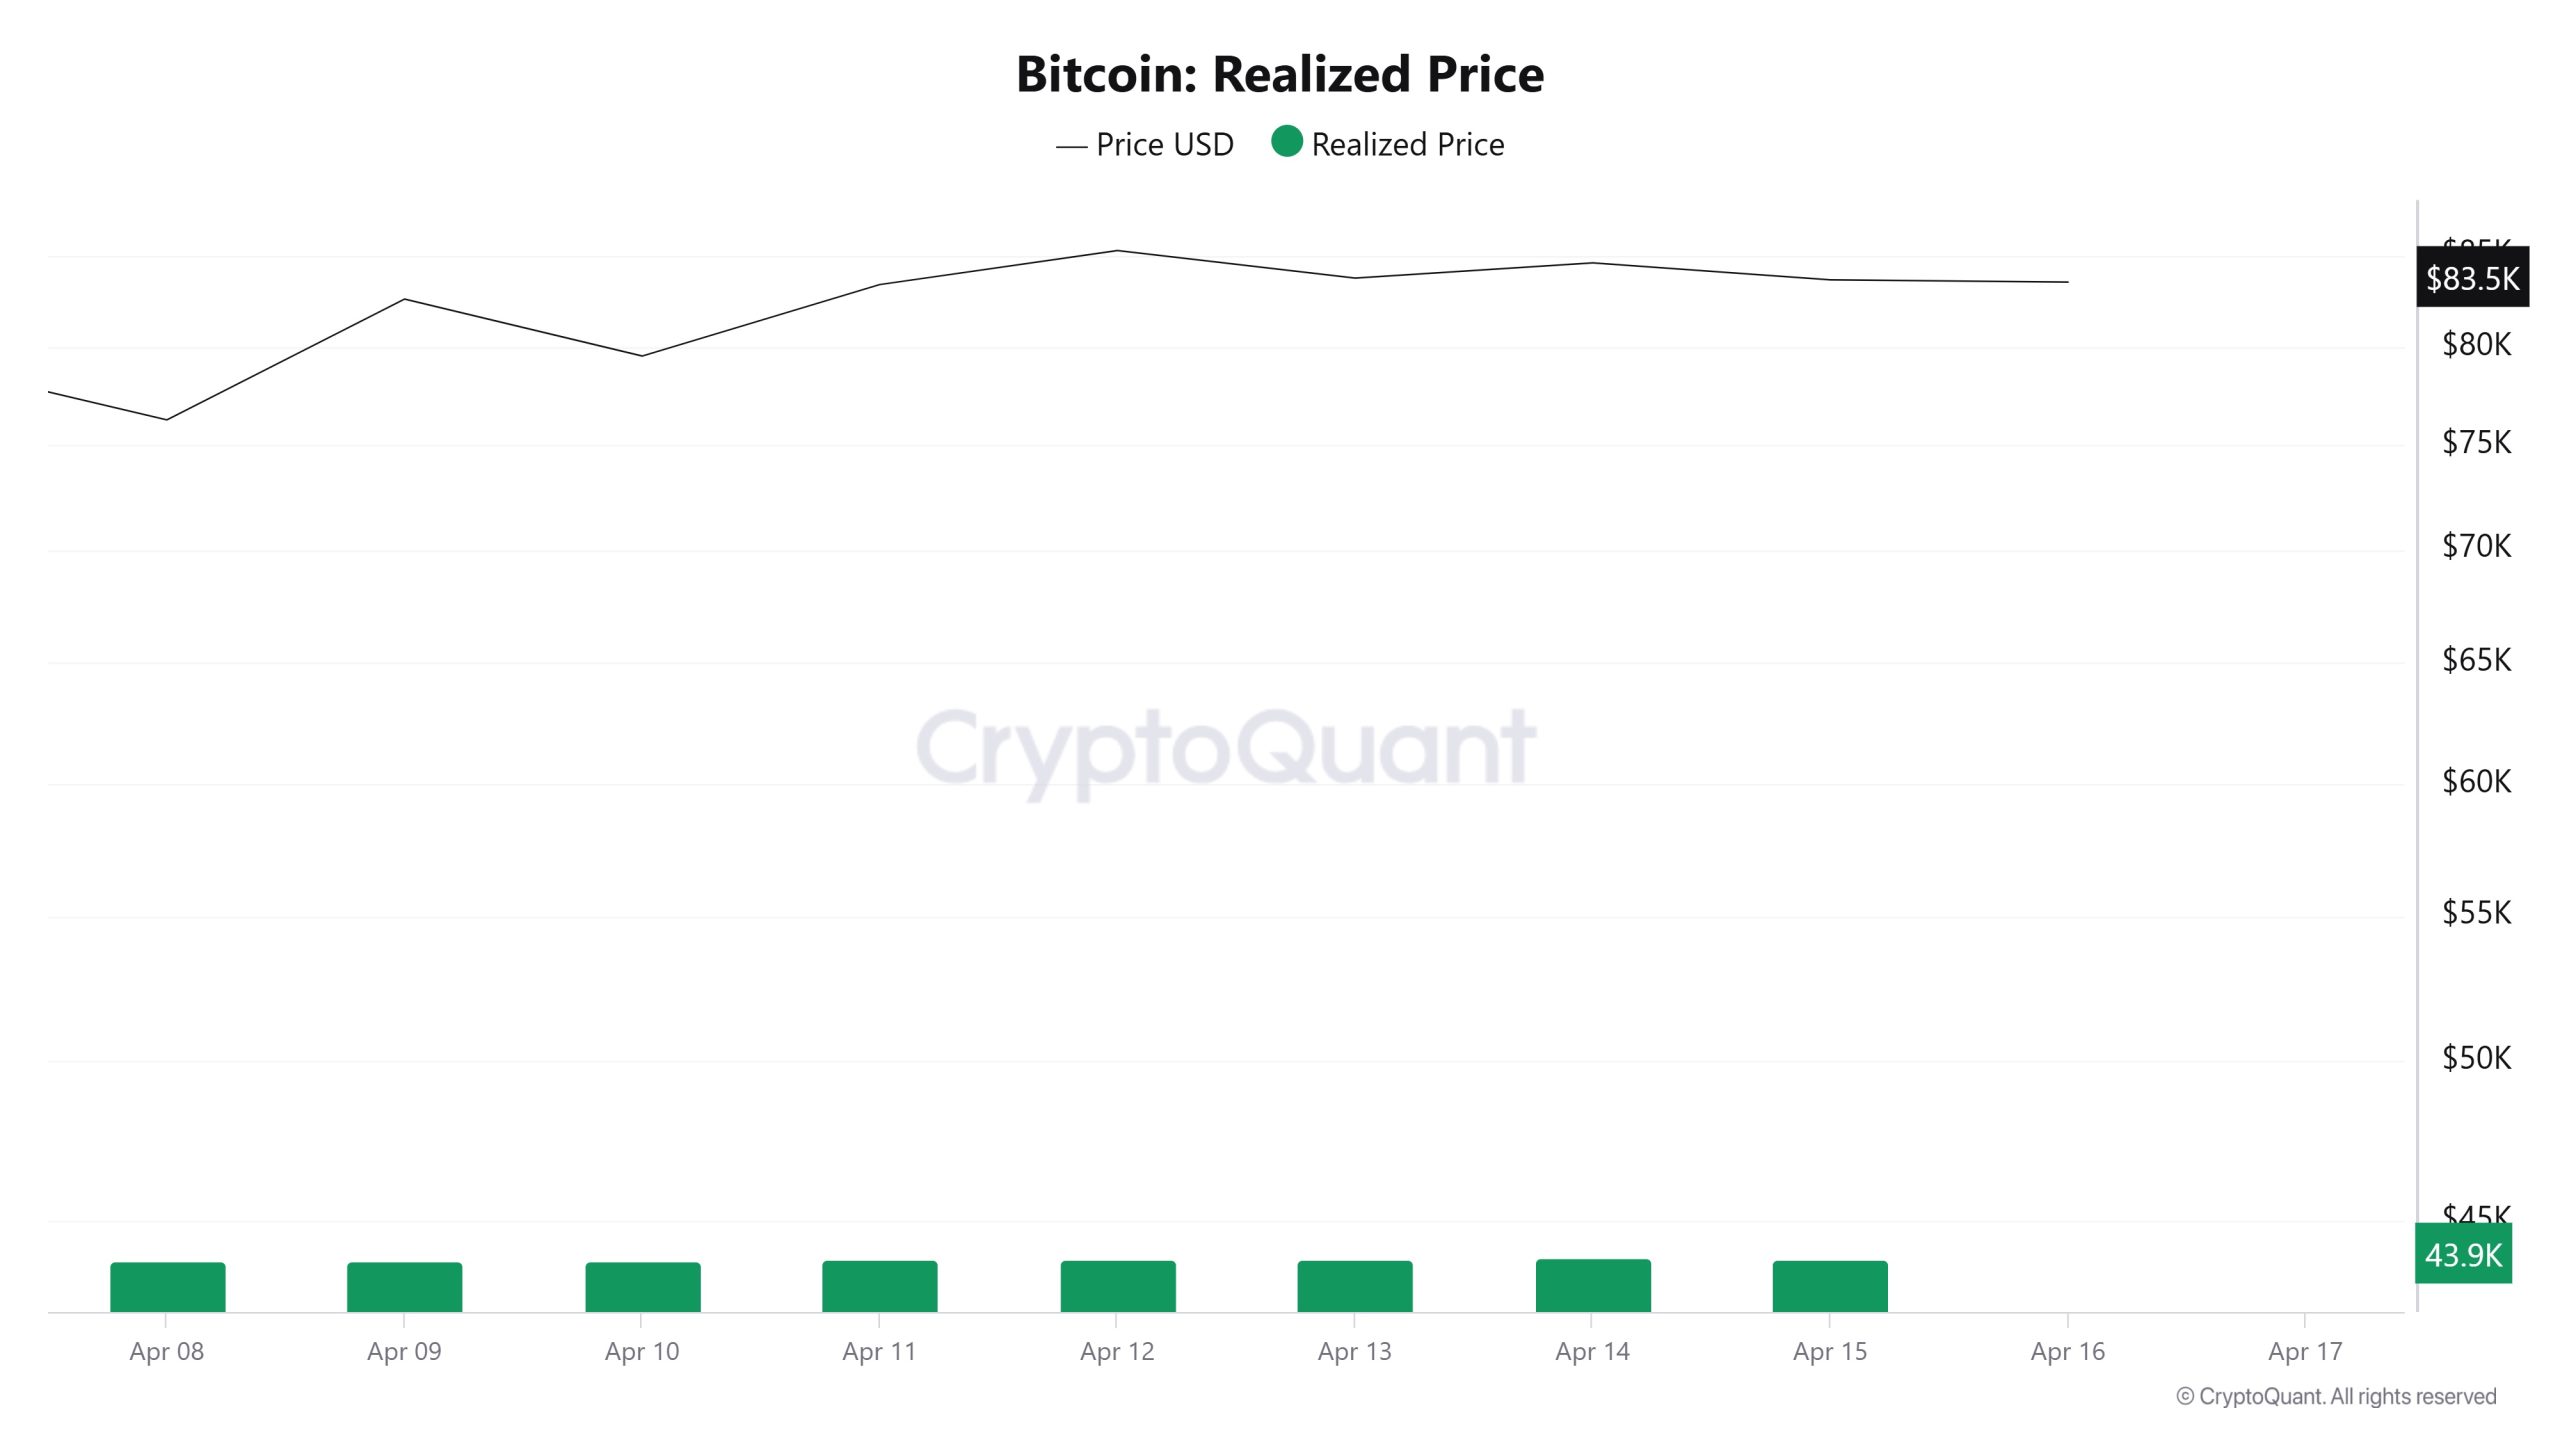
On April 9, Bitcoin price was 82,589 while Realized Price was 43,838. As of April 15th, the Bitcoin price was 83,639 while the Realized Price was 43,910. Compared to last week, there was a 1.27% increase in Bitcoin price and a 0.16% increase in Realized Price.
Spent Output Profit Ratio (SOPR)
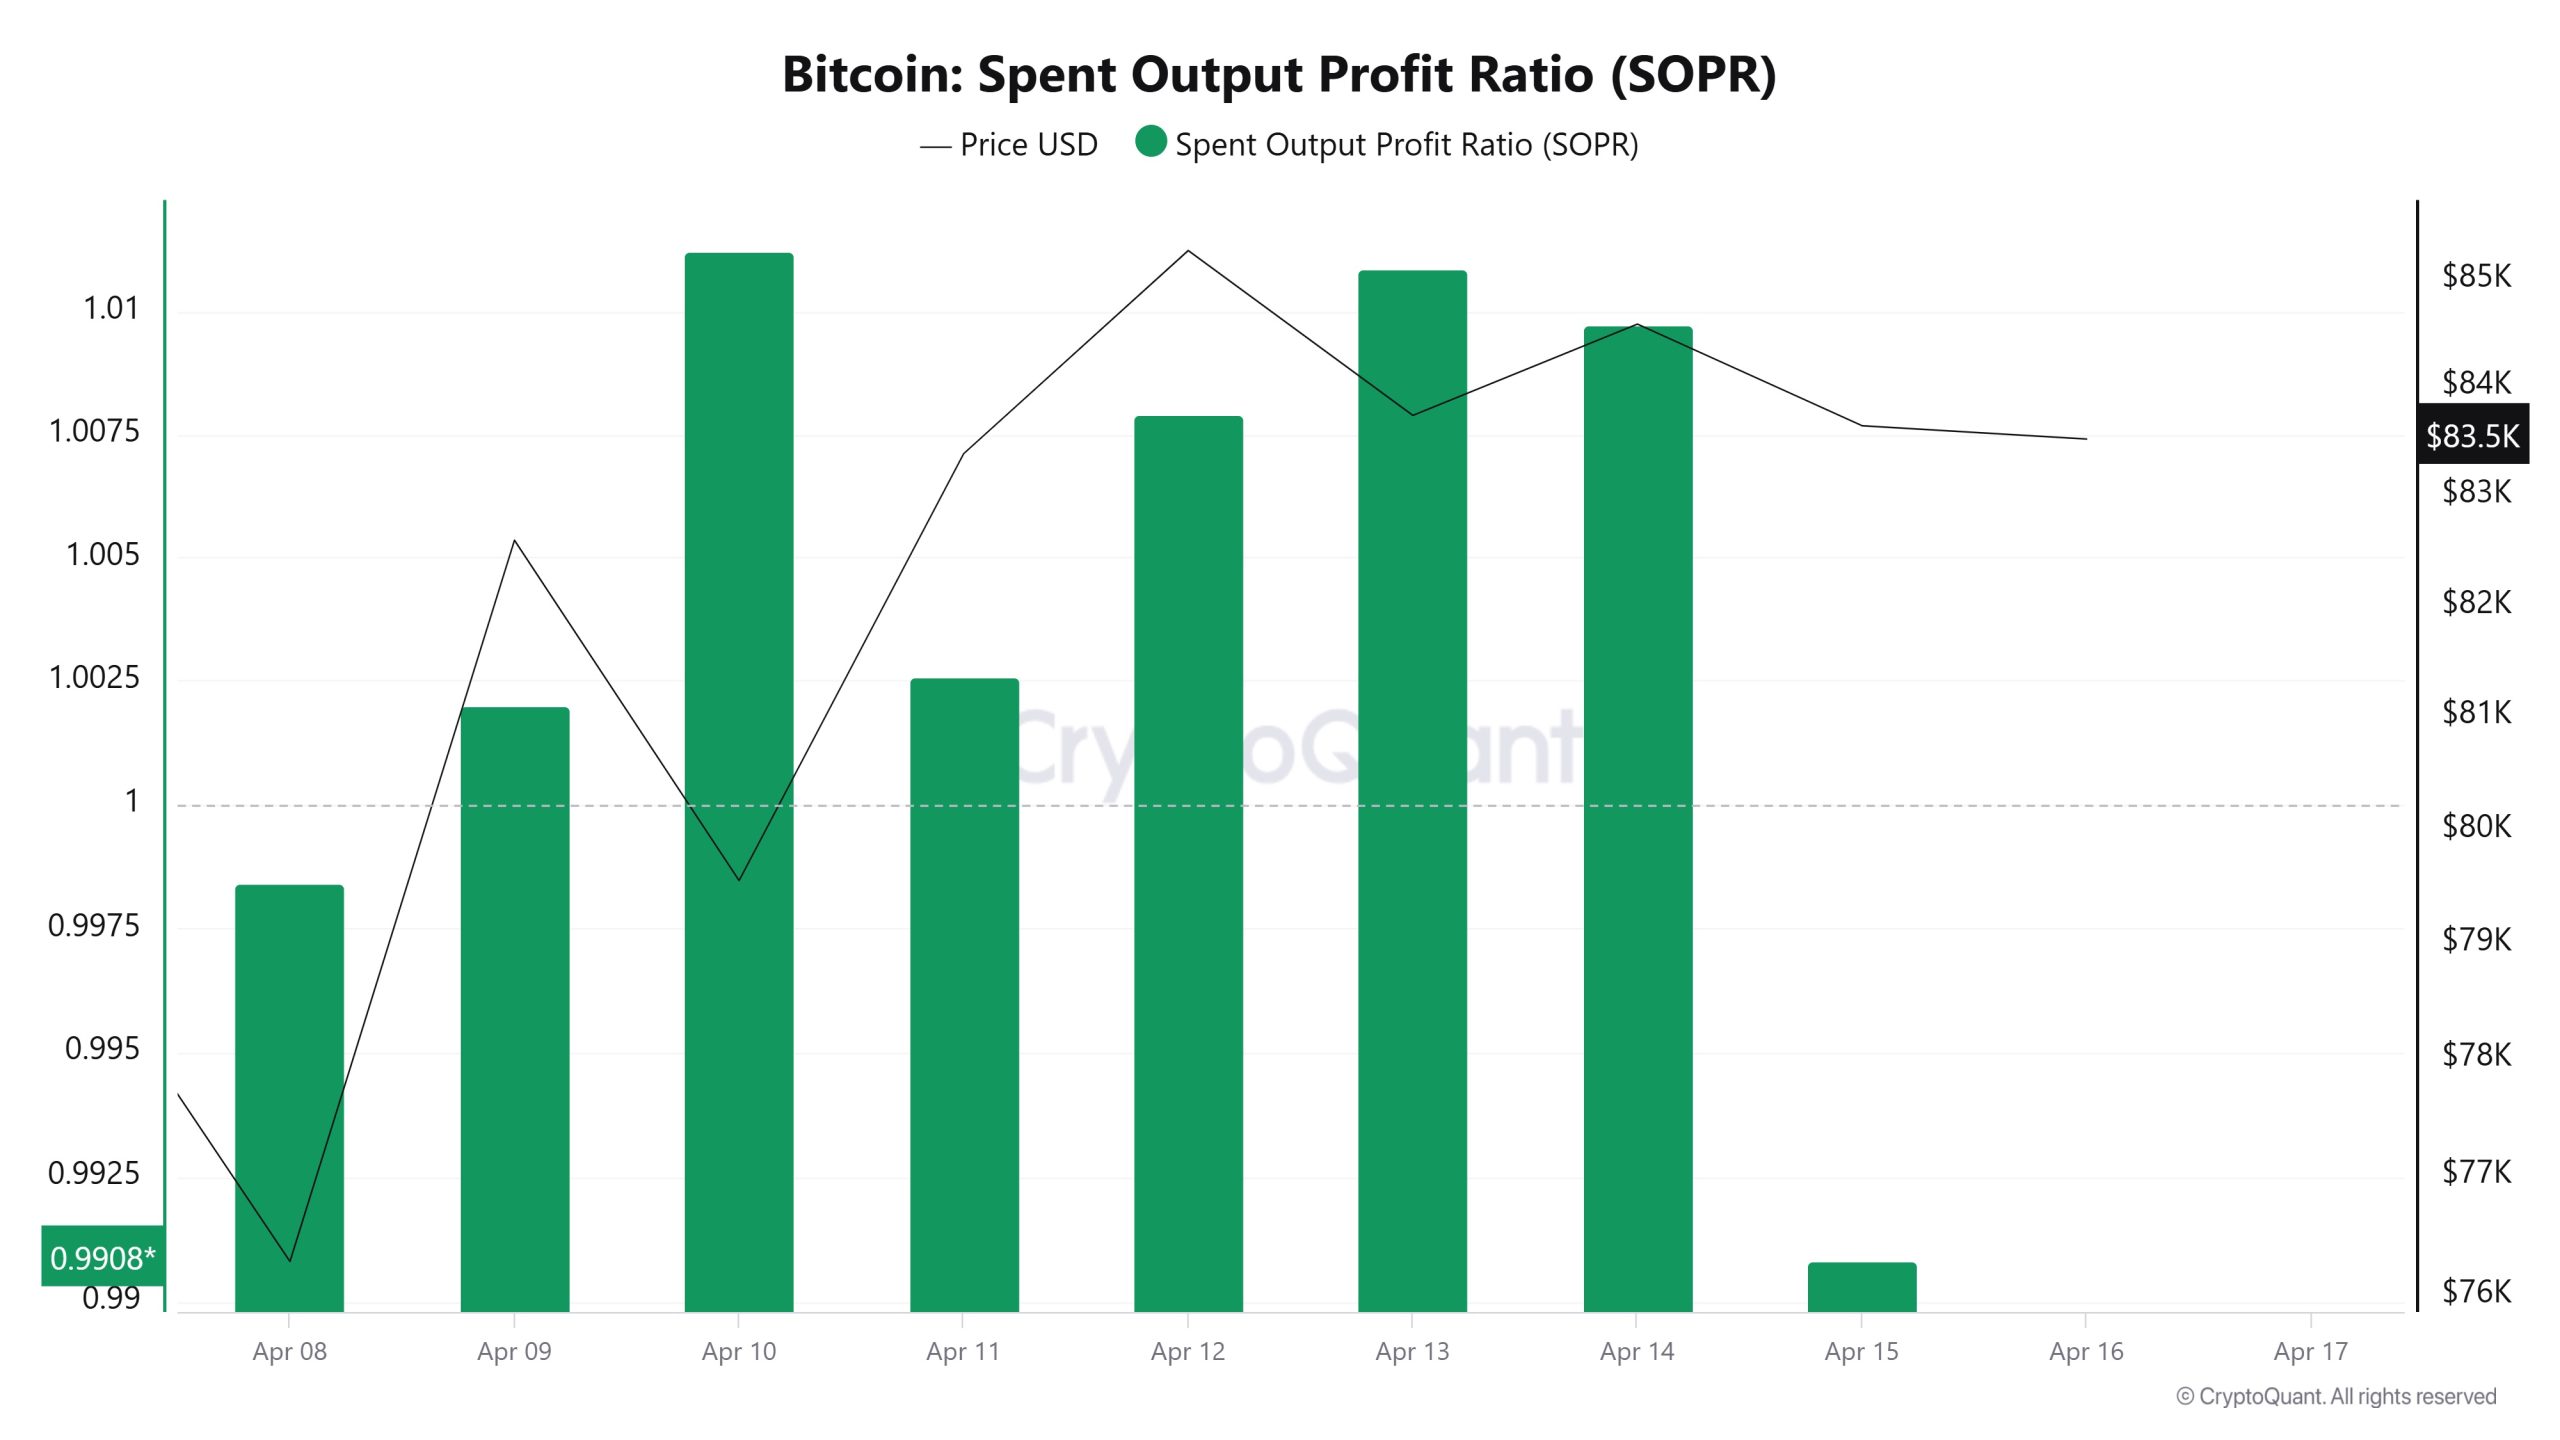
On April 9, the Bitcoin price was at 82,589 while the SOPR metric was 1.001. As of April 15, the Bitcoin price was at 83,639 while the SOPR metric was at 0.990. Compared to last week, the Bitcoin price increased by 1.27% while the SOPR metric decreased by 1.10%.
Derivatives
Open Interest
Open interest, which was around $26 billion at the beginning of the week, fell sharply to $24.5 billion on April 10. At this point, there was a significant liquidation of the market’s leveraged trading volume or traders quickly closed their positions. The BTC price also fell on the same day, suggesting that the closing of long positions was synchronized with the price. Between April 11 and 12, price and open interest rose rapidly together, and this synchronized rise suggests that the market is recovering and long positions are being reopened. However, a remarkable divergence starts after April 12. As the price gradually declines, open interest increases again from $25.9 billion to $26.5 billion. This divergence suggests that position openings continued while the price was declining, suggesting a potential squeeze or high volatility in the market. As a result, this movement in open interest suggests that market participants are taking aggressive positions in the short term. The mismatch between price and open interest suggests caution, especially in leveraged trading. If open interest continues to increase before the direction of the price is clear, it may pave the way for sudden liquidations and sharp movements.
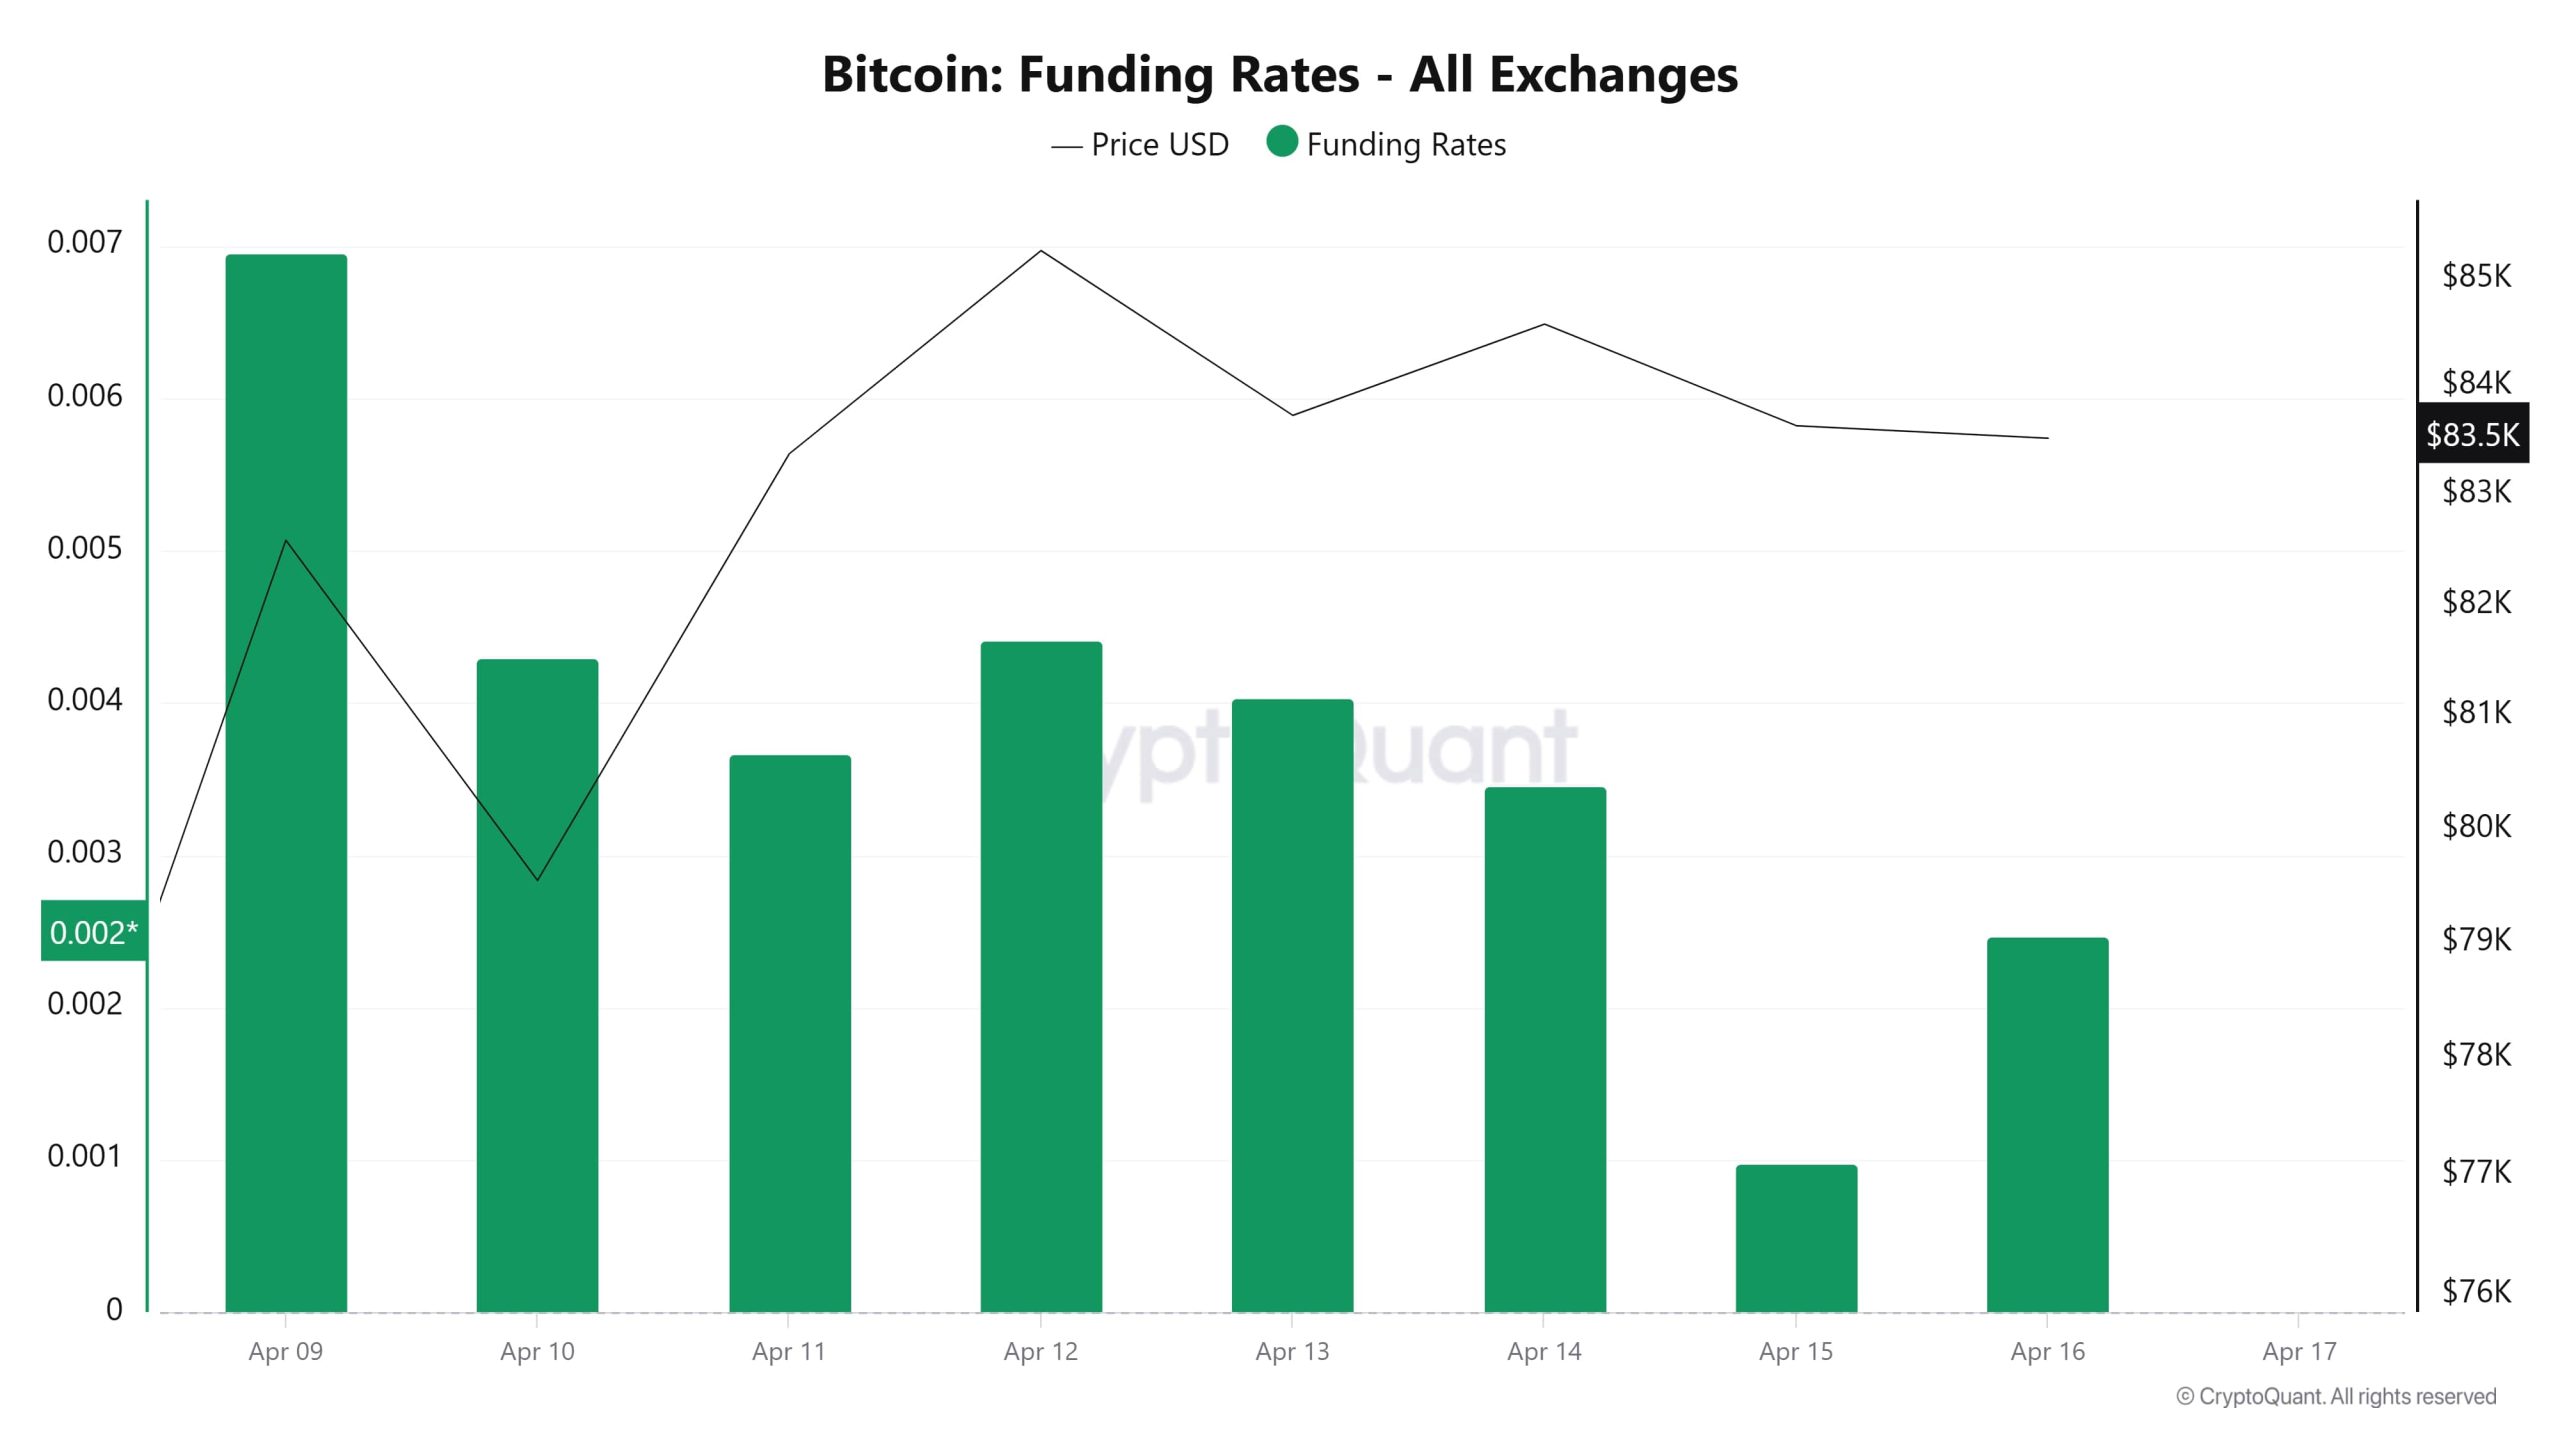
Funding Rate
After a positive start to the week, the funding rate rose to 0.007% on April 9, indicating that long positions dominated the market. Such high funding ratios indicate that leveraged long positions are numerous and the market is moving in anticipation of upside. However, this also brings with it the risk of liquidation of over-accumulated long positions. As of April 10, funding ratios fell sharply. The rate fell as low as 0.004%, indicating that some of the long positions were closed or the market started to neutralize to some extent. Prices also moved downwards during this period. Between April 11-13, although the funding rate returned to positive territory, it was more balanced and flat compared to previous levels. This indicates that although the market started to open long positions again, it was not as aggressive as before. After April 14, a gradual decline in funding rates was observed. Especially on April 15, the rate dropped to around 0.001%, indicating that long positions in the market weakened and short positions started to be opened. This decline also coincided with a period of price pressure. On April 16th, although the funding rate showed a limited recovery, it is still far from the previous high levels. In general, this fluctuating course in funding rates indicates that the market has not formed a clear consensus on the direction, speculative long positions are decreasing and a cautious mood prevails. The decline, especially after the high funding rate levels, may indicate that the market is entering a correction process. Even if the price rebounds in the short term, the fact that funding rates remain under pressure suggests that investors are hesitant to re-open aggressive long positions.
Long & Short Liquidations
BTC reached the $86,500 level on April 9, rising as the negative atmosphere created by the tariffs between the US and China softened on the market after its decline on April 9. With this rise, a short position of 486.41 million dollars was liquidated last week. On the other hand, with the volatility during the week, a long position of 346 million dollars was liquidated.
| Date | Long Amount (Million $) | Short Amount (Million $) |
|---|---|---|
| April 09 | 90.38 | 214.72 |
| April 10 | 89.82 | 24.98 |
| April 11 | 28.78 | 64.71 |
| April 12 | 7.77 | 103.24 |
| April 13 | 49.72 | 26.74 |
| April 14 | 32.46 | 31.68 |
| April 15 | 47.12 | 20.34 |
| Total | 346.05 | 486.41 |
Supply Distribution
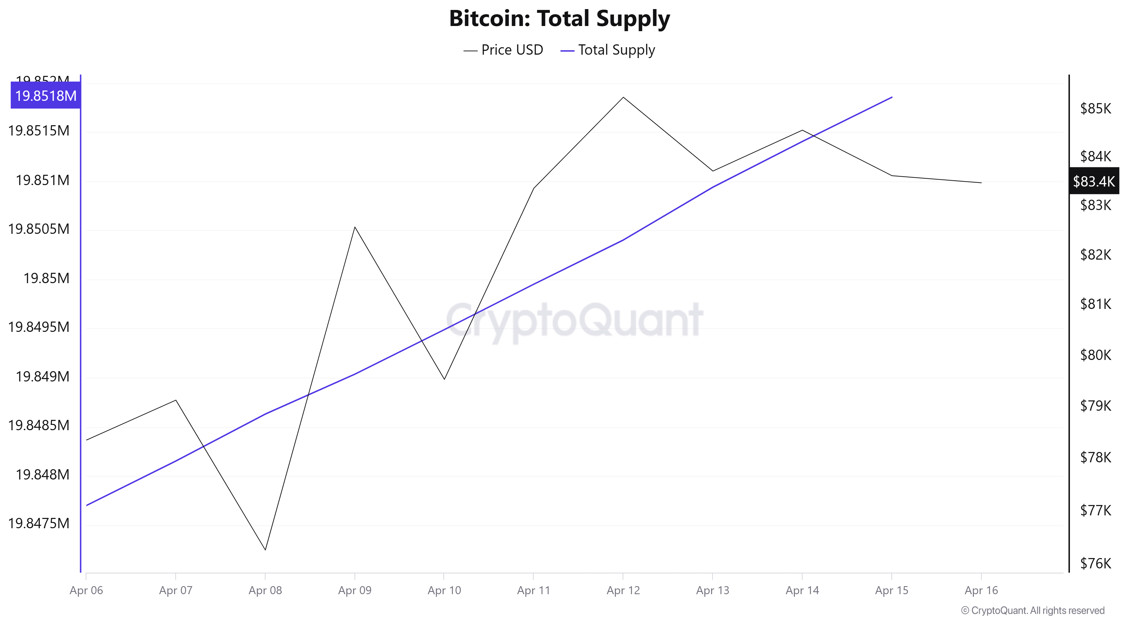
Total Supply: It reached 19,851,855 units, up about 0.0186% from last week.
New Supply: The amount of BTC produced this week was 3,703.
Velocity: Velocity, which was 13.19 last week, was 13.12 as of April 14.
| Wallet Category | 07.04.2025 | 14.04.2025 | Change (%) |
|---|---|---|---|
| < 1 BTC | 8.5391% | 8.5397% | 0.0070% |
| 1 – 10 BTC | 11.7255% | 11.7057% | -0.1686% |
| 10 – 100 BTC | 24.8084% | 24.8273% | 0.0760% |
| 100 – 1k BTC | 28.094% | 28.1208% | 0.0954% |
| 1k – 10k BTC | 18.5207% | 18.3995% | -0.6549% |
| 10k+ BTC | 8.3551% | 8.4065% | 0.6151% |
Looking at the wallet distribution of the current supply, a very limited increase of 0.007% was observed in the < 1 BTC category, while 1 – 10 BTC holders experienced a slight decrease of 0.1686%. In the 10 – 100 BTC range, there was a limited increase of 0.076%, while the 100 – 1K BTC segment showed a similar growth of 0.0954%. While 1K – 10K BTC holders experienced a significant decrease of 0.6549%, the most notable change was in the 10K+ BTC category, with a significant increase of 0.6151% in this segment.
Exchange Reserve
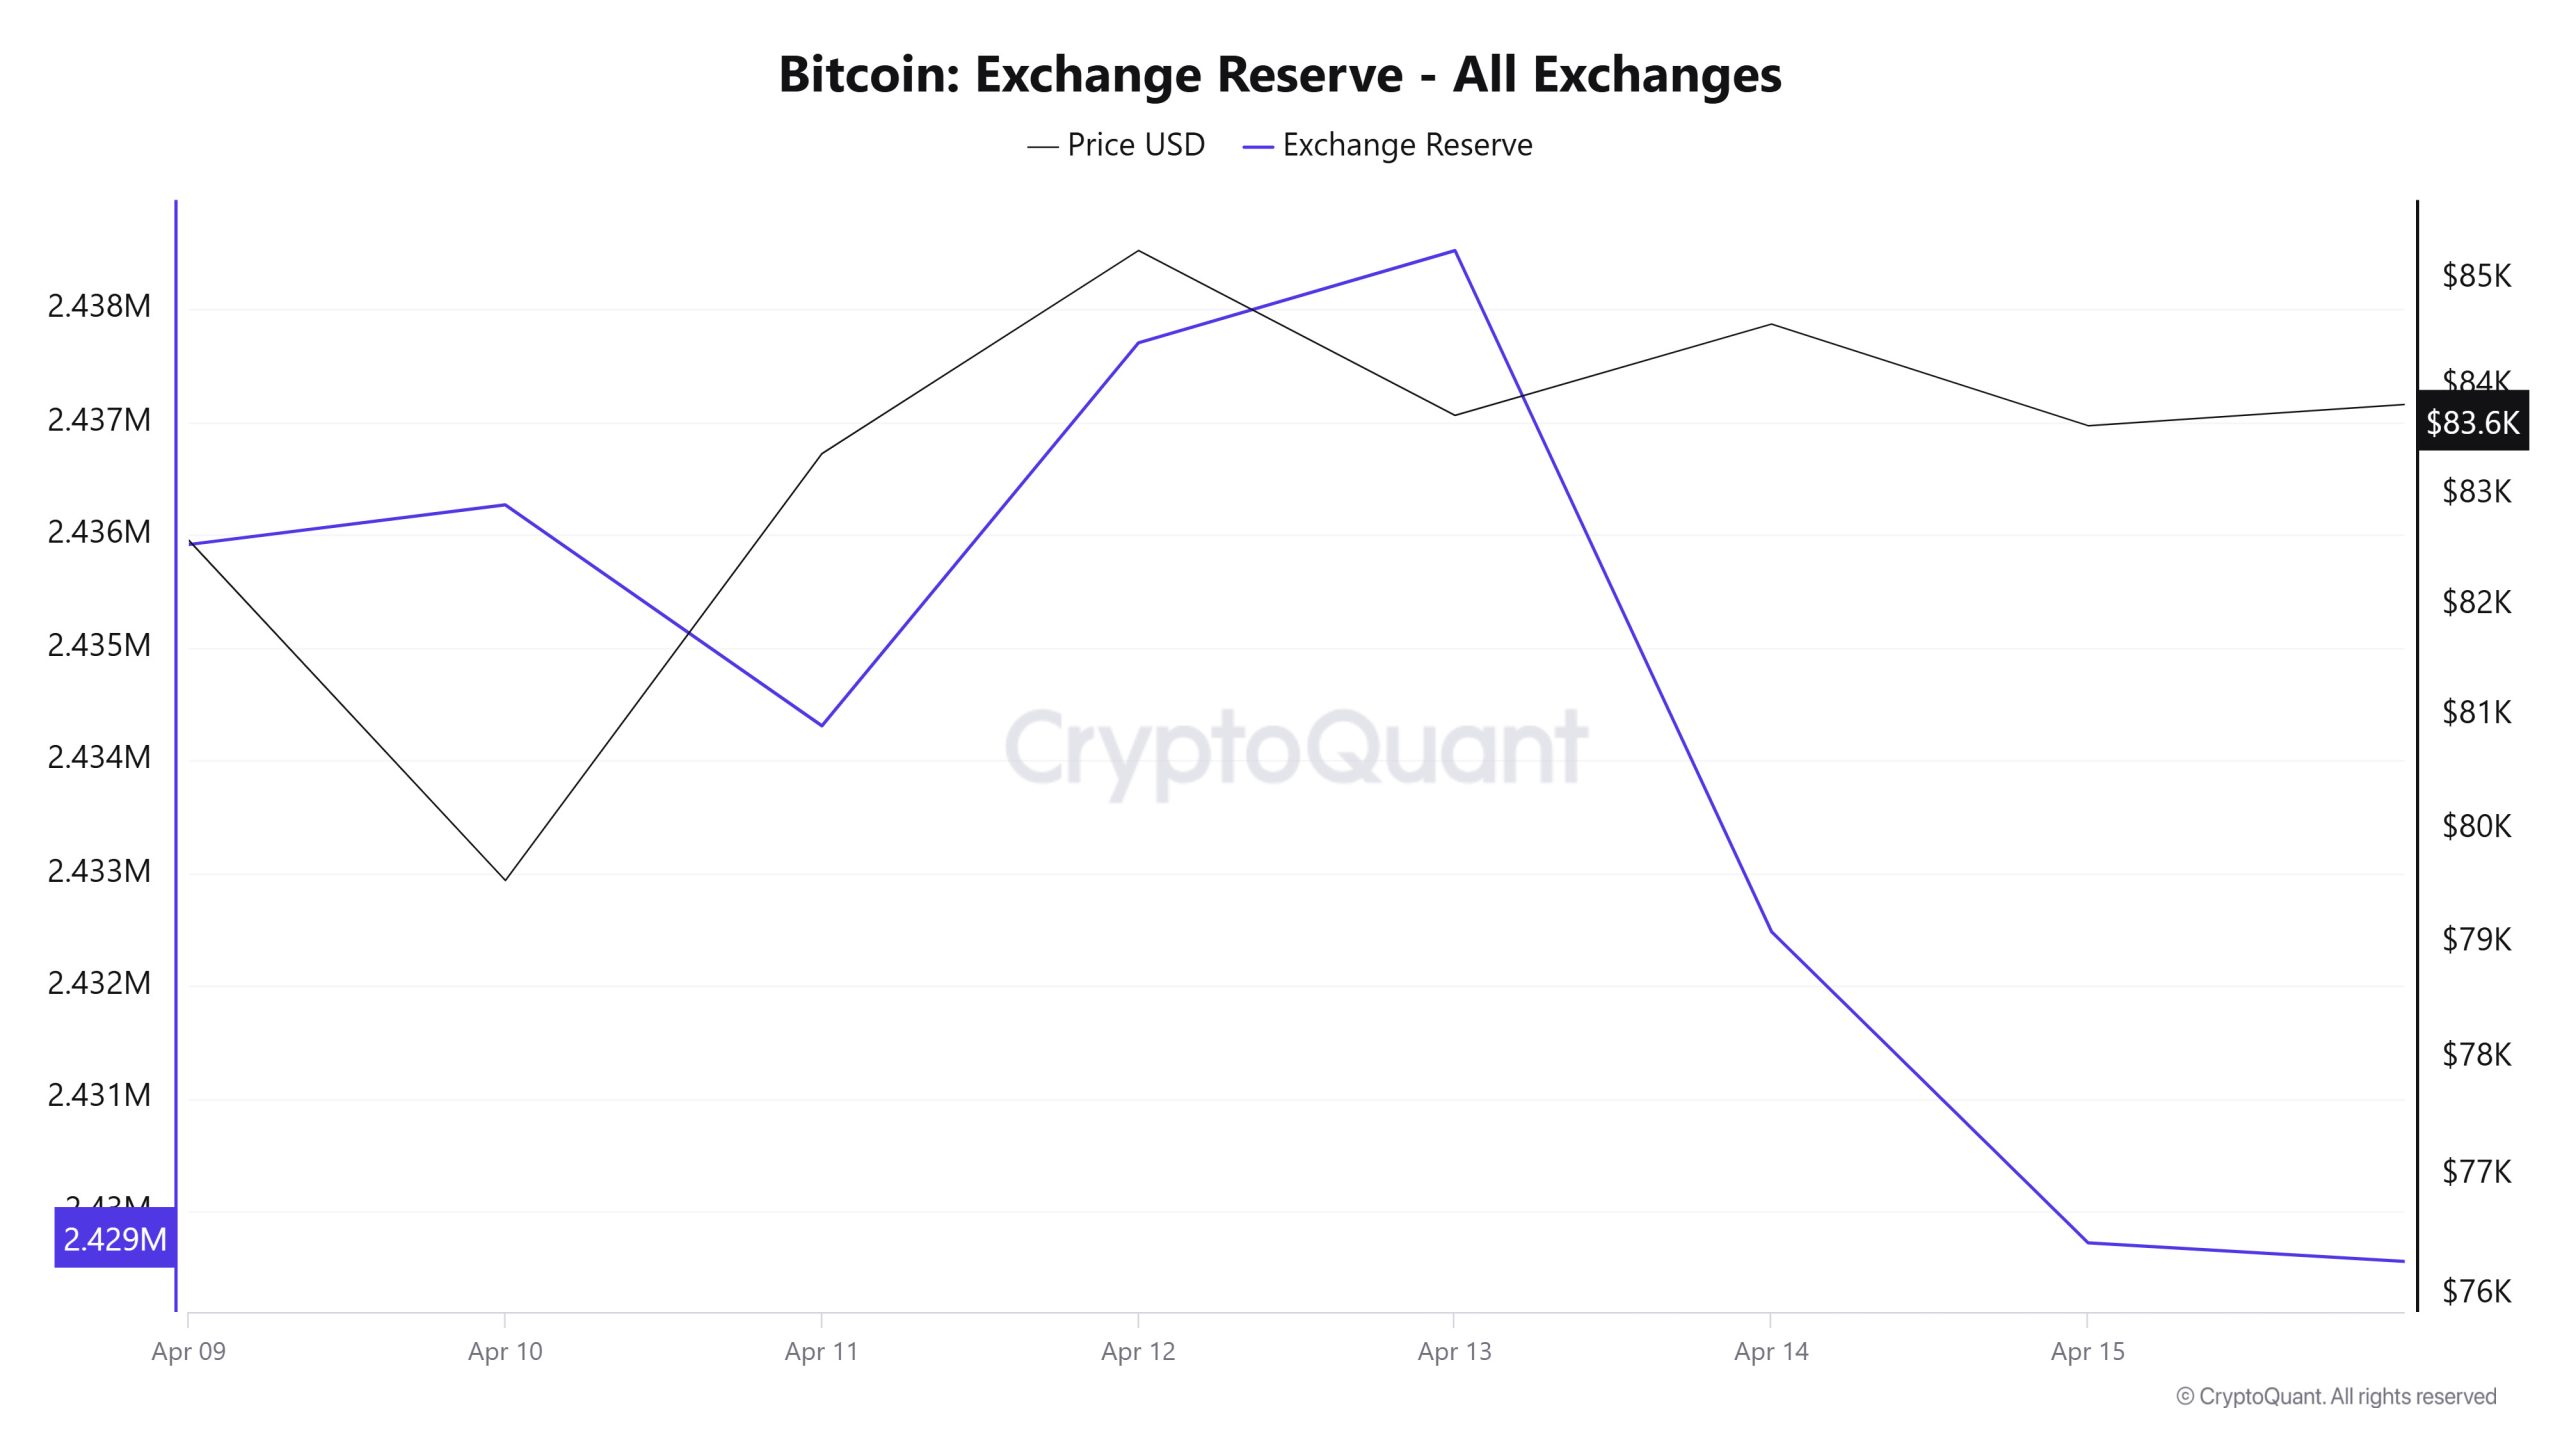
Between April 9-15, 2025, Bitcoin reserves on exchanges decreased from 2,435,916 BTC to 2,429,725 BTC. During this period, there was a total net outflow of 6,191 BTC and the Bitcoin reserves of exchanges decreased by 0.25%. The Bitcoin price, on the other hand, increased by approximately 1.8% during the same period. Bitcoin, which closed at $82,589 on April 9, 2025, closed at $83,639 on April 15, 2025. The outflows from the exchanges show that the selling pressure has subsided and investors are more inclined to hold for the long term. Reduced reserves on crypto exchanges and signs of stabilization in prices may support upside potential.
| Date | 9-Apr | 10-Apr | 11-Apr | 12-Apr | 13-Apr | 14-Apr | 15-Apr |
|---|---|---|---|---|---|---|---|
| Exchange Inflow | 49,680 | 37,101 | 36,972 | 18,486 | 16,014 | 30,724 | 27,443 |
| Exchange Outflow | 52,098 | 36,749 | 38,931 | 15,090 | 15,197 | 36,765 | 30,200 |
| Exchange Netflow | -2,418 | 352 | -1,959 | 3,396 | 818 | -6,041 | -2,757 |
| Exchange Reserve | 2,435,916 | 2,436,268 | 2,434,309 | 2,437,705 | 2,438,523 | 2,432,482 | 2,429,725 |
| BTC Price | 82,589 | 79,549 | 83,382 | 85,270 | 83,734 | 84,581 | 83,639 |
Fees and Revenues
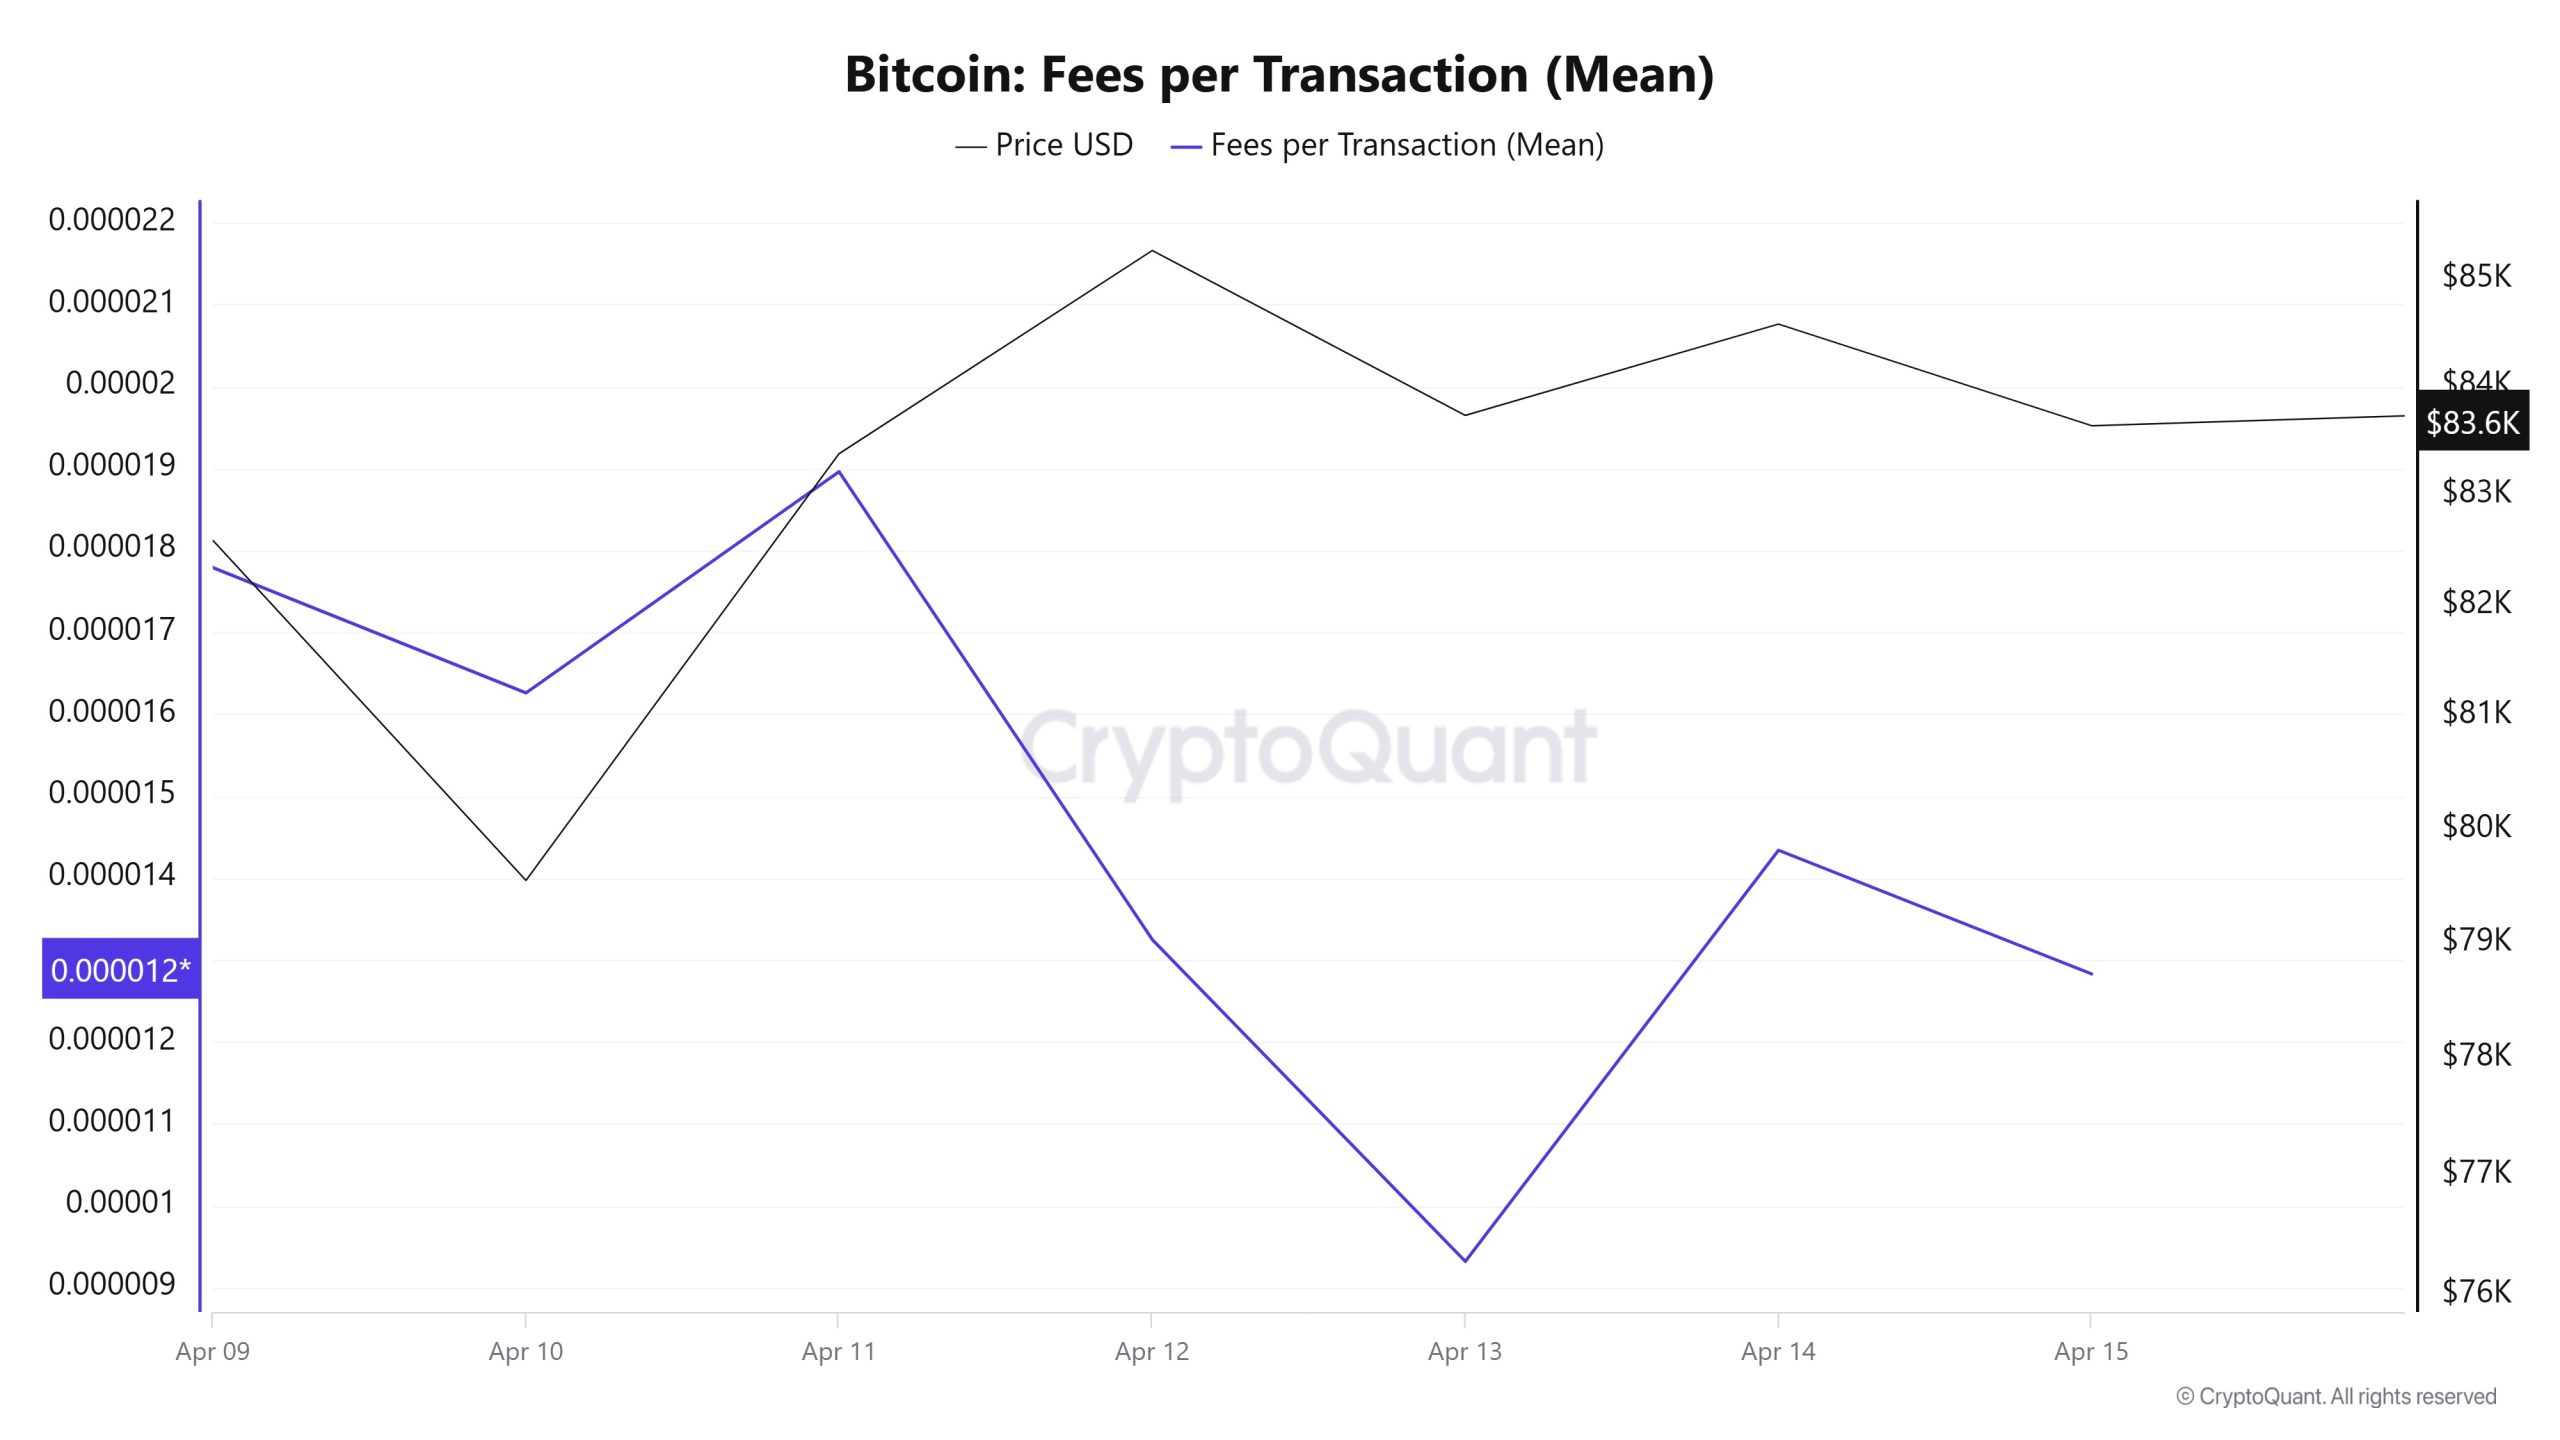
Analysing the Bitcoin Fees per Transaction (Mean) data between April 9-15, it was observed that this value was at 0.00001779 on April 9, the first day of the weekly period. Until April 11, the value, which followed a parallel course with Bitcoin’s price movements, reached 0.00001896 on this date and recorded its highest value on a weekly basis.
After April 11, the value, which entered a downward trend with the relatively horizontal movements observed in the Bitcoin price, fell to 0.00000932 on April 13, marking the lowest level on a weekly basis.
Bitcoin Fees per Transaction (Mean), which showed an upward trend in the following days, closed at 0.00001283 on April 15, the last day of the weekly period.
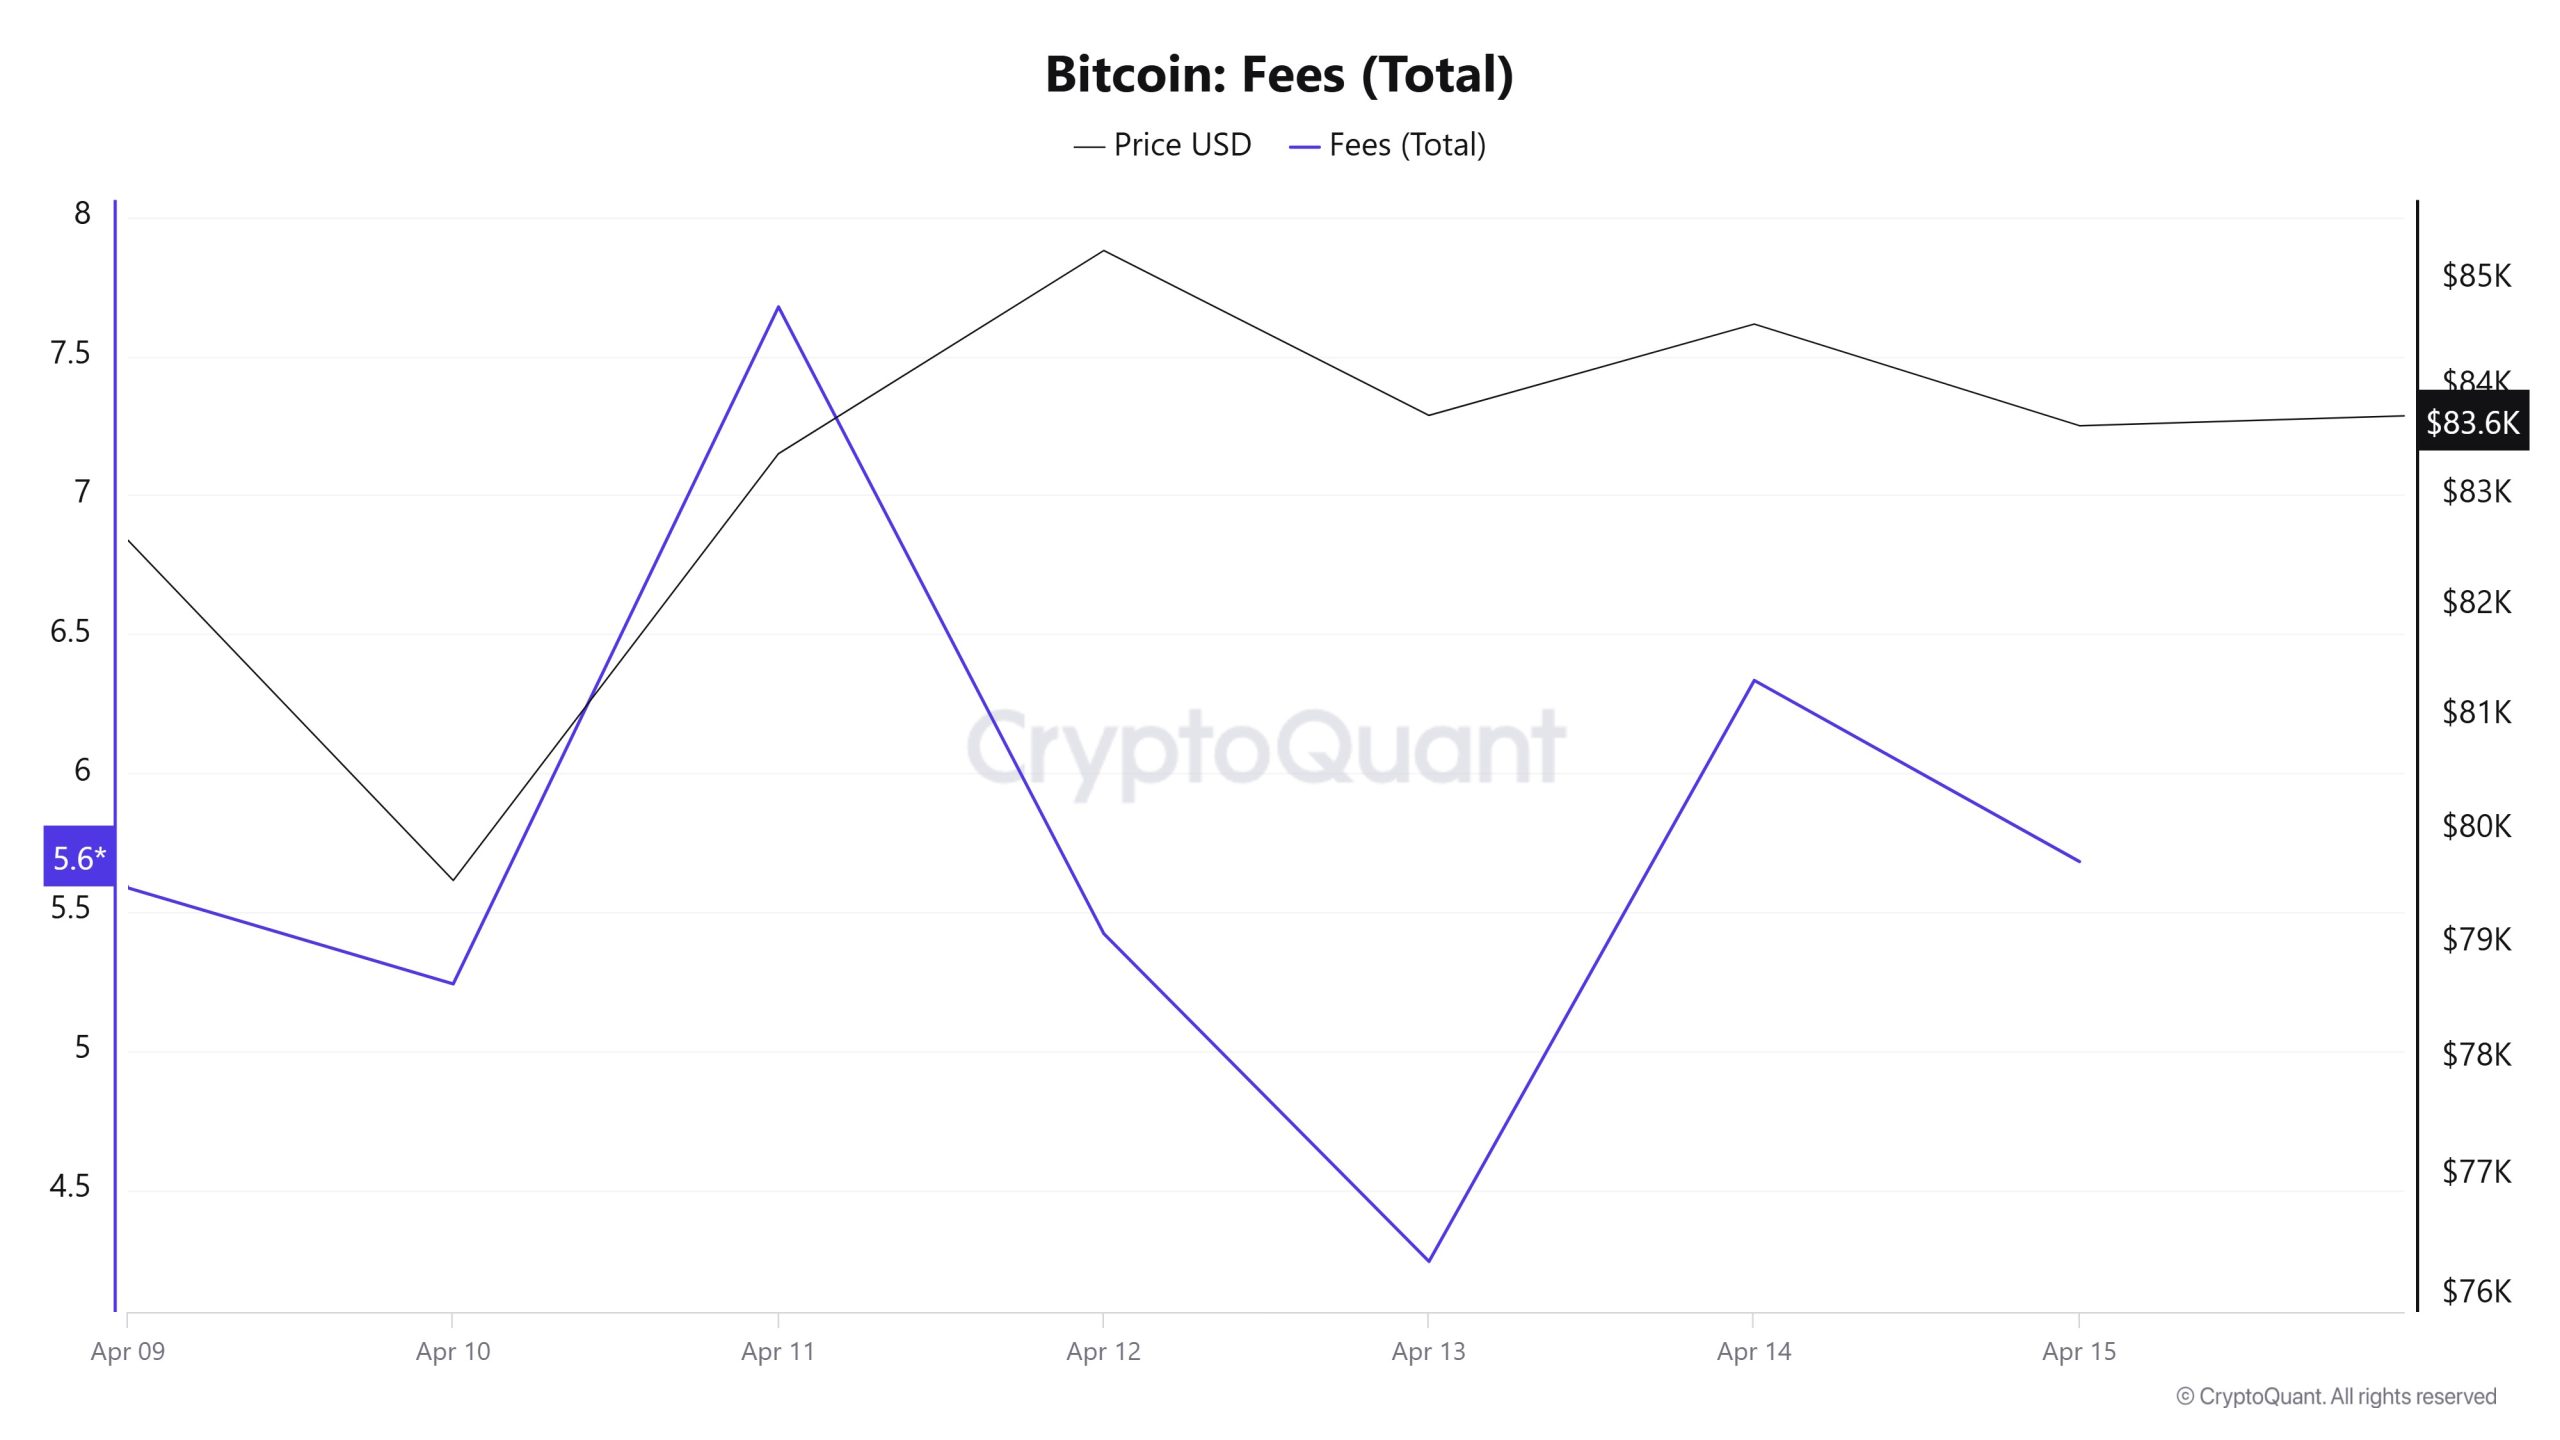
Similarly, when the Bitcoin Fees (Total) data between April 9-15 is analyzed, it is seen that this value was 5.5863384 on April 9, the first day of the weekly period. Until April 11, the value, which followed a parallel course with Bitcoin’s price movements, reached 7.67759265 on this date and recorded its highest value on a weekly basis.
After April 11, the value, which entered a downward trend with the relatively horizontal movements observed in the Bitcoin price, fell to 4.24206972 on April 13, marking the lowest level on a weekly basis.
Bitcoin Fees (Total), which showed an upward trend in the following days, closed at 5.68117728 on April 15, the last day of the weekly period.
Miner Flows
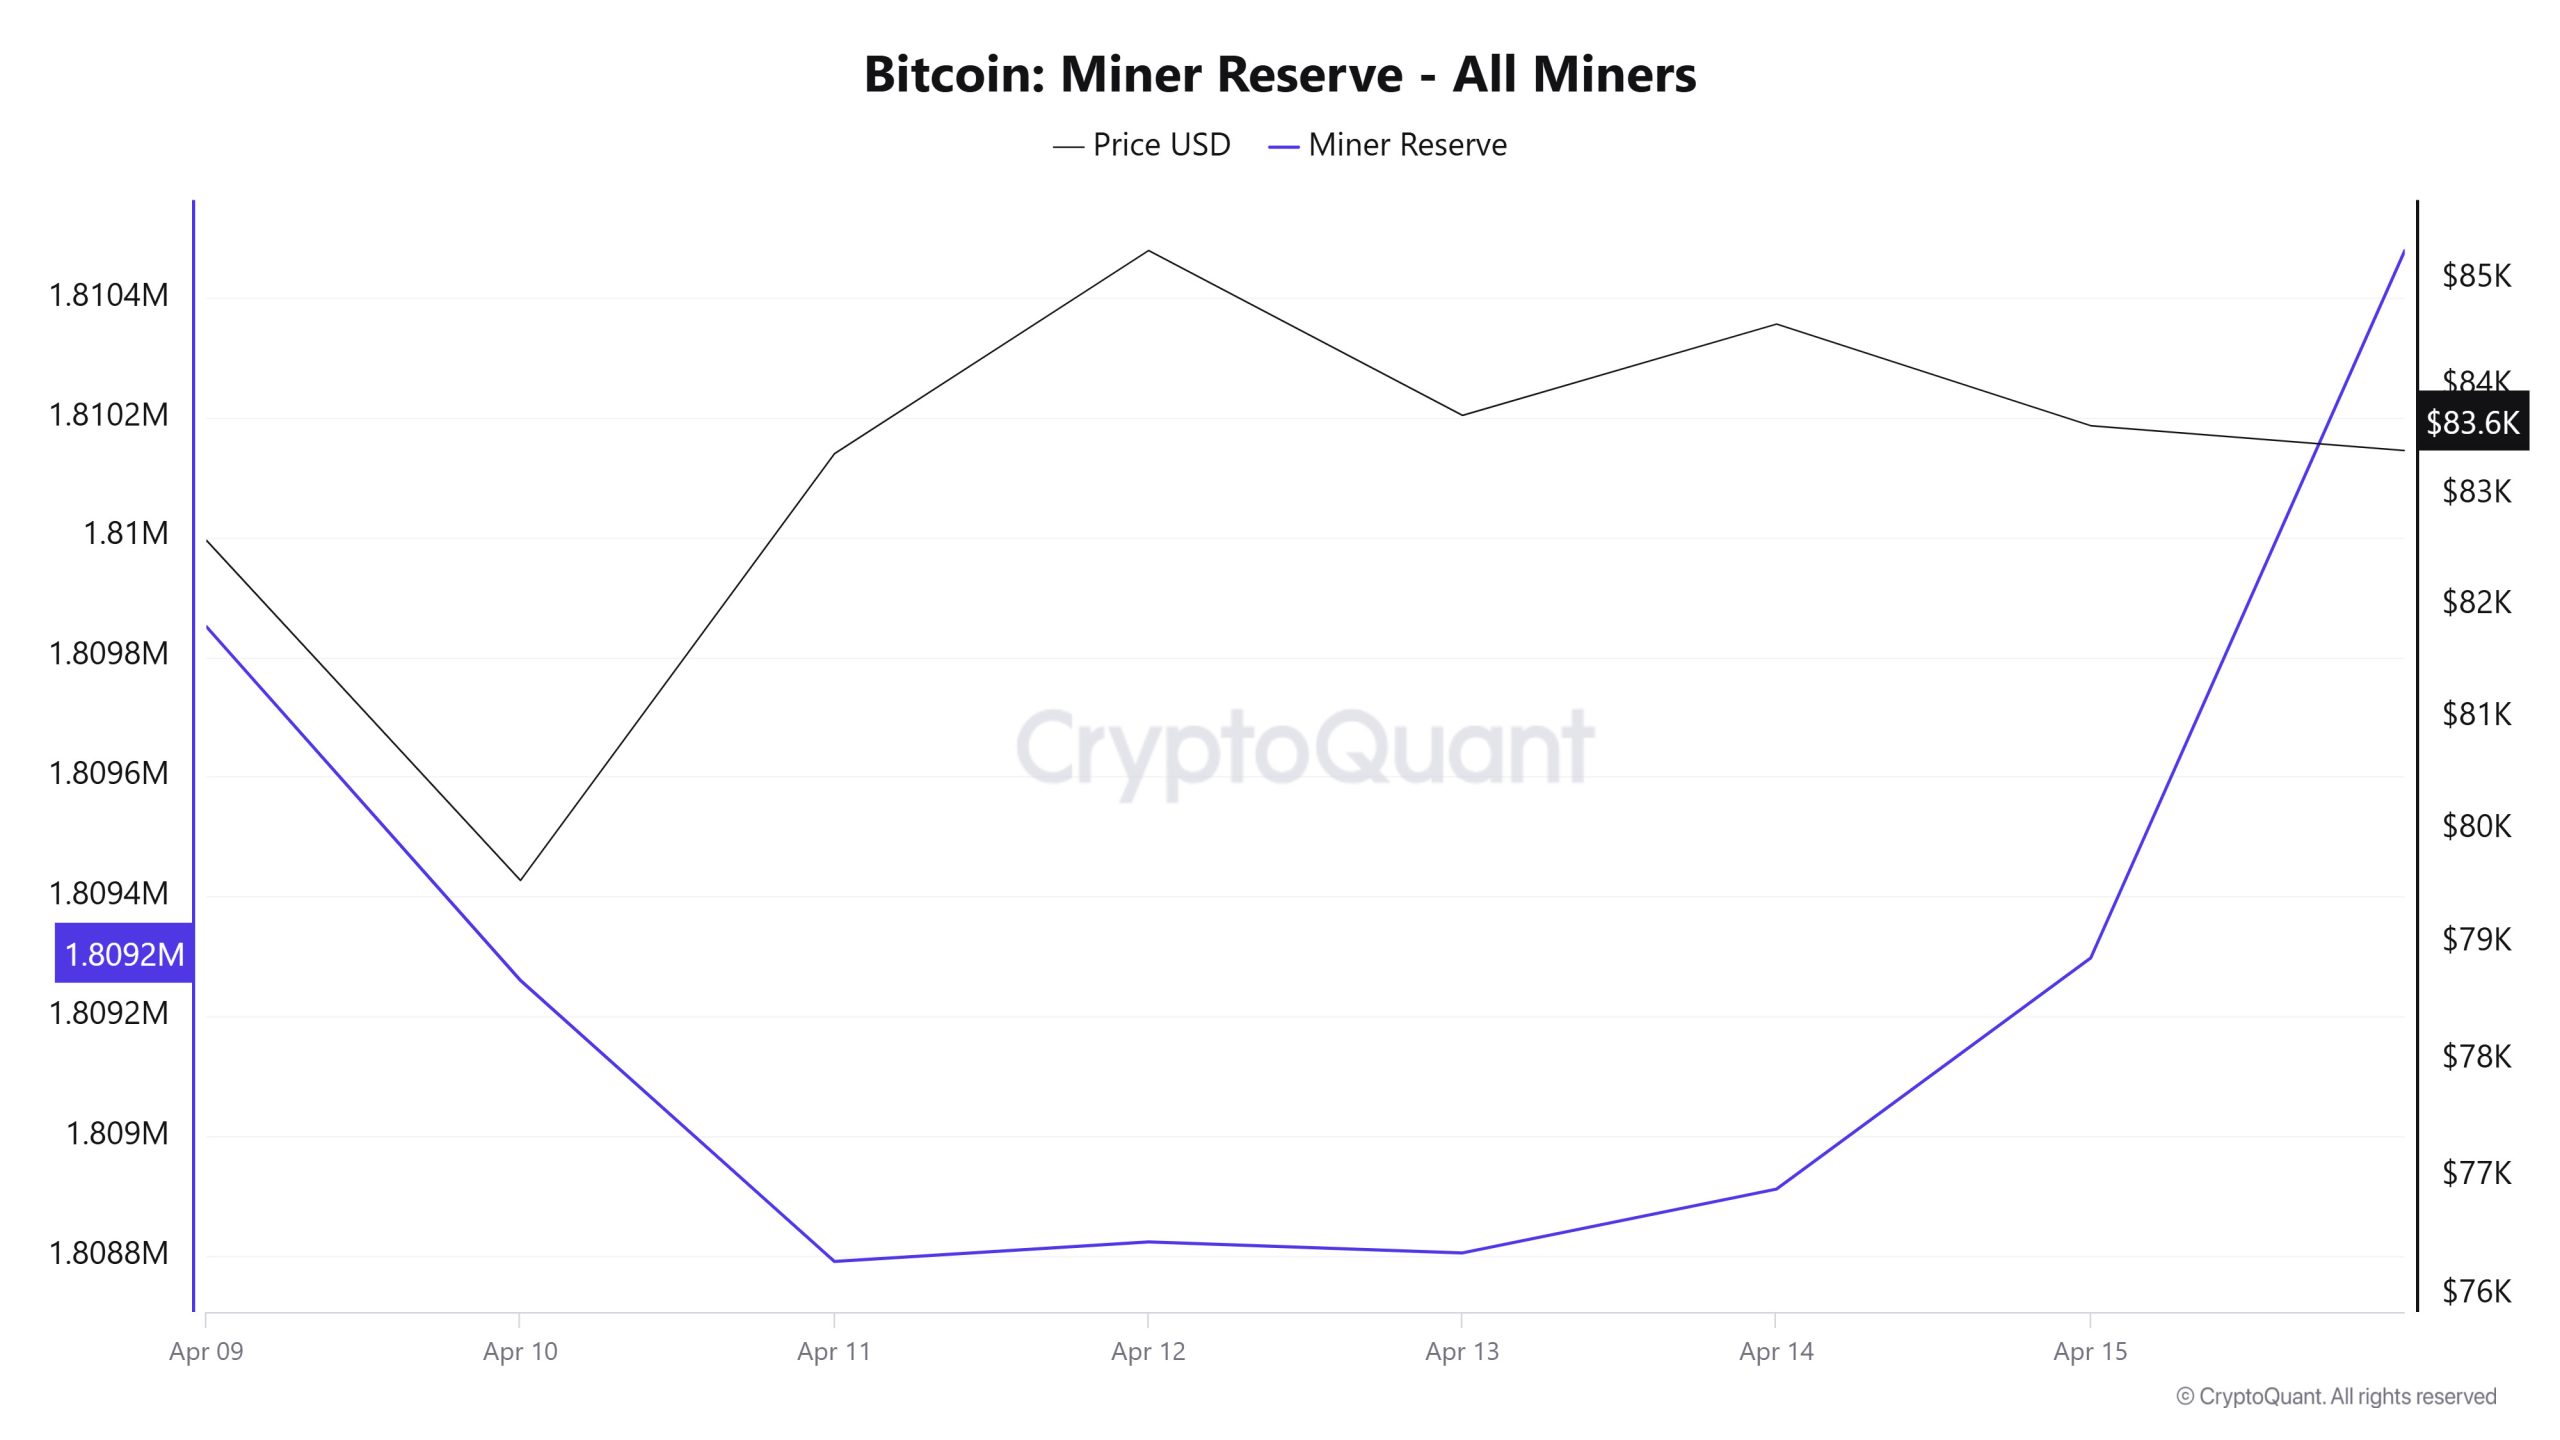
As can be seen in the Miner Reserve table, the number of Bitcoins in miners’ wallets decreased this week. Although there was a positive correlation between Miner Reserve and Bitcoin price at the beginning of this week, the correlation turned negative in the middle of the week.
Miner Inflow, Outflow and Netflow
Between April 9th and April 15th, 48,784 Bitcoins exited miners’ wallets and 48,379 Bitcoins entered miners’ wallets between the same dates. The Miner Netflow for this week was -405 Bitcoin. Meanwhile, the Bitcoin price was $82,589 on April 9 and $83,639 on April 15.
For the week, the net flow (Miner Netflow) was negative as Bitcoin inflow into miner wallets (Miner Inflow) was less than Bitcoin outflow from miner wallets (Miner Outflow).
| Date | April 9 | April 10 | April 11 | April 12 | April 13 | April 14 | April 15 |
|---|---|---|---|---|---|---|---|
| Miner Inflow | 9,562.18 | 7,680.37 | 7,961.42 | 5,033.93 | 5,260.56 | 5,378.07 | 7,502.52 |
| Miner Outflow | 9,414.32 | 8,270.78 | 8,430.67 | 5,001.29 | 5,278.91 | 5,271.47 | 7,116.77 |
| Miner Netflow | 147.85 | -590.41 | -469.24 | 32.64 | -18.35 | 106.61 | 385.75 |
Transaction
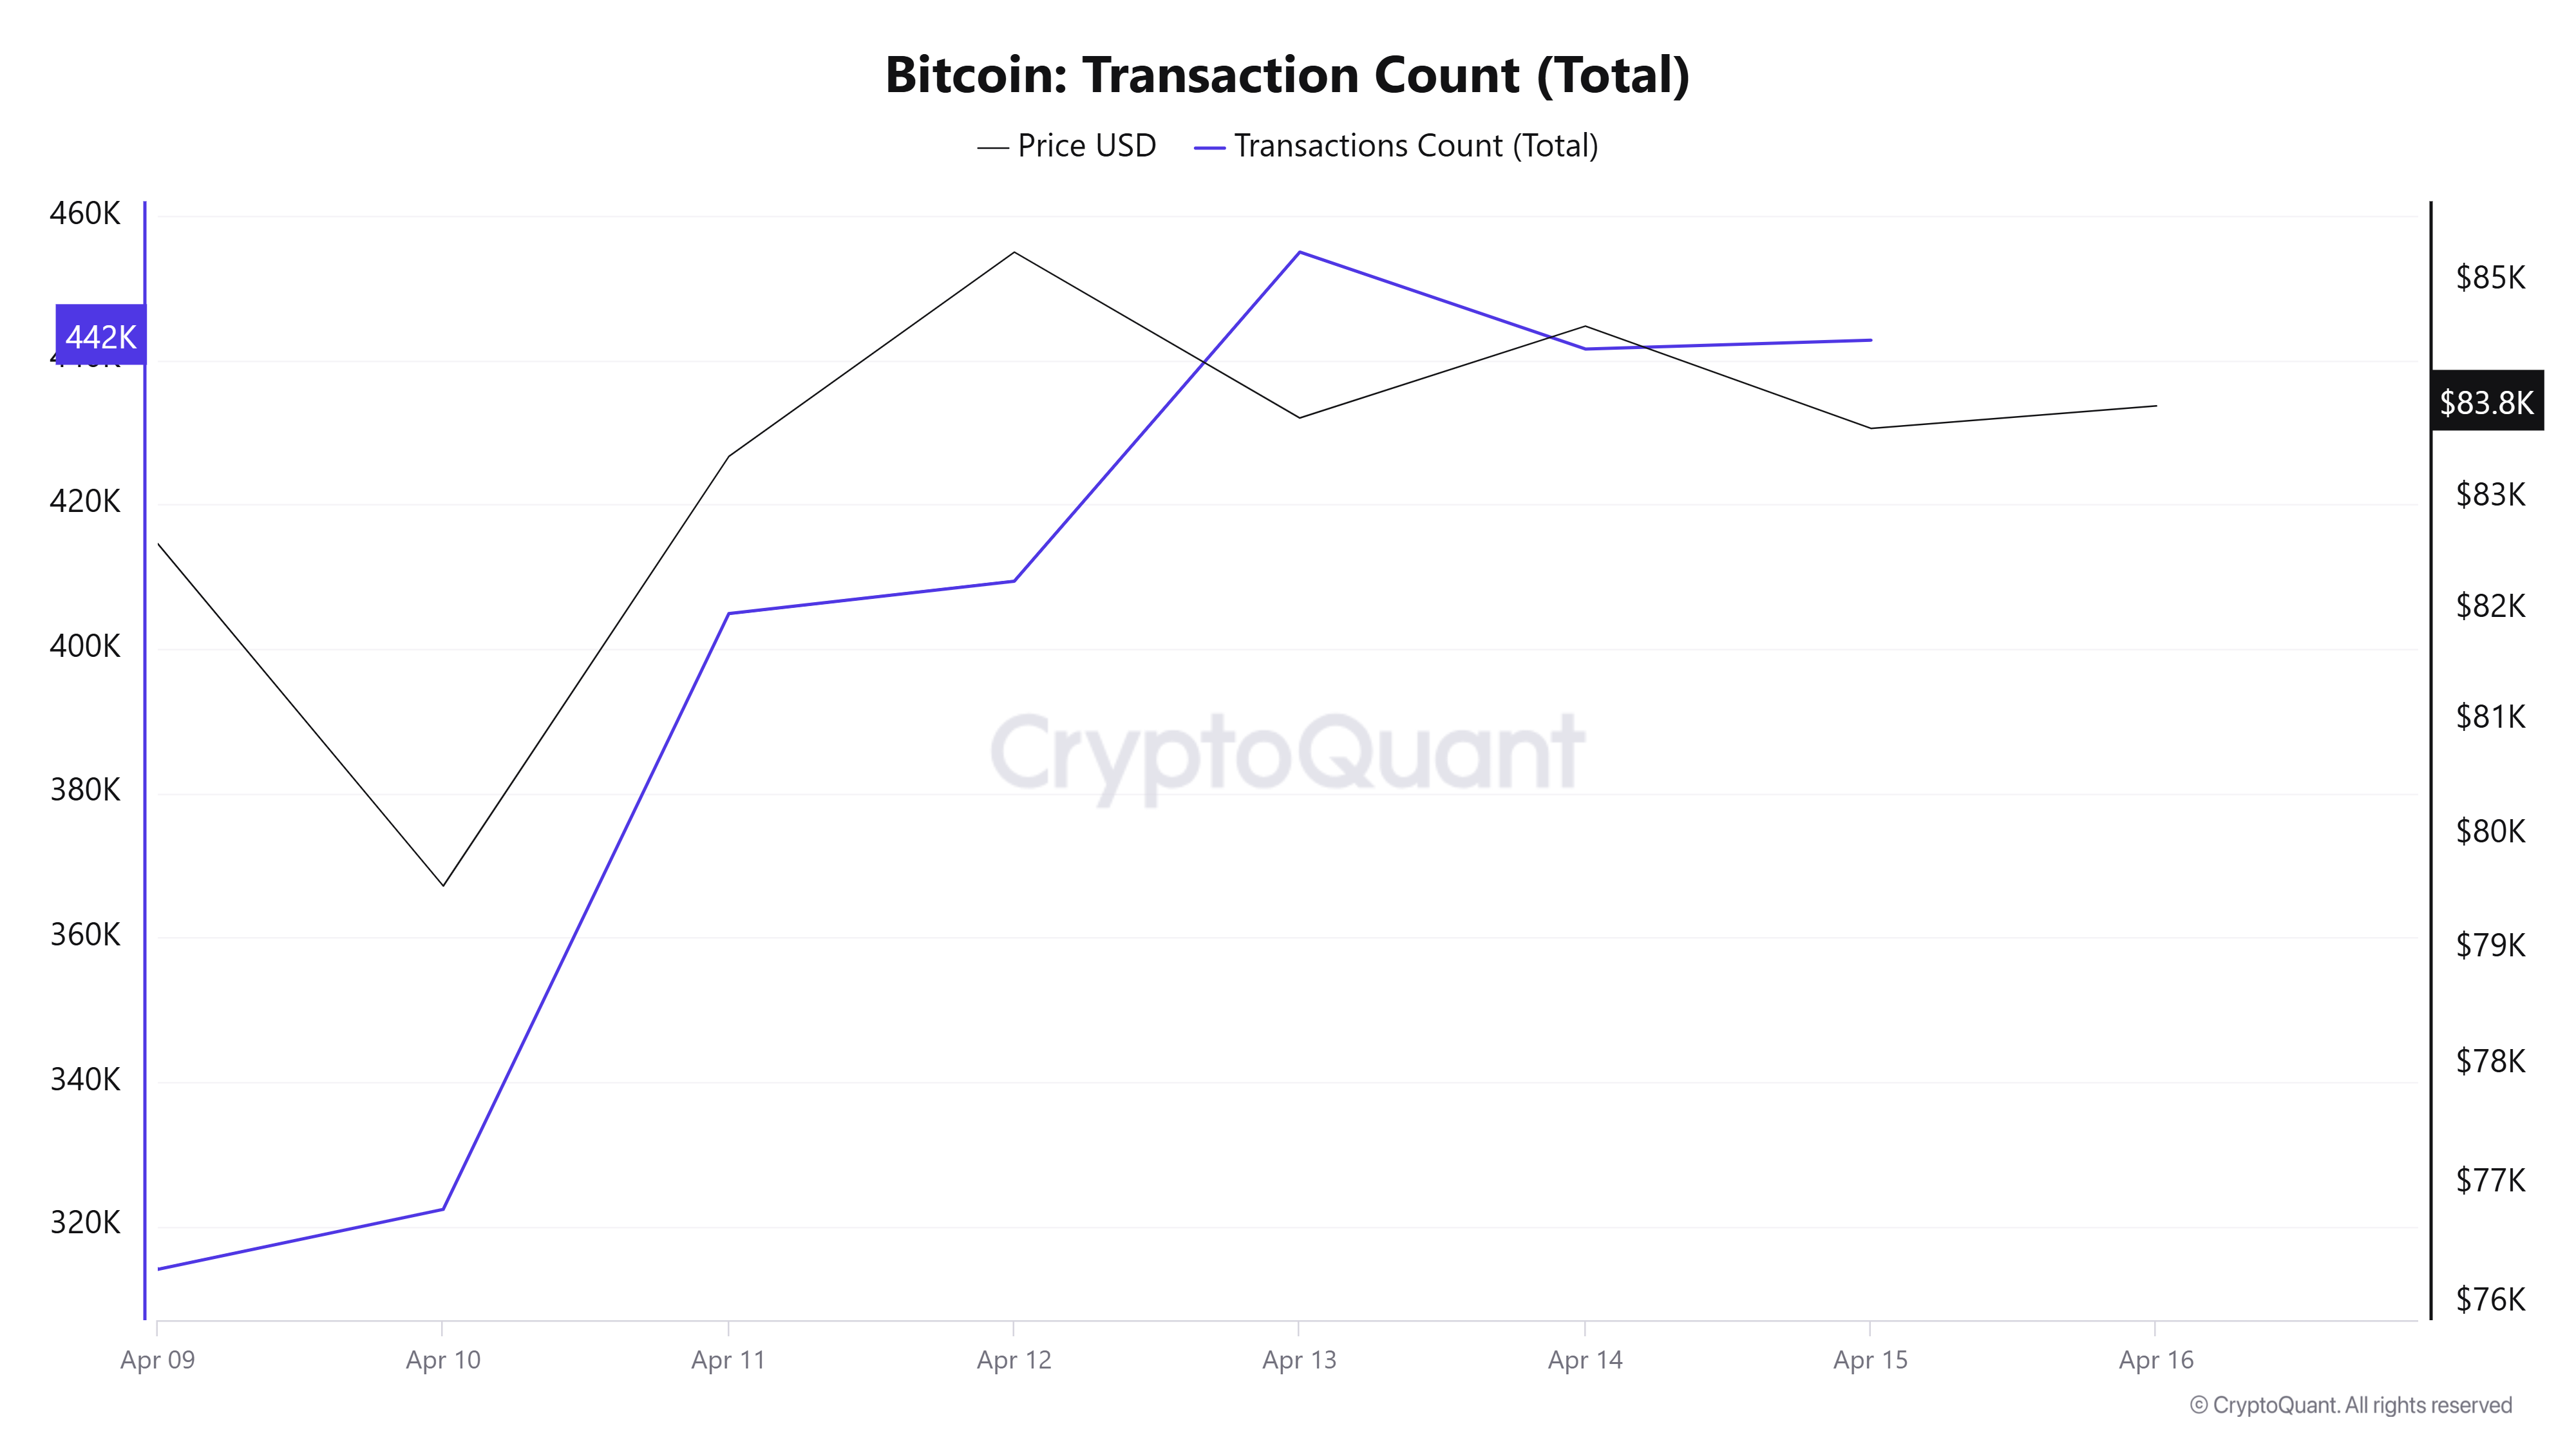
Last week, there were 2,466,156 transactions on the Bitcoin network, while this week it increased by about 13.12% to 2,789,841 transactions. The 454,967 transactions recorded on April 13 was the highest transaction volume of the week, while the lowest number of transactions was 314,011 on April 9.
Looking at the correlations between price and the number of trades, it is observed that the positive correlations have started to increase. The increase in the number of trades compared to the beginning of the week reveals a stronger network outlook compared to last week. This indicates that the activity on the network is reviving and the market may transition to a healthier trading dynamic.
Tokens Transferred
While 4,059,822 BTC was transferred last week, it increased by 3.04% to 4,183,260 BTC this week. On April 9, 786,682 BTC were transferred, the highest token transfer volume of the week, while the lowest token transfer volume was recorded on April 13 with 417,613 BTC. There is a gradual decrease in the amount of BTC transferred on the network between April 9-13. Between 13-15, there is a regular increase in the amount of tokens transferred. In the “Transferred BTC amount – Price” relationship, we see that positive correlations are starting to increase.
Whale Activities
Whales Data
According to the data that attracted attention in the cryptocurrency market in the last 7 days, whale activity on the central exchange showed us that it used central exchanges at a standard level at the beginning of the process. Towards the middle of the process, this activity increased, but by the middle of the process, this rate was extremely low. When we look at the Exchange Whale Ratio metric, the ratio of whales using centralized exchanges at the beginning of the 7-day period was 0.368. When this ratio is above 0.350, it usually means that whales use centralized exchanges frequently. This measurement increased in the middle of the period, reaching 0.500 on April 11. This caused the price of Bitcoin to fall from around $79,000 to around $84,000. It’s possible to say that this price drop indicates that whales were using centralized exchanges to buy BTC. The lowest point in the process occurred on April 13 and was valued at 0.310. During this period, the volatility of the price was very low and BTC moved in a narrow band. At the time of writing, the value was 0.508, making it the busiest day for whales. At the same time, total BTC transfers increased by about 21% compared to last week, with 4,186,452 BTC moving. In parallel, whale activity shows that big investors are still in the market and that we are in a sharp correction during the bullish period.
BTC Onchain Overall
| Metric | Rise 📈 | Decline 📉 | Neutral ➖ |
|---|---|---|---|
| Active Addresses | ✓ | ||
| Breakdowns | ✓ | ||
| Derivatives | ✓ | ||
| Supply Distribution | ✓ | ||
| Exchange Reserve | ✓ | ||
| Fees and Revenues | ✓ | ||
| Miner Flows | ✓ | ||
| Transaction | ✓ | ||
| Whale Activities | ✓ |
*The metrics and guidance in the table do not, by themselves, describe or imply an expectation of future price changes for any asset. The prices of digital assets may vary depending on many different variables. The onchain analysis and related guidance is intended to assist investors in their decision-making process, and making financial investments based solely on the results of this analysis may result in harmful transactions. Even if all metrics produce a bullish, bearish or neutral result at the same time, the expected results may not be seen depending on market conditions. Investors who review the report should take these warnings into account.
Legal Notice
The investment information, comments and recommendations contained in this document do not constitute investment advisory services. Investment advisory services are provided by authorized institutions on a personal basis, taking into account the risk and return preferences of individuals. The comments and recommendations contained in this document are of a general type. These recommendations may not be suitable for your financial situation and risk and return preferences. Therefore, making an investment decision based solely on the information contained in this document may not result in results that are in line with your expectations.
NOTE: All data used in Bitcoin onchain analysis is based on Cryptoqaunt.
