
Weekly Fundamental Analysis Report
Fear & Greed Index
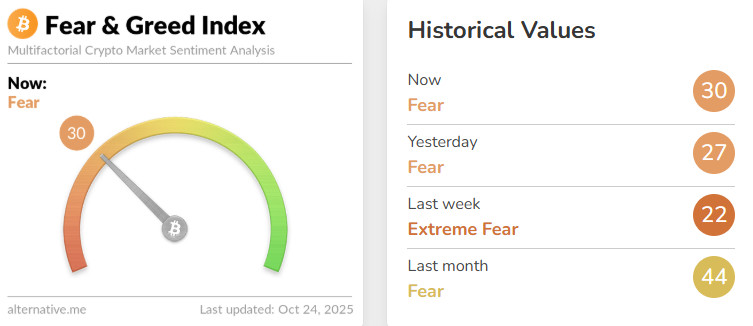
Source: Alternative.me
- Change in Fear and Greed Value: +8
- Last Week’s Level: 22
- This Week’s Level: 30
This week, the Crypto Fear & Greed Index is at 30, in the fear zone. Headlines about Donald Trump’s statement that “if a trade agreement is not reached by November 1, China could pay a 155% tariff” are keeping the risk premium high and making pricing more sensitive to news flow. On the regulatory front, US President Donald Trump’s pardon of Binance founder Changpeng Zhao stands out as a factor that partially eases exchange-related legal uncertainty and supports liquidity perception. On the institutional side, demand flow is creating balance in the dip zones: Strategy’s purchase of 168 Bitcoin points to structural buying appetite on the BTC side. BitMine’s accumulation of approximately 203,800 ETH and SharpLink’s purchase of 19,271 ETH at an average price of $3,892, bringing its total holdings to 859,853 ETH, or approximately $3.5 billion, strengthens the institutional base on the ETH front and mitigates the severity of potential panic selling. While uncertainty in the trading sector is limiting upward reactions, CZ’s pardon and news of institutional purchases are supporting risk appetite, with the index seeking equilibrium at 30.
Fund Flows
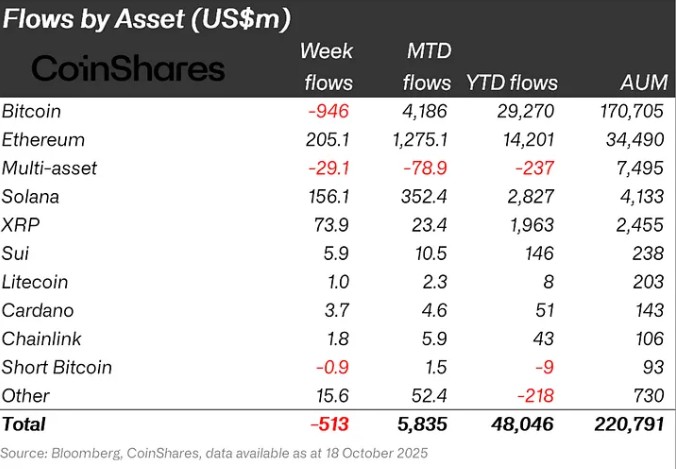
Source: Coin Shares
Overview: Cryptocurrency markets entered a new week of declines following the US House of Representatives shutdown. In particular, US President Donald Trump’s statement that we are in a trade war with China weakened the bullish sentiment in the markets. As a result of these developments, Bitcoin lost approximately 3% of its value during the week.
Ethereum (ETH): Due to an increase in spot ETH, $205.1 million flowed into Ethereum this week.
Ripple (XRP): This week, XRP saw an inflow of $73.9 million.
SUI: Sui is preparing to launch its own stablecoin, USDI. Approximately $5.9 million flowed into Sui this week.
Solana (SOL): Solana saw inflows of $156.1 million.
Cardano (ADA): Cardano saw an inflow of $3.7 million this week.
Chainlink (LINK): Chainlink continues to strengthen its potential by providing reliable data and updates to the tokenization and DeFi sectors. This week, there was an inflow of $1.8 million into Link.
Litecoin (LTC): LTC saw $1.0 million in inflows.
Other: Sector-specific and project-based increases in altcoins, along with the overall market sentiment, brought in $14.6 million in fund inflows.
Fund Outflows:
Bitcoin (BTC): Bitcoin is experiencing outflows from investors this week. Interest rate cuts in global markets, the customs dispute with China, and the shutdown of Congress have negatively impacted crypto markets. Bitcoin-focused funds saw $946 million in outflows this week alone.
Multi-asset: Outflows were observed in the multi-asset group.
Short Bitcoin: Outflows of $0.9 million were observed on the short Bitcoin side.
Total MarketCap
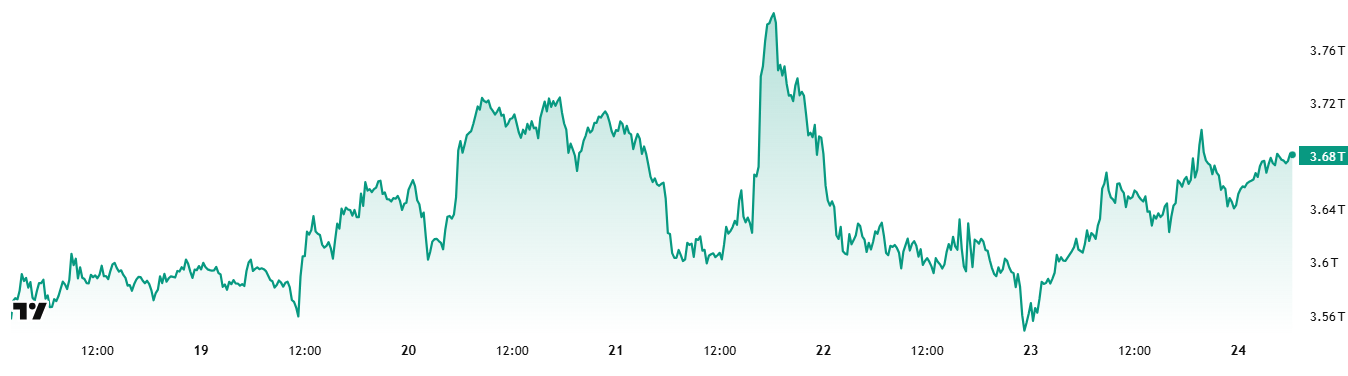
Source: Tradingview
- Last Week’s Market Value: $3.65 Trillion
- This Week’s Market Value: $3.68 Trillion
This week, the cryptocurrency market rose by 0.9% with an increase in value of approximately $30 billion, bringing the total market cap to $3.68 trillion. The weekly high was recorded at $3.8 trillion, while the lowest level was $3.54 trillion. Thus, the market moved within a band of approximately $260 billion. This picture shows that the high volatility seen in recent weeks has decreased significantly.
Currently, the Total Market is trading above its 50-week moving average of $3.35 trillion but is still priced quite close to it compared to other weeks. At the end of the 2020 bull market, a long bear market began with a loss of more than 60% after the Total Market closed below the 50-week average for two consecutive weeks. Therefore, in the current technical outlook, this level should be closely monitored for a possible trend reversal signal.
Total 2
Starting the week with a market value of $1.48 trillion, Total 2 rose 0.5% during the week, increasing by approximately $7.5 billion to reach $1.49 trillion. The highest level during the week was $1.53 trillion, while the lowest was $1.41 trillion. Thus, the index moved within a wide band of $112 billion in total. This indicates that Total 2’s high volatility in recent weeks has partially subsided.
With this week’s movement, the Total 2 index is now priced more than 18% below its all-time high.
Total 3
Starting the week with a market value of $1 trillion, Total 3 recorded an increase of approximately $10 billion in value during the week, rising by 1.0% and closing the period at $1.01 trillion. A difference of 6.99% emerged between the highest and lowest values during the week. Based on this calculation, Total 3 lost the title of “most volatile index” to the Total 2 index, which showed 7.97% volatility this week.
While the market generally showed a moderate positive outlook, the strongest performance was in the Total (general market) index. This indicates that the weight of the high-risk asset class in the ecosystem has decreased.
On the other hand, comparative performance analyses reveal that Ethereum’s market share continues to decline, while altcoins’ weekly average returns remain stronger than Ethereum’s. It appears that part of Ethereum’s market dominance over altcoins has shifted to Bitcoin this week as well.
Altcoin Season Index
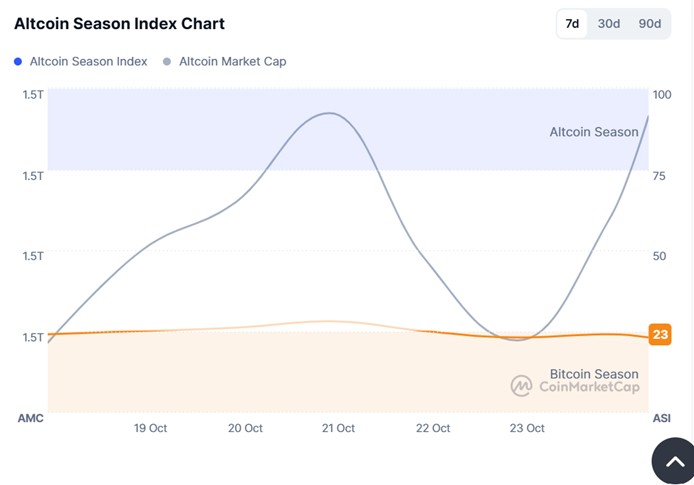
Source: Coin market cap
- Last Week’s Index Value: 24/100
- This Week’s Index Value: 23/100
Between October 17 and October 24, 2025, an increase was observed in the correlation between altcoin market dominance (Altcoin Market Cap) and the Altcoin Season Index. The chart shows that this week, on October 24 , the index retreated to level 23, with Altcoin Market Cap reaching 1.53T. This indicates an upward trend in the market dominance of altcoins. When the index rose this week, the top 5 coins leading the rise were Myx, Aster, M, Zec, and OKB. On October 13, the index fell from 28 to 23 on , indicating a potential short-term pullback in the altcoin season.
Bitcoin Dominance
Bitcoin Dominance
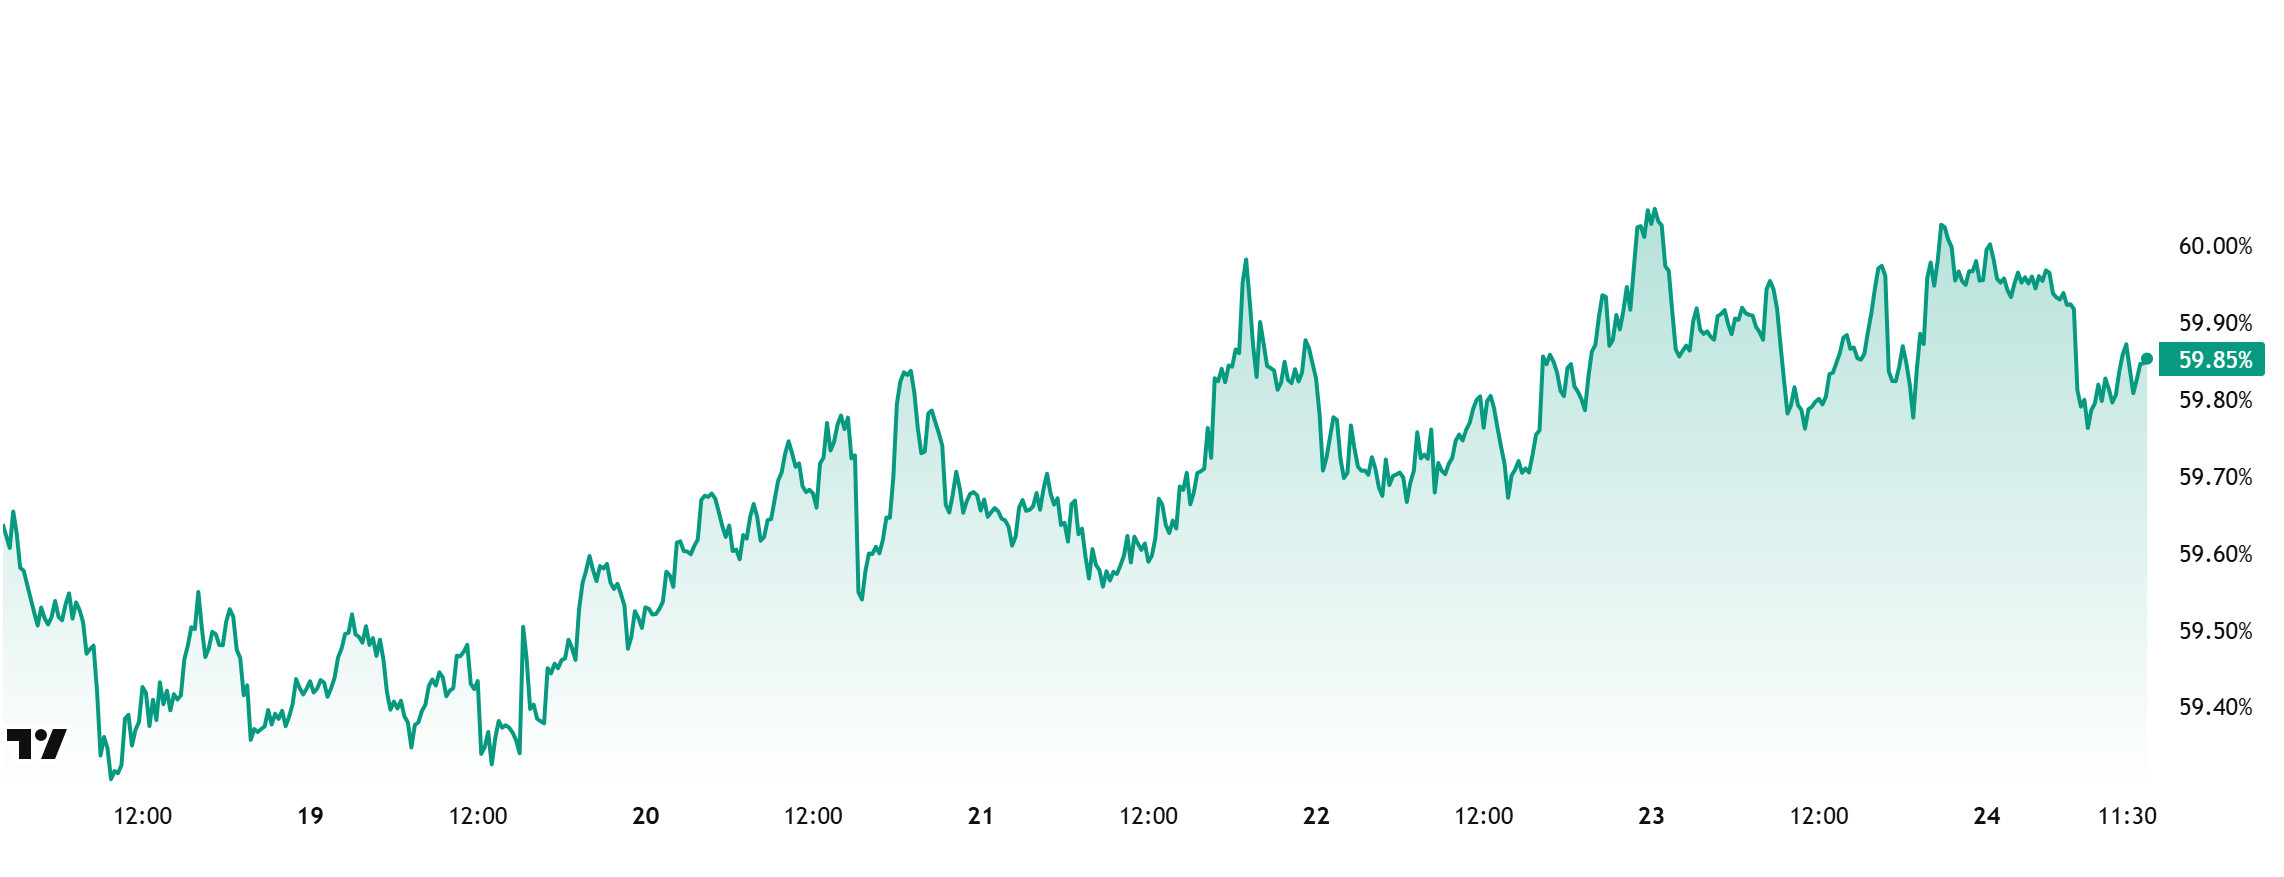
Bitcoin dominance started the week at 59.38%. Although it rose to 60.09% during the week, it subsequently retreated slightly and is currently at 59.85%.
This week, Strategy purchased 168 Bitcoin, Capital B, Europe’s first Bitcoin treasury company, purchased 6 Bitcoin, and The Smarter Web purchased 10 Bitcoin. Additionally, data on Bitcoin spot ETFs shows that there has been a total net inflow of $355.7 million to date.
While the slowdown in Bitcoin demand from institutional investors continued this week, weekly data shows an increase in momentum in net purchases made by retail investors through spot ETFs.
Amidst a volatile outlook as markets continue to search for direction, a partial recovery in capital flows towards Bitcoin is being observed. The recent start of net inflows into spot ETFs, albeit limited, signals a reduction in selling pressure. However, the weak pace of inflows is limiting the buying momentum for Bitcoin. Nevertheless, Bitcoin is performing relatively stronger than Ethereum and other major altcoins in the short term. If institutional demand continues to grow cautiously, BTC dominance is expected to maintain its current strong structure. In this context, while Bitcoin’s market dominance has limited upside potential in the short term, BTC dominance is expected to consolidate in the 58%–61% range next week.
Ethereum Dominance
Source: Tradingview
Weekly Change:
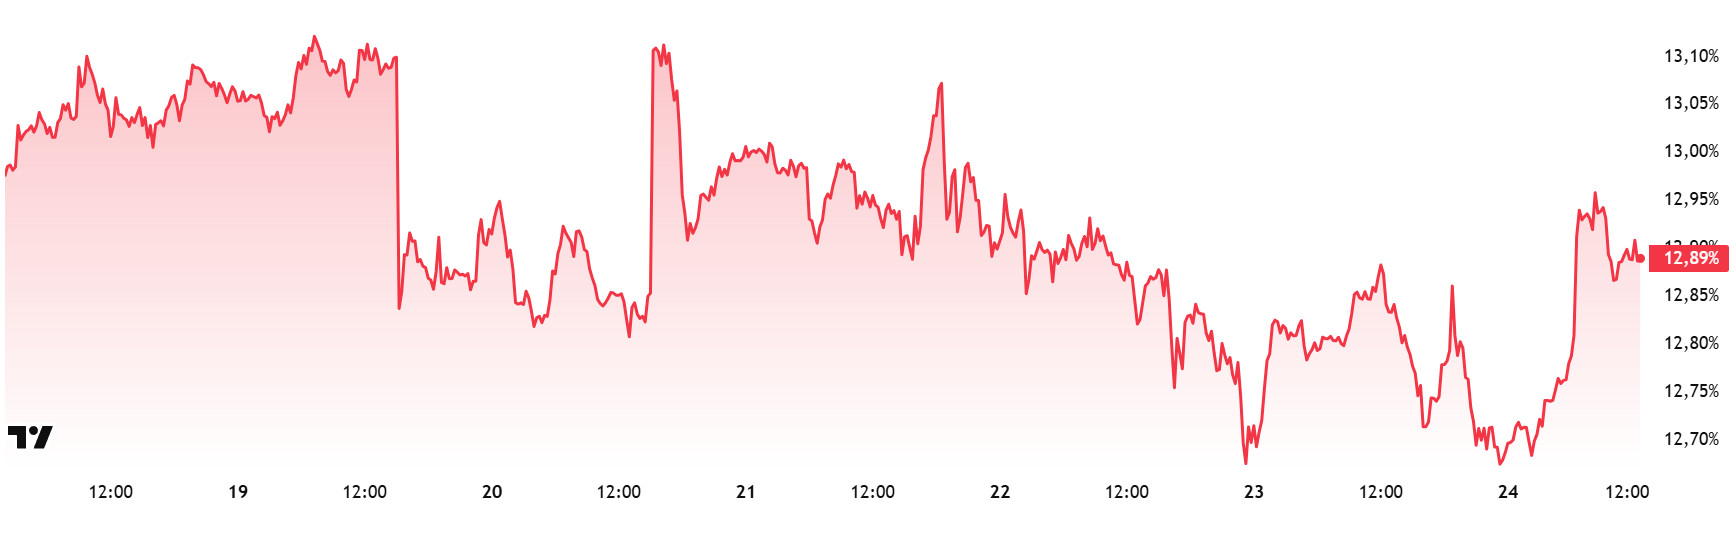
- Last Week’s Level: 13.01%
- This Week’s Level: 12.89%
Ethereum dominance, which rose to 15% levels in mid-August, lost momentum in the following period and entered a downward trend, which continues as of this week.
Accordingly, Ethereum dominance ended last week at 13.01%, while current data shows it trading at around 12.89%. During the same period, Bitcoin dominance has followed a positive trend, unlike Ethereum.
The key developments affecting Ethereum dominance are as follows:
Ethereum treasury FG Nexus (NASDAQ: FGNX) announced a $200 million share buyback program. The program, to be executed through ThinkEquity, will not exceed 25% of trading volume as long as the share price remains below $5.00. The buyback aims to support the share price below the company’s net asset value.
VanEck submitted its application for the “VanEck Lido Staked ETH ETF” to the SEC. The fund will provide investors with access to ETH staked through the Lido protocol. If approved, it will be the first stETH-based ETF in the US.
The Ethereum network has entered the final testing phase of the Fusaka upgrade. Expected to launch on the mainnet on December 3, the upgrade will increase block efficiency and reduce DoS risk. It will also introduce a Gas limit of 16.78 million per transaction.
The ETHShanghai 2025 conference, starting on October 22, will bring together over 40 industry leaders, including Vitalik Buterin, Xiao Feng, Hsiao-Wei Wang, and Tomasz Stańczak. The forum will focus on Ethereum’s scaling, modular ecosystems, growth, and security.
Bitcoin Spot ETF
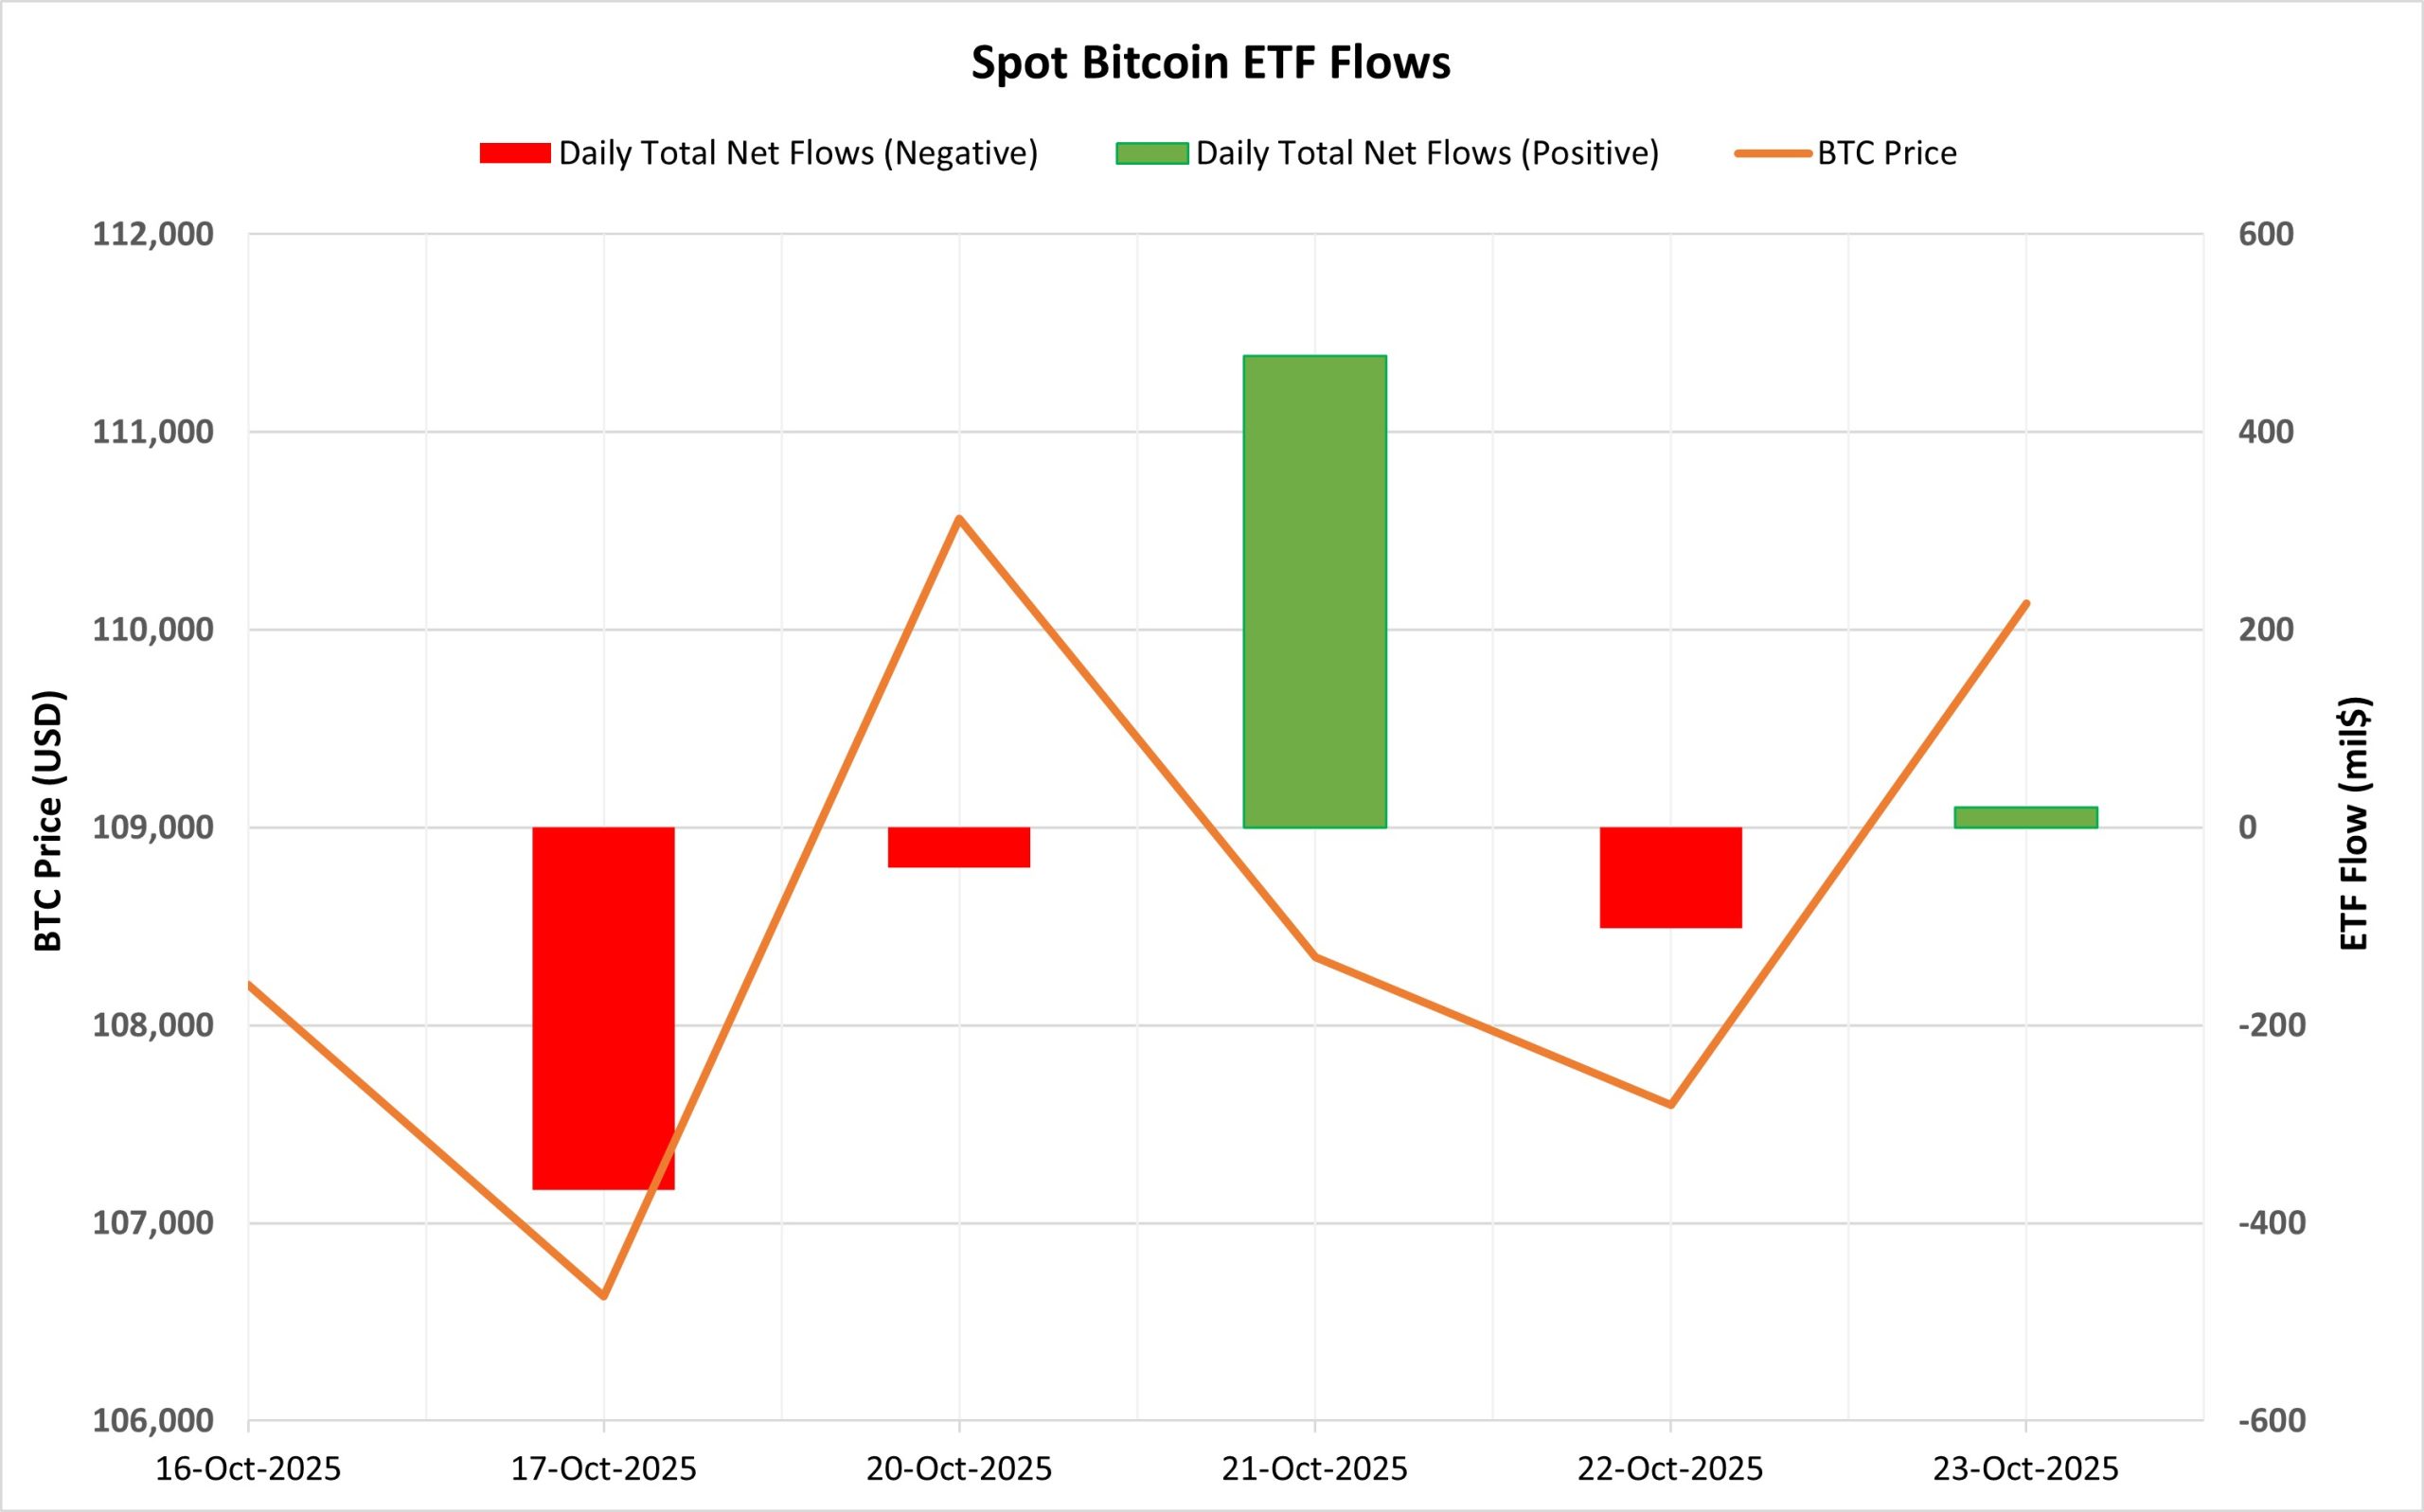
Netflow Status: Between October 17 and 23, a total of $10.9 million in net outflows occurred from Spot Bitcoin ETFs. Although Spot Bitcoin ETFs experienced a brief recovery on October 21 with a net inflow of $477.2 million, the total outflows seen on other trading days kept the overall figure in negative territory. Fund-specific outflows from Fidelity FBTC and Grayscale GBTC contributed to the overall negative total during this period.
Bitcoin Price: Bitcoin opened at $108,204 on October 17 and closed at $110,134 on October 23. The price rose by 1.78% during this period. While there was a partial recovery in price, the weak trend in ETF flows kept the market cautious. The strong inflows on October 21 stood out as a rare day supporting short-term demand growth.
Cumulative Net Inflow: By the end of the 448th trading day, the cumulative total net inflow into Spot Bitcoin ETFs had declined to $61.86 billion.
| Date | Coin | Open | Close | Change % | ETF Flow (mil$) |
|---|---|---|---|---|---|
| October 17, 2025 | BTC | 108,204 | 106,631 | -1.45% | -366.6 |
| October 20, 2025 | BTC | 108,682 | 110,563 | 1.73% | -40.4 |
| October 21, 2025 | BTC | 110,563 | 108,344 | -2.01% | 477.2 |
| October 22, 2025 | BTC | 108,344 | 107,597 | -0.69% | -101.4 |
| October 23, 2025 | BTC | 107,597 | 110,134 | 2.36% | 20.3 |
| Total (Oct 17–23, 2025) | 1.78% | -10.9 | |||
This period saw a directionless outlook in the ETF market. There was no significant difference between inflows and outflows, and investors maintained their cautious positions. Although the strong inflow on October 21 signaled short-term confidence, the overall trend does not yet point to a clear recovery. If fund flows return to stable positive territory, this could strengthen Bitcoin’s market outlook. However, if the current weak trend continues, the supportive effect on prices may remain limited.
Ethereum spot ETF
Source: Darkex Research
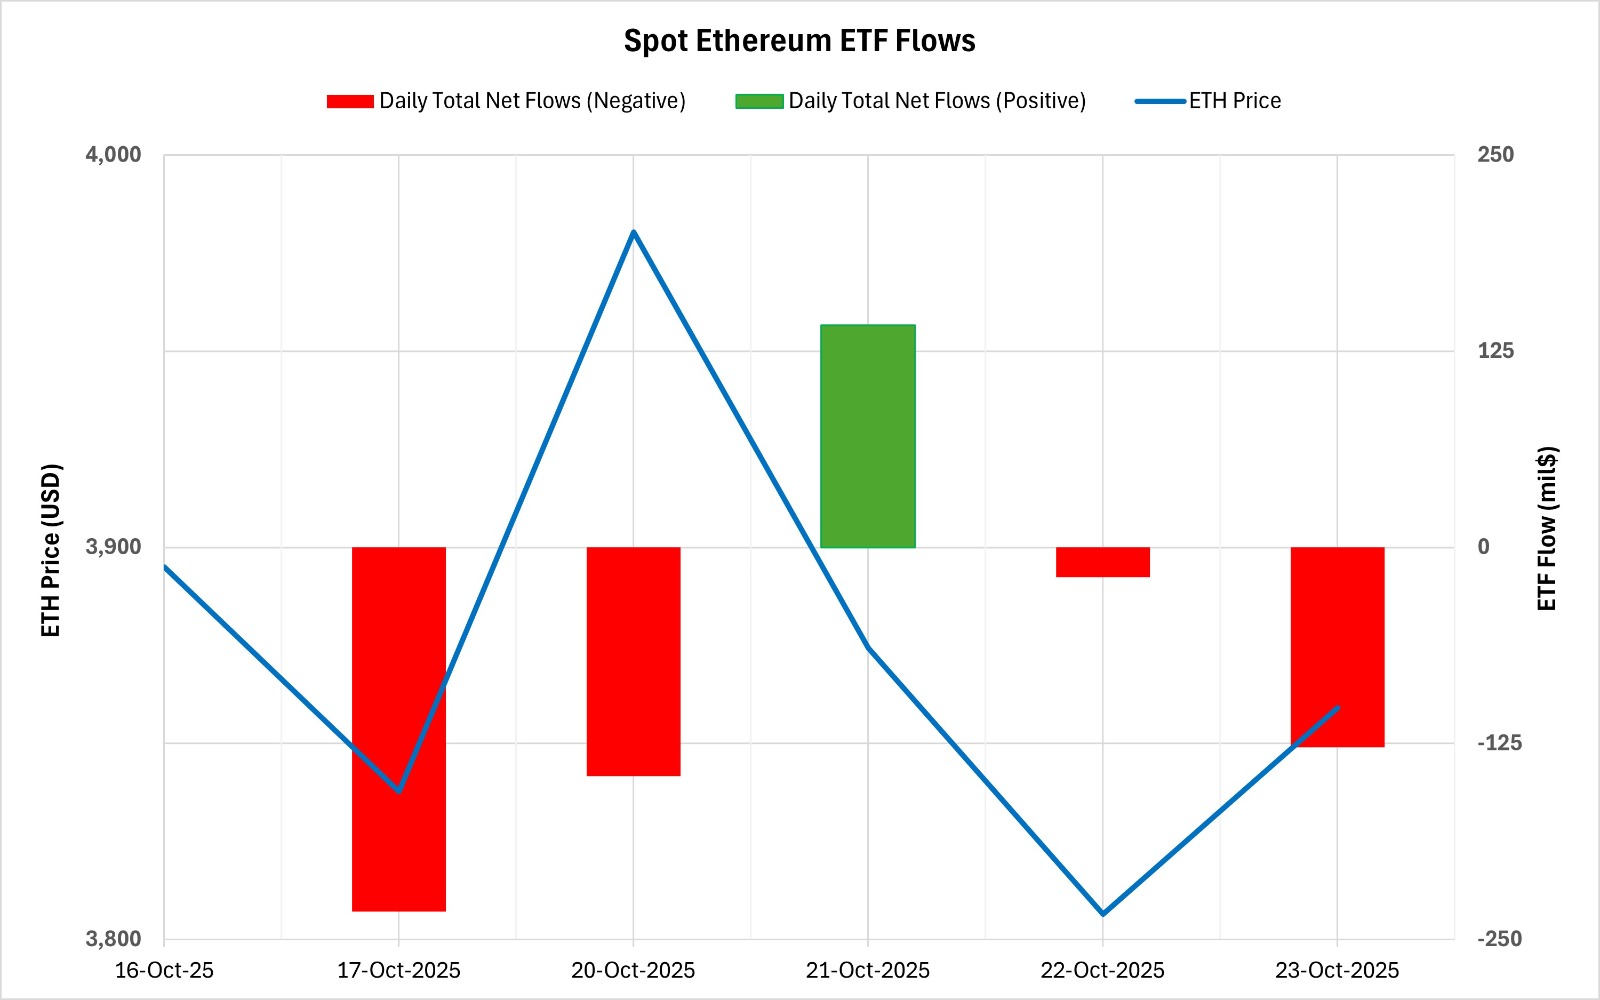
Between October 17-23, 2025, there was a total net outflow of $382.6 million from Spot Ethereum ETFs. On a daily basis, only October 21 saw a net inflow of $141.7 million, while outflows prevailed on other trading days. While there was no net flow series in fund flows, BlackRock ETHA stood out with a net outflow of $134.2 million during this period. At the end of the 316th trading day, the cumulative total net inflow of Spot Ethereum ETFs fell to $14.465 billion.
| Date | Coin | Open | Close | Change % | ETF Flow (mil$) |
|---|---|---|---|---|---|
| 17-Oct-2025 | ETH | 3,895 | 3,838 | -1.47% | -232.3 |
| 20-Oct-2025 | ETH | 3,984 | 3,980 | -0.09% | -145.7 |
| 21-Oct-2025 | ETH | 3,980 | 3,874 | -2.67% | 141.7 |
| 22-Oct-2025 | ETH | 3,874 | 3,806 | -1.75% | -18.9 |
| 23-Oct-2025 | ETH | 3,806 | 3,859 | 1.38% | -127.4 |
| Total (Oct 17–23, 2025) | -0.92% | -382.6 | |||
The Ethereum price opened at $3,895 on October 17 and closed at $3,859 on October 23. During this period, Ethereum lost 0.92% of its value. The weak price movements amplified the impact of fund outflows. Outflows on October 17 and 20, in particular, showed that investors were avoiding short-term risk and continuing to take cautious positions. While there was no clear direction in the flows overall, if fund inflows regain momentum in the coming weeks, this could contribute to a gradual recovery in the Ethereum price. However, a continued outflow trend could lead to continued pressure on the price.
Bitcoin Options Distribution
Source: Laevitas
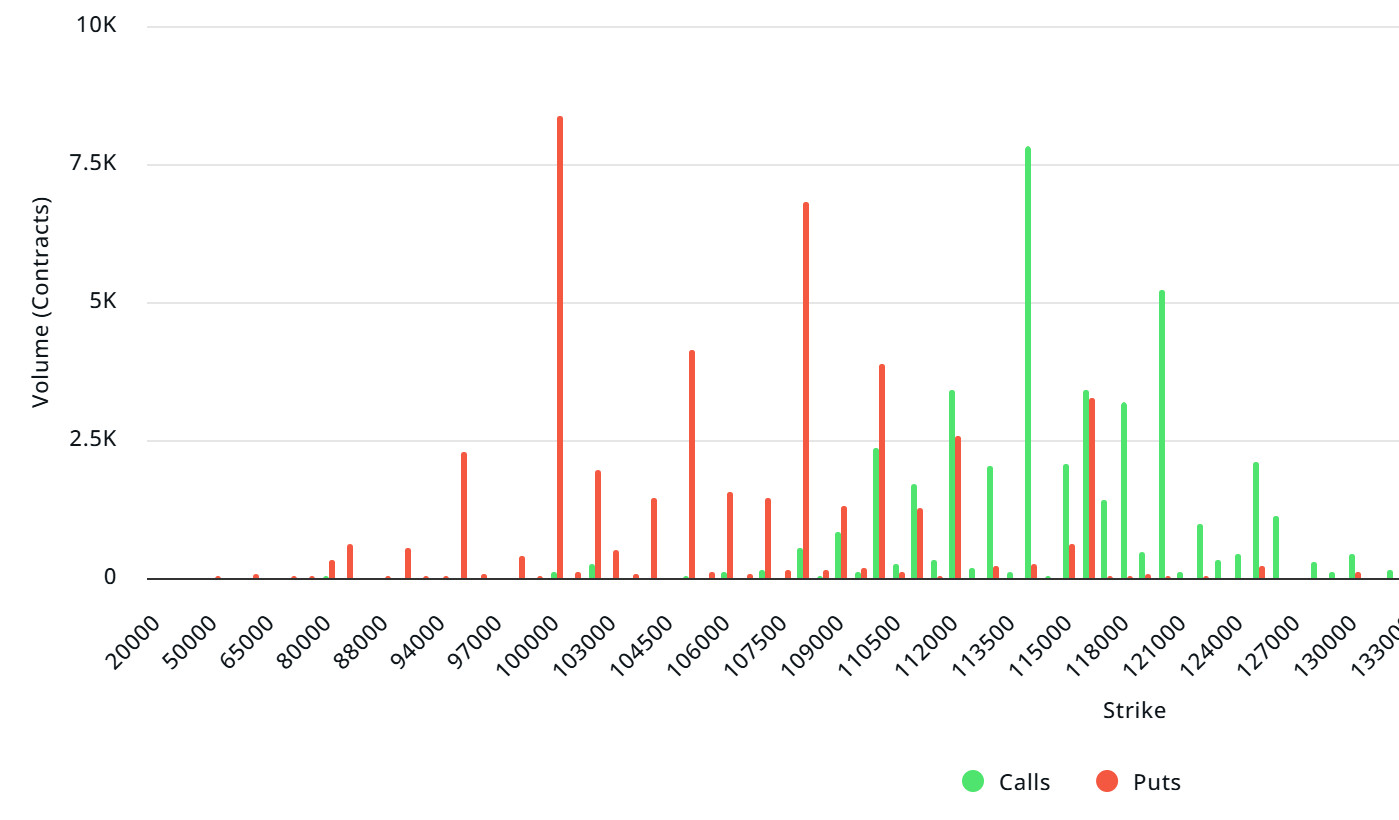
BTC: Notional: $5.73B | Put/Call: 1.03 | Max Pain: $114K
Deribit Data: Deribit data shows that BTC option contracts with a notional value of approximately $5.73 billion expire today. At the same time, looking at the risk transformation over the next week based on data from the last 24 hours, put options are dominating over call options in terms of risk hedging. Although there is a positive outlook today, the negative trend has been dominant throughout the week. When we examine the expected volatility (IV), it is well below the realized volatility (RV). On the other hand, the negative trend in the spread metric indicates a decline in market risk appetite and suggests that call options are cheap. Skew values are also pointing downward today and for the coming week.
Laevitas Data: Examining the chart, we see that put options are concentrated in a wide band between $95,000 and $110,000. Call options, on the other hand, are concentrated between $112,000 and $120,000, with concentration decreasing towards higher levels. At the same time, the $108,000 level appears to be support, while the $114,000 level appears to be resistance. On the other hand, there are 8.37K put options at the $100,000 level, peaking here and showing a decrease in put volume after this level. Furthermore, 7.88K call option contracts peak at the $114,000 level. Looking at the options market, we see that put contracts dominate on a daily and weekly basis.
Option Maturity:
Put/Call Ratio and Maximum Pain Point: Looking at the options in the latest 7-day data from Laevitas, the number of call options decreased by approximately 20% compared to last week, reaching 159.97K. In contrast, the number of put options decreased by 4% compared to last week, reaching 184.39K. The put/call ratio for options is set at 1.03. This indicates that there is less demand for call options than put options among investors. Bitcoin’s maximum pain point is seen at $114,000. BTC is currently priced at $111,000, and if it fails to break above the pain point of $114,000, a continued decline is foreseeable.
Ethereum Options Distribution
Source: Laevitas
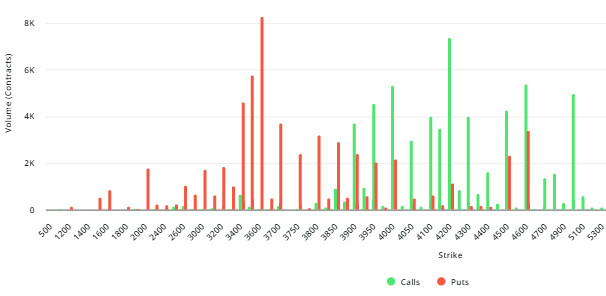
ETH: $0.83 B notional | Put/Call: 0.79 | Max Pain: $3,950
Laevitas Data: Looking at the data in the chart, we see that put options are concentrated particularly at price levels between $3,600 and $4,000. The highest put volume is at the $3,600 level with approximately 9K contracts, and this level can be considered a potential support zone. On the other hand, call options show a notable concentration between $4,000 and $4,200. The $4,200 level stands out with a high call volume of approximately 8K contracts. This level can be considered an important resistance zone in the market.
Deribit Data: Looking at ATM volatility, we see it at 66.33, down 5.50% over the last 24 hours. This indicates some pressure on option premiums. The 25 delta risk reversal (RR) value is at -6.91 and has fallen by 6.91% on a daily basis. This shows that put demand is stronger than call option demand. Looking at open interest (OI), it stands at $119.17 million and has increased by 52.41%, which leads us to assume that the number of players in the market is still increasing and expectations are still high.Option Maturity:
Ethereum options with a nominal value of $0.83 billion expired on October 24. The Max Pain level was calculated at $3,950, while the put/call ratio stood at 0.79.
Legal Notice
The investment information, comments, and recommendations contained in this document do not constitute investment advisory services. Investment advisory services are provided by authorized institutions on a personal basis, taking into account the risk and return preferences of individuals. The comments and recommendations contained in this document are of a general nature. These recommendations may not be suitable for your financial situation and risk and return preferences. Therefore, making an investment decision based solely on the information contained in this document may not result in outcomes that align with your expectations.
