
Active Addresses
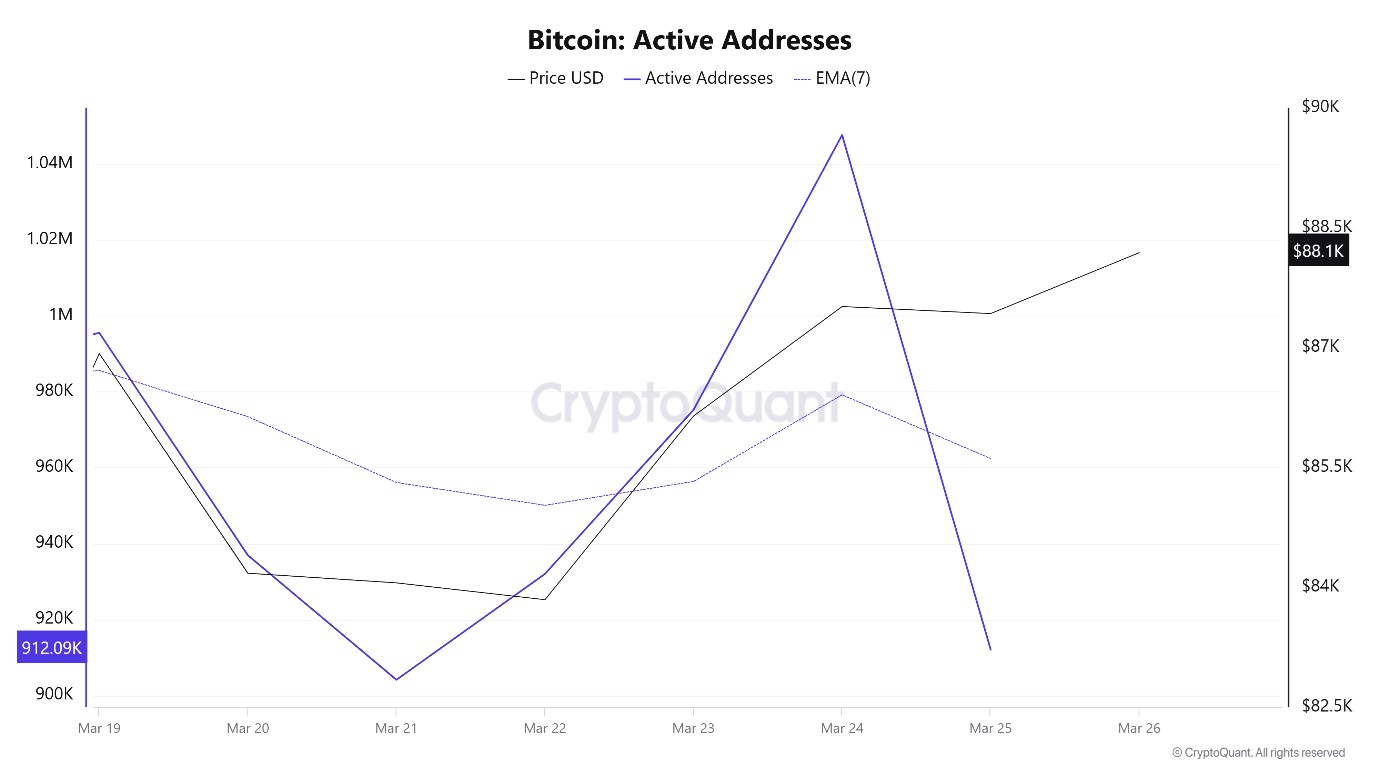
In terms of active addresses, there were 1,047,599 active entries to the BTC network between March 19 and March 26, 2025, this week. During this period, Bitcoin rose from $82,000 to $88,000. On the chart, we see that Bitcoin purchases changed direction in the area where the price and the number of active addresses intersect. When we follow the 7-day simple moving average, it is observed that the price followed an upward trend on the dates when this average also crossed the price. This situation indicates that the Bitcoin price is experiencing entries from the $ 83,000 levels.
Active Sending Addresses
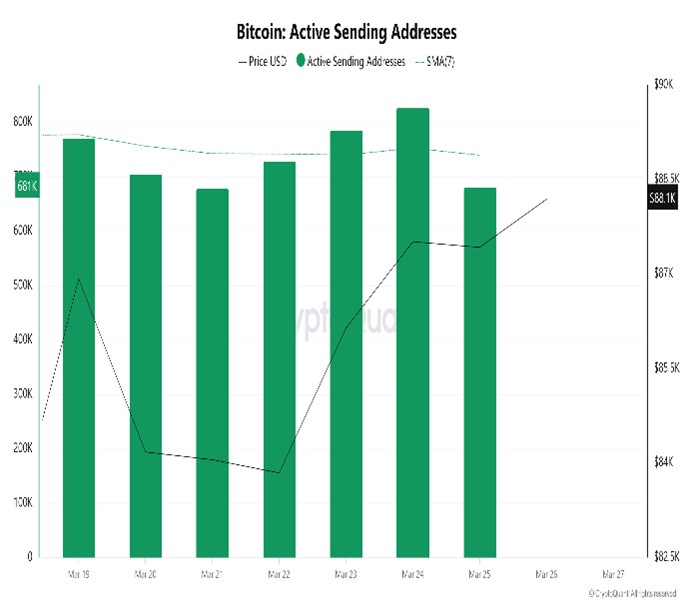
With the Black Line (price line) in active shipping addresses, there has been a significant drop in active shipping addresses after March 22. On the day the price hit its lowest point, active sending addresses rose to 729,636, indicating that buyers sold their positions as Bitcoin remained at $83,843 for a while. As a result, it is seen that price drops cause an acceleration in sending addresses.
Active Receiving Addresses
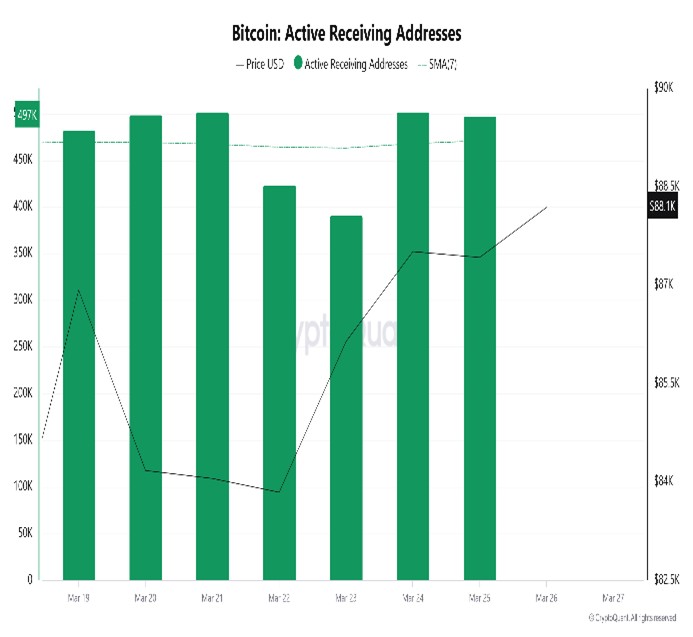
With the Black Line (price line) in active shipping addresses, there has been a significant drop in active shipping addresses after March 23. On the day when the price hit its lowest point, active sending addresses rose to 423,592 , indicating that buyers sold their positions as Bitcoin stayed around the $83,000 level for a while. As a result, price drops seem to cause an acceleration in sending addresses.
Breakdowns
MRVR
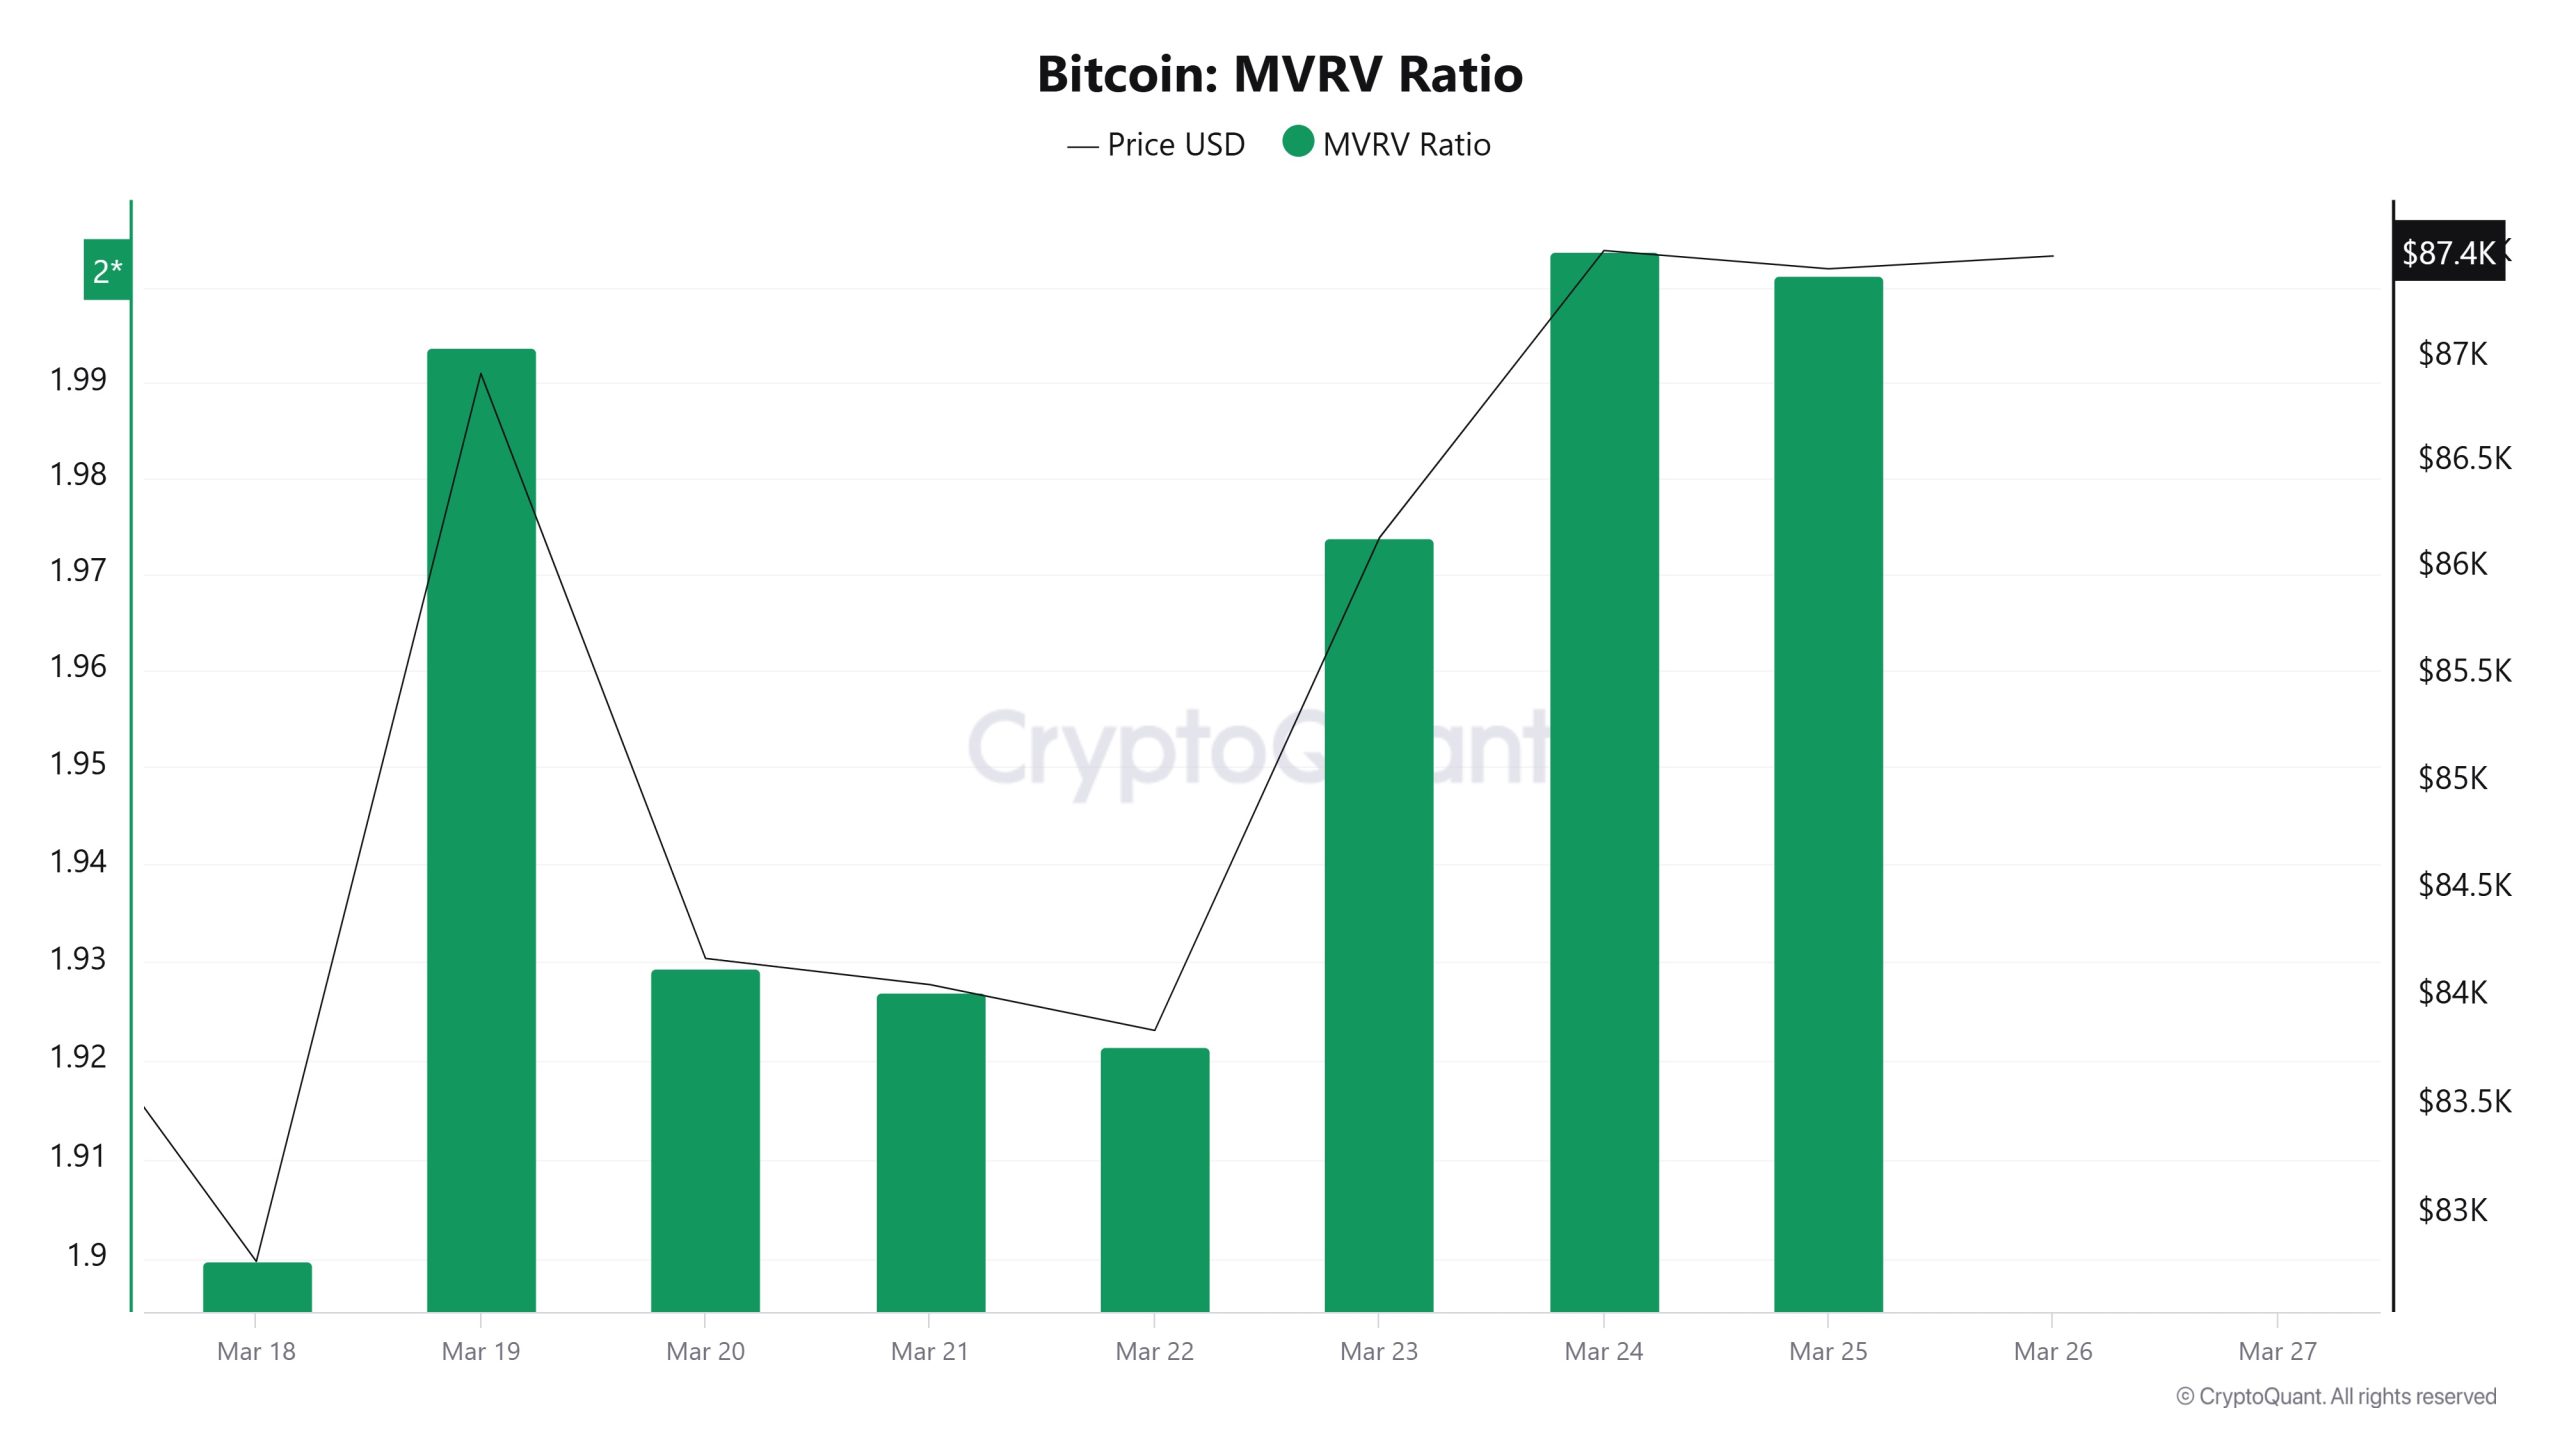
On March 19, the Bitcoin price was 86,923 while the MVRV Ratio was 1.99. As of March 25, the Bitcoin price was 87,424, while the MVRV Ratio was 2. Compared to last week, there was a 0.58% increase in Bitcoin price and a 0.50% increase in MVRV Ratio.
Realized Price
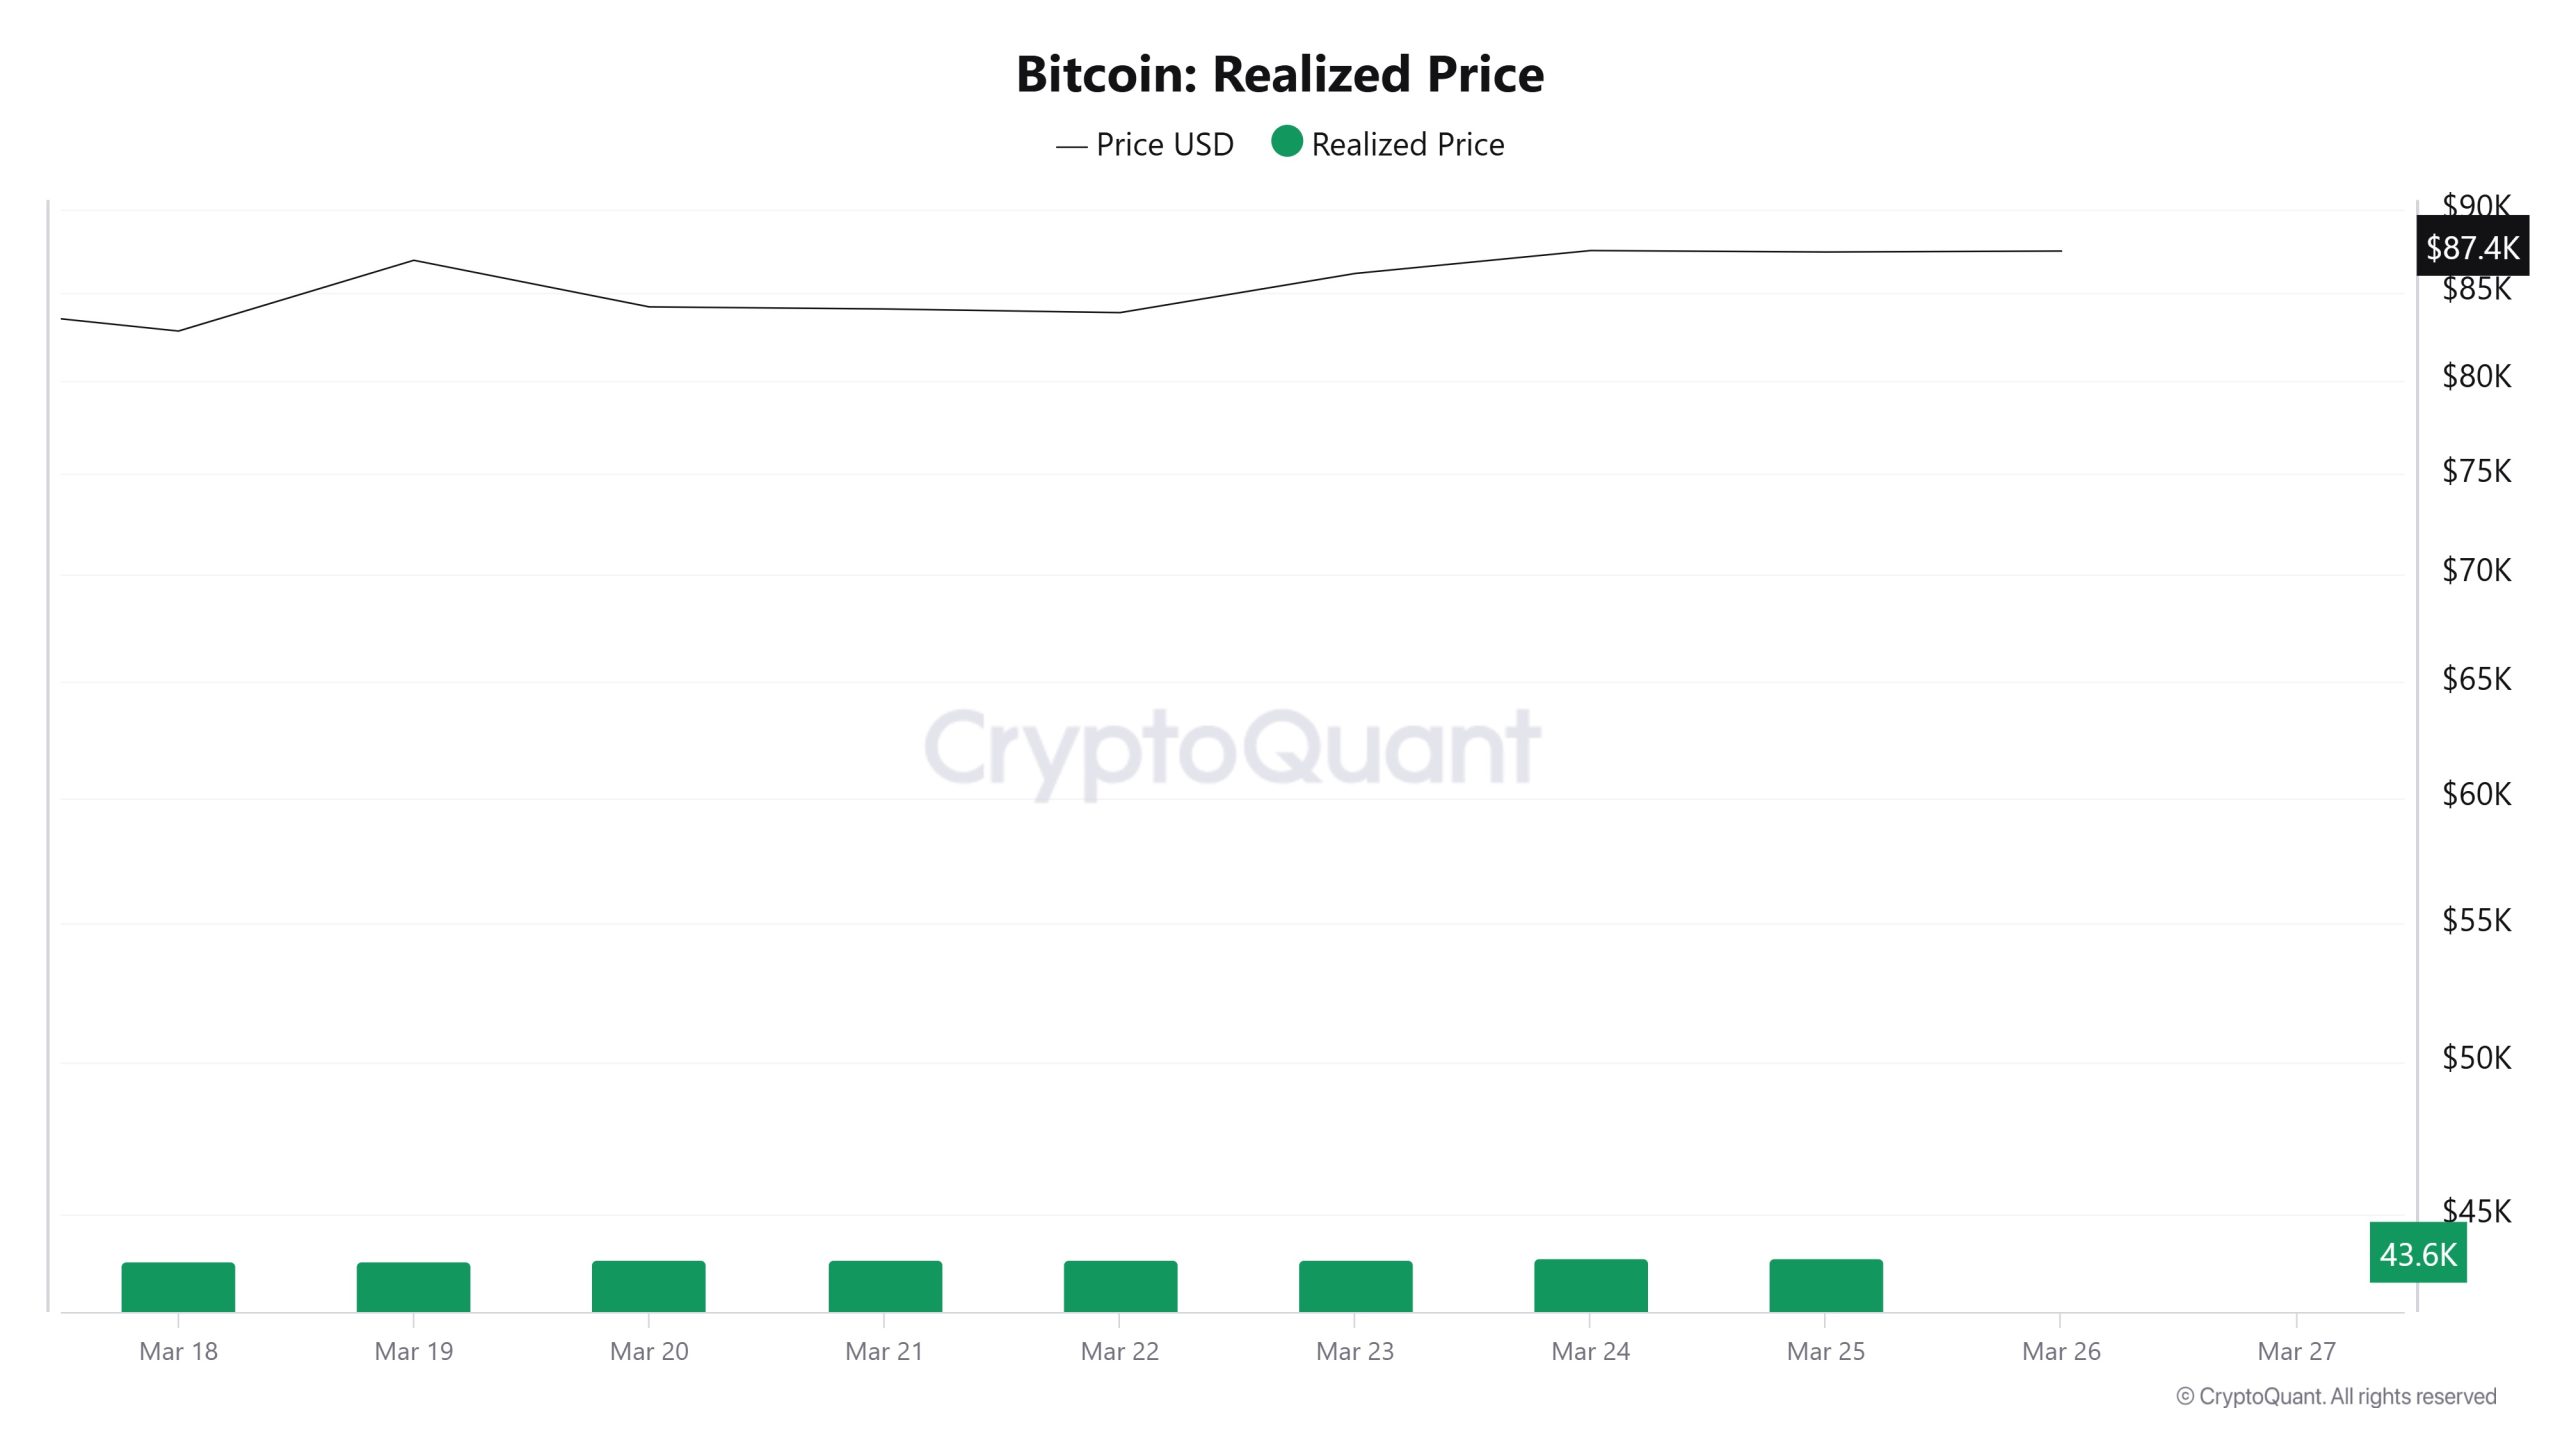
On March 19, the Bitcoin price was 86,923 while the Realized Price was 43,598. As of March 25th, the Bitcoin price was 87,424 while the Realized Price was 43,683. Compared to last week, there was a 0.58% increase in Bitcoin price and a 0.20% increase in Realized Price.
Spent Output Profit Ratio (SOPR)
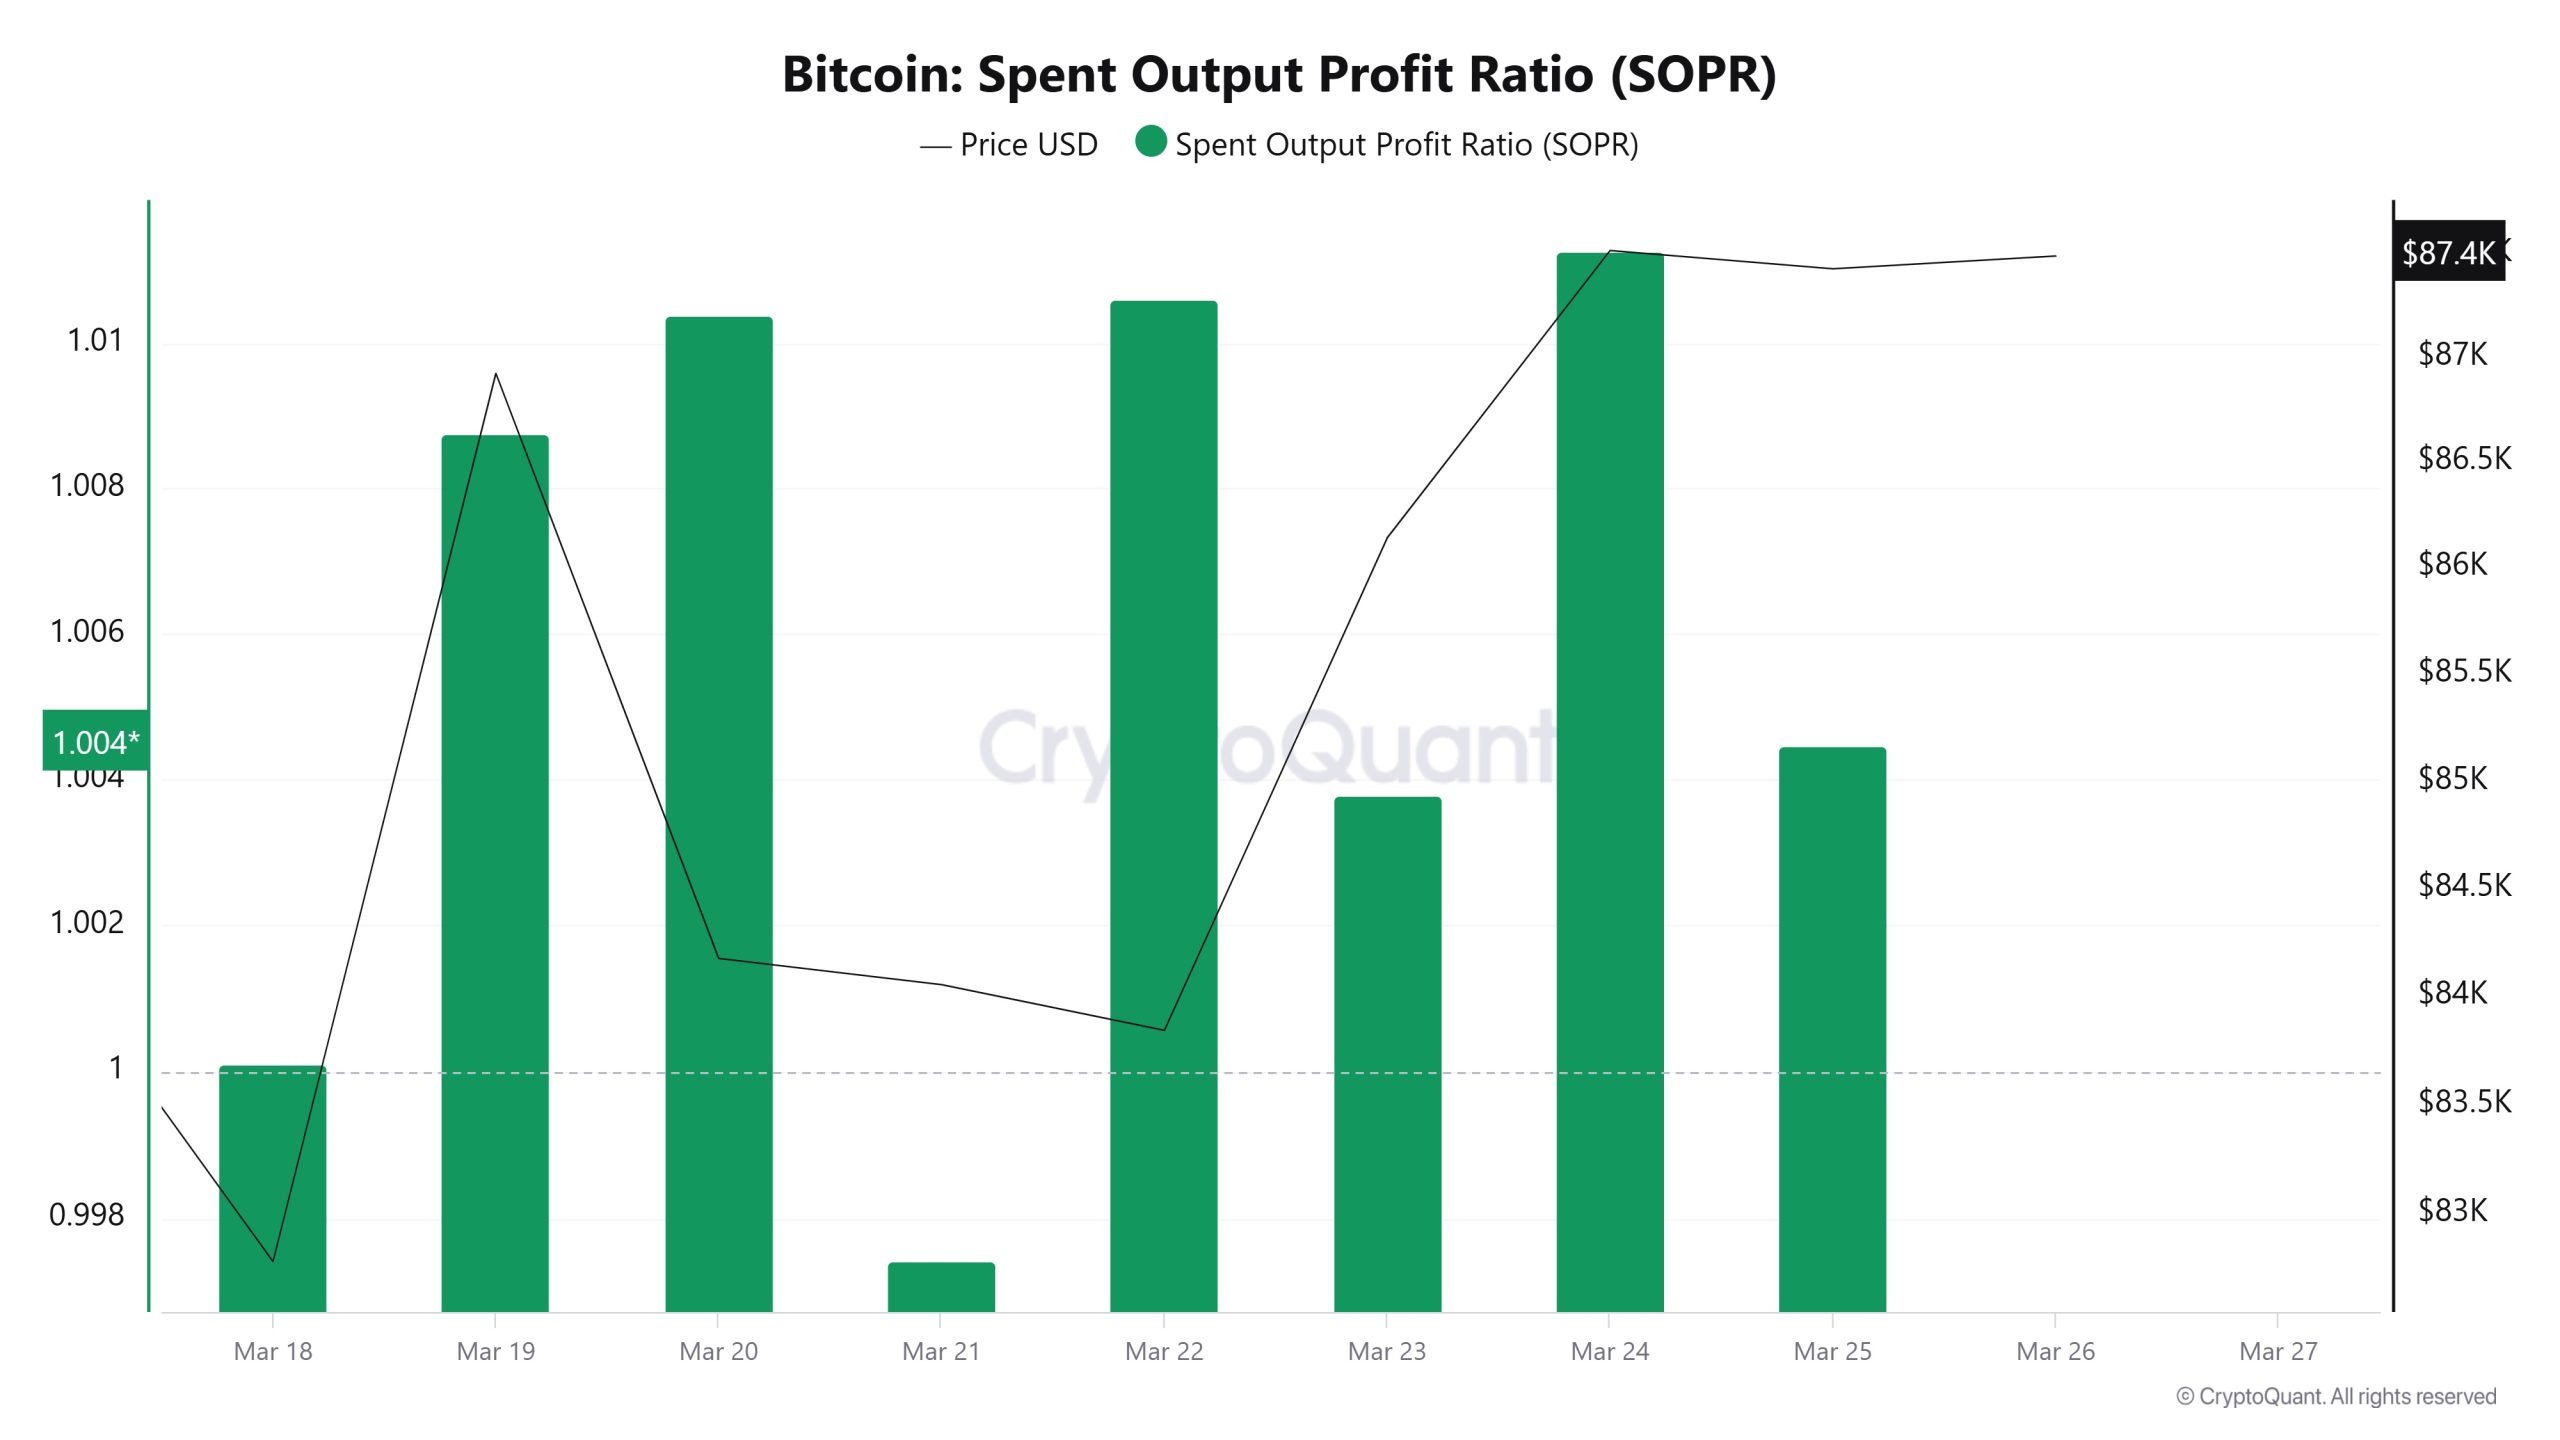
On March 19, the Bitcoin price was 86,923 while the SOPR metric was 1.008. As of March 25, the Bitcoin price was at 87,424 while the SOPR metric was at 1,004. Compared to last week, Bitcoin price increased by 0.58% while SOPR metric decreased by 0.40%.
Derivatives
Open Interest
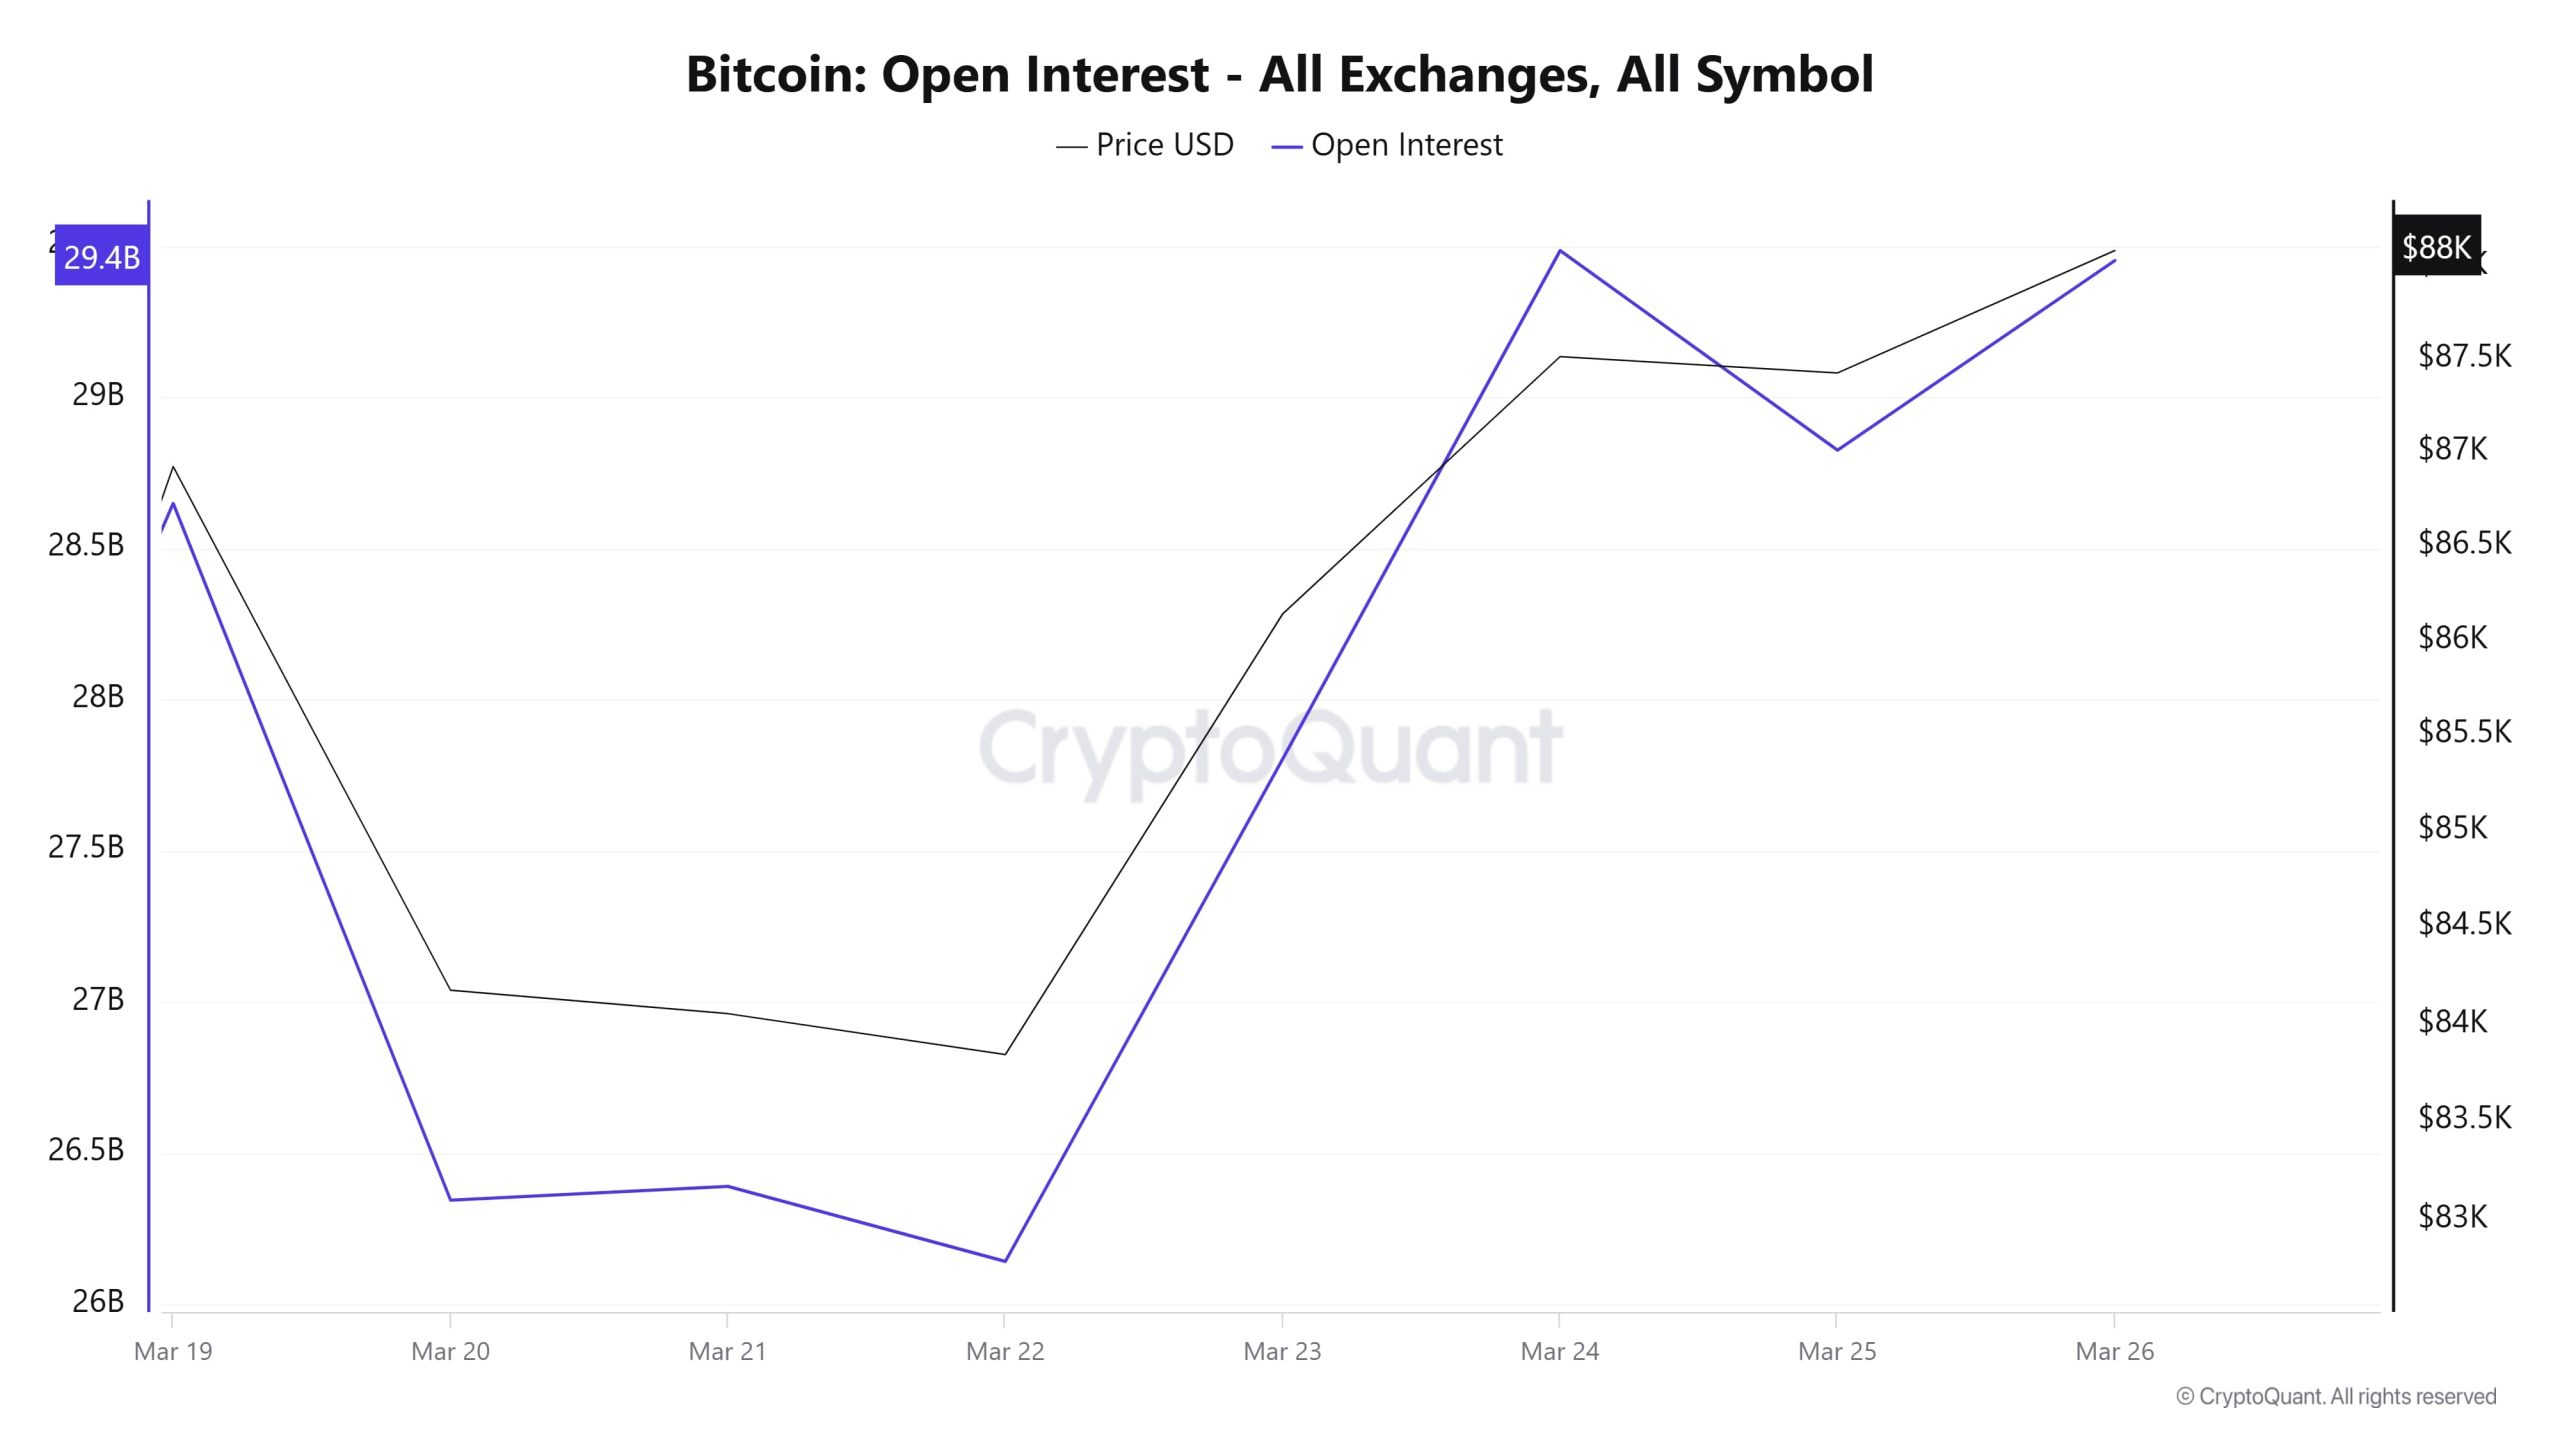
The first thing to notice in the chart is the sudden drop around March 19. Both the BTC price and the open interest level fell significantly. This suggests that a large amount of positions were closed and there was a significant outflow of liquidity from the market. Such drops in OI usually occur as leveraged trades are liquidated or traders reduce their positions due to uncertainty. However, this decline did not last long and a strong rebound was observed from March 22. Open interest and the price started to rise at the same time, indicating that new entries into the market have increased and investors have started to open positions again. This usually indicates that the market is bullish and investors are willing to take more risk. As of now, the price has reached $88,000 and open interest has risen accordingly. The fact that OI is increasing along with the price may suggest that the uptrend is strong. Traders are opening new long positions and the market seems to support an upward movement in general. However, this may bring the risk of excessive leverage.
Funding Rate
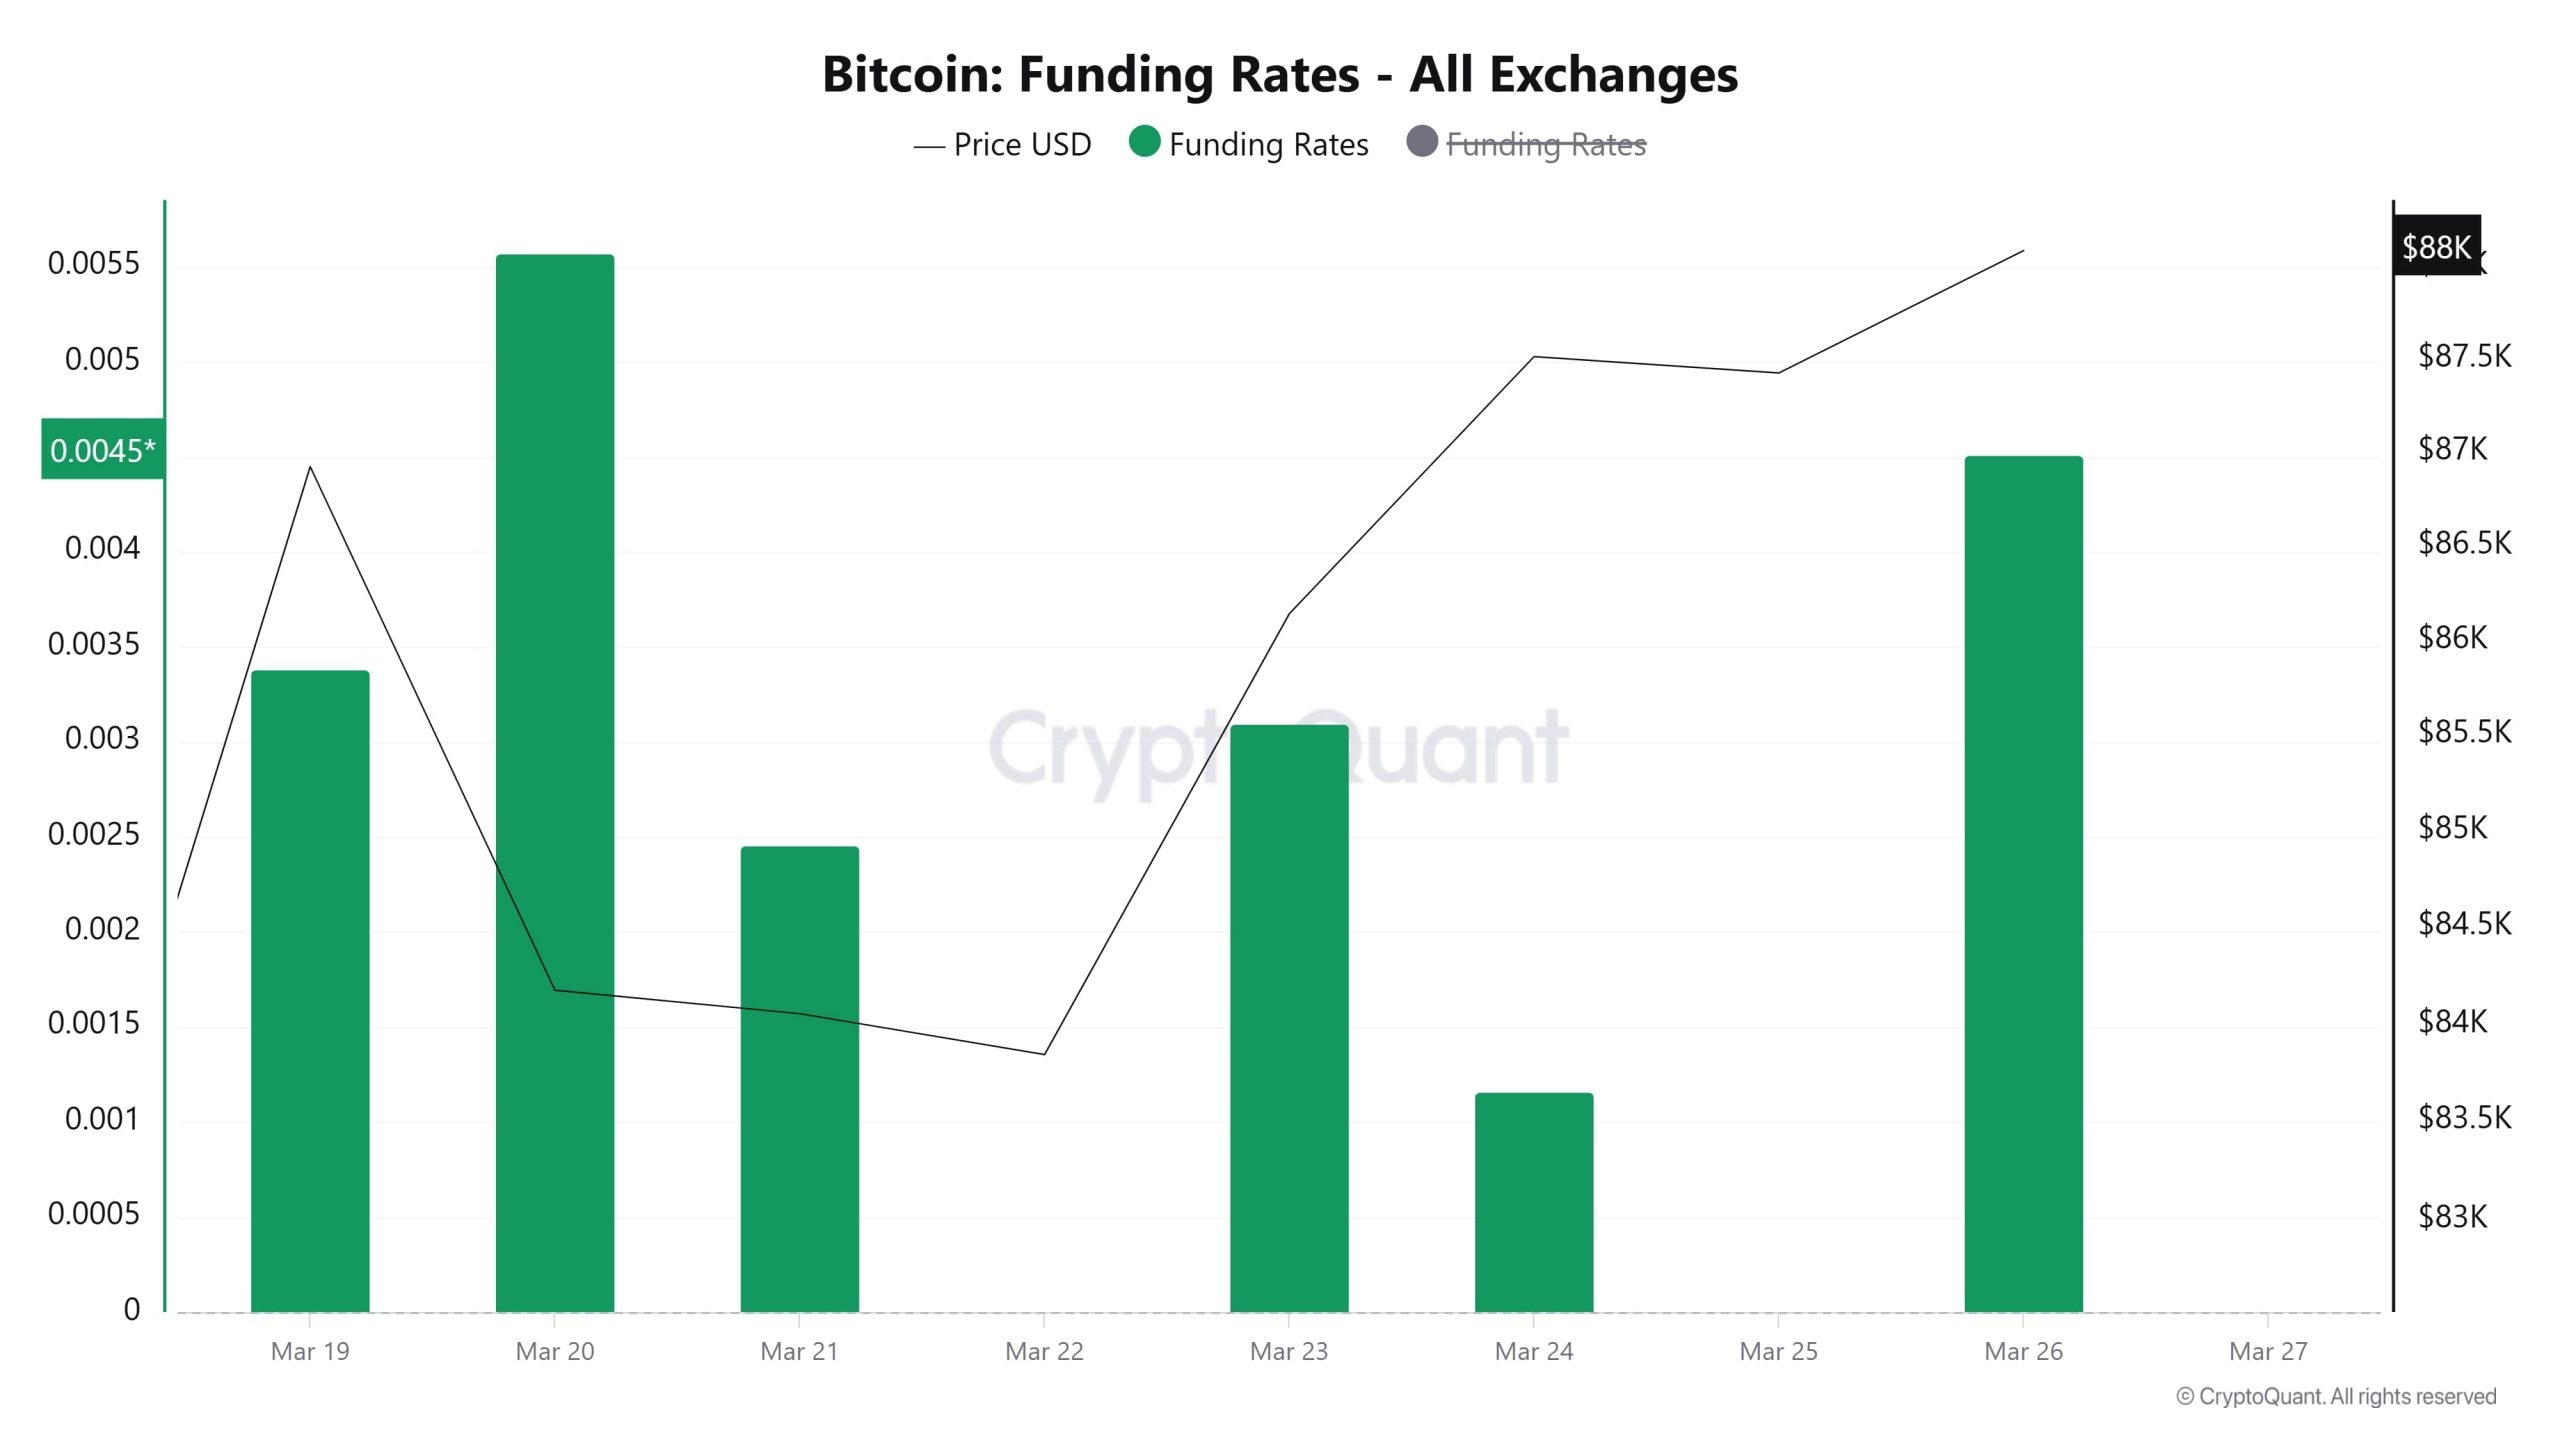
The funding rate chart shows that the market is dominated by long positions. On March 19-20, the funding rate rose, followed by a sharp decline and a parallel decline in the price. As of March 22nd, the funding rate started to rise again and the price recovered. At the moment, the funding rate and the price are rising together, indicating that investors are increasing their long positions. However, it is important to keep in mind that an excessively high funding rate increases the risk of a potential correction due to excessive leverage in the market. It is important to keep the funding rate balanced for a healthy rise.
Long & Short Liquidations
After US President Donald Trump’s statements that there could be flexibility on tariffs, the US markets and the crypto market brought along slight rises. With the rises, a short position of 516.7 million dollars was liquidated. In addition, 147.4 million dollars of long positions were liquidated.
| Date | Long Amount (Million $) | Short Amount (Million $) |
|---|---|---|
| March 19 | 20.76 | 278.50 |
| March 20 | 57.30 | 26.47 |
| March 21 | 20.42 | 13.51 |
| March 22 | 3.53 | 1.49 |
| March 23 | 1.85 | 20.09 |
| March 24 | 24.98 | 157.59 |
| March 25 | 18.57 | 19.05 |
| Total | 147.41 | 516.70 |
Supply Distribution
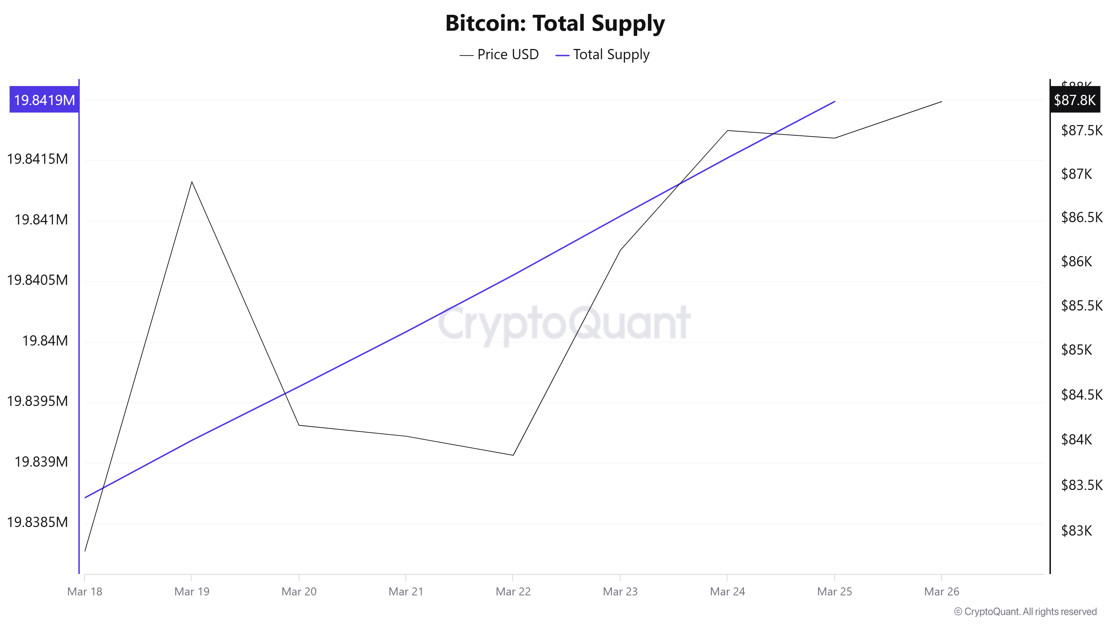
Total Supply: It reached 19,838,711 units, up about 0.0165% from last week.
New Supply: The amount of BTC produced this week was 3,275.
Velocity: Velocity, which was 13.54 last week, was 13.39 as of March 18.
| Wallet Category | 18.03.2025 | 25.03.2025 | Change (%) |
|---|---|---|---|
| < 1 BTC | 8.5373% | 8.5450% | 0.09% |
| 1 – 10 BTC | 11.77% | 11.76% | -0.08% |
| 10 – 100 BTC | 24.837% | 24.757% | -0.032% |
| 100 – 1k BTC | 28.064% | 28.162% | 0.35% |
| 1k – 10k BTC | 18.417% | 18.411% | -0.03% |
| 10k+ BTC | 8.373% | 8.360% | -0.16% |
In the wallet distribution of the current supply, a slight increase of 0.09% was observed in the < 1 BTC category, while holders of 1 – 10 BTC experienced a small decrease of 0.08%. The 10 – 100 BTC range saw a 0.32% decrease, while the 100 – 1K BTC segment increased by 0.35%. 1K – 10K BTC holders saw a small decrease of 0.03%, while the 10K+ BTC category saw a decrease of 0.16%.
Exchange Reserve
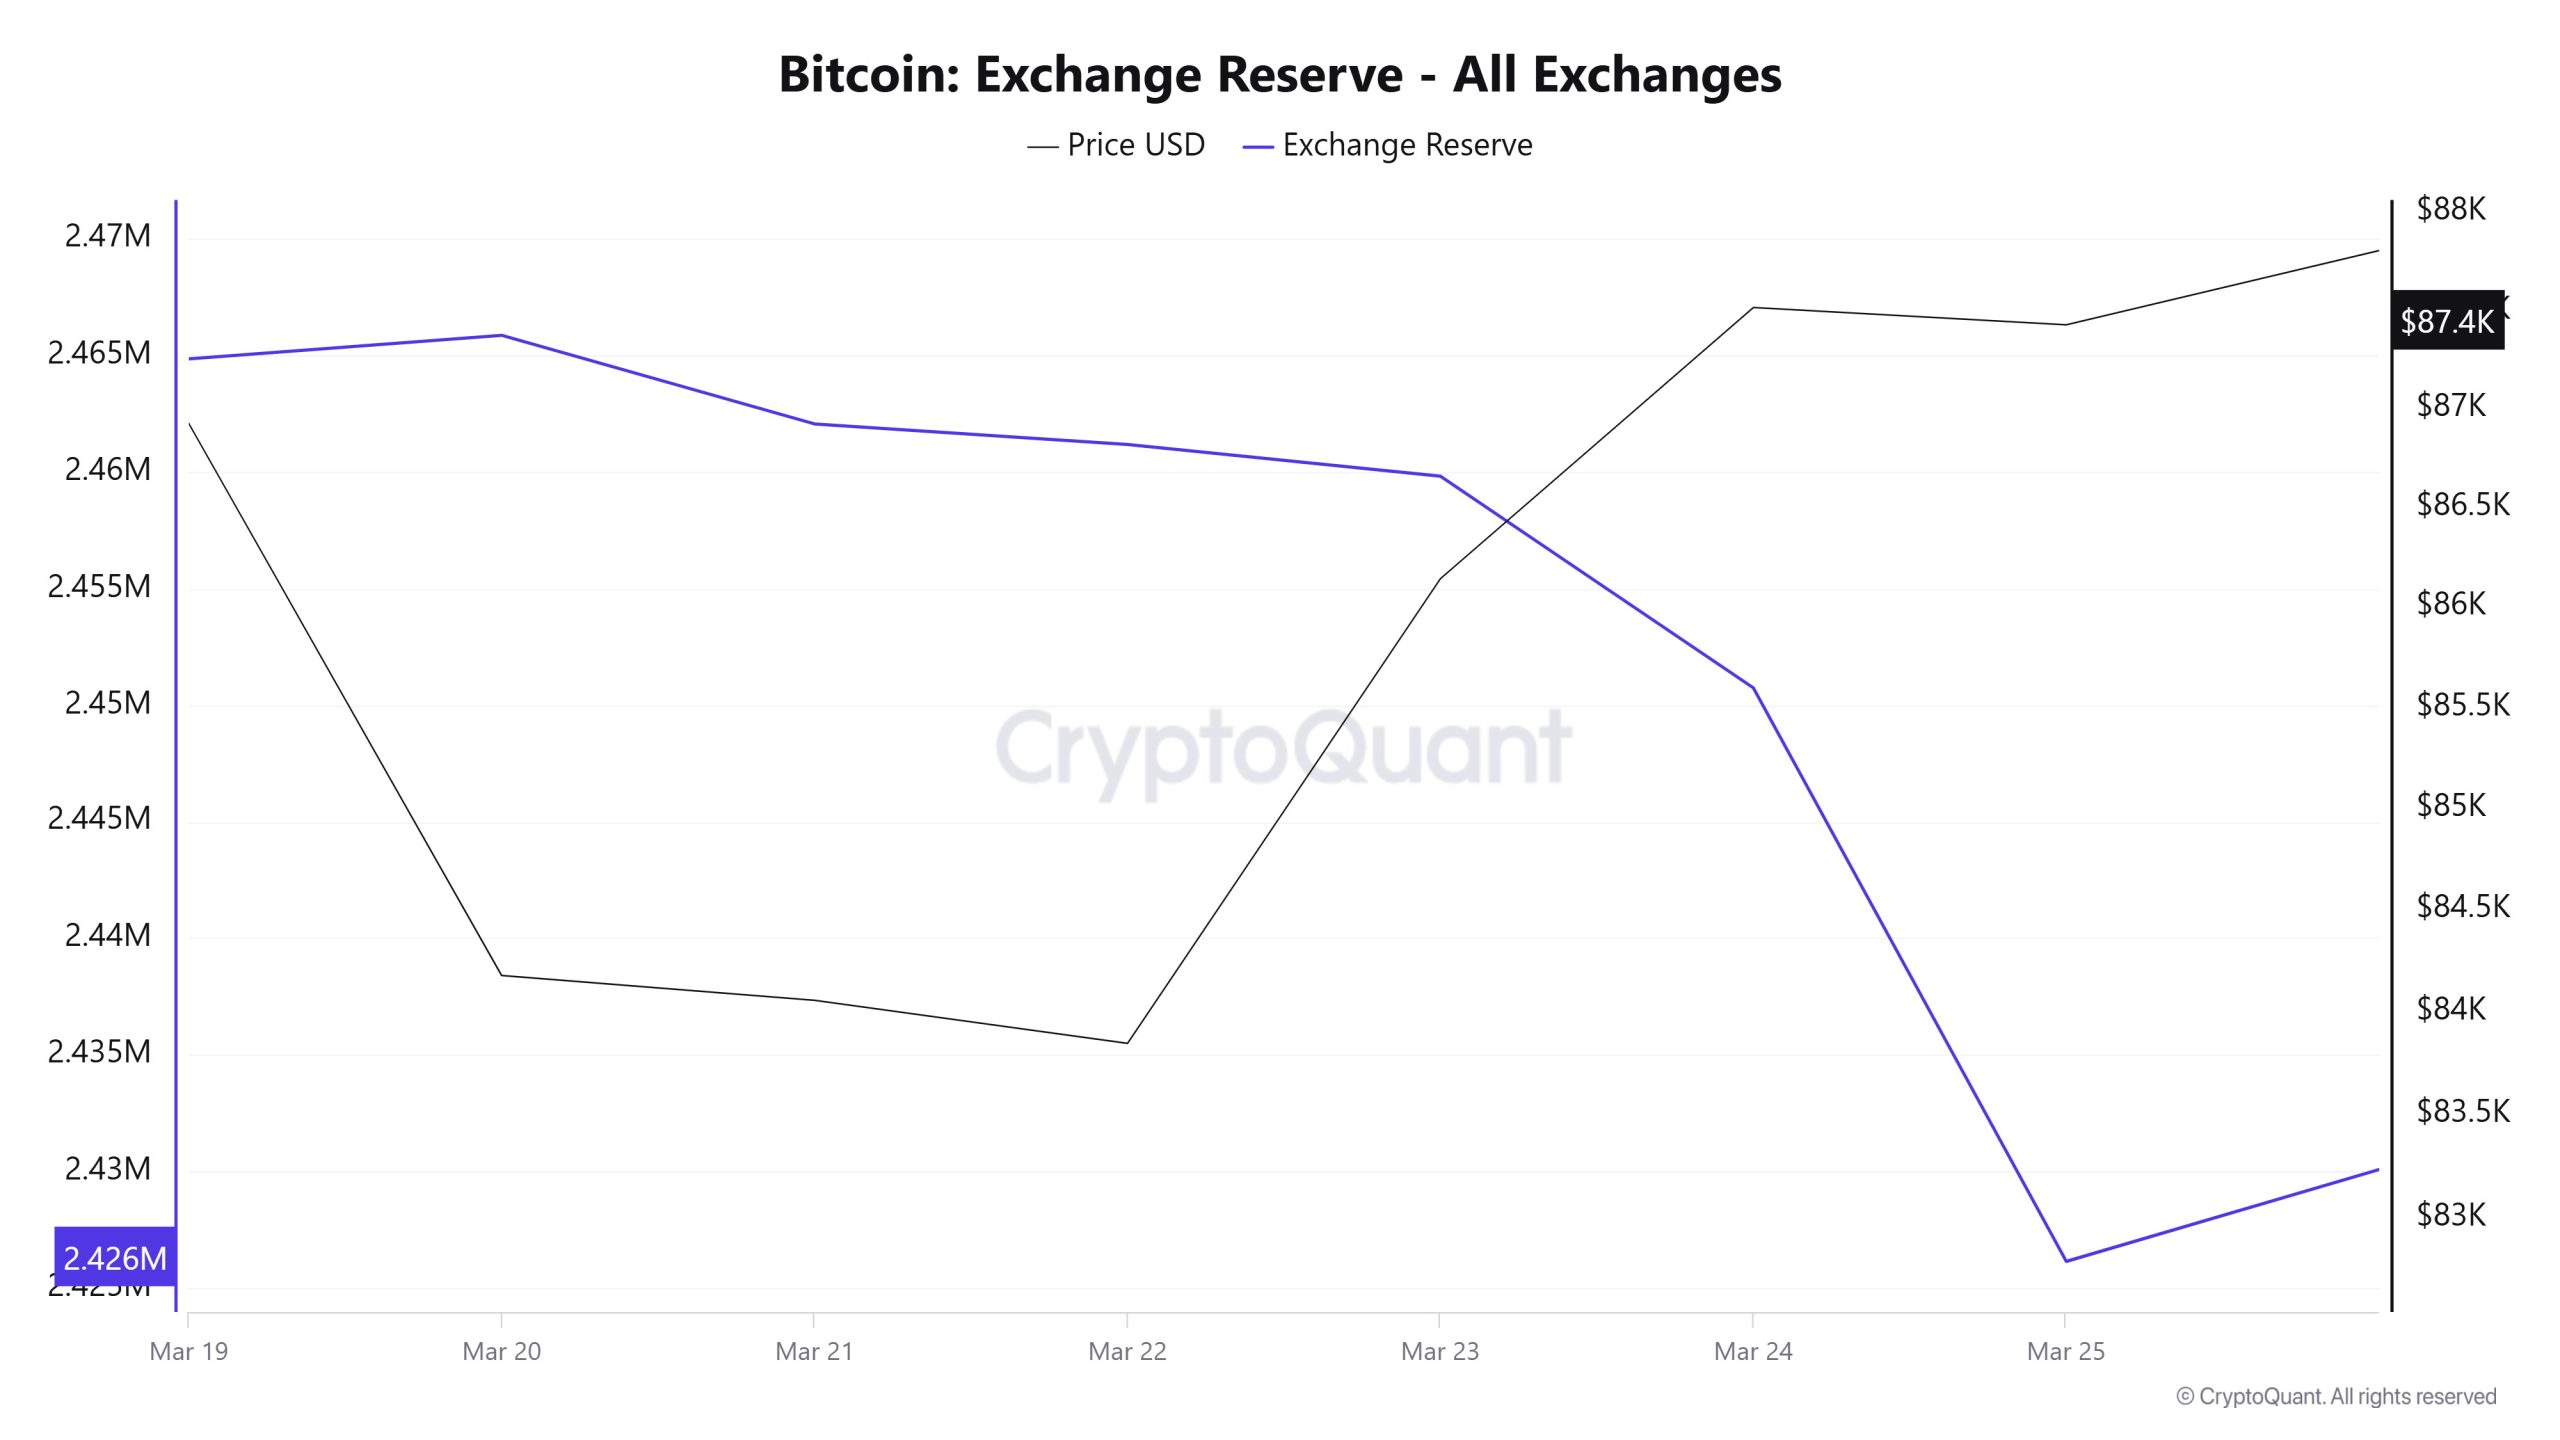
Between March 19-25, 2025, Bitcoin reserves on exchanges decreased from 2,464,857 BTC to 2,426,130 BTC. In total, there was a net outflow of 38,727 BTC during this period and exchanges’ Bitcoin reserves decreased by 1.57%. The Bitcoin price increased by approximately 0.5% during this period. On March 19, 2025, Bitcoin closed at $86,924, and on March 25, 2025, it closed at $87,424. Strong outflows from exchanges may have an upward impact on the price by reducing supply as investors turn to a long-term holding strategy.
| Date | Exchange Inflow | Exchange Outflow | Exchange Netflow | Exchange Reserve | BTC Price |
|---|---|---|---|---|---|
| 19-Mar | 33,031 | 37,681 | -4,650 | 2,464,857 | 86,924 |
| 20-Mar | 33,949 | 32,937 | 1,012 | 2,465,869 | 84,175 |
| 21-Mar | 28,052 | 31,855 | -3,802 | 2,462,066 | 84,054 |
| 22-Mar | 7,786 | 8,667 | -881 | 2,461,185 | 83,843 |
| 23-Mar | 8,213 | 9,573 | -1,360 | 2,459,826 | 86,142 |
| 24-Mar | 33,118 | 42,201 | -9,083 | 2,450,743 | 87,512 |
| 25-Mar | 33,885 | 58,497 | -24,612 | 2,426,130 | 87,424 |
Fees and Revenues
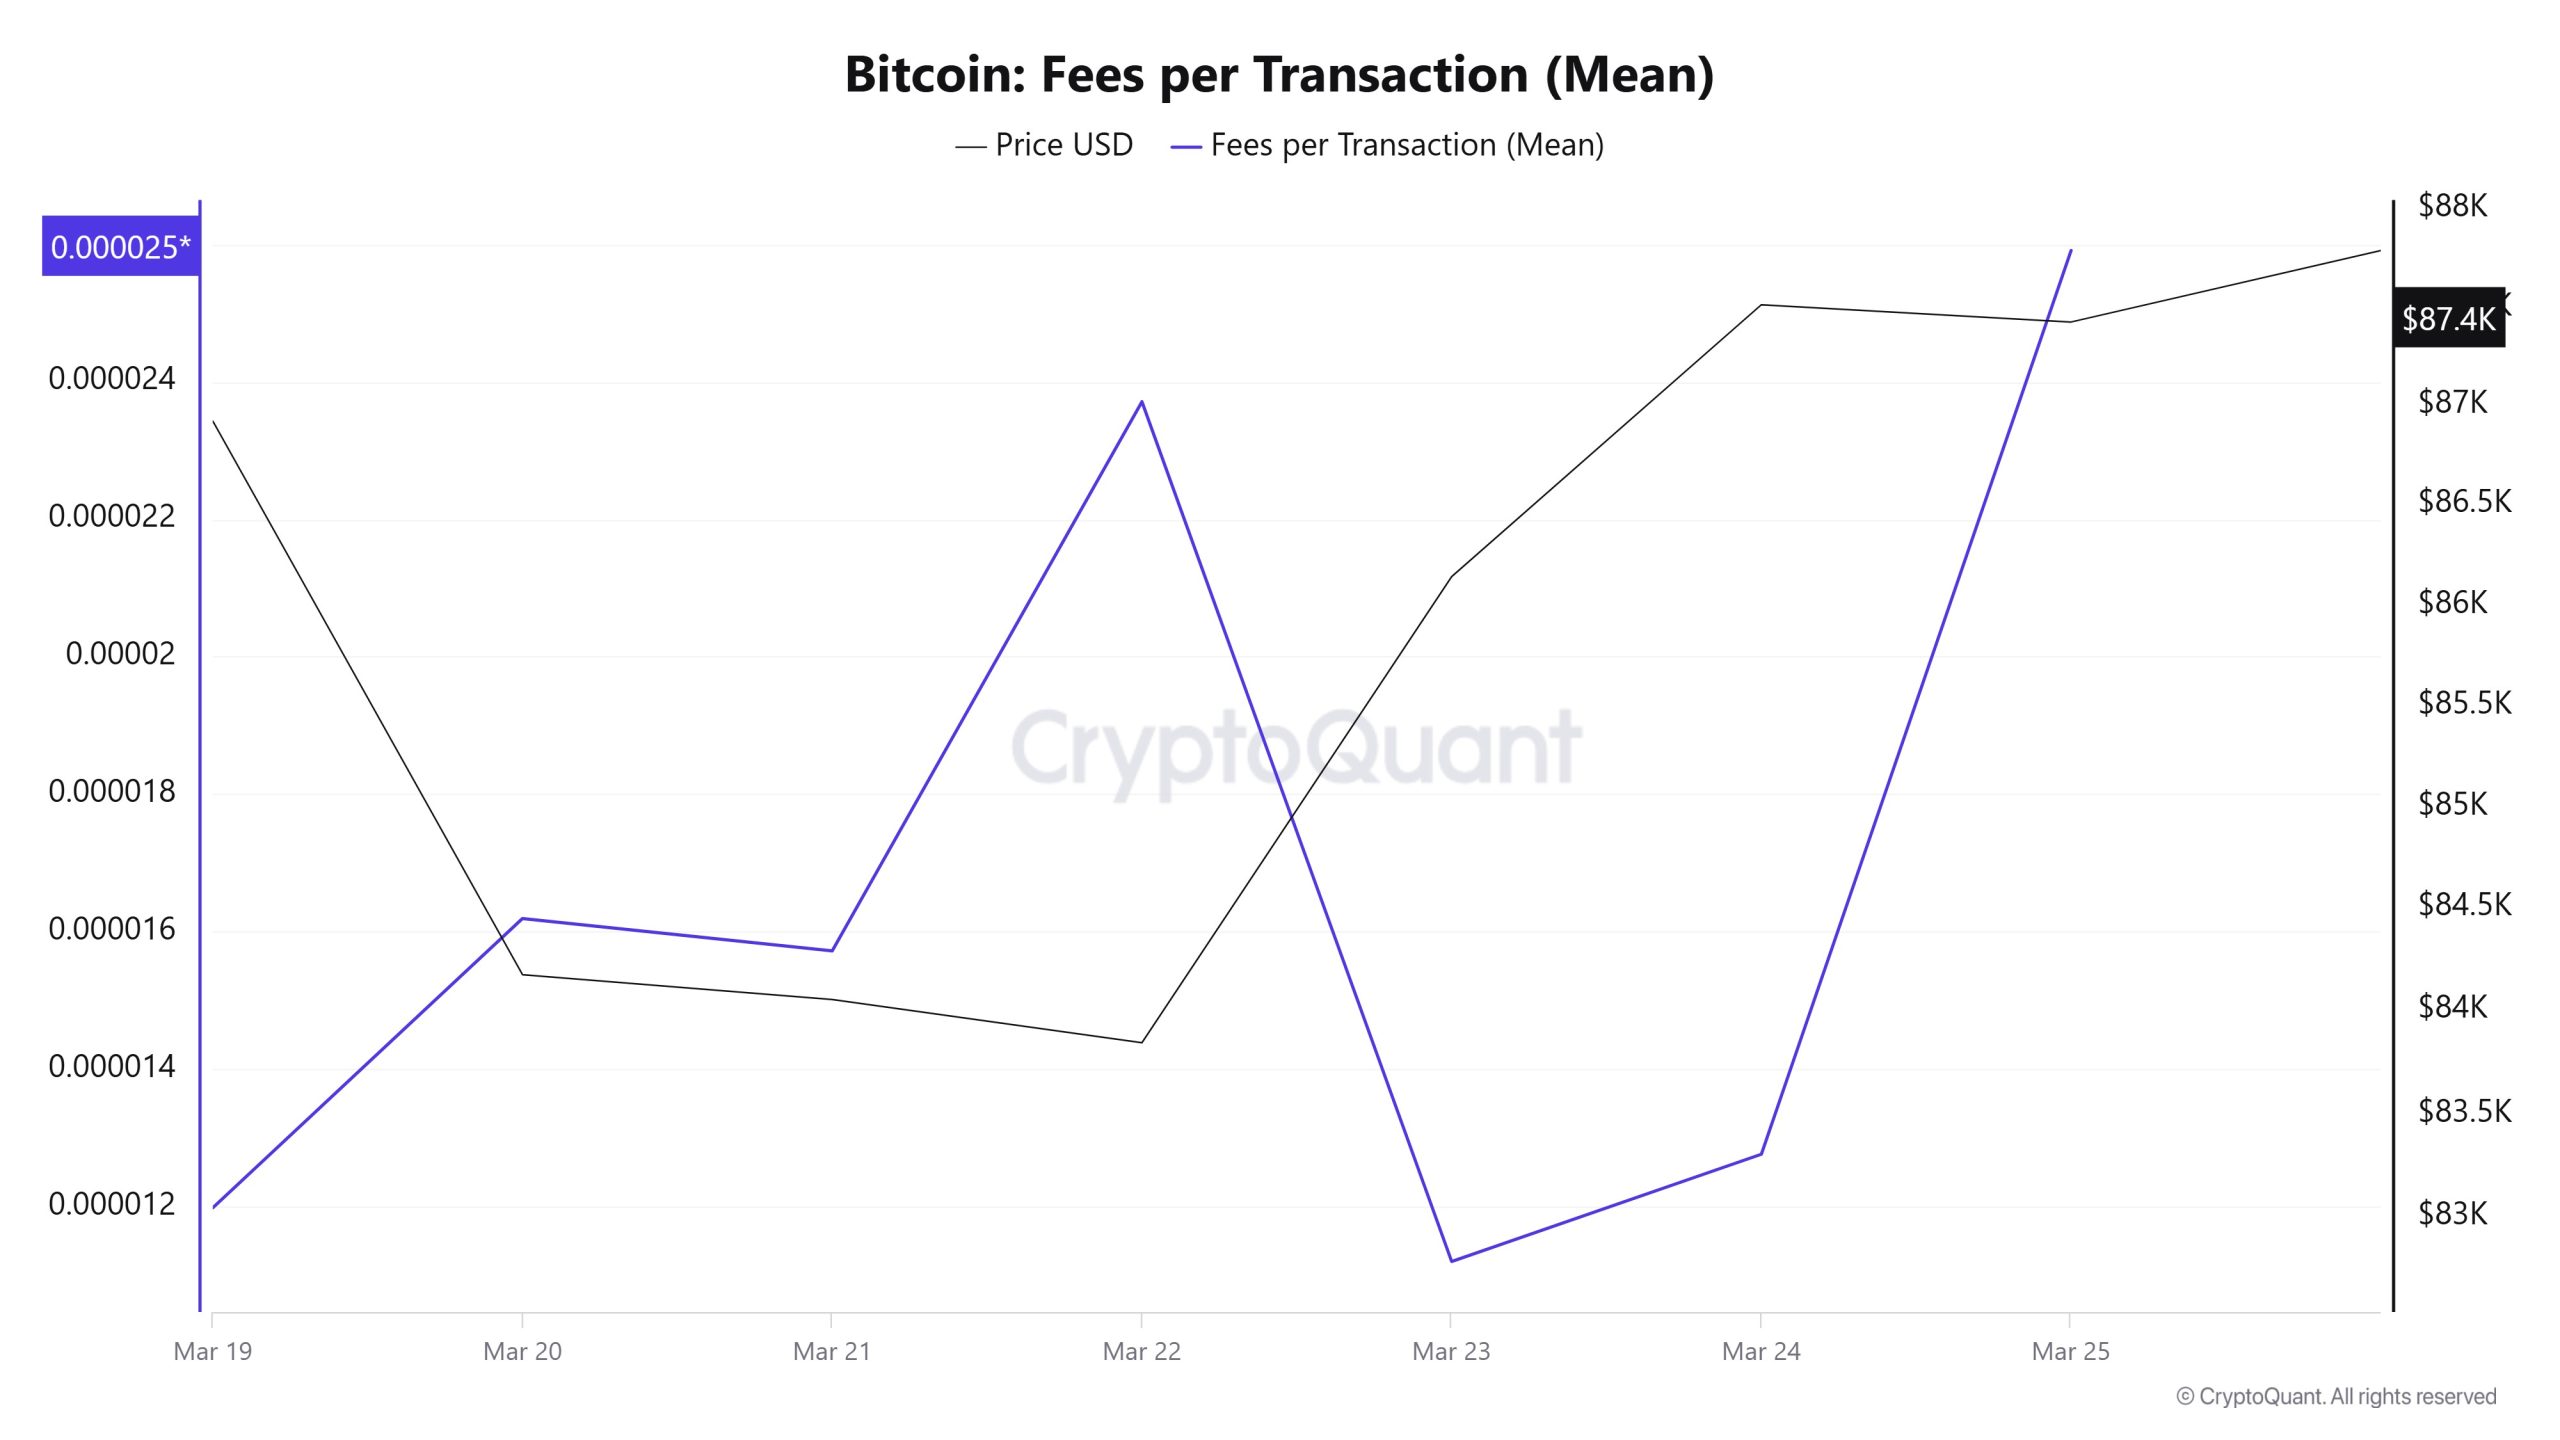
When the data of Bitcoin Fees per Transaction (Mean) between March 19 and March 25 is analyzed, it is seen that this value was at the level of 0.00001198 on March 19, the first day of the week. The Bitcoin Fees per Transaction (Mean) value, which has been on the rise since then, increased with the volatility seen in Bitcoin price and reached 0.00002371 on March 22. On March 23, the value, which experienced a sharp retracement, saw the lowest level of the weekly period with a value of 0.0000112.
The value increased again in the following days and closed at 0.00002591 on March 25, the last day of the weekly period.
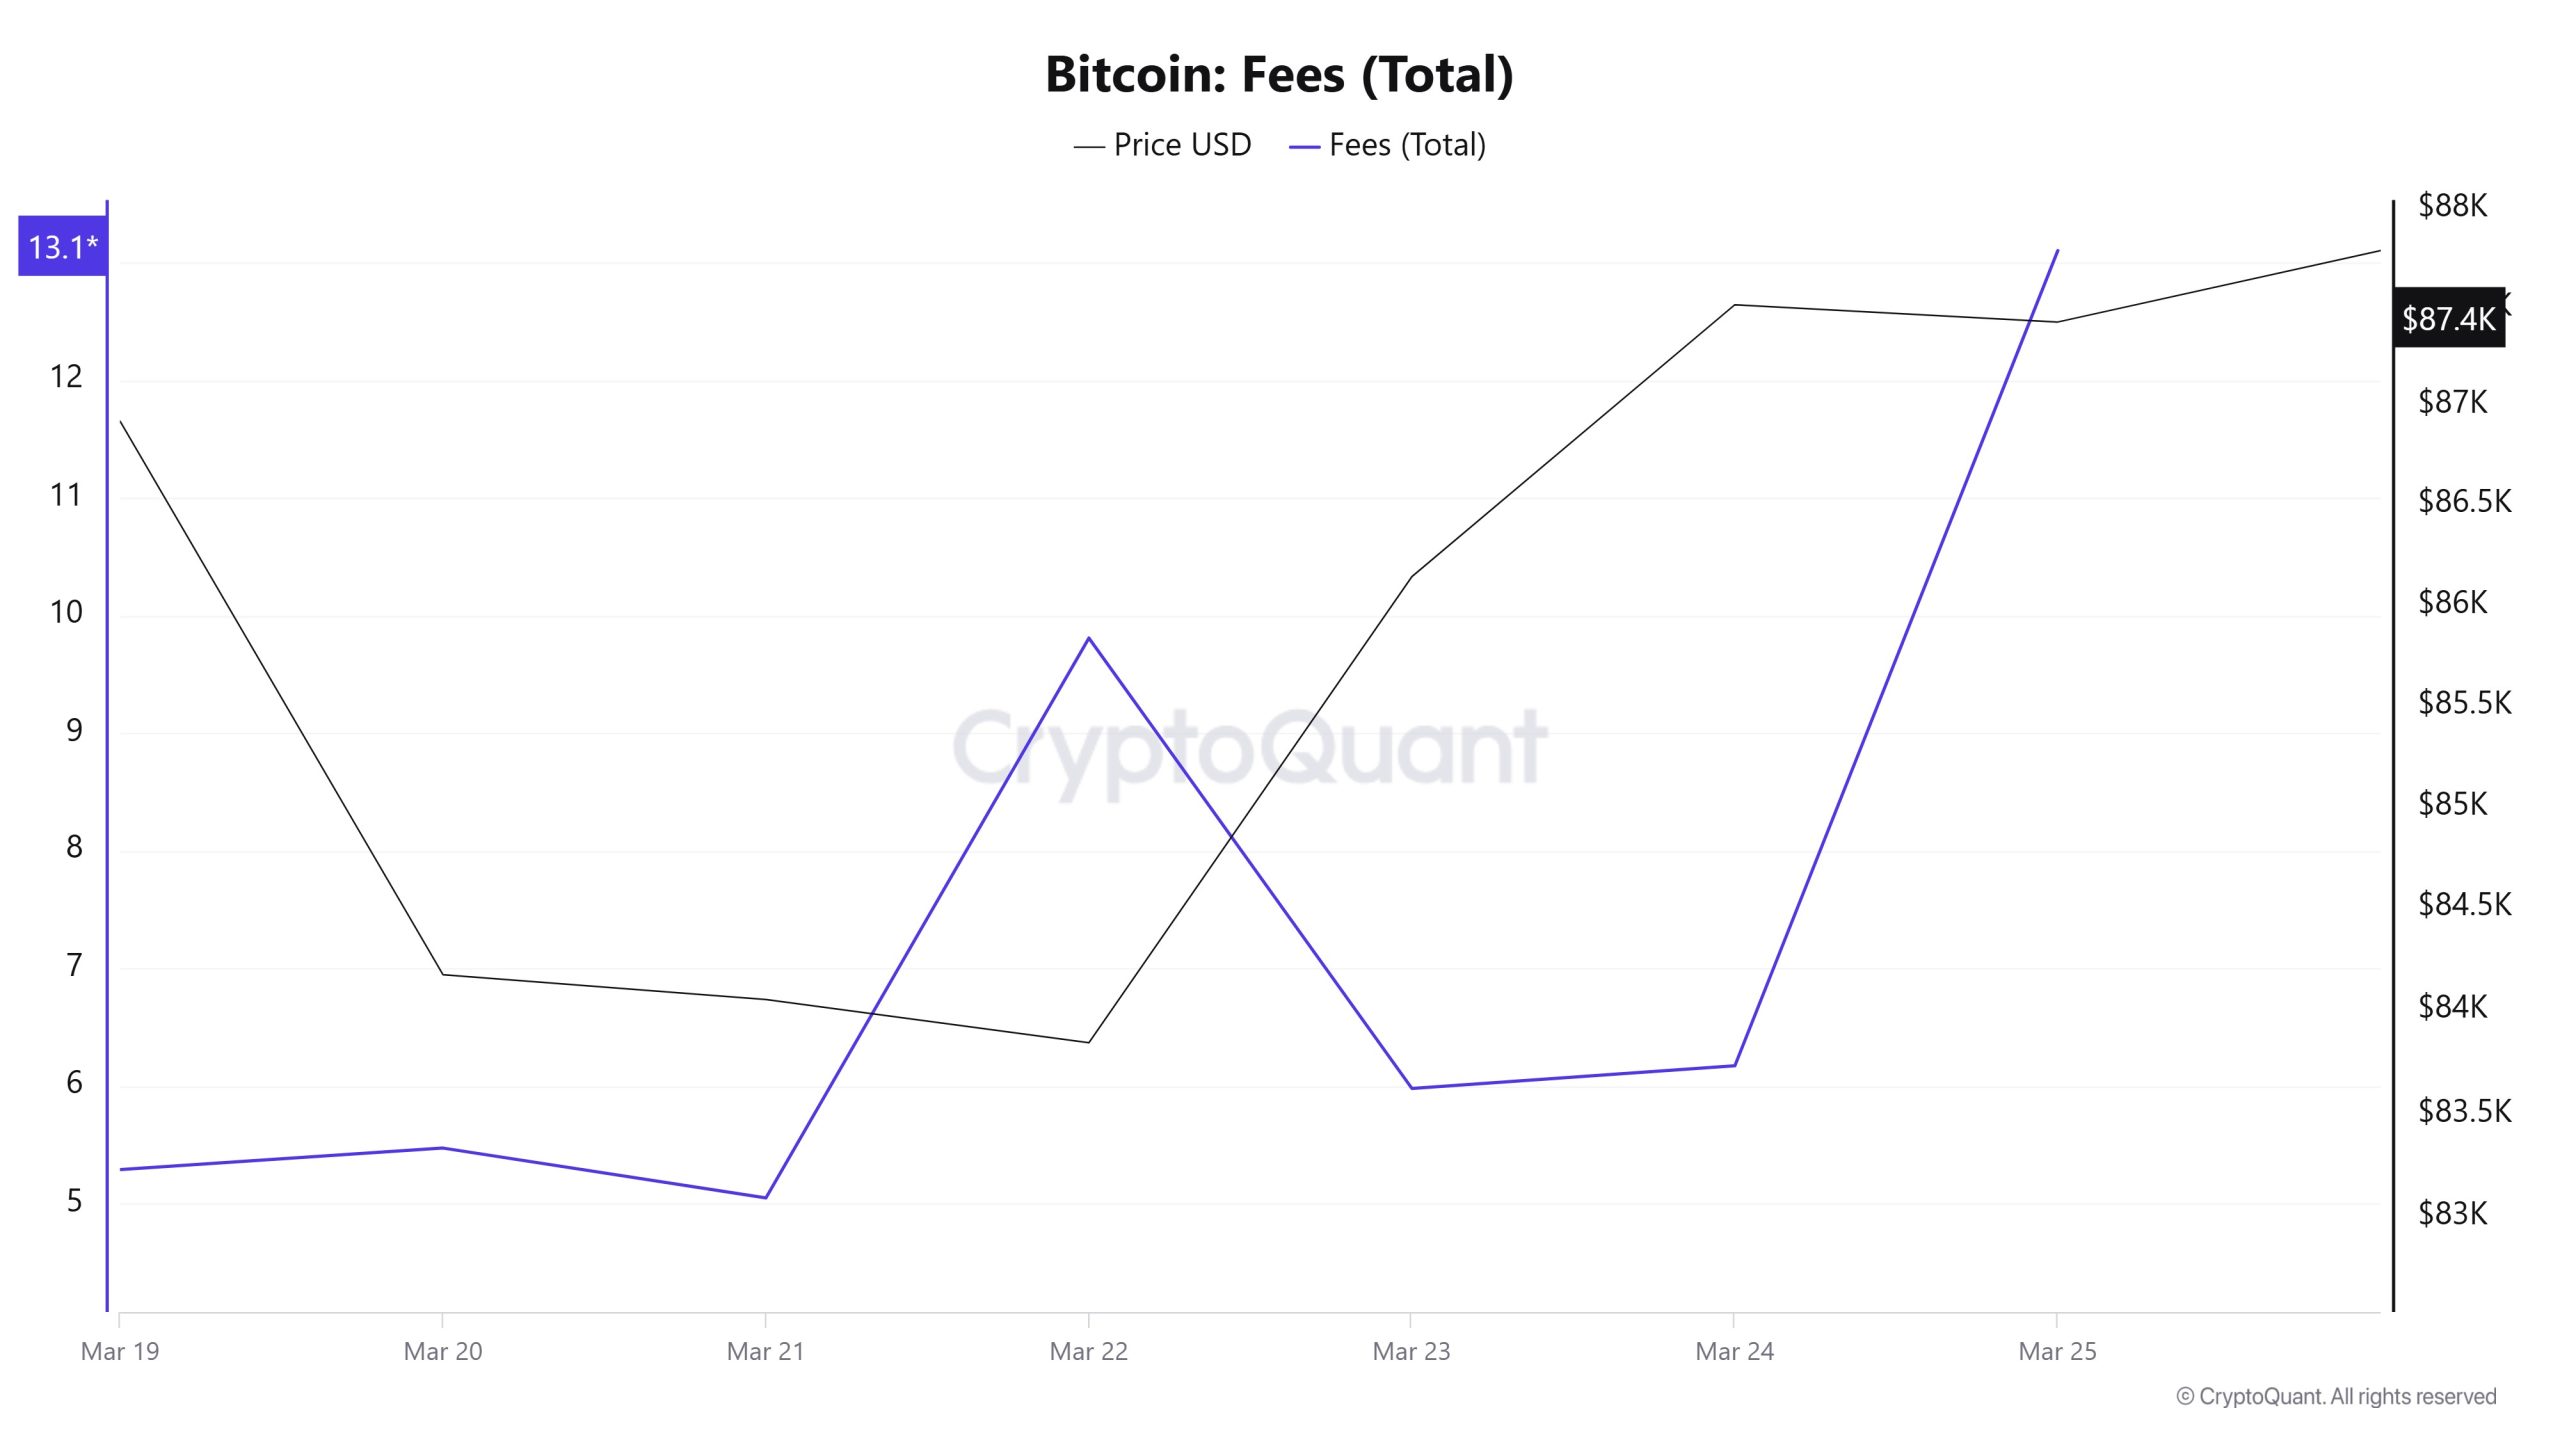 Similarly, when the data of Bitcoin Fees (Total) between March 19 and 25 is analyzed, it is seen that this value was at the level of 5.28843574 on March 19, the first day of the week. Moving stably until March 21, the value increased after this date and reached 9.8088555 on March 22. After this date, Bitcoin Fees (Total) decreased and fell to 5.97845109 on March 23.
The value increased again in the following days and closed at 13.10466122 on March 25, the last day of the weekly period.
Miner Flows

As can be seen in the Miner Reserve table, the number of Bitcoins in miners’ wallets decreased this week. Although there was a negative correlation between Miner Reserve and Bitcoin price at the beginning of this week, the correlation has turned positive since the middle of the week.
Miner Inflow, Outflow and Netflow
Between March 19-25, 38,199 Bitcoins exited miners’ wallets, and 38,088 Bitcoins entered miners’ wallets between the same dates. The Miner Netflow for this week was -111 Bitcoin. Meanwhile, the Bitcoin price was $86,923 on March 19 and $87,424 on March 25.
For the week, the net flow (Miner Netflow) was negative as Bitcoin inflow into miner wallets (Miner Inflow) was less than Bitcoin outflow from miner wallets (Miner Outflow).
| Date | Miner Inflow | Miner Outflow | Miner Netflow |
|---|---|---|---|
| March 19 | 5,938.15 | 5,923.30 | 14.85 |
| March 20 | 8,283.00 | 8,162.43 | 120.57 |
| March 21 | 5,566.43 | 5,870.98 | -304.55 |
| March 22 | 2,927.98 | 2,933.73 | -5.75 |
| March 23 | 2,314.37 | 2,242.66 | 71.71 |
| March 24 | 5,865.26 | 5,574.69 | 290.57 |
| March 25 | 7,192.71 | 7,491.16 | -298.45 |
Transaction
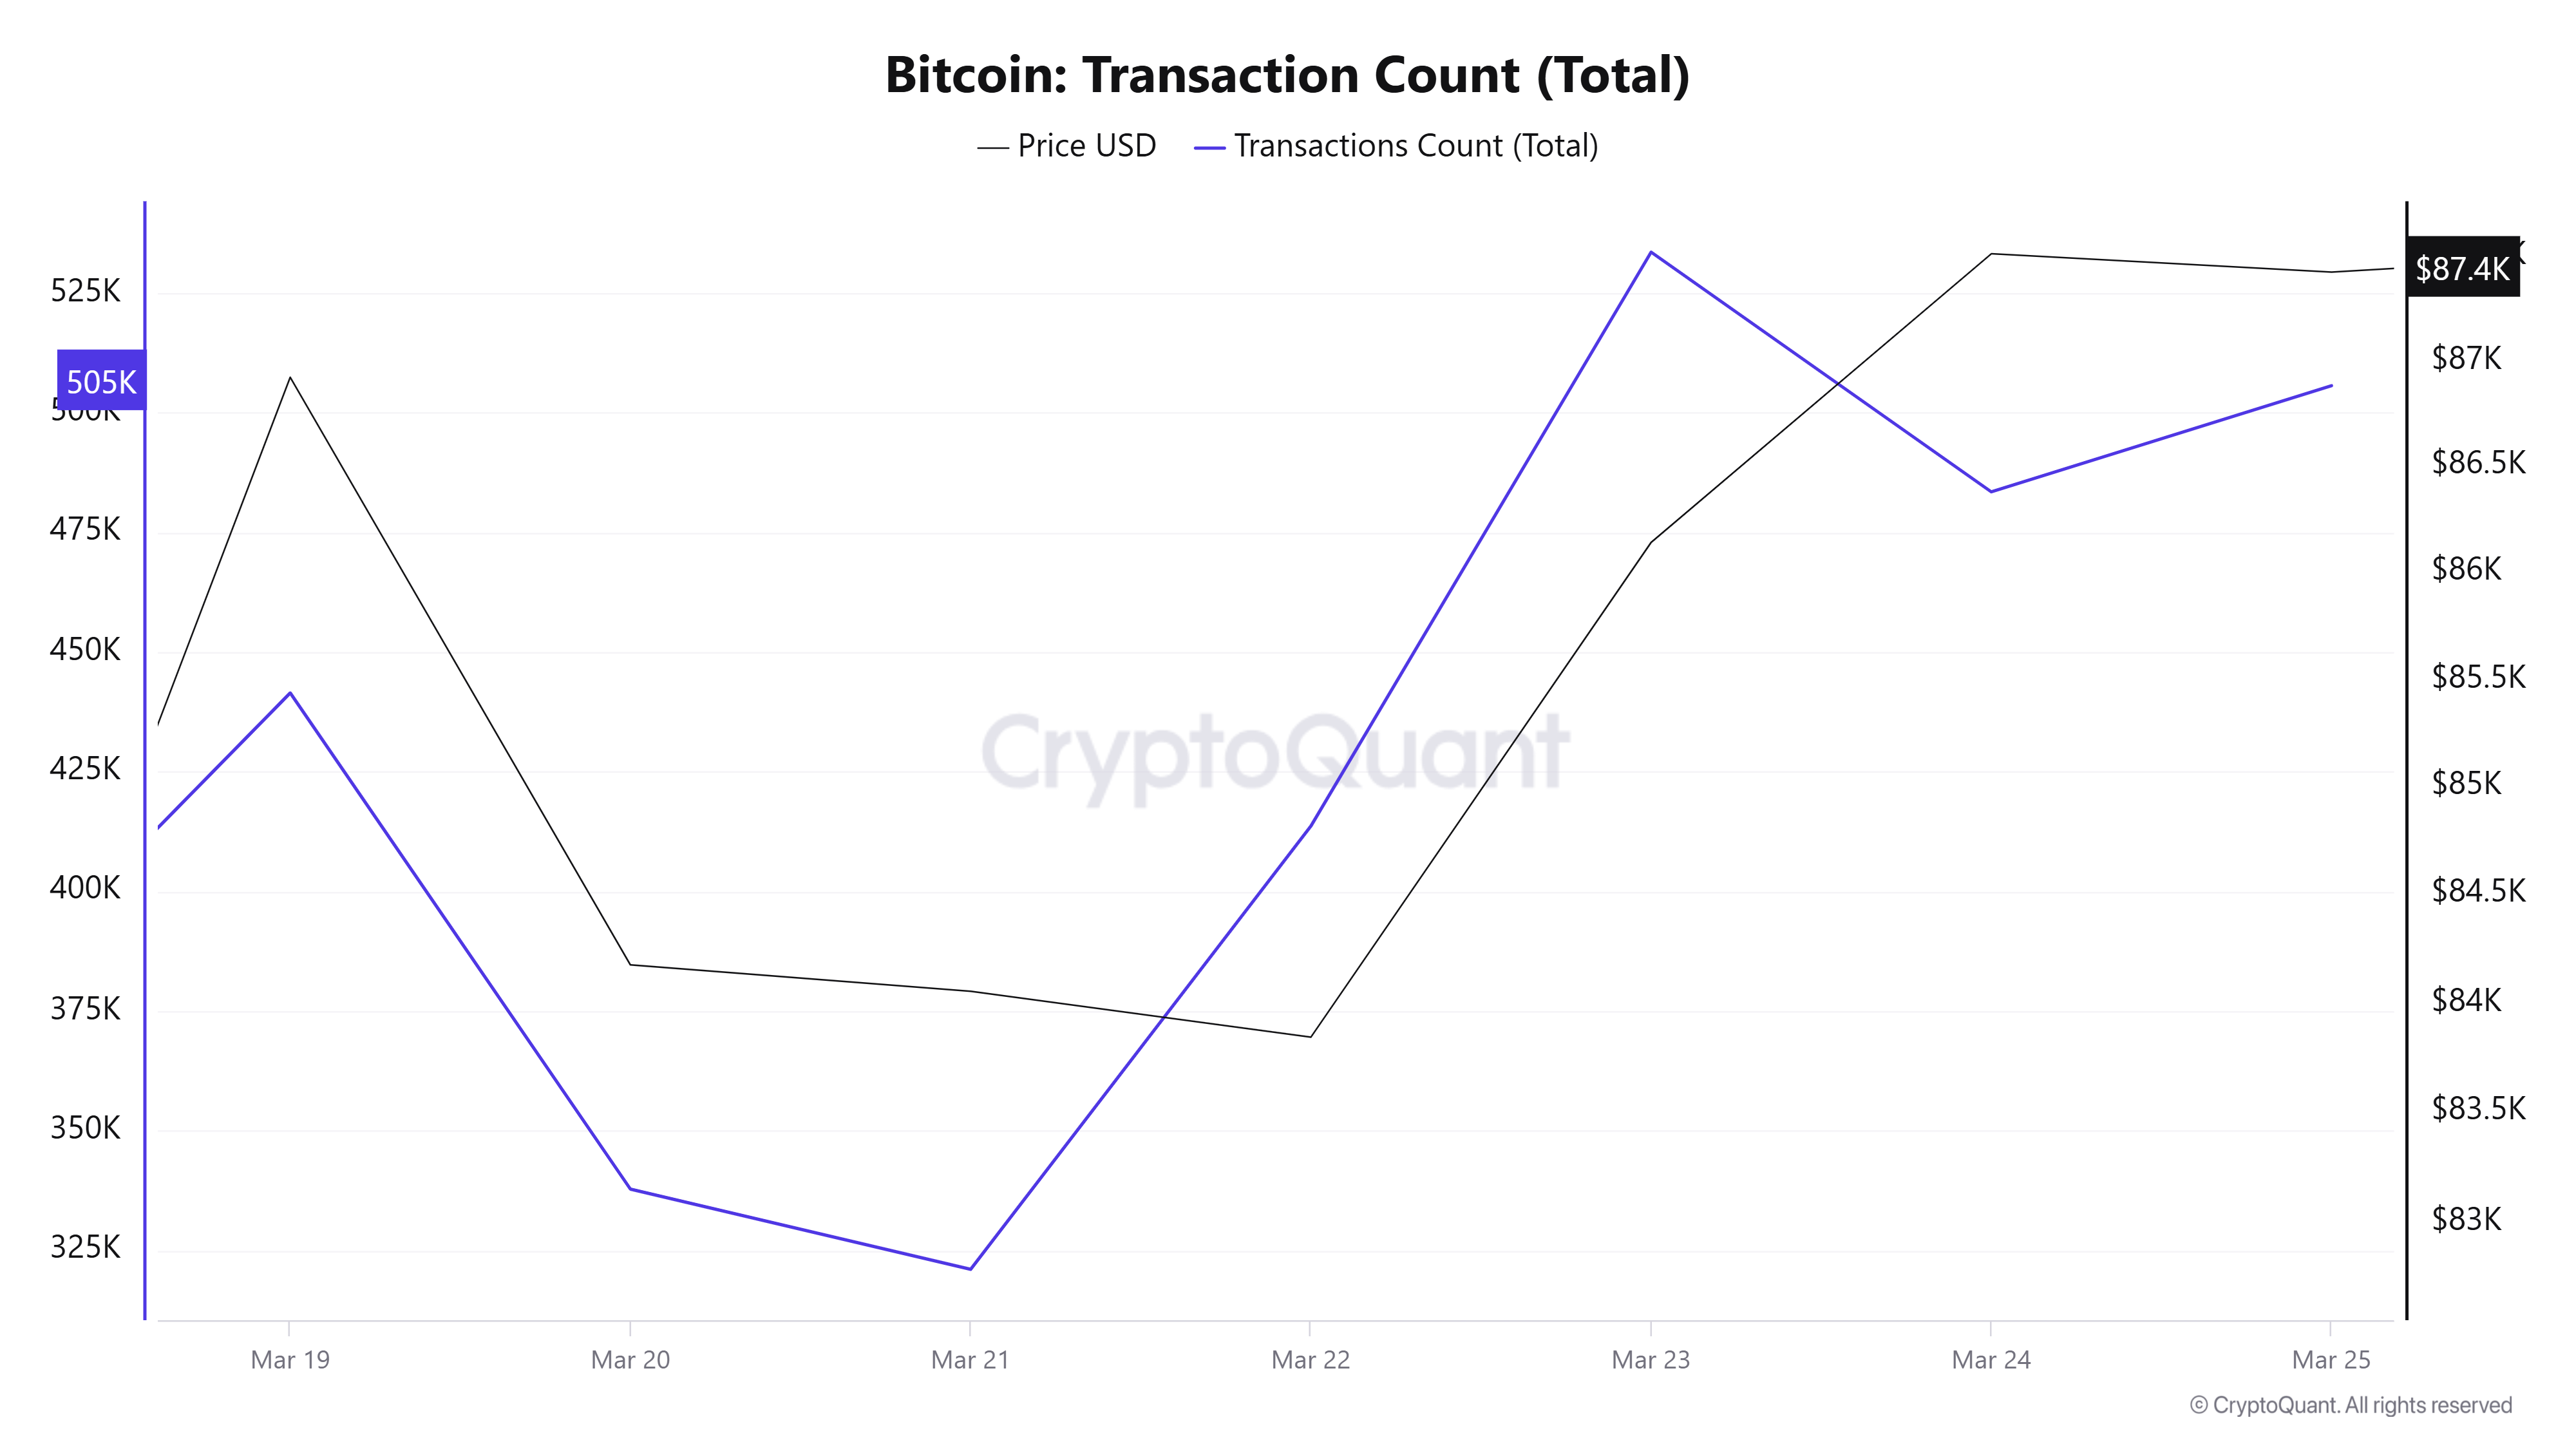
Last week, there were 3,093,915 transactions on the Bitcoin network, down about 1.2% to 3,056,902 transactions this week. The 553,599 transactions recorded on March 23rd was the highest transaction volume of the week, while the lowest number of transactions was 321,085 on March 21st.
Statistical analysis reveals a strong and positive relationship between the Bitcoin price and the number of transactions this week. The probability that this relationship is purely coincidental is very low (p = 0.0056). In other words, increases or decreases in the number of trades actually have an impact on the Bitcoin price, and this result is statistically significant. Recently, there has been a clear upward trend in the number of transactions. Since March 21, there has been a significant rebound and the number of transactions has accelerated. This indicates that the activity in the market is increasing. When we look at historical data, we see that increases in the number of transactions have a similar effect on the price. Especially between March 22-25, the number of transactions and the price rose almost in parallel.
Tokens Transferred
While 3,878,263 BTC was transferred last week, it decreased by 10.80% to 3,459,848 BTC this week. On March 25, 606,481 BTC were transferred, the highest token volume of the week, while March 23 saw the lowest transfer volume of 320,236 BTC. As it is the weekend, this is considered normal and it can be said that the role of high Bitcoin holders in the amount of bitcoins transferred this week is less than in previous weeks.
Whale Activities
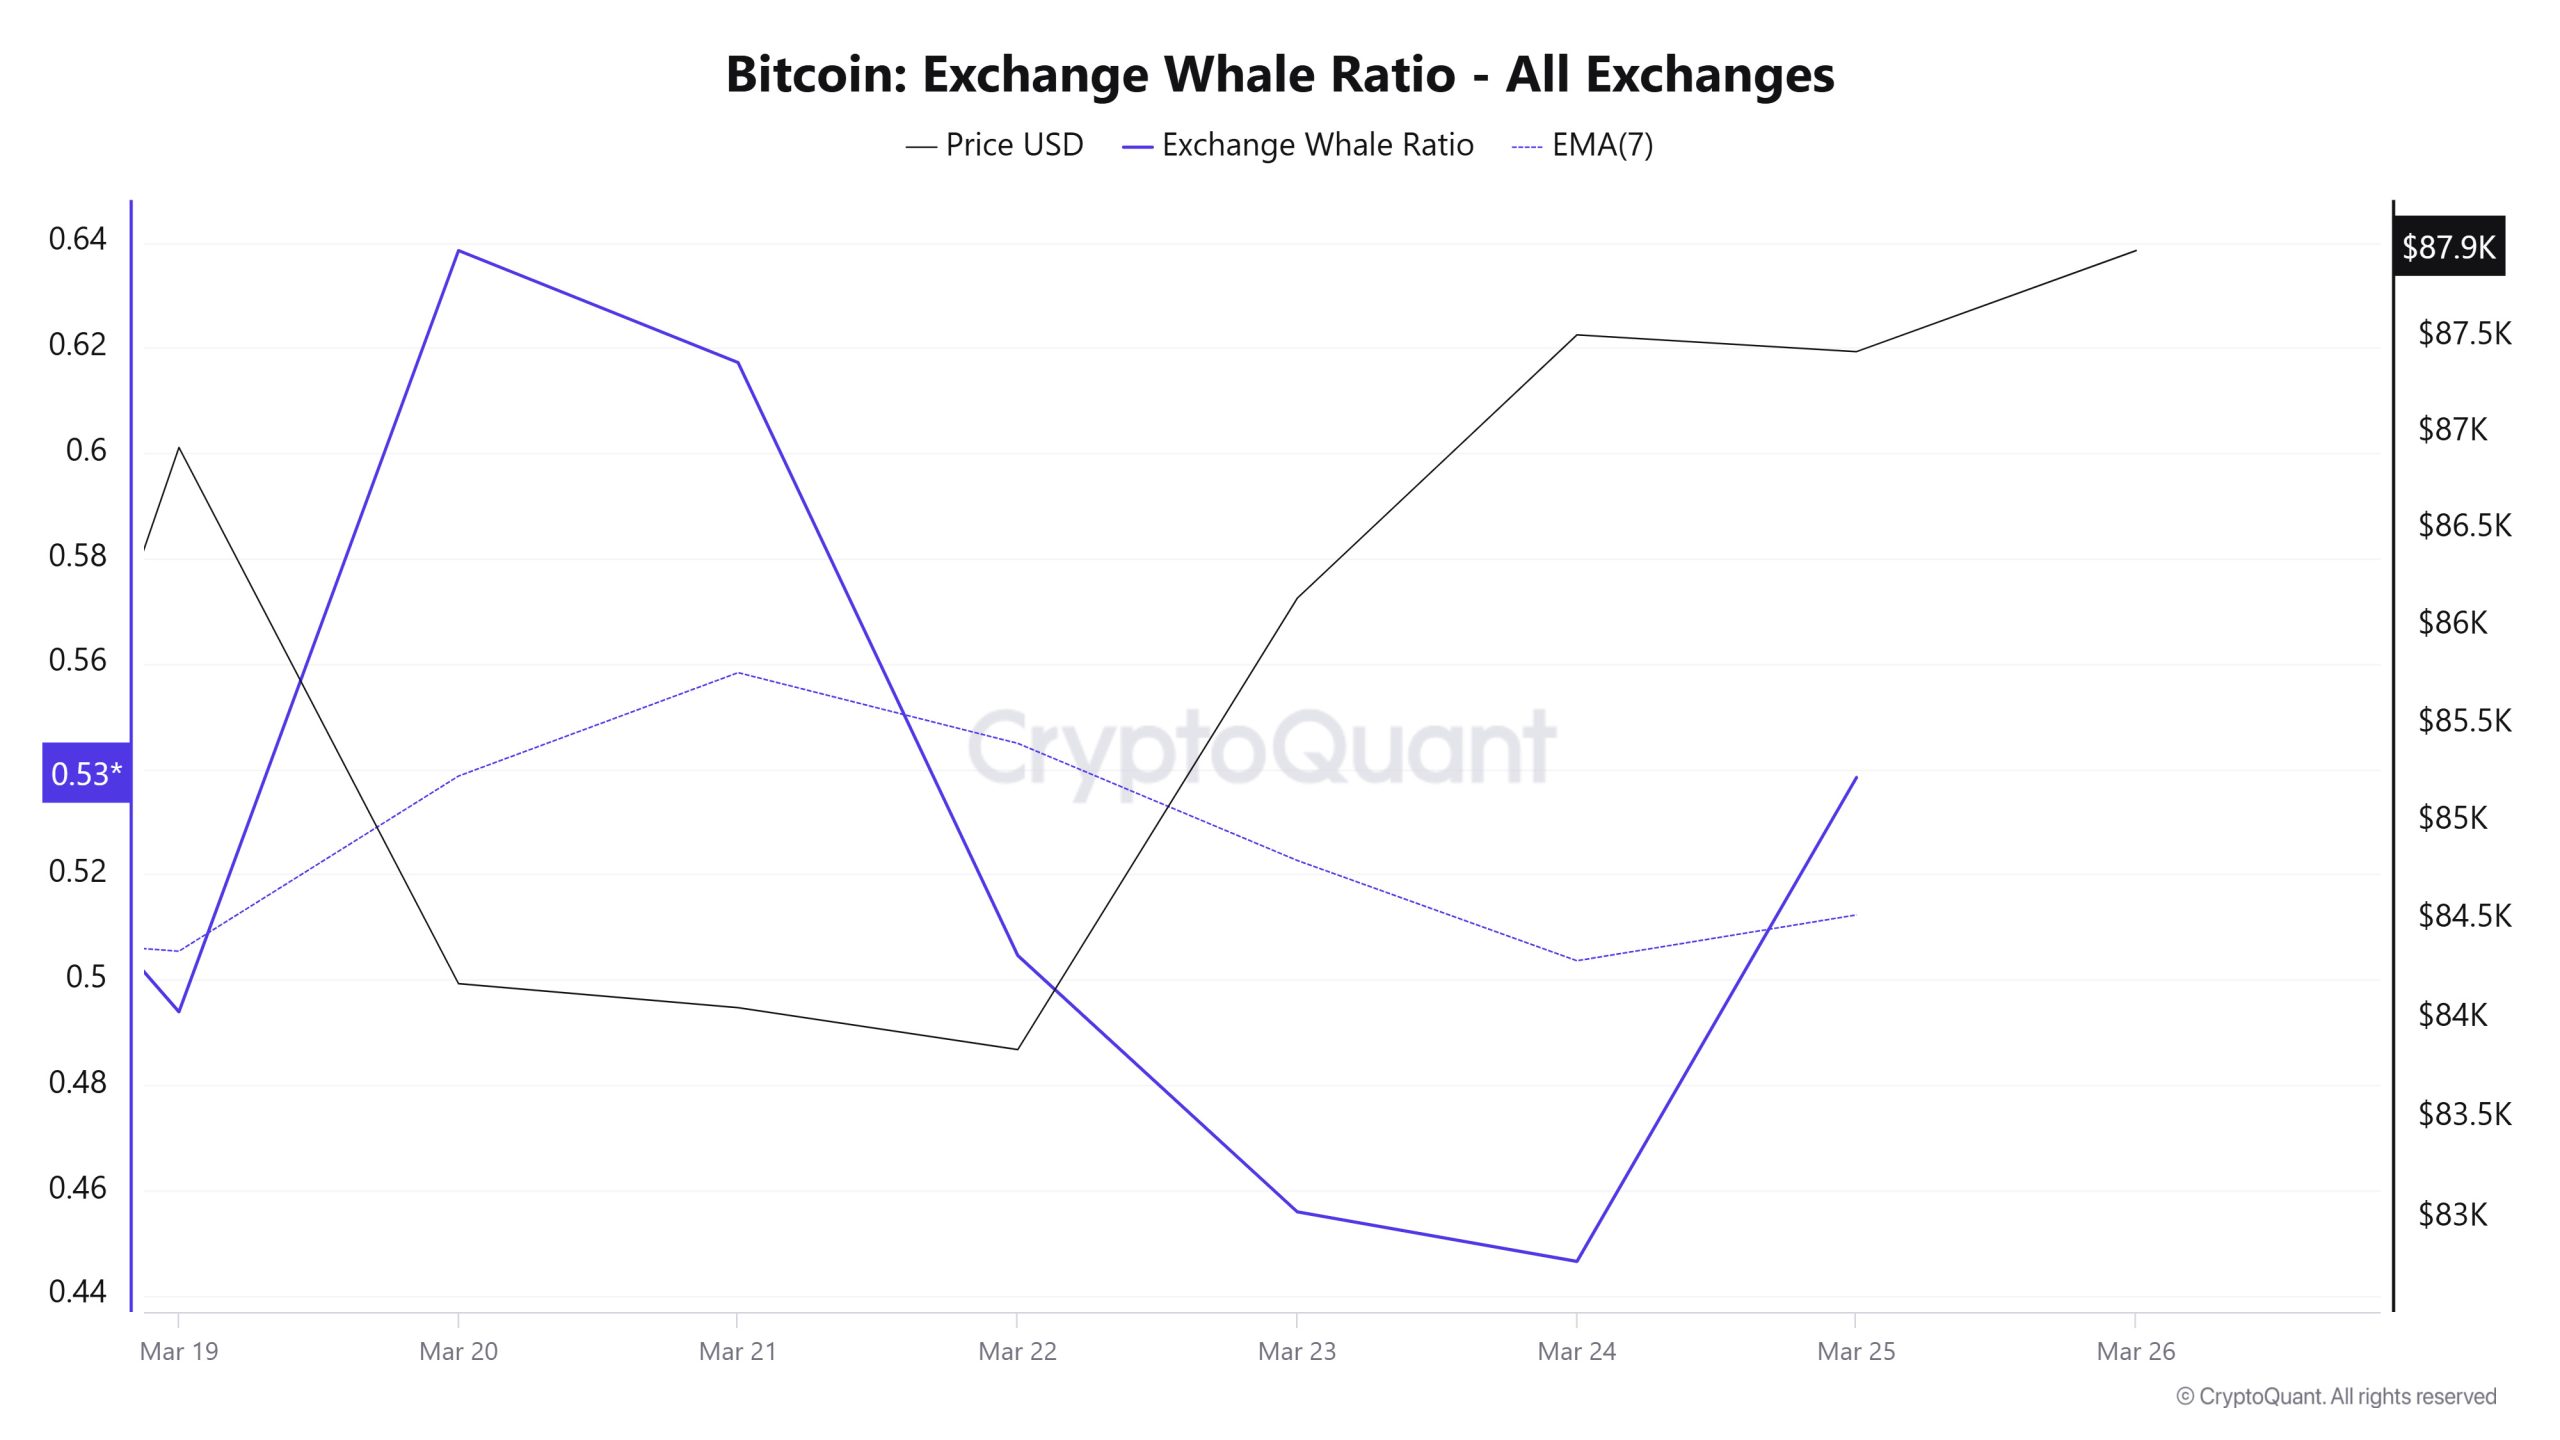
Whales Data
According to the data that attracted attention in the cryptocurrency market in the last 7 days, whale activities on the central exchange showed us that they used central exchanges a lot at the beginning of the process. But towards the end of the process, the use of central exchanges has declined. When we look at the Exchange Whale Ratio metric, it showed that whales frequently used central exchanges at the beginning of the 7-day process and the value was measured as 0.493. This measurement increased further in the middle of the process, reaching a value of 0.617, showing us that whales started to use the central exchange more than at the beginning of the process. At the time of writing, the value is 0.538, indicating that whales use the centralized exchange less than in the middle of the process. In this process, the day when whales used the central exchange the most was March 20. On this date, the ratio increased to 0.638. This movement caused the Bitcoin price to fall from around $ 87,000 to around $ 83,000. By the time the Bitcoin price reached its peak of $88,000, the ratio of whale activity fell to a low of 0.446. When this ratio is above 0.350, it usually means that whales are frequent users of centralized exchanges. At the same time, the total number of BTC transfers decreased by about 11% compared to last week, with 3,459,856 BTC moving. In addition, the number of addresses holding between 1 million and 10,000 BTC increased from 16,600 to 17,889. As a result, the fact that whales are using centralized exchanges less and the amount of transfers is decreasing means that the market may point to very slight increases, but the fact that there are whales accumulating may move the market up.
BTC Onchain Overall
| Metric | Rise 📈 | Decline 📉 | Neutral ➖ |
|---|---|---|---|
| Active Addresses | ✓ | — | — |
| Breakdowns | — | ✓ | — |
| Derivatives | ✓ | — | — |
| Supply Distribution | — | ✓ | — |
| Exchange Reserve | ✓ | — | — |
| Fees and Revenues | — | ✓ | — |
| Miner Flows | ✓ | — | — |
| Transaction | ✓ | — | — |
| Whale Activities | — | ✓ | — |
*The metrics and guidance in the table do not, by themselves, describe or imply an expectation of future price changes for any asset. The prices of digital assets may vary depending on many different variables. The onchain analysis and related guidance is intended to assist investors in their decision-making process, and making financial investments based solely on the results of this analysis may result in harmful transactions. Even if all metrics produce a bullish, bearish or neutral result at the same time, the expected results may not be seen depending on market conditions. Investors who review the report should take these warnings into account.
Legal Notice
The investment information, comments and recommendations contained in this document do not constitute investment advisory services. Investment advisory services are provided by authorized institutions on a personal basis, taking into account the risk and return preferences of individuals. The comments and recommendations contained in this document are of a general type. These recommendations may not be suitable for your financial situation and risk and return preferences. Therefore, making an investment decision based solely on the information contained in this document may not result in results that are in line with your expectations.
NOTE: All data used in Bitcoin onchain analysis is based on Cryptoqaunt.
