
Weekly Bitcoin Onchain Report – January 7
Active Addresses

Between January 1 and January 7, 905,979 active addresses were added to the Bitcoin network ( ). During this period, the Bitcoin price dropped to $87,000. From a technical perspective, the 7-day simple moving average (SMA) shows a downward trend.
Active Sending Addresses
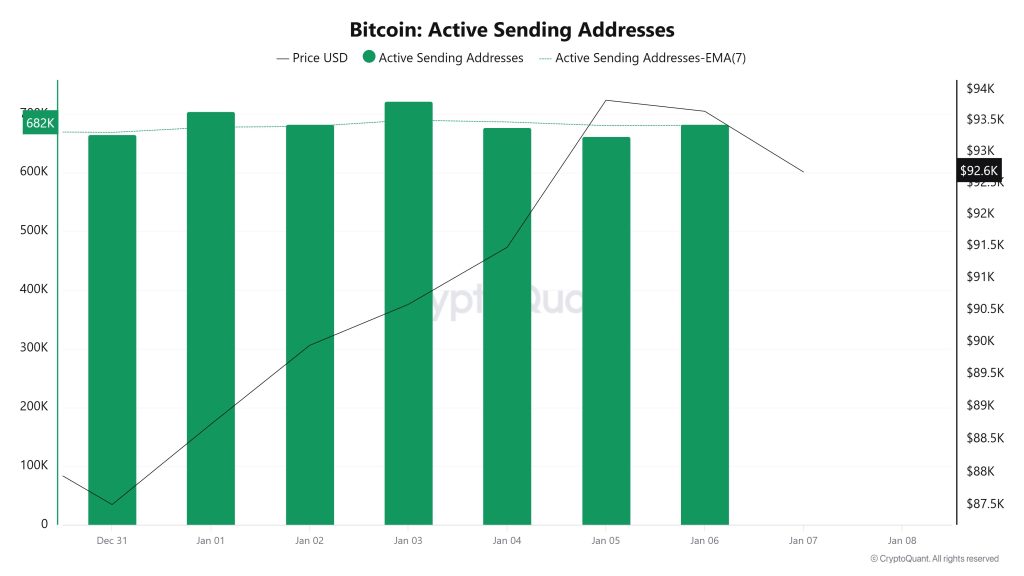
Between January 1 and January 7, an upward trend was observed in the active sending addresses metric. On the day the price reached its highest level, this metric stood at 721,610, indicating that user activity on the Bitcoin network was moving in parallel with the price. This data indicates that the $87,000 level was supported not only by price-based factors but also by on-chain address activity. Overall, the Active Sending Addresses metric followed a high trajectory during this period.
Active Receiving Addresses
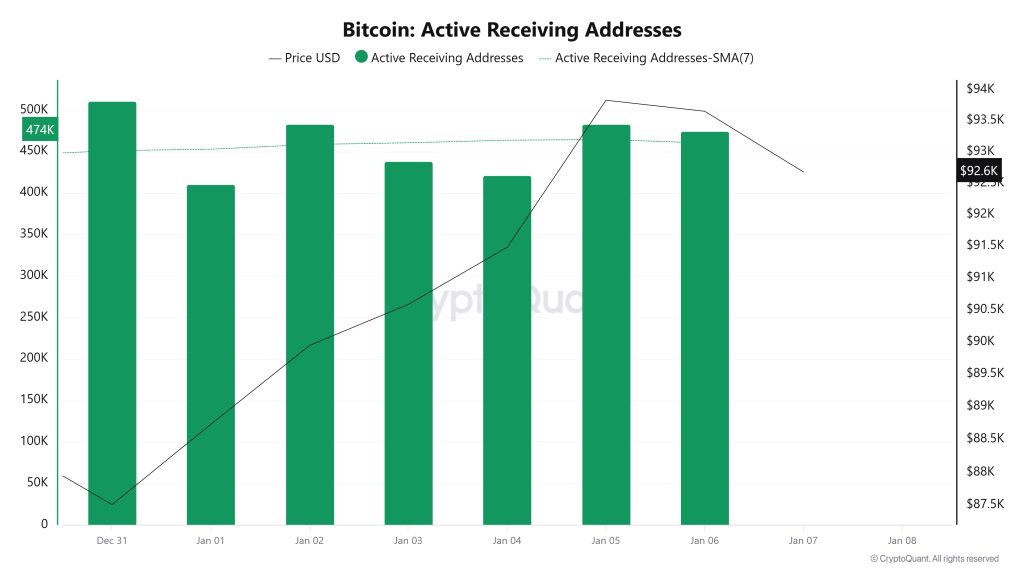
Between January 1 and January 7, active buying addresses experienced a normal rise along with the Black Line (price line). On the day the price reached its peak, active buying addresses rose to 510,652 levels, indicating that buyers purchased Bitcoin at around $87,000.
Breakdowns
MVRV

On January 1, while the Bitcoin price was trading at $88,731, the MVRV Ratio stood at 1.580.
By January 6, the Bitcoin price rose to $93,651, recording a 5.54% increase, while the MVRV Ratio rose to 1.666, recording a 5.44% increase.
Realized Price

On January 1, Bitcoin traded at $88,731, while the Realized Price stood at $56,129.
As of January 6, the Bitcoin price rose to $93,651, while the Realized Price increased to $56,190, recording a 0.11% increase.
Spent Output Profit Ratio (SOPR)
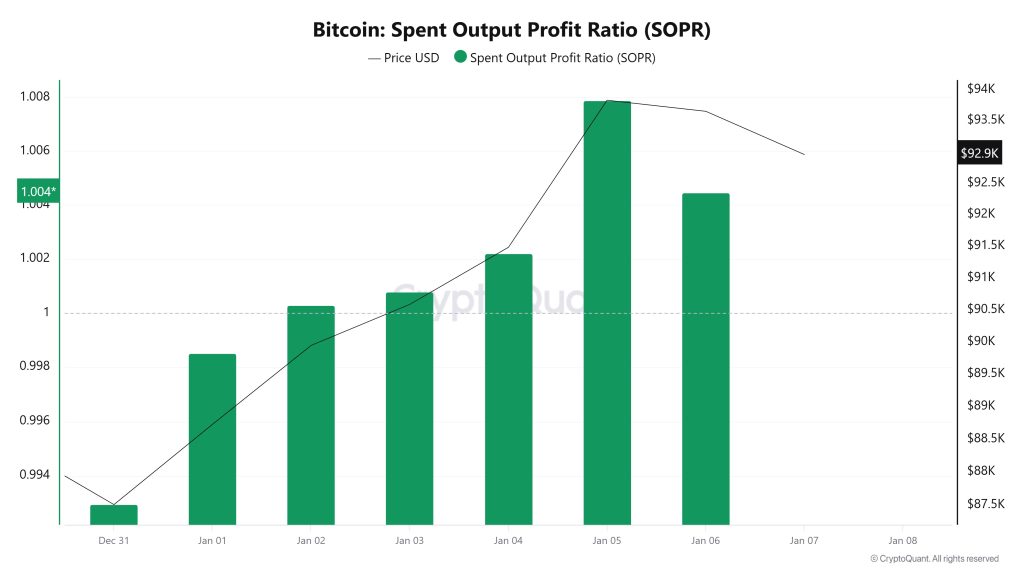
On January 1, while the Bitcoin price was trading at $88,731, the SOPR metric was at 0.998.
As of January 6, the Bitcoin price rose to $93,651, while the SOPR metric rose to 1.004, recording a 0.60% increase.
Derivatives
Open Interest
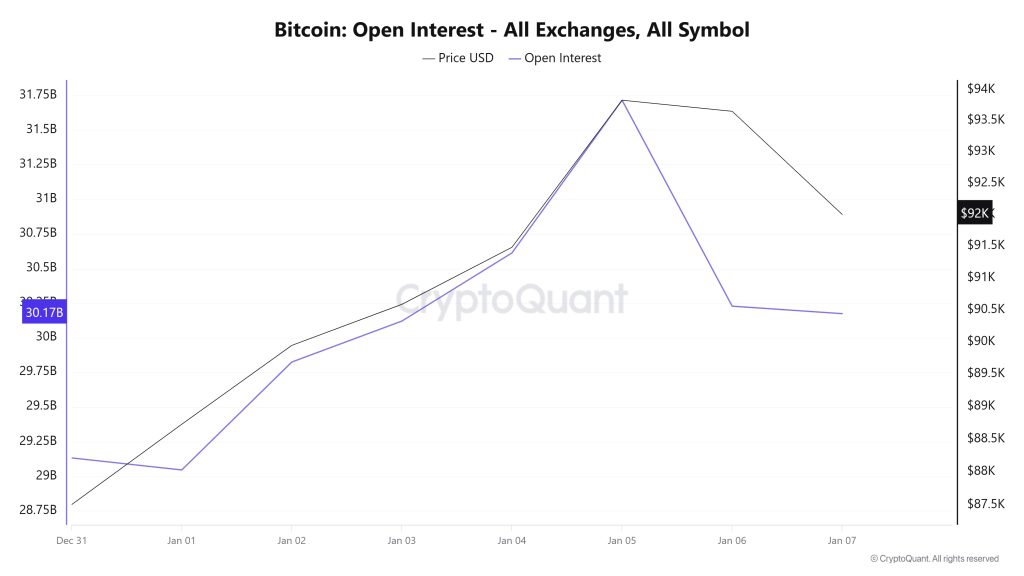
The BTC price rose from $88,500 to $94,000 between December 31 and January 5. The fact that open interest accompanied this rise indicates that long positions have intensified and that a healthy market structure is in place. However, after this date, open interest experienced a sharp decline, falling to around $30 billion. The delayed response of the price indicates a decline in investor appetite and suggests that the price may become fragile. In summary, the strong correlation between the BTC price and open interest over the past week and the subsequent decline in open interest can be interpreted as a sign of weakness.
Funding Rate
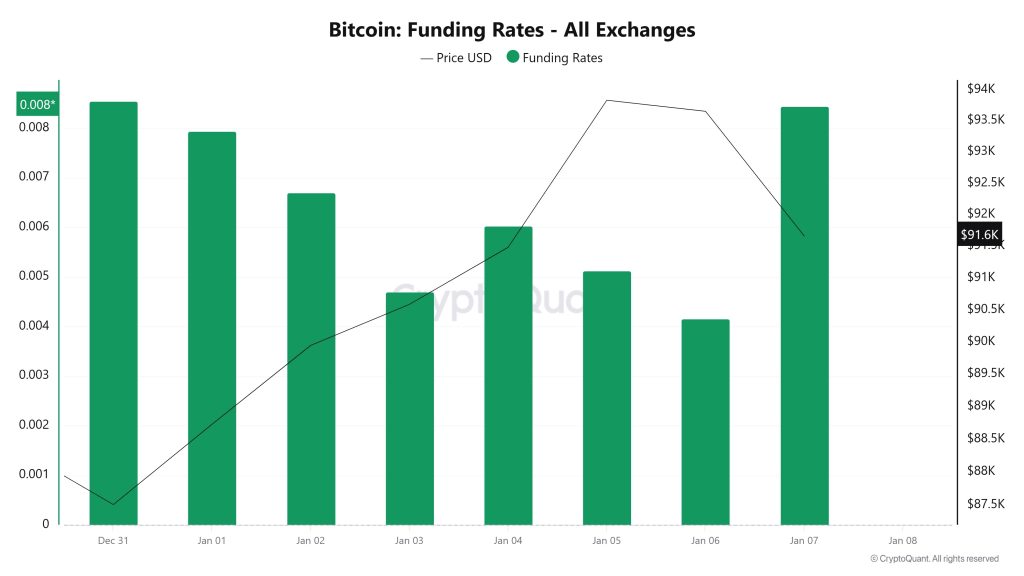
The funding rate gradually declined in the opposite direction to the price during the week, indicating that the price increase was driven by spot purchases rather than futures positioning. However, as of yesterday, the aggressive increase in the funding rate indicates that aggressive long-side purchases have taken place. These heavy purchases in this area, where the price is seeking equilibrium, may cause an increase in accumulation at lower levels on the liquidation map and an increase in downside risk.
Long & Short Liquidations
Last week, the BTC price rose from $87,250 to $94,750 before falling to $91,500. As a result, a total of $409 million in long positions were liquidated, while $370 million in short positions were liquidated.
| Date | Long Amount (Million $) | Short Amount (Million $) |
|---|---|---|
| December 31 | 17.34 | 5.22 |
| January 1 | 1.55 | 8.94 |
| January 2 | 15.63 | 88.66 |
| January 3 | 5.21 | 6.80 |
| January 4 | 4.04 | 26.48 |
| January 5 | 168.06 | 92.52 |
| January 6 | 198.37 | 41.33 |
| Total | 409.20 | 370.95 |
Supply Distribution
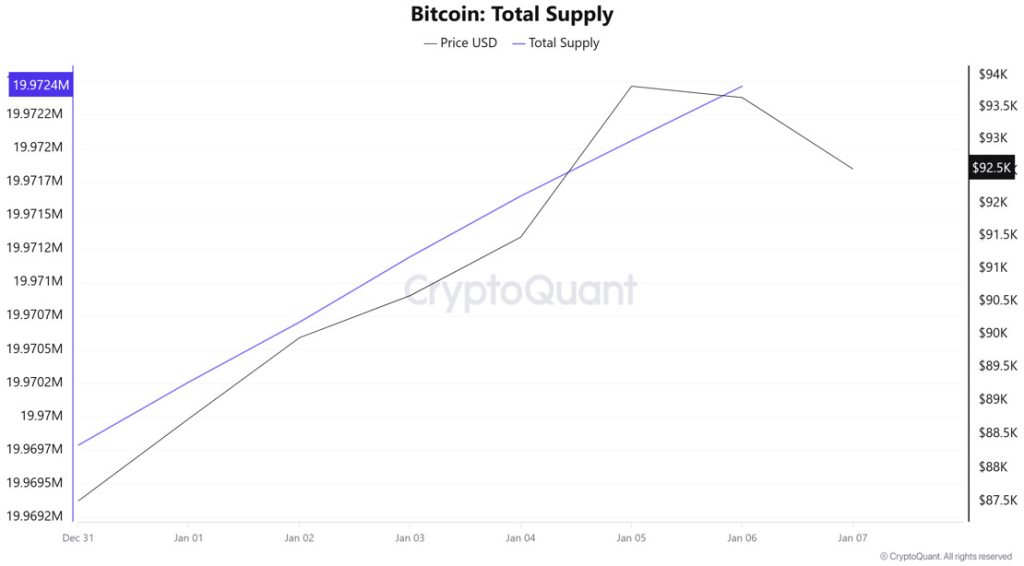
Total Supply: Reached 19,972,464 units, an increase of approximately 0.0158% compared to last week.
New Supply: The amount of BTC produced this week was 3,147.
Velocity: Last week’s velocity of 12.31 increased to 12.35 as of January 6.
| Wallet Category | 12/30/2025 | January 6, 2025 | Change (%) |
|---|---|---|---|
| < 1 BTC | 8.4586% | 8.4652% | 0.078% |
| 1 – 10 BTC | 11.3261% | 11.3007% | −0.224% |
| 10 – 100 BTC | 23.0228% | 22.9405% | −0.357% |
| 100 – 1k BTC | 28.2701% | 28.3083% | 0.135% |
| 1k – 10k BTC | 21.1095% | 21.1704% | 0.289% |
| 10k+ BTC | 7.8124% | 7.8126% | 0.003% |
Limited changes observed in the <1 BTC and 1–10 BTC groups indicate that retail investors have yet to establish a clear direction. The decline in the 10–100 BTC band suggests that a partial distribution process is underway in this segment. In contrast, the increase observed in the 100–1,000 BTC range reveals that mid-sized investors continue to accumulate, viewing prices as an opportunity. The limited pullback in the 1,000–10,000 BTC group indicates that profit-taking behavior is coming to the fore at this scale, while the decline in wallets holding 10,000 BTC and above shows that large investors remain cautious but prefer to maintain their positions rather than exit the market entirely.
Exchange Reserve

Between December 31, 2025, and January 6, 2026, Bitcoin reserves on exchanges declined from 2,757,747 BTC to 2,745,470 BTC, resulting in a net outflow of 12,277 BTC. Exchange reserves decreased by approximately 0.45%. During this period, the price of BTC rose from $88,481 to $93,652, gaining 5.84% in value. The decrease in exchange reserves during this period of strong price appreciation indicates that investors did not view the rise as a short-term selling opportunity. Despite the short-term price increase, the continued decline in exchange reserves suggests that demand for Bitcoin remains strong and selling pressure is limited. In the long term, this decrease in reserves could tighten the supply side, creating a supportive environment for prices.
| Date | December 31 | Jan 1 | Jan 2 | Jan 3 | Jan 4 | Jan 5 | 06-Jan |
|---|---|---|---|---|---|---|---|
| Exchange Inflow | 43,941 | 19,278 | 33,300 | 8,458 | 12,340 | 37,014 | 32,393 |
| Exchange Outflow | 49,343 | 20,077 | 33,356 | 8,795 | 12,498 | 42,652 | 32,280 |
| Exchange Netflow | -5,402 | -800 | -56 | -337 | -158 | -5,638 | 114 |
| Exchange Reserve | 2,752,345 | 2,751,546 | 2,751,489 | 2,751,153 | 2,750,995 | 2,745,357 | 2,745,470 |
| BTC Price | 88,481 | 88,731 | 89,947 | 90,585 | 91,481 | 93,831 | 93,652 |
Fees and Revenues

When examining the Bitcoin Fees per Transaction (Mean) data between December 31 and January 6, it is seen that the indicator reached 0.00000773 on December 31, the first day of the week.
A decline was observed until January 1, when the indicator recorded the week’s lowest value at 0.00000477.
In this context, as of January 1, the indicator regained momentum as a result of increased Bitcoin price volatility and followed a positive trend due to the impact of price volatility.
On January 6, the last day of the weekly period, the indicator closed the week at 0.00000651 .
Bitcoin: Fees (Total)
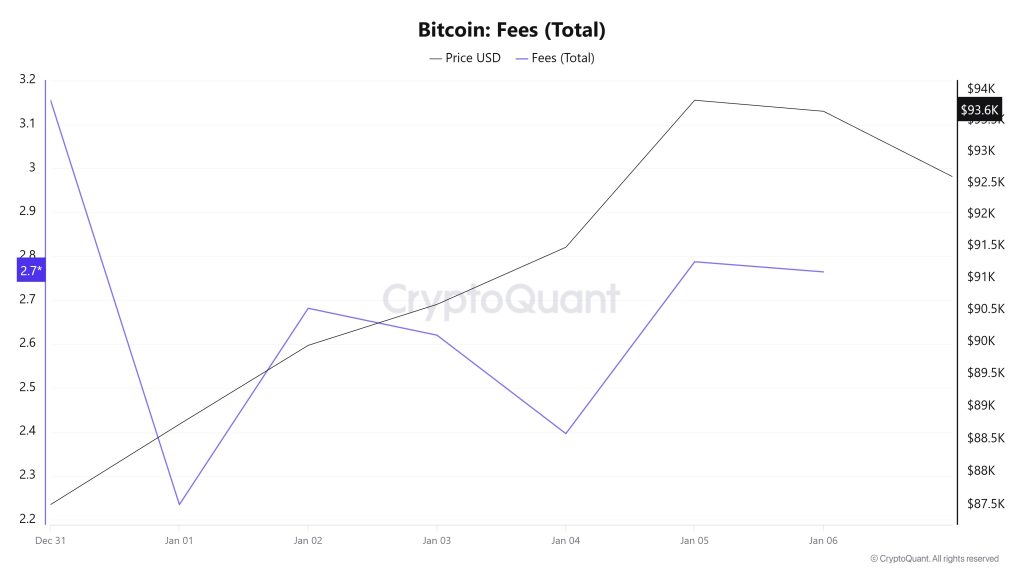
Similarly, when examining the Bitcoin Fees (Total) data for the period between December 31 and January 6, it is observed that the indicator reached the level of 3.15528709 on December 31, the first day of the week.
A decline was observed until January 1, and on that date, the indicator recorded its lowest value of the week at 2.23460679.
In this context, as a result of the increase in Bitcoin price volatility as of January 1, the indicator regained momentum and followed a positive trend due to the impact of price volatility.
On January 6, the last day of the weekly period, the indicator closed the week at 2.76438086.
Miner Flows
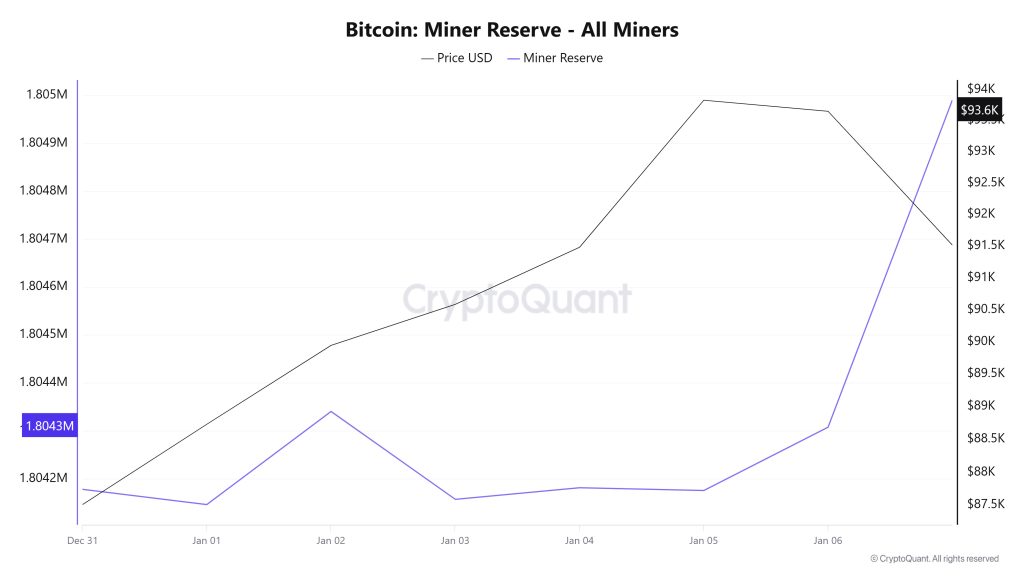
According to data obtained from the Miner Reserve table, a slight decrease in Bitcoin reserves held in miners’ wallets has been observed this week. A time-dependent correlation structure between the Bitcoin price and miner reserve was observed during the period examined. However, the general trend indicates that a negative correlation between these two variables is dominant.
Miner Inflow, Outflow, and Netflow
Between December 31 and January 6, 44,236 Bitcoin were withdrawn from miners’ wallets, while 44,020 Bitcoin were deposited into miners’ wallets during the same period. This week’s Miner Netflow was -216 Bitcoin. Meanwhile, the Bitcoin price was $87,510 on December 31 and $93,651 on January 6.
Throughout the week, Bitcoin inflows into miner wallets (Miner Inflow) were less than Bitcoin outflows from miner wallets (Miner Outflow), resulting in a negative net flow (Miner Netflow).
| Dec. 31 | Jan. 01 | Jan. 02 | Jan. 03 | Jan. 04 | Jan. 05 | Jan. 06 | |
|---|---|---|---|---|---|---|---|
| Miner Inflow | 6,832.99 | 5,293.30 | 6,760.73 | 3,462.82 | 3,880.33 | 8,620.74 | 9,168.88 |
| Miner Outflow | 7,179.32 | 5,325.17 | 6,566.34 | 3,646.24 | 3,856.12 | 8,626.56 | 9,036.66 |
| Miner Netflow | -346.33 | -31.87 | 194.39 | -183.41 | 24.22 | -5.81 | 132.22 |
Transaction
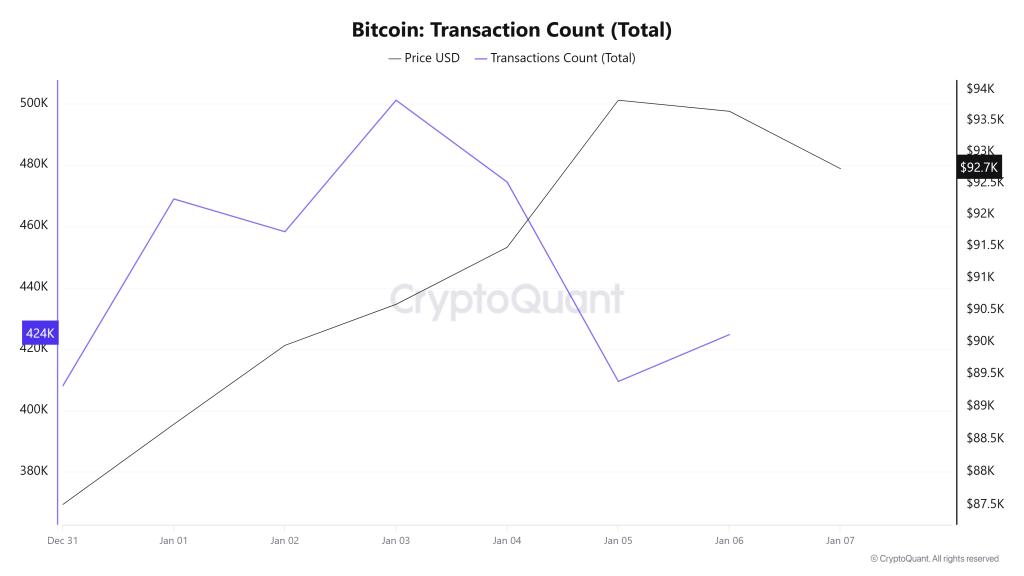
Last week, 3,083,855 transactions took place on the Bitcoin network, while this week the number of transactions rose to 3,145,056, recording an increase of approximately 1.98%. The highest transaction volume for the period was recorded on January 3 at 501,117, while the lowest transaction volume was measured on December 31 at 408,004.
When examining the transaction count graph, it is observed that the number of transactions occurring on weekends (Saturday/Sunday) is quite close to each other, and the total number of transactions on these days exceeds that of Friday and Monday. When this situation is evaluated in conjunction with the fact that transactions have been above average on Saturdays for approximately 9 weeks, it indicates that weekend transfers attributed to institutional actors continue to evolve to include Sundays, not just Saturdays. Although no specific reason requiring these intensive transactions to be carried out specifically on weekends has yet been clearly observed in the market, it can be interpreted that there has been a change in the behavior patterns of the usual suspects (institutional actors) based on daily transaction numbers. When the relationship between transaction count and price is examined over the period, negative divergences appear to be in the majority.
Tokens Transferred
While a total of 5,329,609 BTC was transferred in the previous period, this week’s volume fell by 1.19% to 5,265,998 BTC. The highest daily transfer volume for the week was recorded on December 31 at 974,349 BTC, while the lowest daily volume was recorded on January 1 at 604,080 BTC. The correlation between the amount of BTC transferred and the price showed a more positive trend throughout the period, creating an appearance of moving closer to each other.
While the amount of Bitcoin transferred has decreased, the increase in transaction count data indicates that the amount of Bitcoin per transaction on the network has decreased compared to last week. This shows that lower-volume and smaller-sized transactions have gained prominence during the period . This structure indicates that a greater number of relatively small-value transfers are taking place on the network.
Whale Activities

Whales Data:
Looking at whale activity on centralized exchanges over the past 7 days based on cryptocurrency market data, we see that the process followed a volatile and fluctuating path at the beginning. In the middle of the process, we can say that it entered a downward trend and activity on centralized exchanges decreased. Towards the end, we see that it started to rise again. Looking at the Exchange Whale Ratio metric, on December 31, the first day of the 7-day period, the ratio of whales using centralized exchanges was 0.548. On January 1, the second day of the process, it reached its peak, reaching a value of 0.617. The metric then declined, reaching its lowest point on January 4, falling to 0.442. When this ratio is above the 0.35–0.45 range, it generally means that whales are frequently using centralized exchanges. Currently at 0.525, the metric corresponds to a time when whales are heavily using centralized exchanges. During this period, the price fluctuated between $87,300 and $94,500. This indicated that the buying side prevailed in the trading battle between whales on centralized exchanges. At the same time, the total BTC transfer volume mirrored last week’s trend, with 5,265,998 BTC moving. The data shows that while retail investors closed their positions, those holding 10 to 10,000 BTC in their wallets accumulated approximately $5.3 billion by purchasing 56,427 BTC. As a result, we can say that very large whales caused the increase in BTC’s value and that small investors sold, which is usually a sign of an upcoming rise.
BTC Onchain Overall
| Metric | Positive 📈 | Negative 📉 | Neutral ➖ |
|---|---|---|---|
| Active Addresses | ✓ | ||
| Breakdowns | ✓ | ||
| Derivatives | ✓ | ||
| Supply Distribution | ✓ | ||
| Exchange Supply Ratio | ✓ | ||
| Exchange Reserve | ✓ | ||
| Fees and Revenues | ✓ | ||
| Miner Flows | ✓ | ||
| Transaction | ✓ | ||
| Whale Activity | ✓ |
- The metrics and guidance provided in the table do not alone explain or imply any expectation of future price changes for any asset. Digital asset prices can fluctuate based on numerous variables. The on-chain analysis and related guidance are intended to assist investors in their decision-making process, and basing financial investments solely on the results of this analysis may lead to unfavorable outcomes. Even if all metrics simultaneously produce positive, negative, or neutral results, the expected outcomes may not materialize depending on market conditions. It would be beneficial for investors reviewing the report to take these warnings into consideration.
Legal Notice
The investment information, comments, and recommendations contained in this document do not constitute investment advisory services. Investment advisory services are provided by authorized institutions on a personal basis, taking into account the risk and return preferences of individuals. The comments and recommendations contained in this document are of a general nature. These recommendations may not be suitable for your financial situation and risk and return preferences. Therefore, making an investment decision based solely on the information contained in this document may not result in outcomes that align with your expectations.
