
Active Addresses
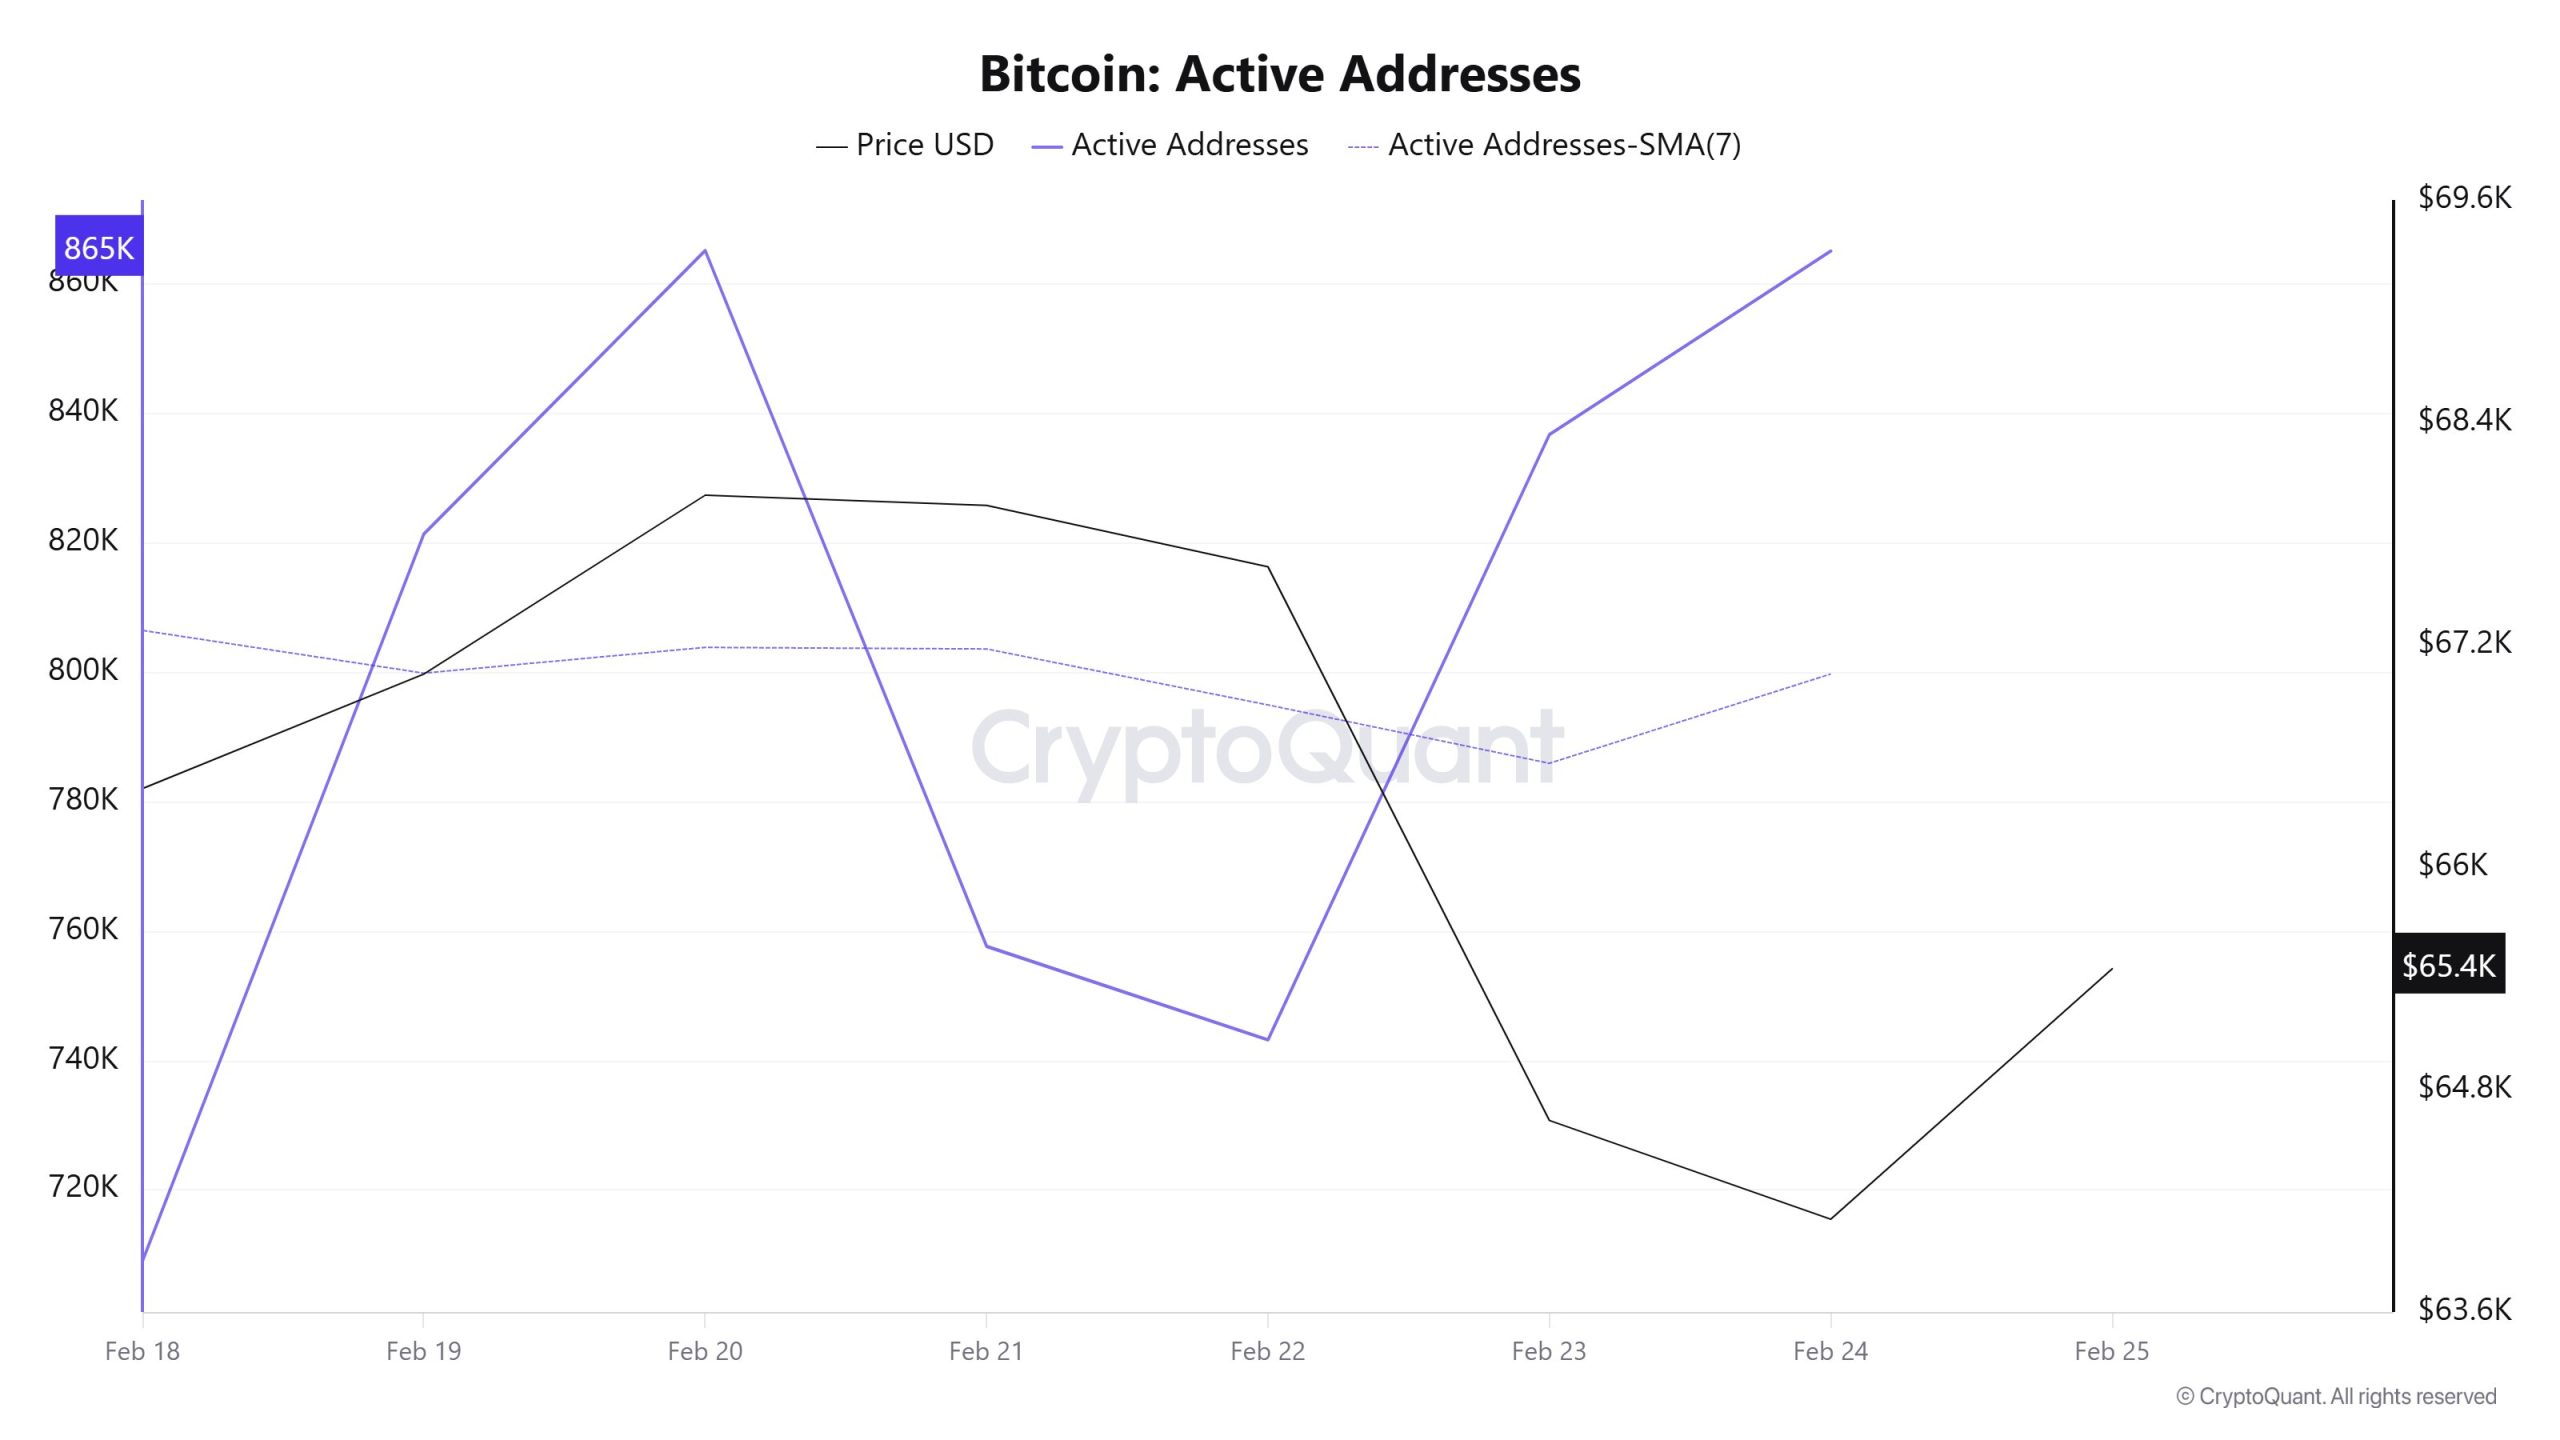
Between February 18 and February 25, recorded 5,598,305 active addresses on the Bitcoin network. During this period, Bitcoin’s price fell from $68,700 at the beginning of the week to $62,471 on February 24. From a technical perspective, the 7-day simple moving average (SMA) is observed to be moving downward.
Active Sending Addresses
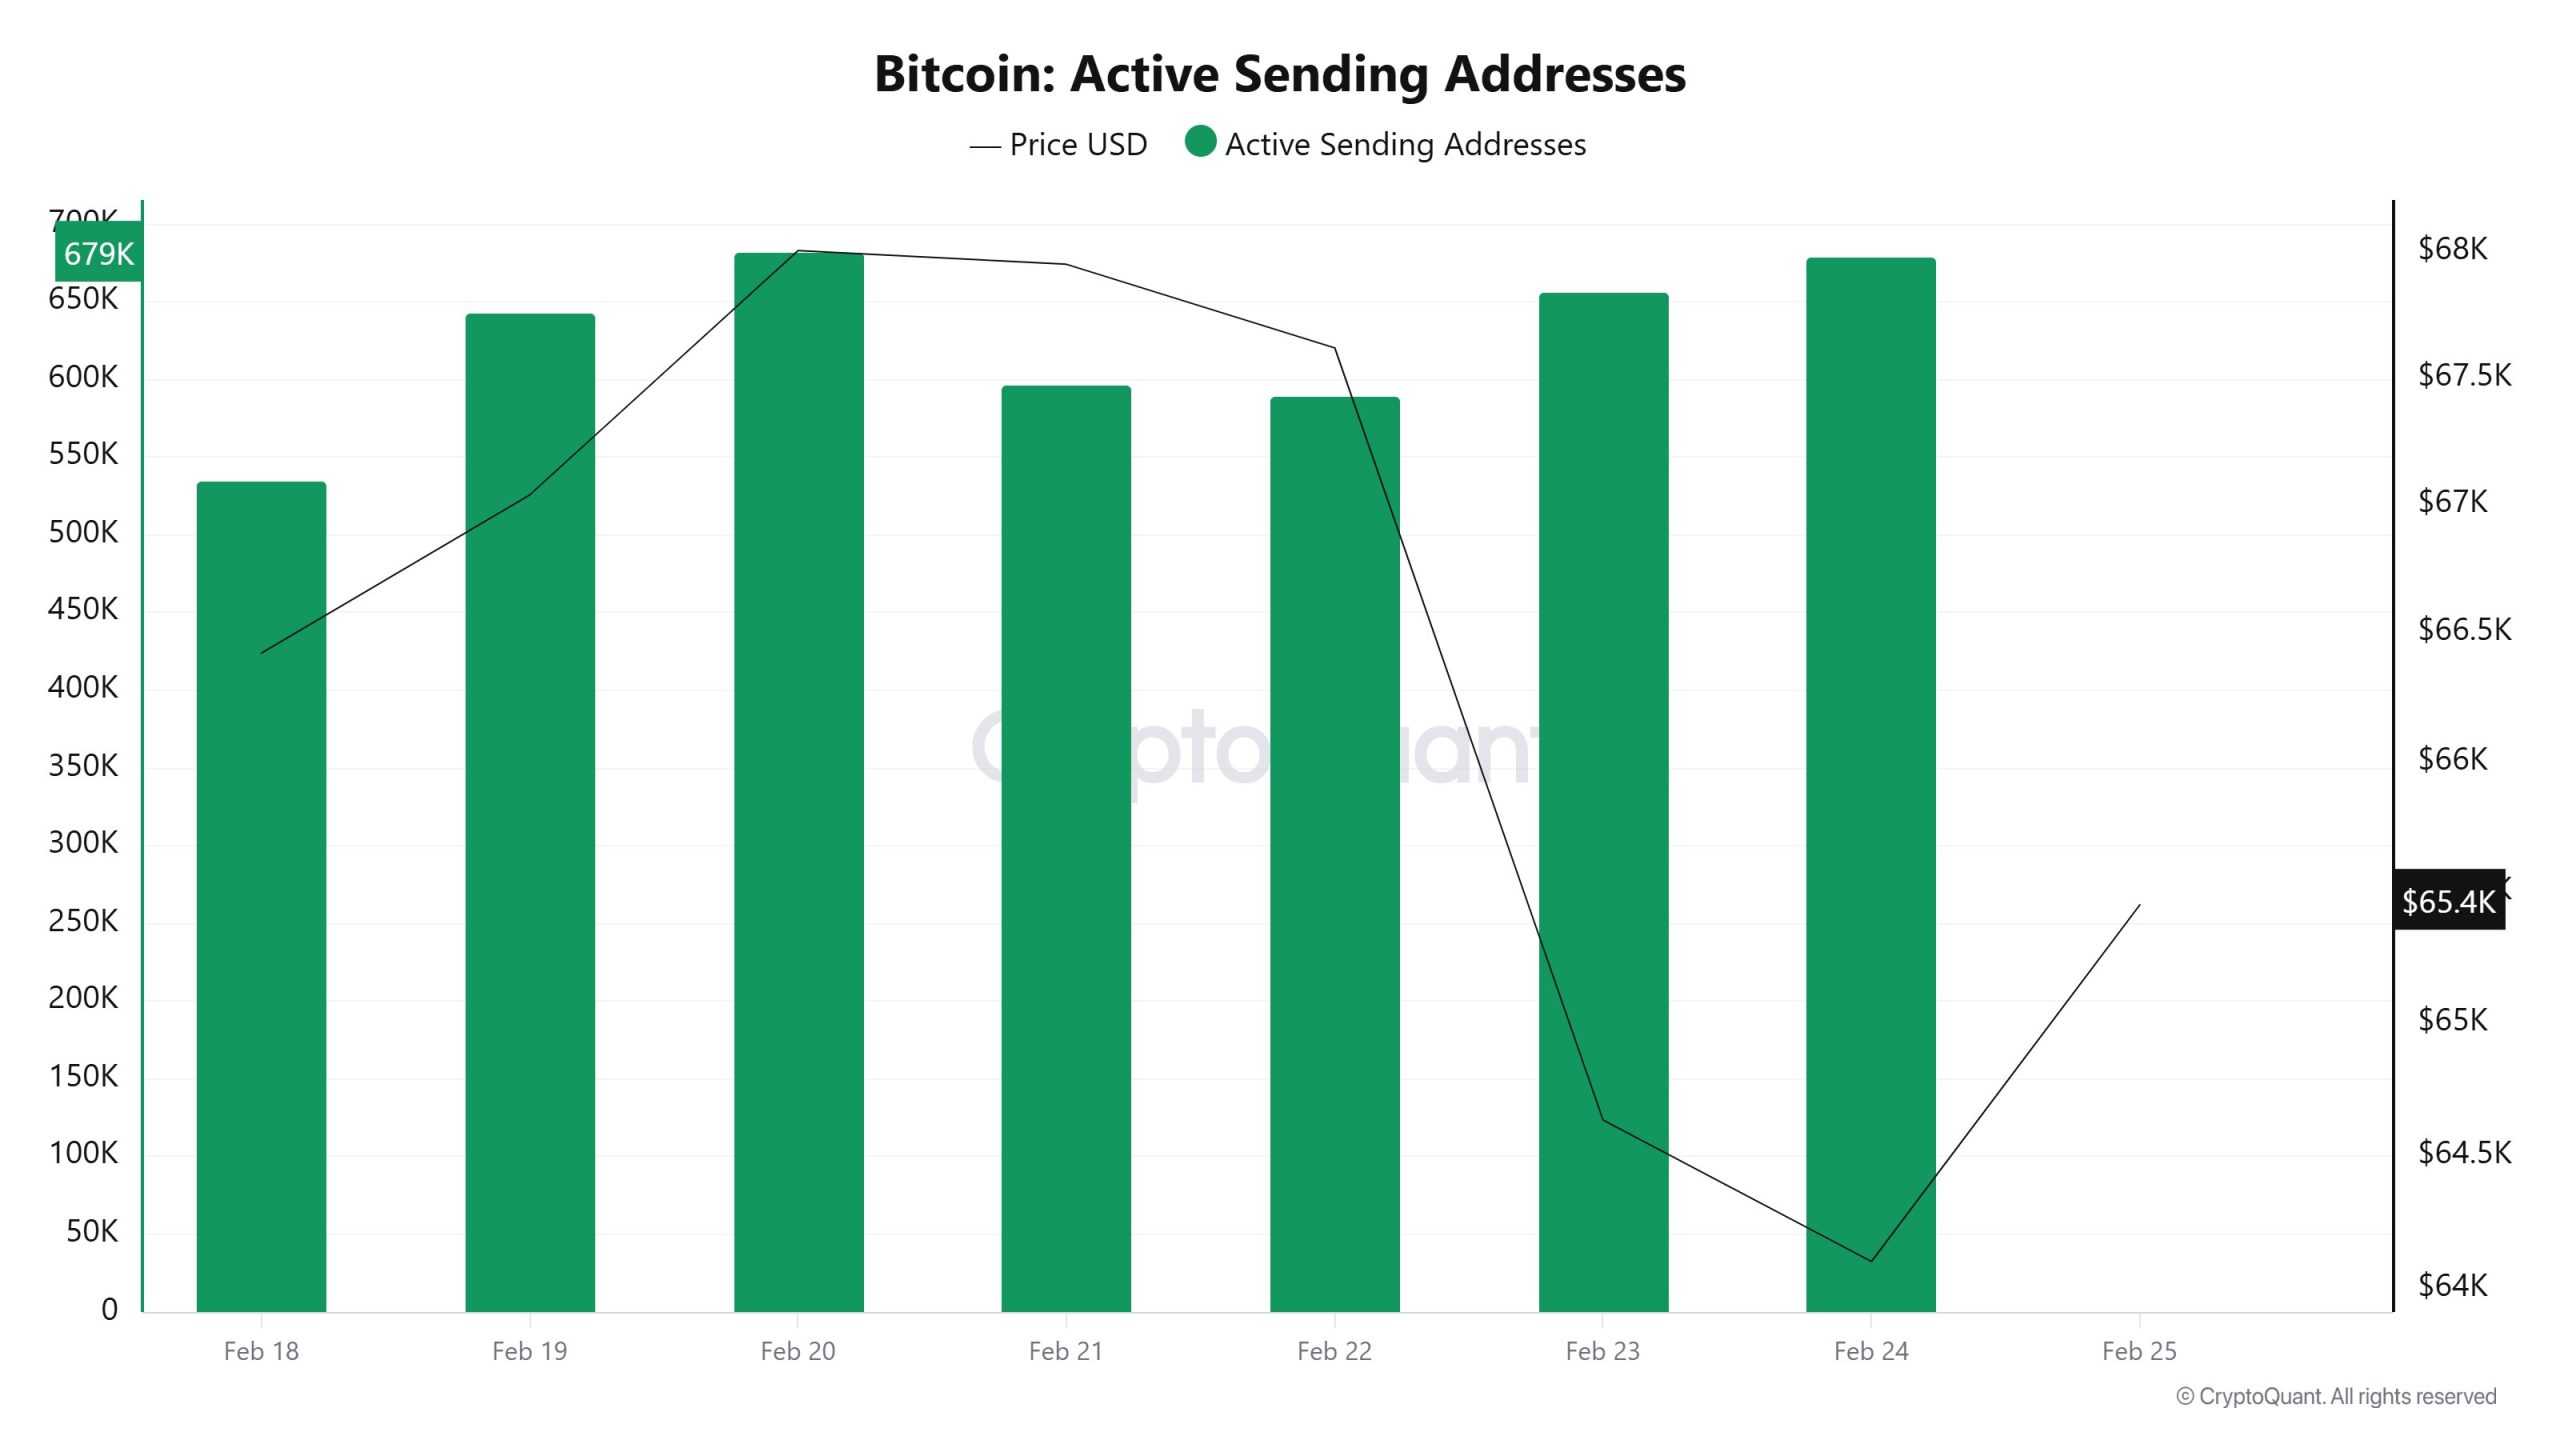
Between February 18 and February 25, an upward trend was observed in the active sending addresses metric. On February 24, when the price reached its highest level, the metric stood at 679,015. This data shows that the $62,500 level was supported not only by price but also by on-chain address activity. Overall, the Active Sending Addresses metric followed a high trajectory during this period.
Active Receiving Addresses
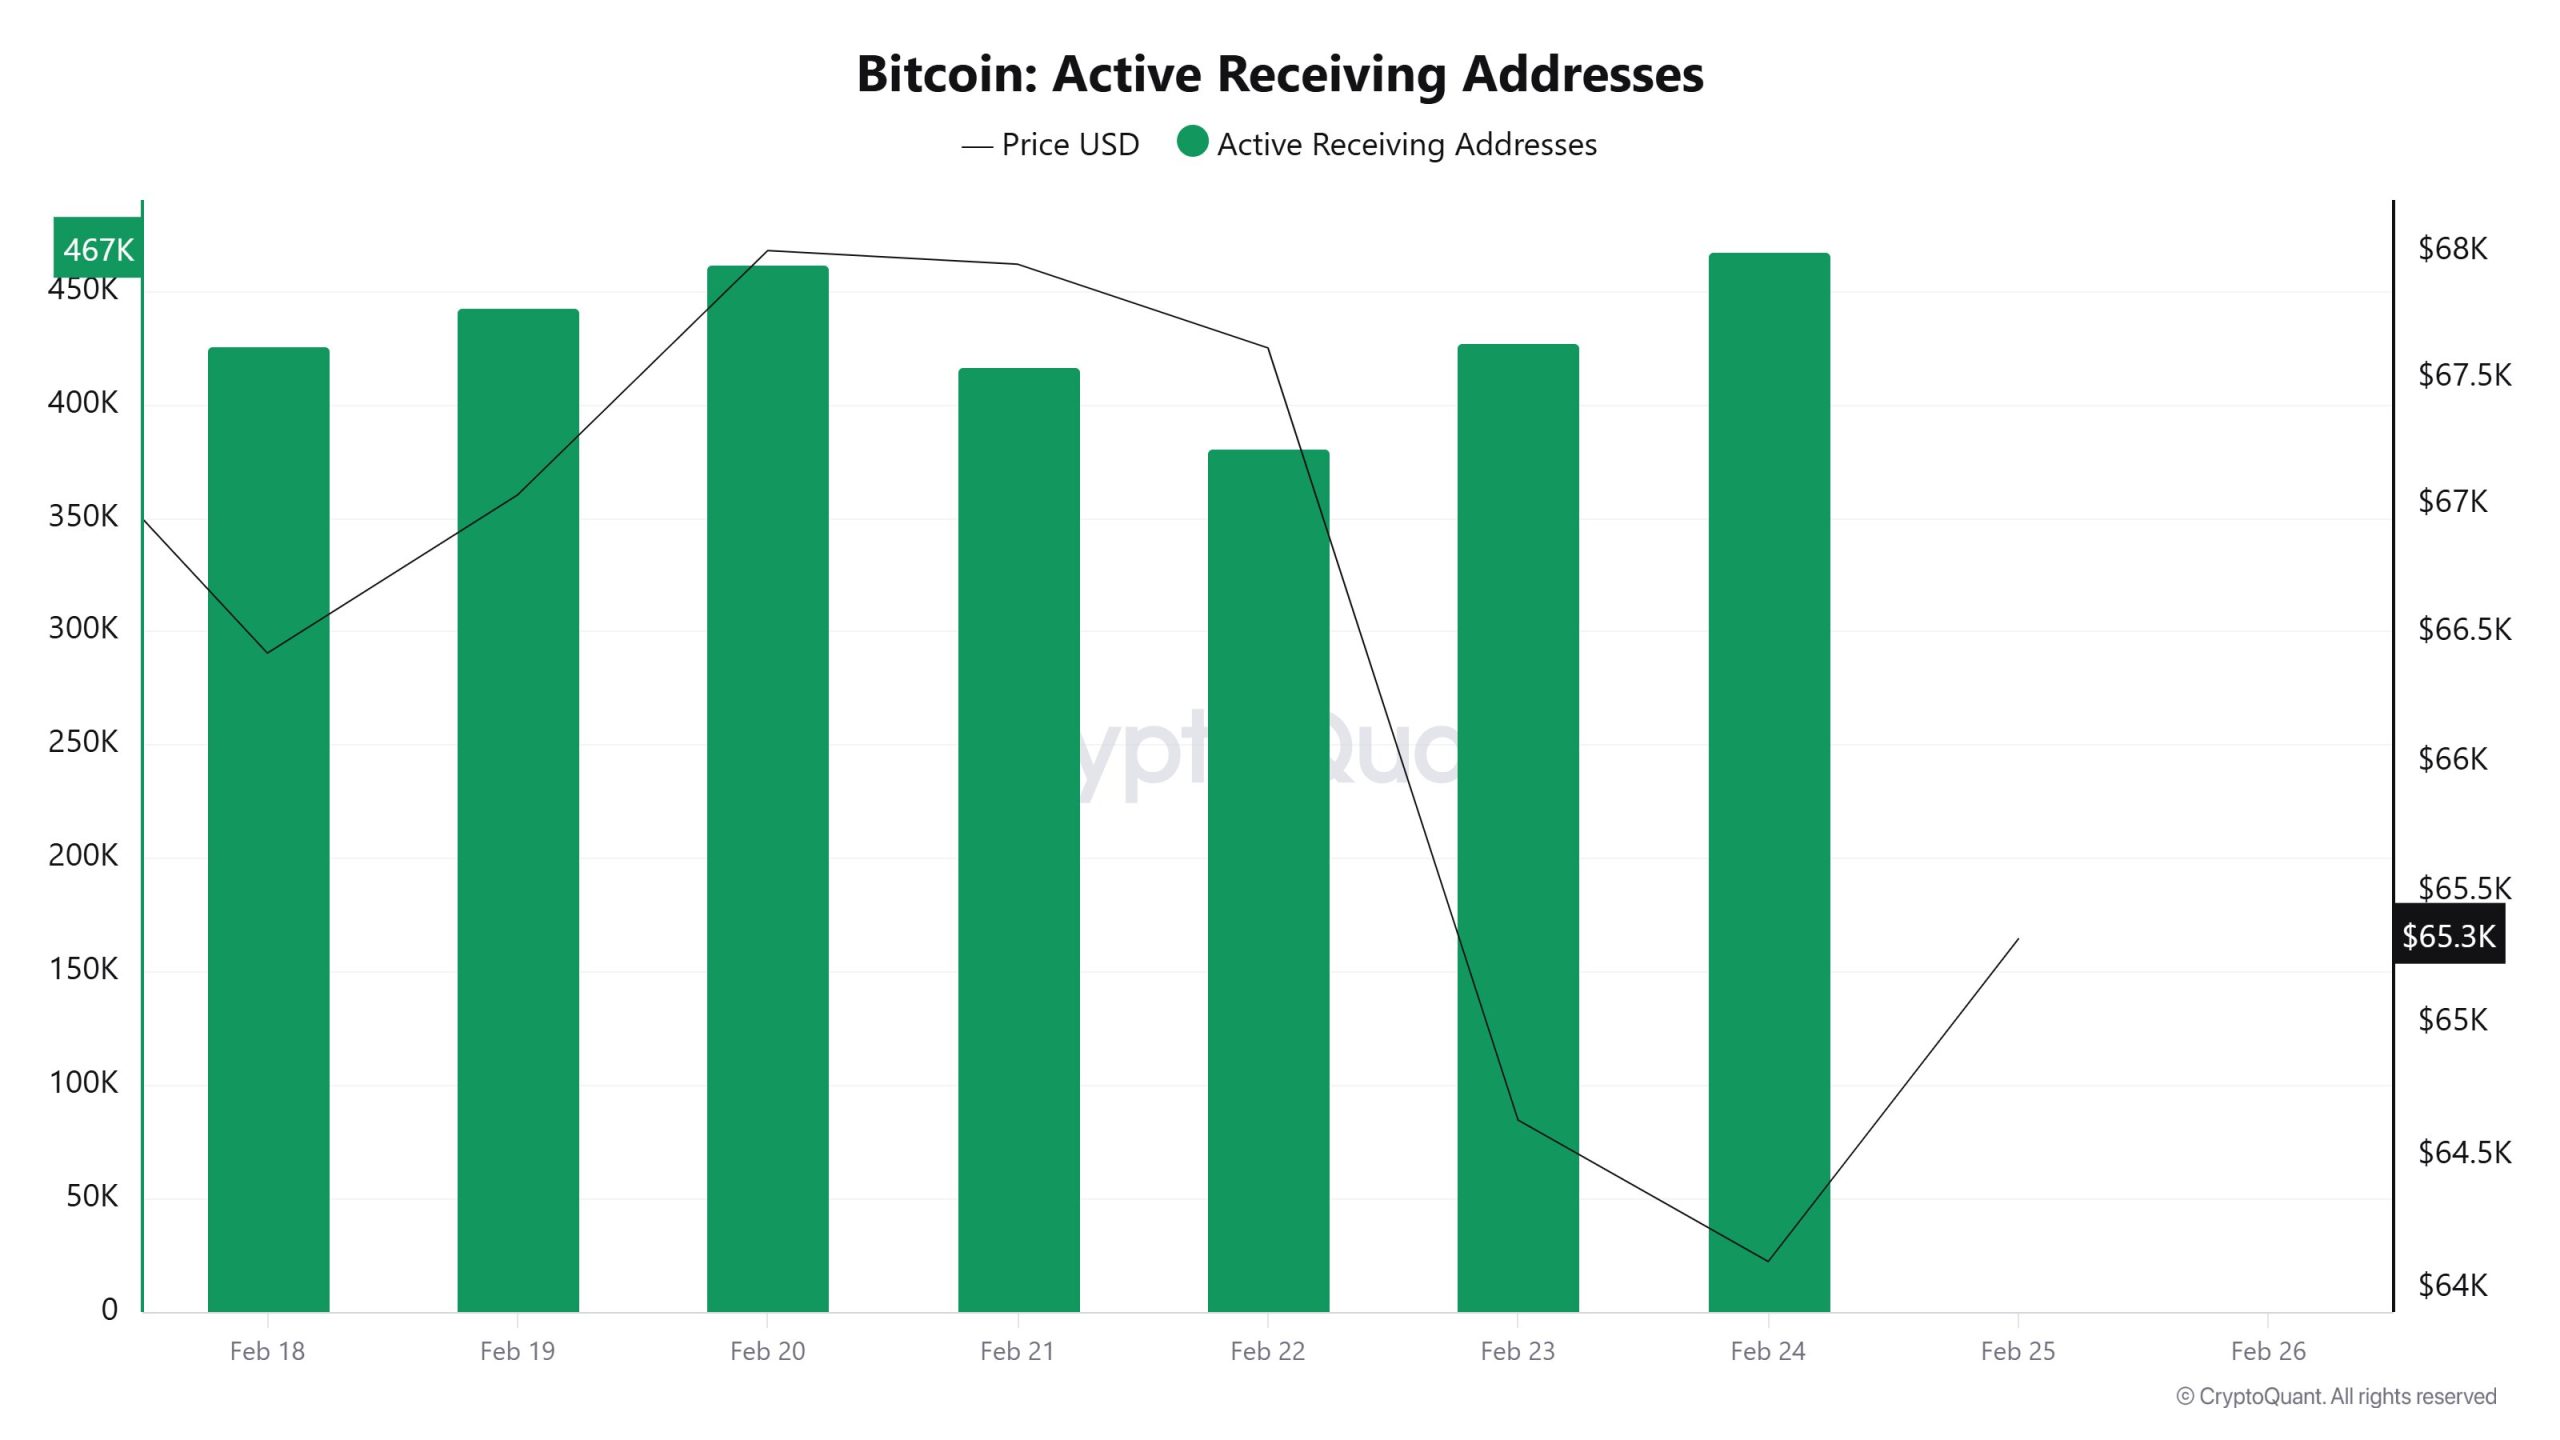
Between February 18 and February 25, active receiving addresses experienced a typical decline alongside the Black Line (price line). On the day the price reached its lowest level, active receiving addresses rose to 467,172, indicating that buyers were acquiring Bitcoin at the $62,500 level.
Breakdowns
MRVR
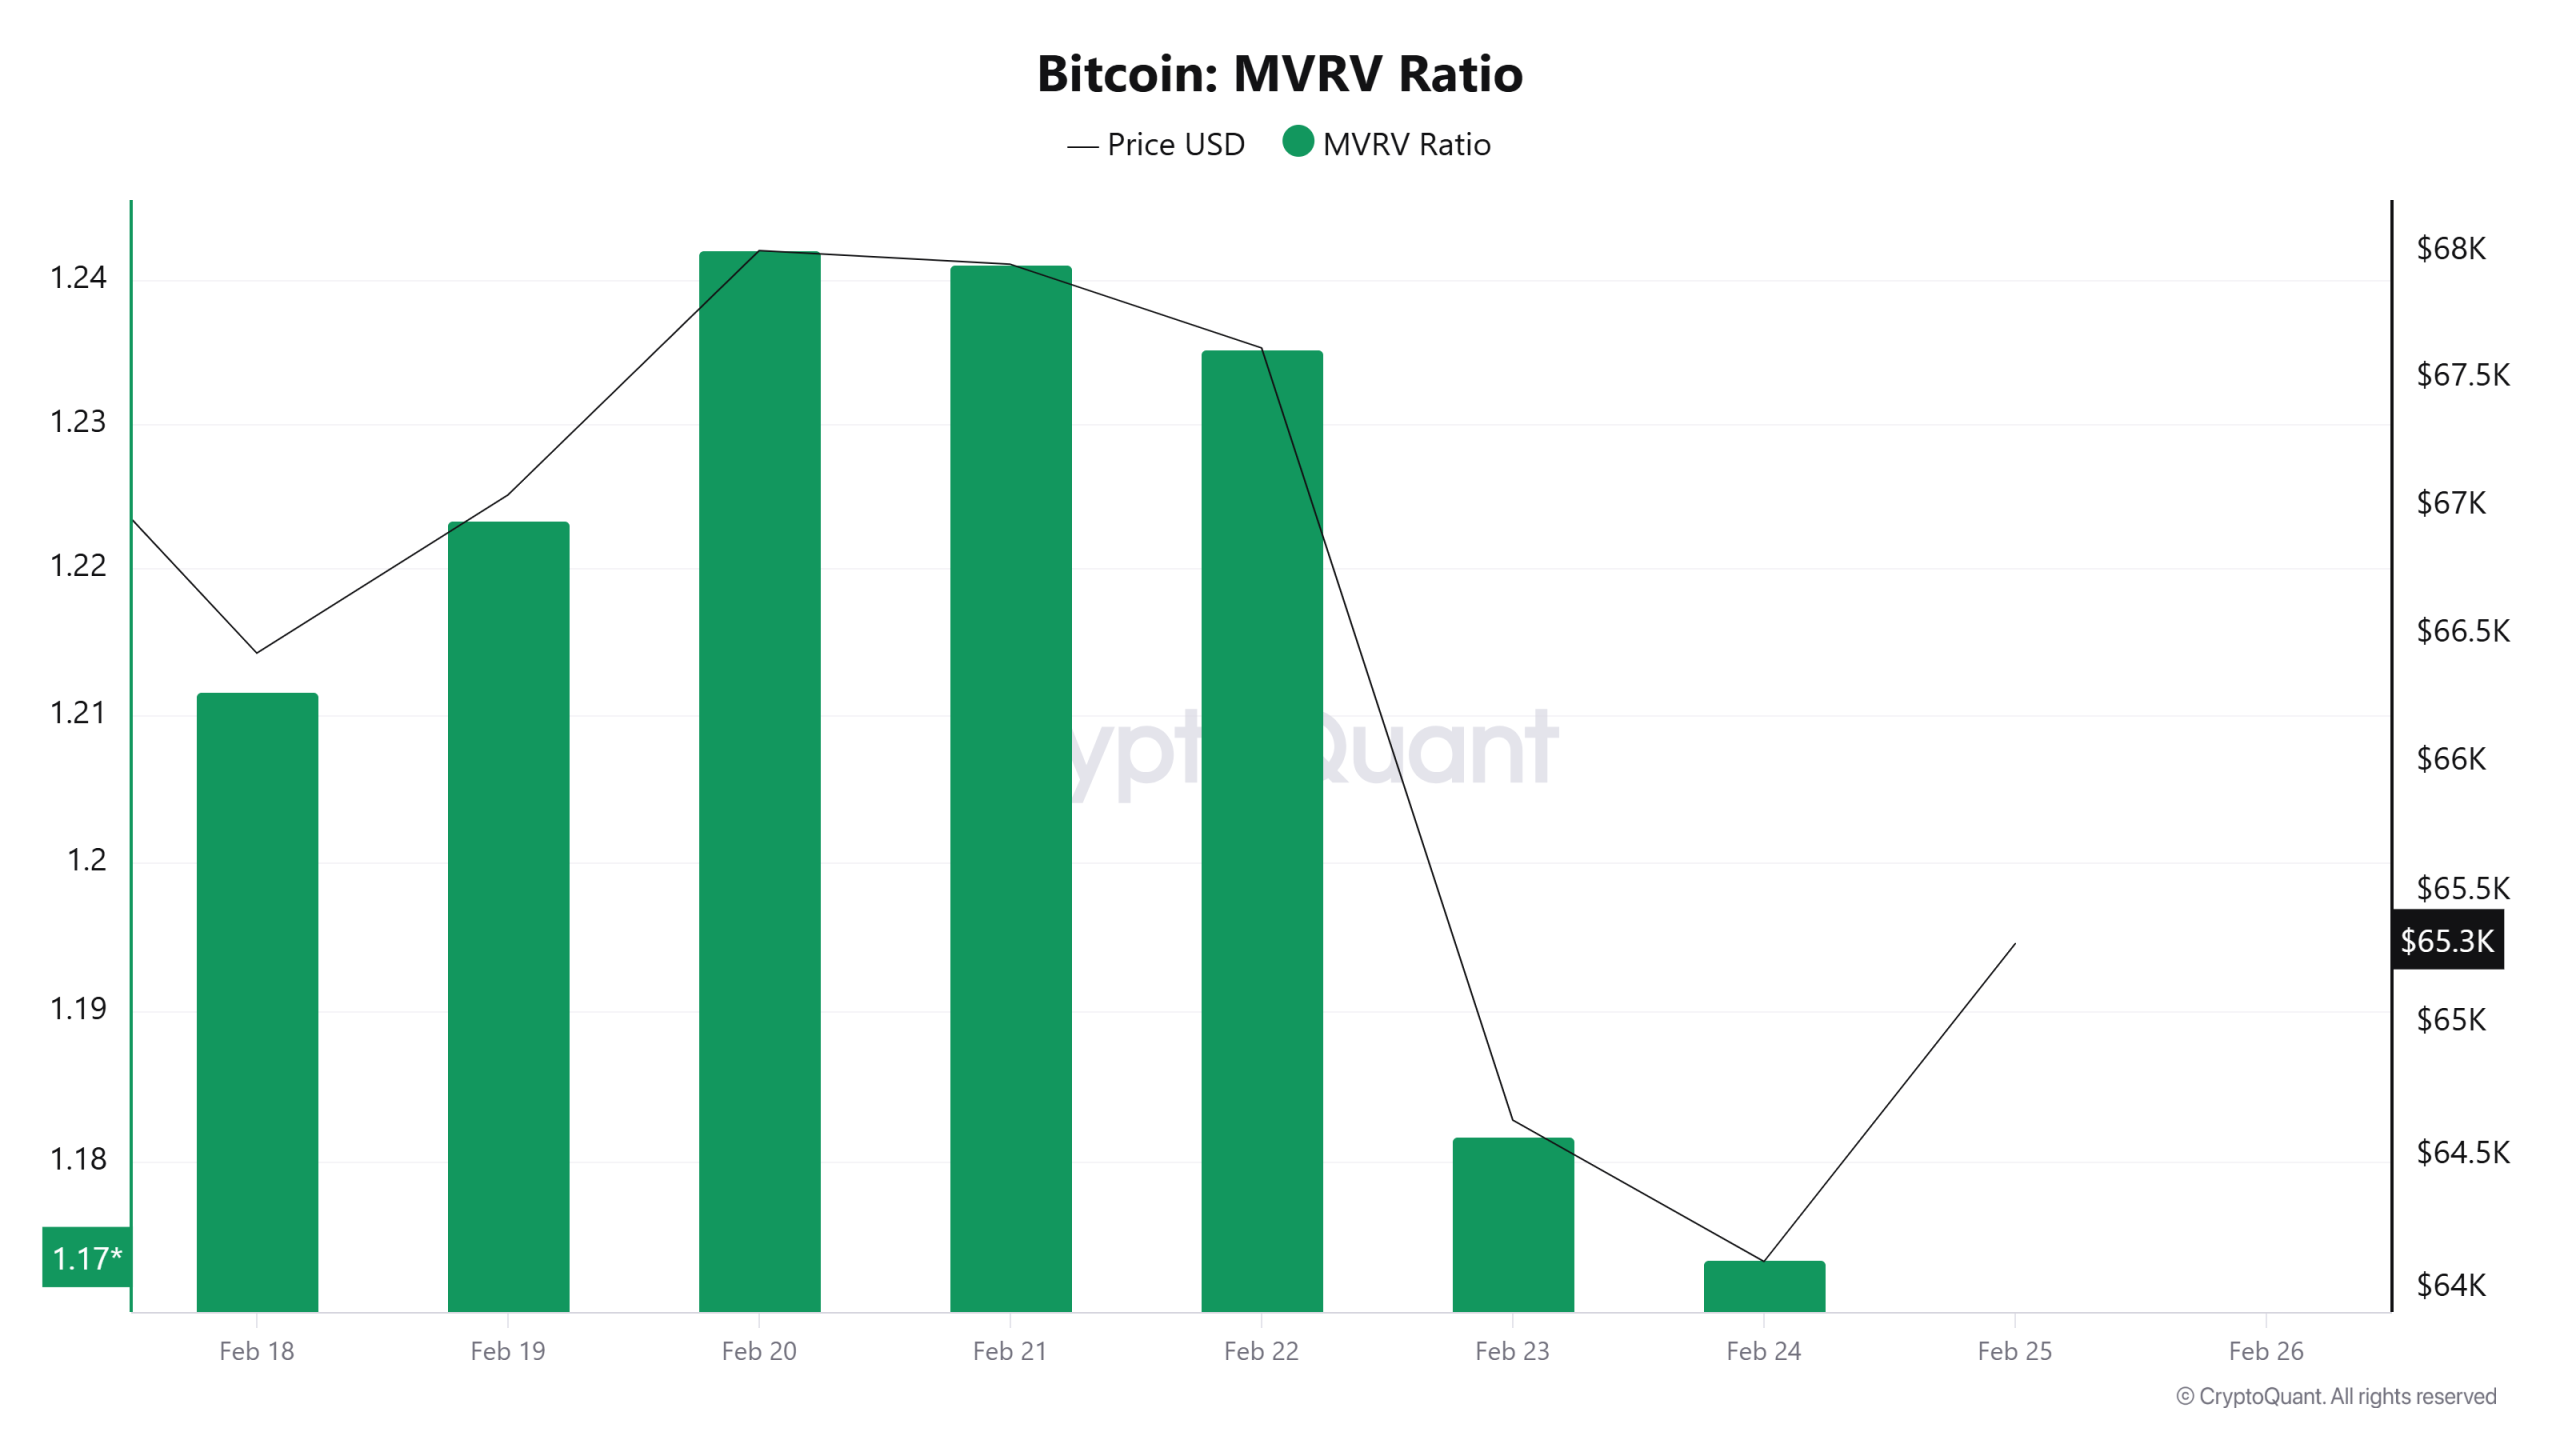
Following the limited recovery seen in Bitcoin’s MVRV last week, this week the indicator is showing renewed weakness. While the price remained relatively flat between February 18 and 22, the MVRV’s downward shift from the 1.24 region indicates that the spot price’s premium relative to its realized cost basis has narrowed. The MVRV’s retreat to around 1.17, particularly during the February 23–24 period, signals that market profit margins are tightening and investors are taking a more cautious stance compared to the previous week. Although there has been a limited recovery in prices, the MVRV’s failure to produce a strong expansion suggests that the uptrend is not yet supported by strong risk appetite. In summary, the downward trend of the MVRV indicates that momentum remains fragile in the short term. For the trend to regain strength, a sustained and significant expansion in the MVRV premium will be critical.
Realized Price
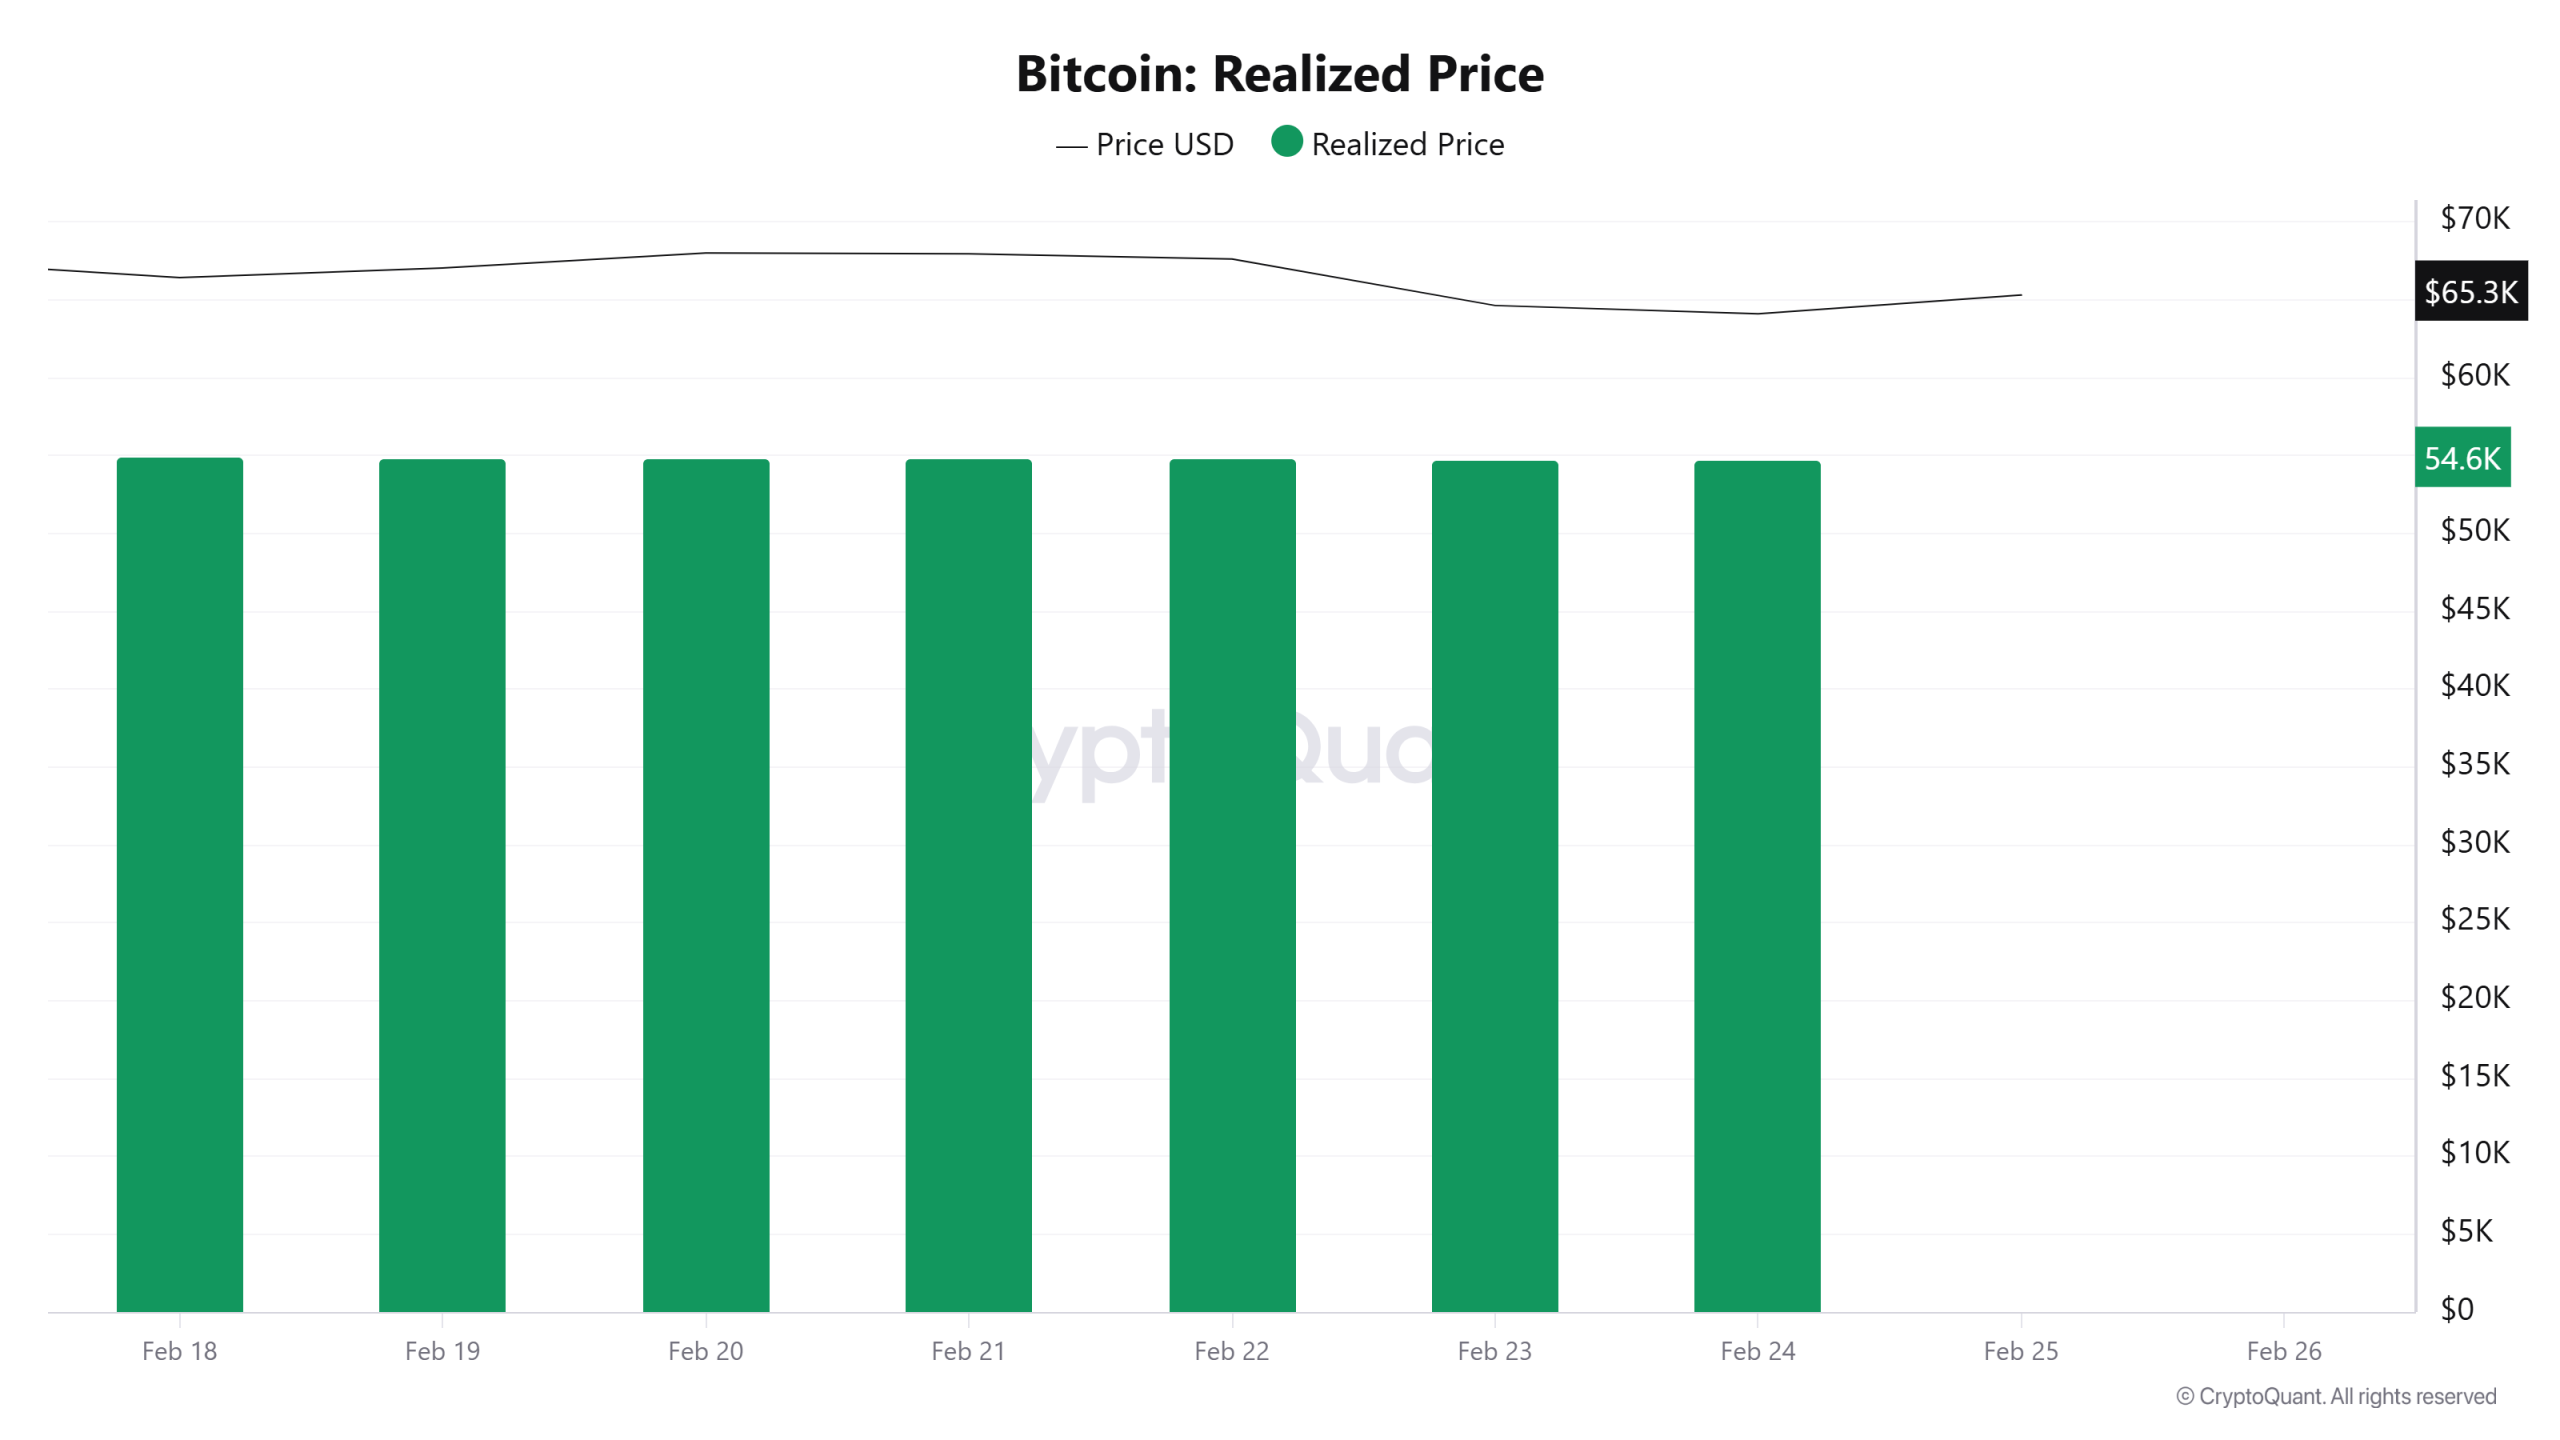
On the Bitcoin side, this week shows a relatively flat and calm outlook on the Realized Price front. According to the chart, while the Realized Price maintains its flat trajectory around 54.6K, the spot price fluctuates in the 65–66K range. Compared to last week, there is no significant strengthening or weakening in the cost base. This situation indicates that new and high-cost strong entries into the market are still limited. In other words, even though the spot price is moving, the on-chain average cost base has not strongly pushed it upward. Nevertheless, the spot price remaining significantly above the realized price confirms that the market is still trading at a premium relative to the realized cost base. However, the slow pace of premium expansion indicates that the current uptrend is characterized more by balance and consolidation . In summary, the structure remains positive, but a clearer upward trend in realized prices is needed to confirm that the trend is regaining strength.
Spent Output Profit Ratio (SOPR)
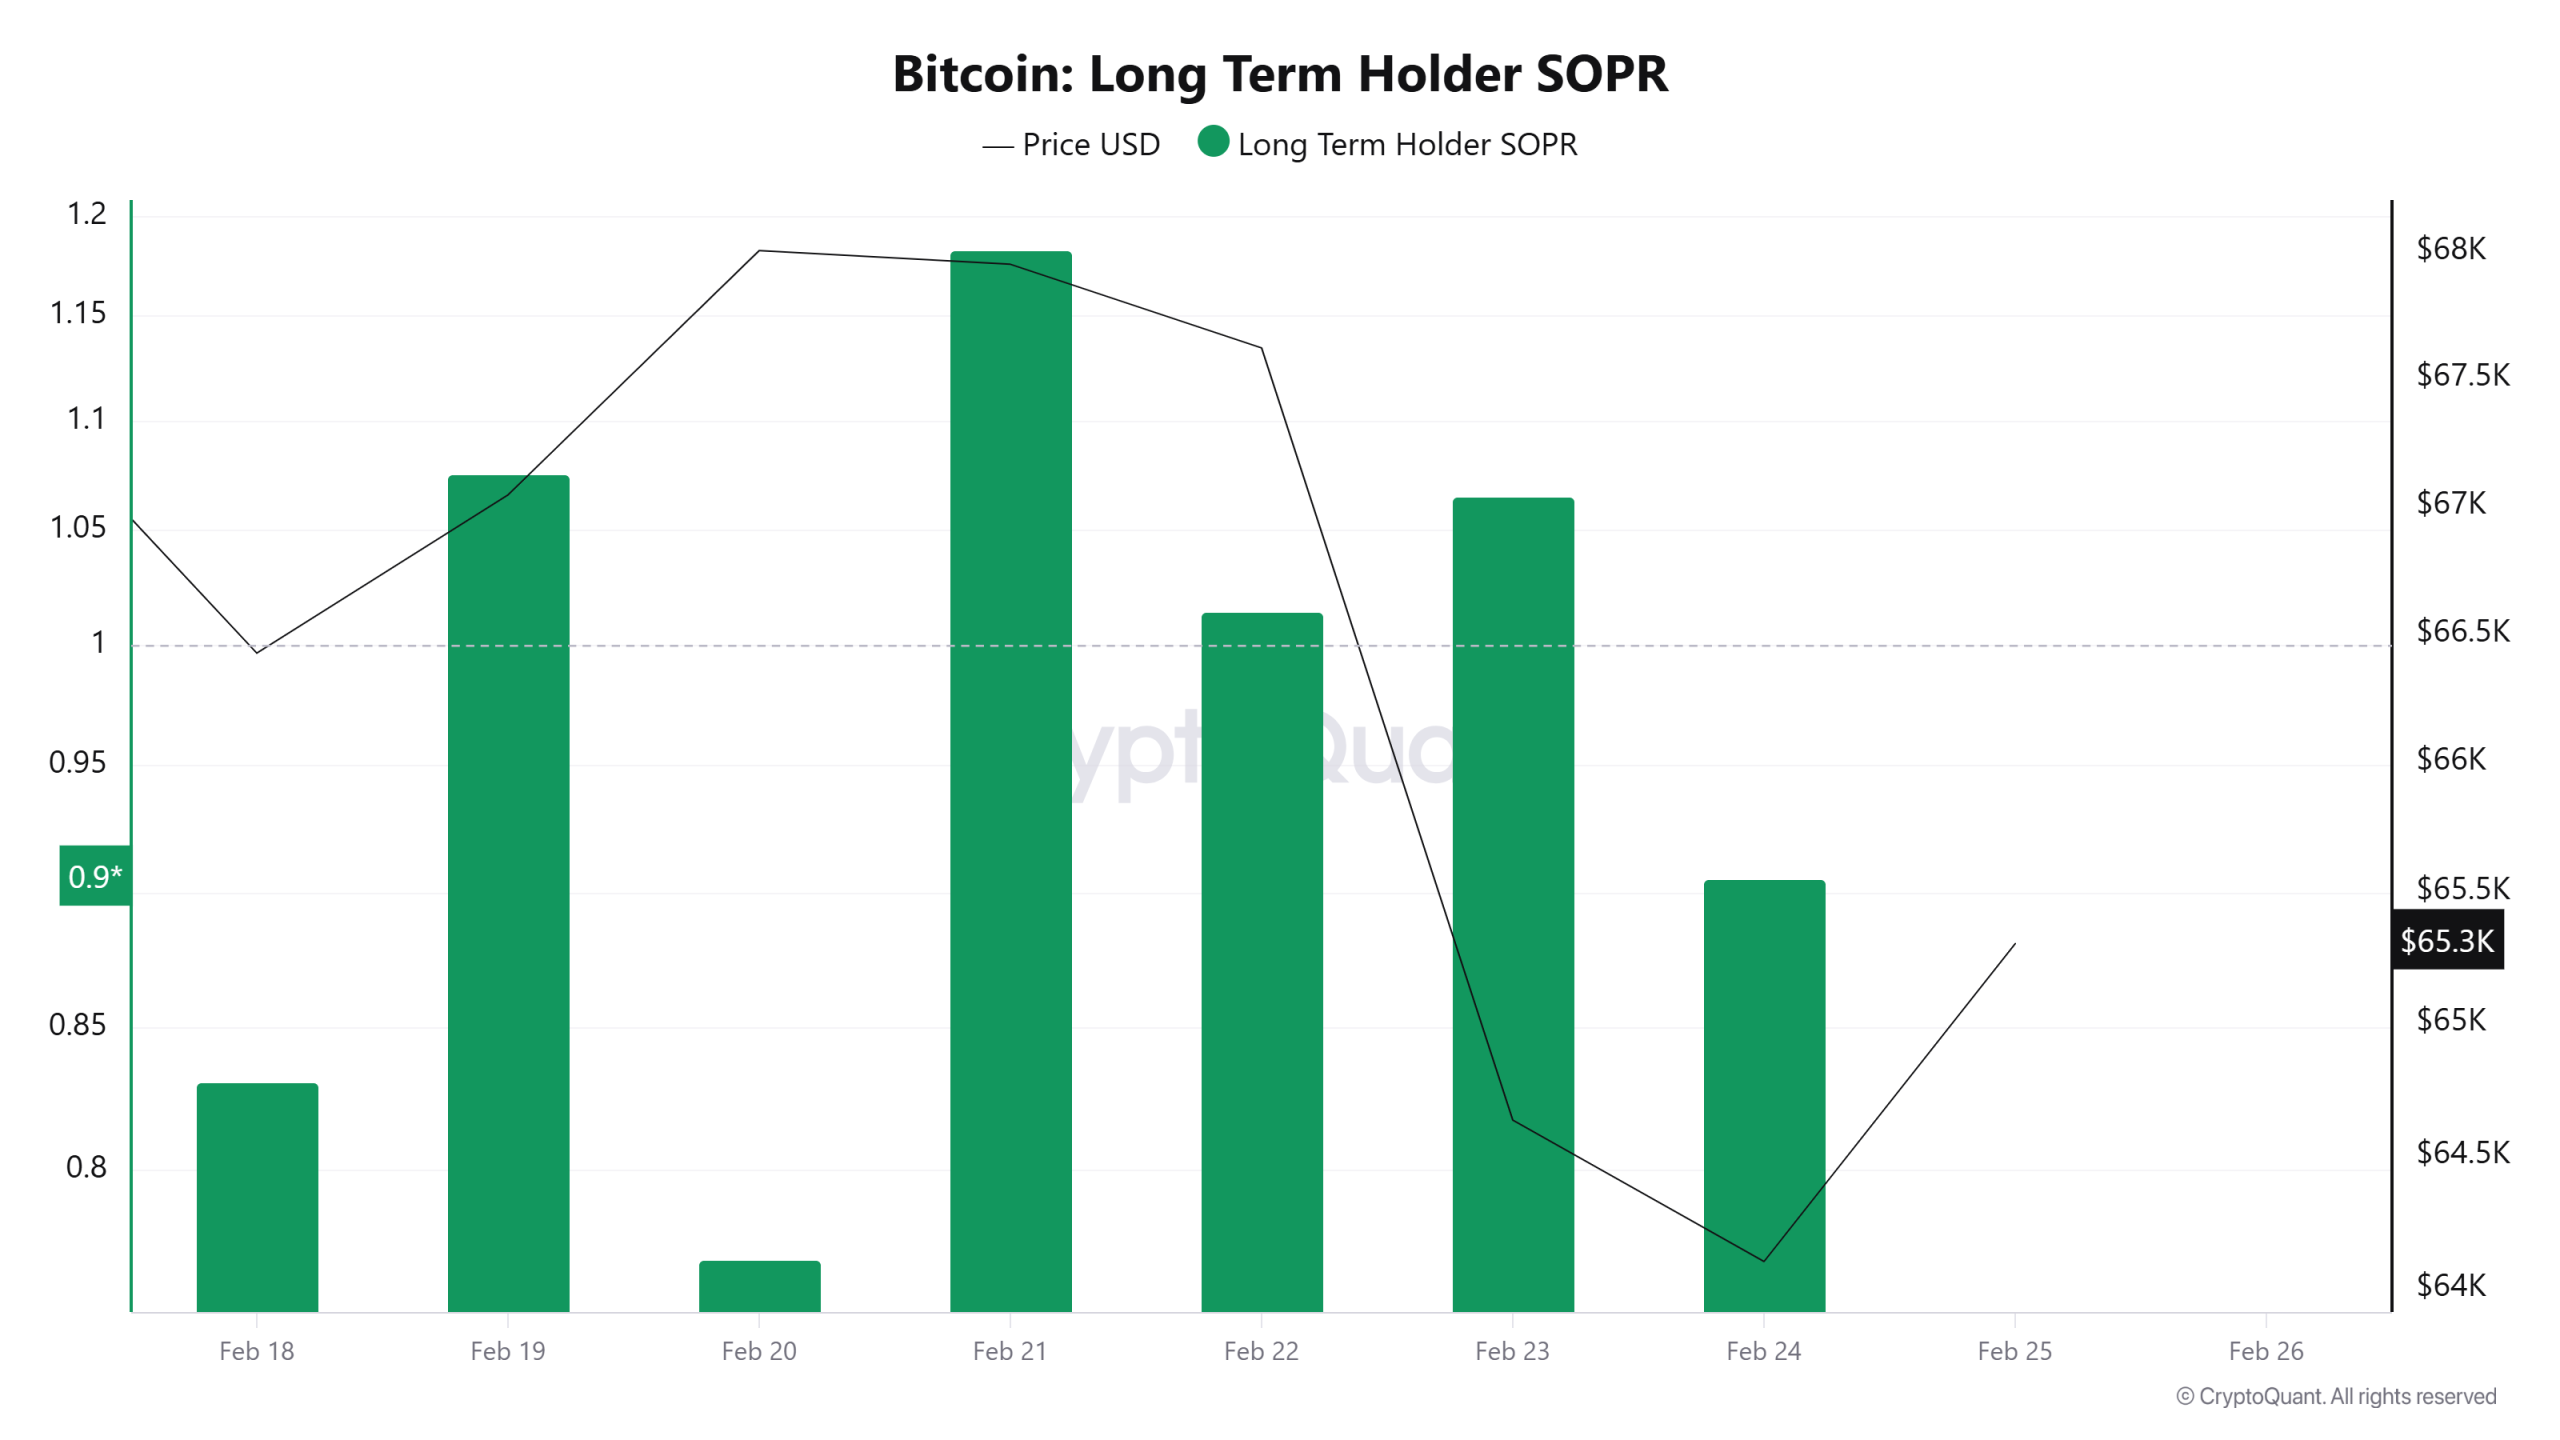
On the Bitcoin side, the Long-Term Holder SOPR indicator shows a volatile but generally weak outlook this week. According to the chart, the metric fluctuated above and below the 1 level during the week and is now trading close to closing below 1 (around 0.90).
The key difference compared to last week is that SOPR has not been able to settle permanently above 1. This indicates that, on average, long-term investors’ transactions are still occurring near break-even or in the loss zone rather than realizing profits. The sharp decline seen in the middle of the week, in particular, confirms that profit appetite remains limited amid price weakness. Nevertheless, occasional spikes above 1 in the metric do not point to an entirely negative picture. This structure shows that the market continues to seek equilibrium in bottom-like areas, but a strong profit-taking cycle has not yet begun. In short, there is no sustained strengthening on the LTH-SOPR side yet. For the trend to clearly turn positive, it remains critical for the indicator to hold steadily above 1.
Derivatives
Open Interest
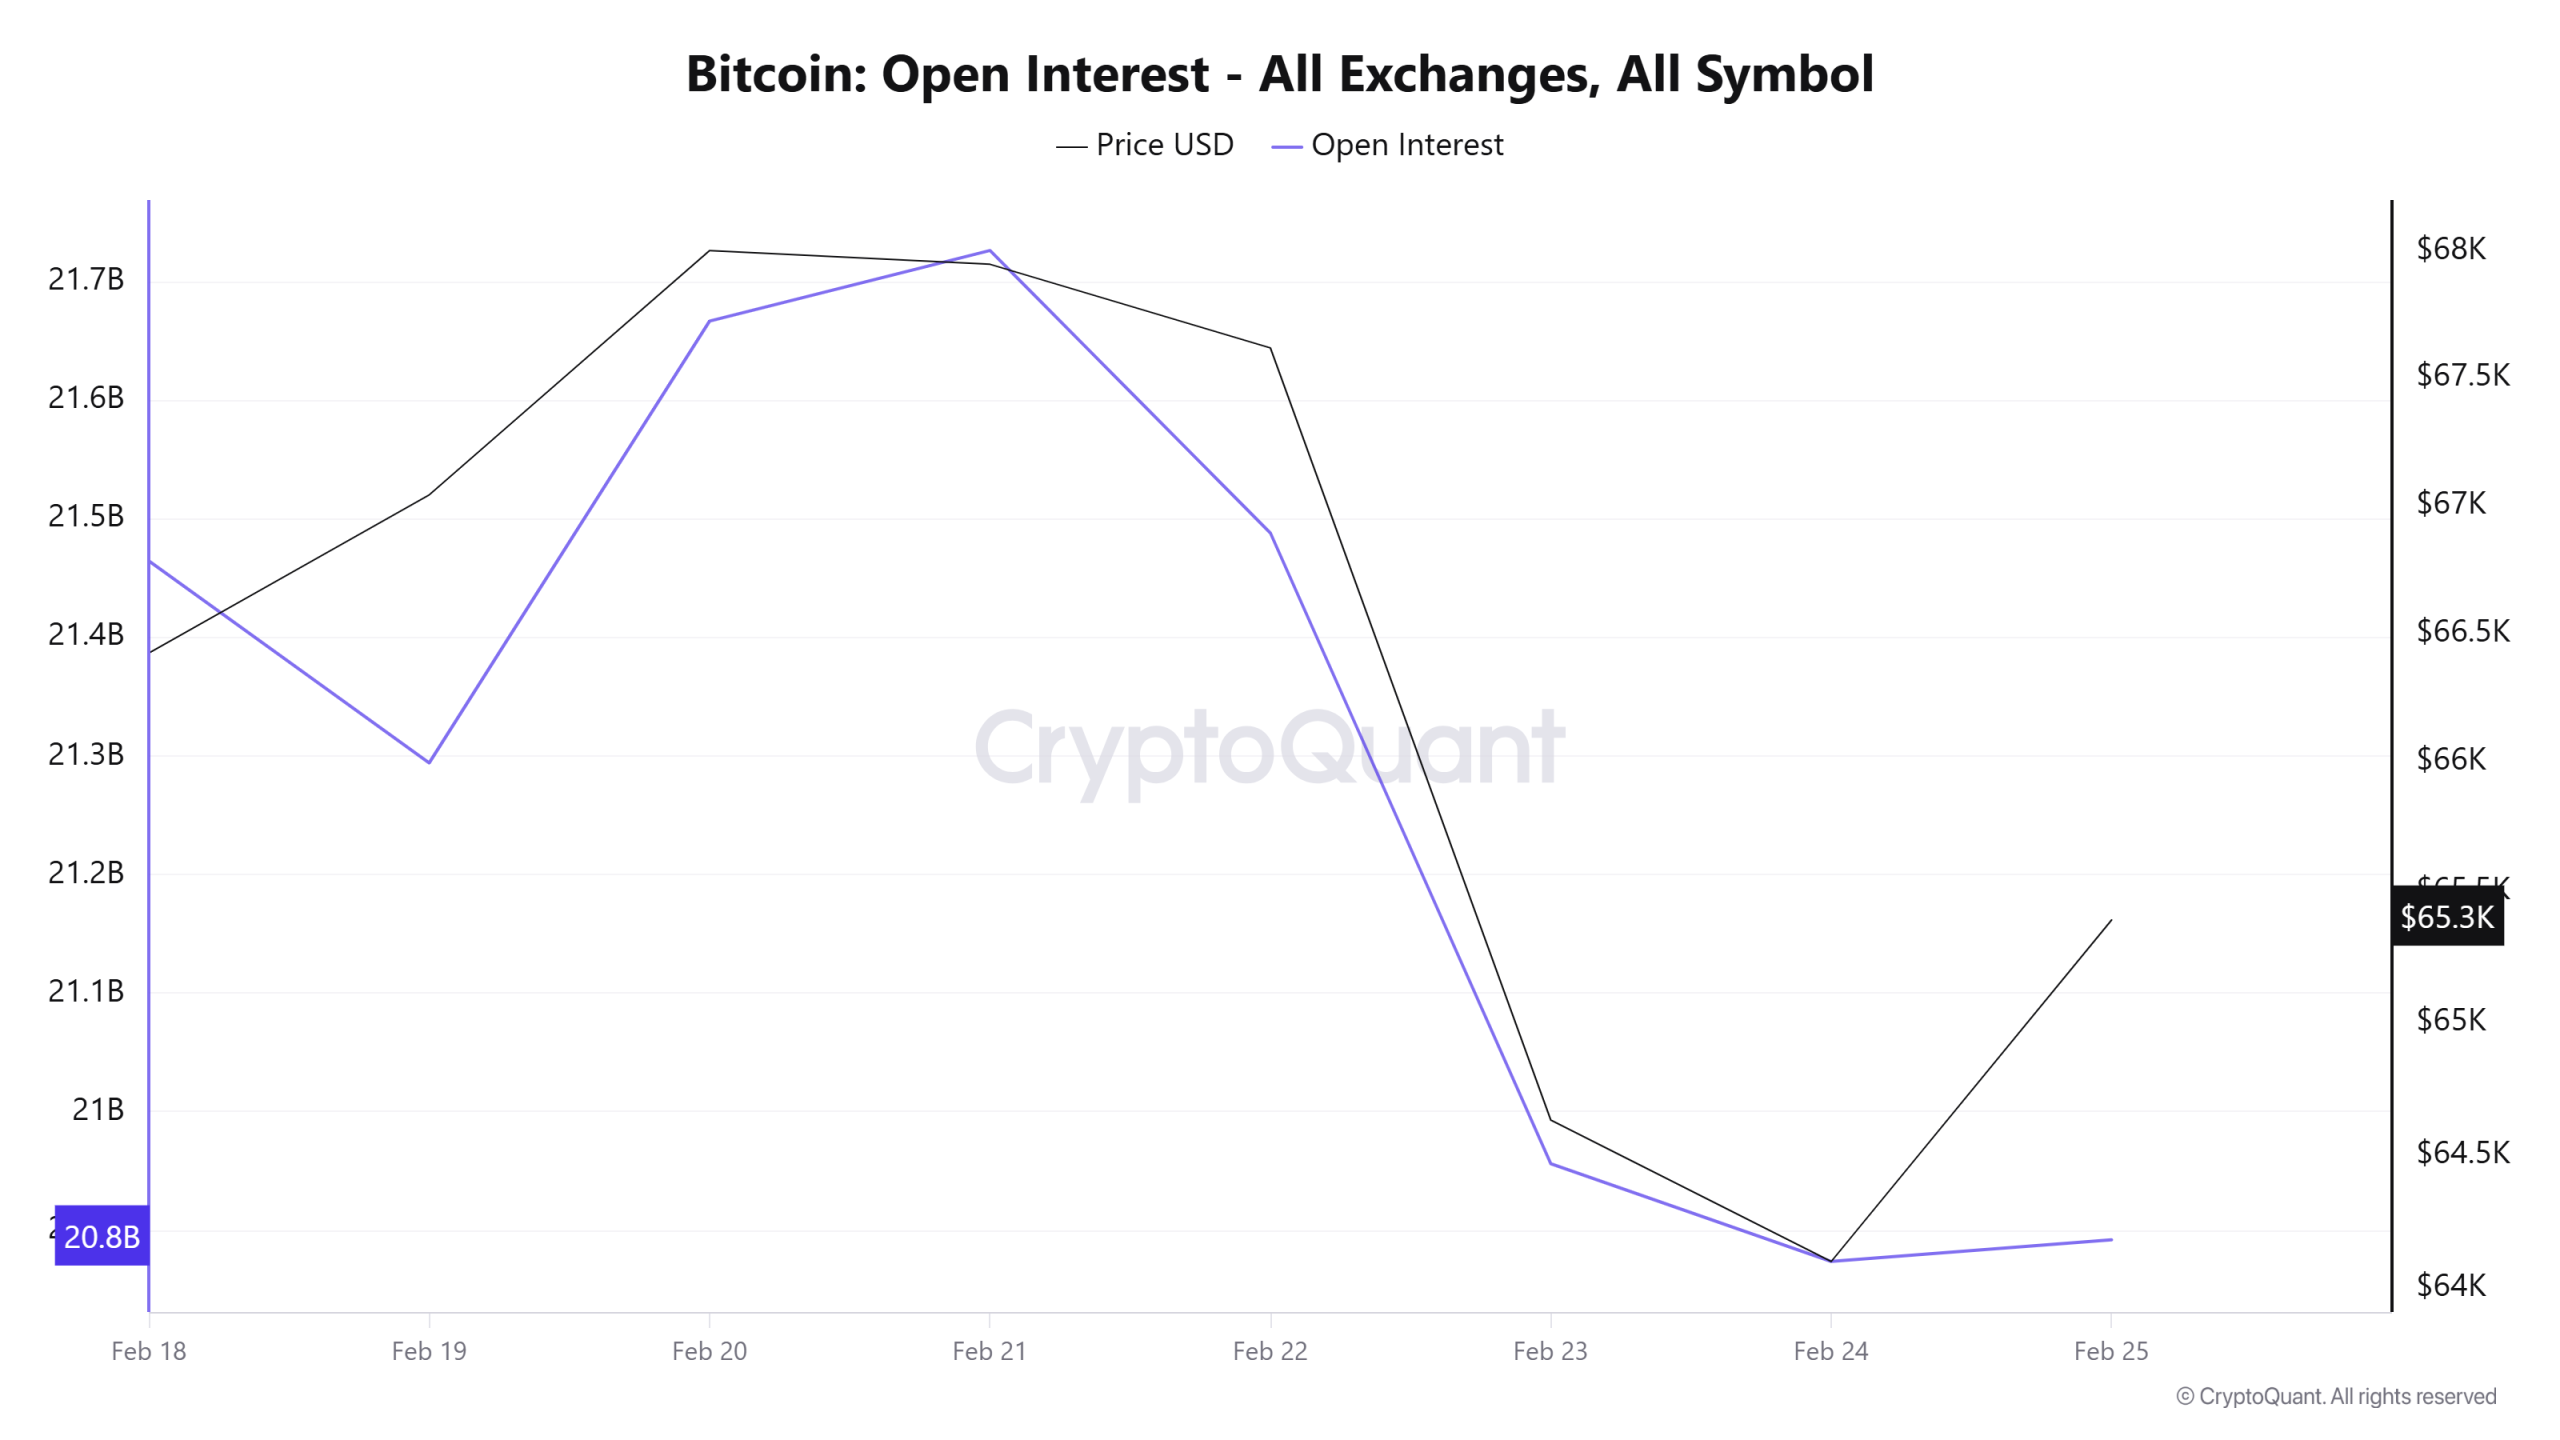
Open interest in BTC peaked around February 20–21 but then declined sharply. The accompanying price decline indicates that leveraged long positions in the market began to unwind. In the final section, while open interest flattened, the price’s attempt to recover is noteworthy. This structure suggests that leverage pressure in the market has eased, but the upward movement has yet to find strong derivative support.
Funding Rate
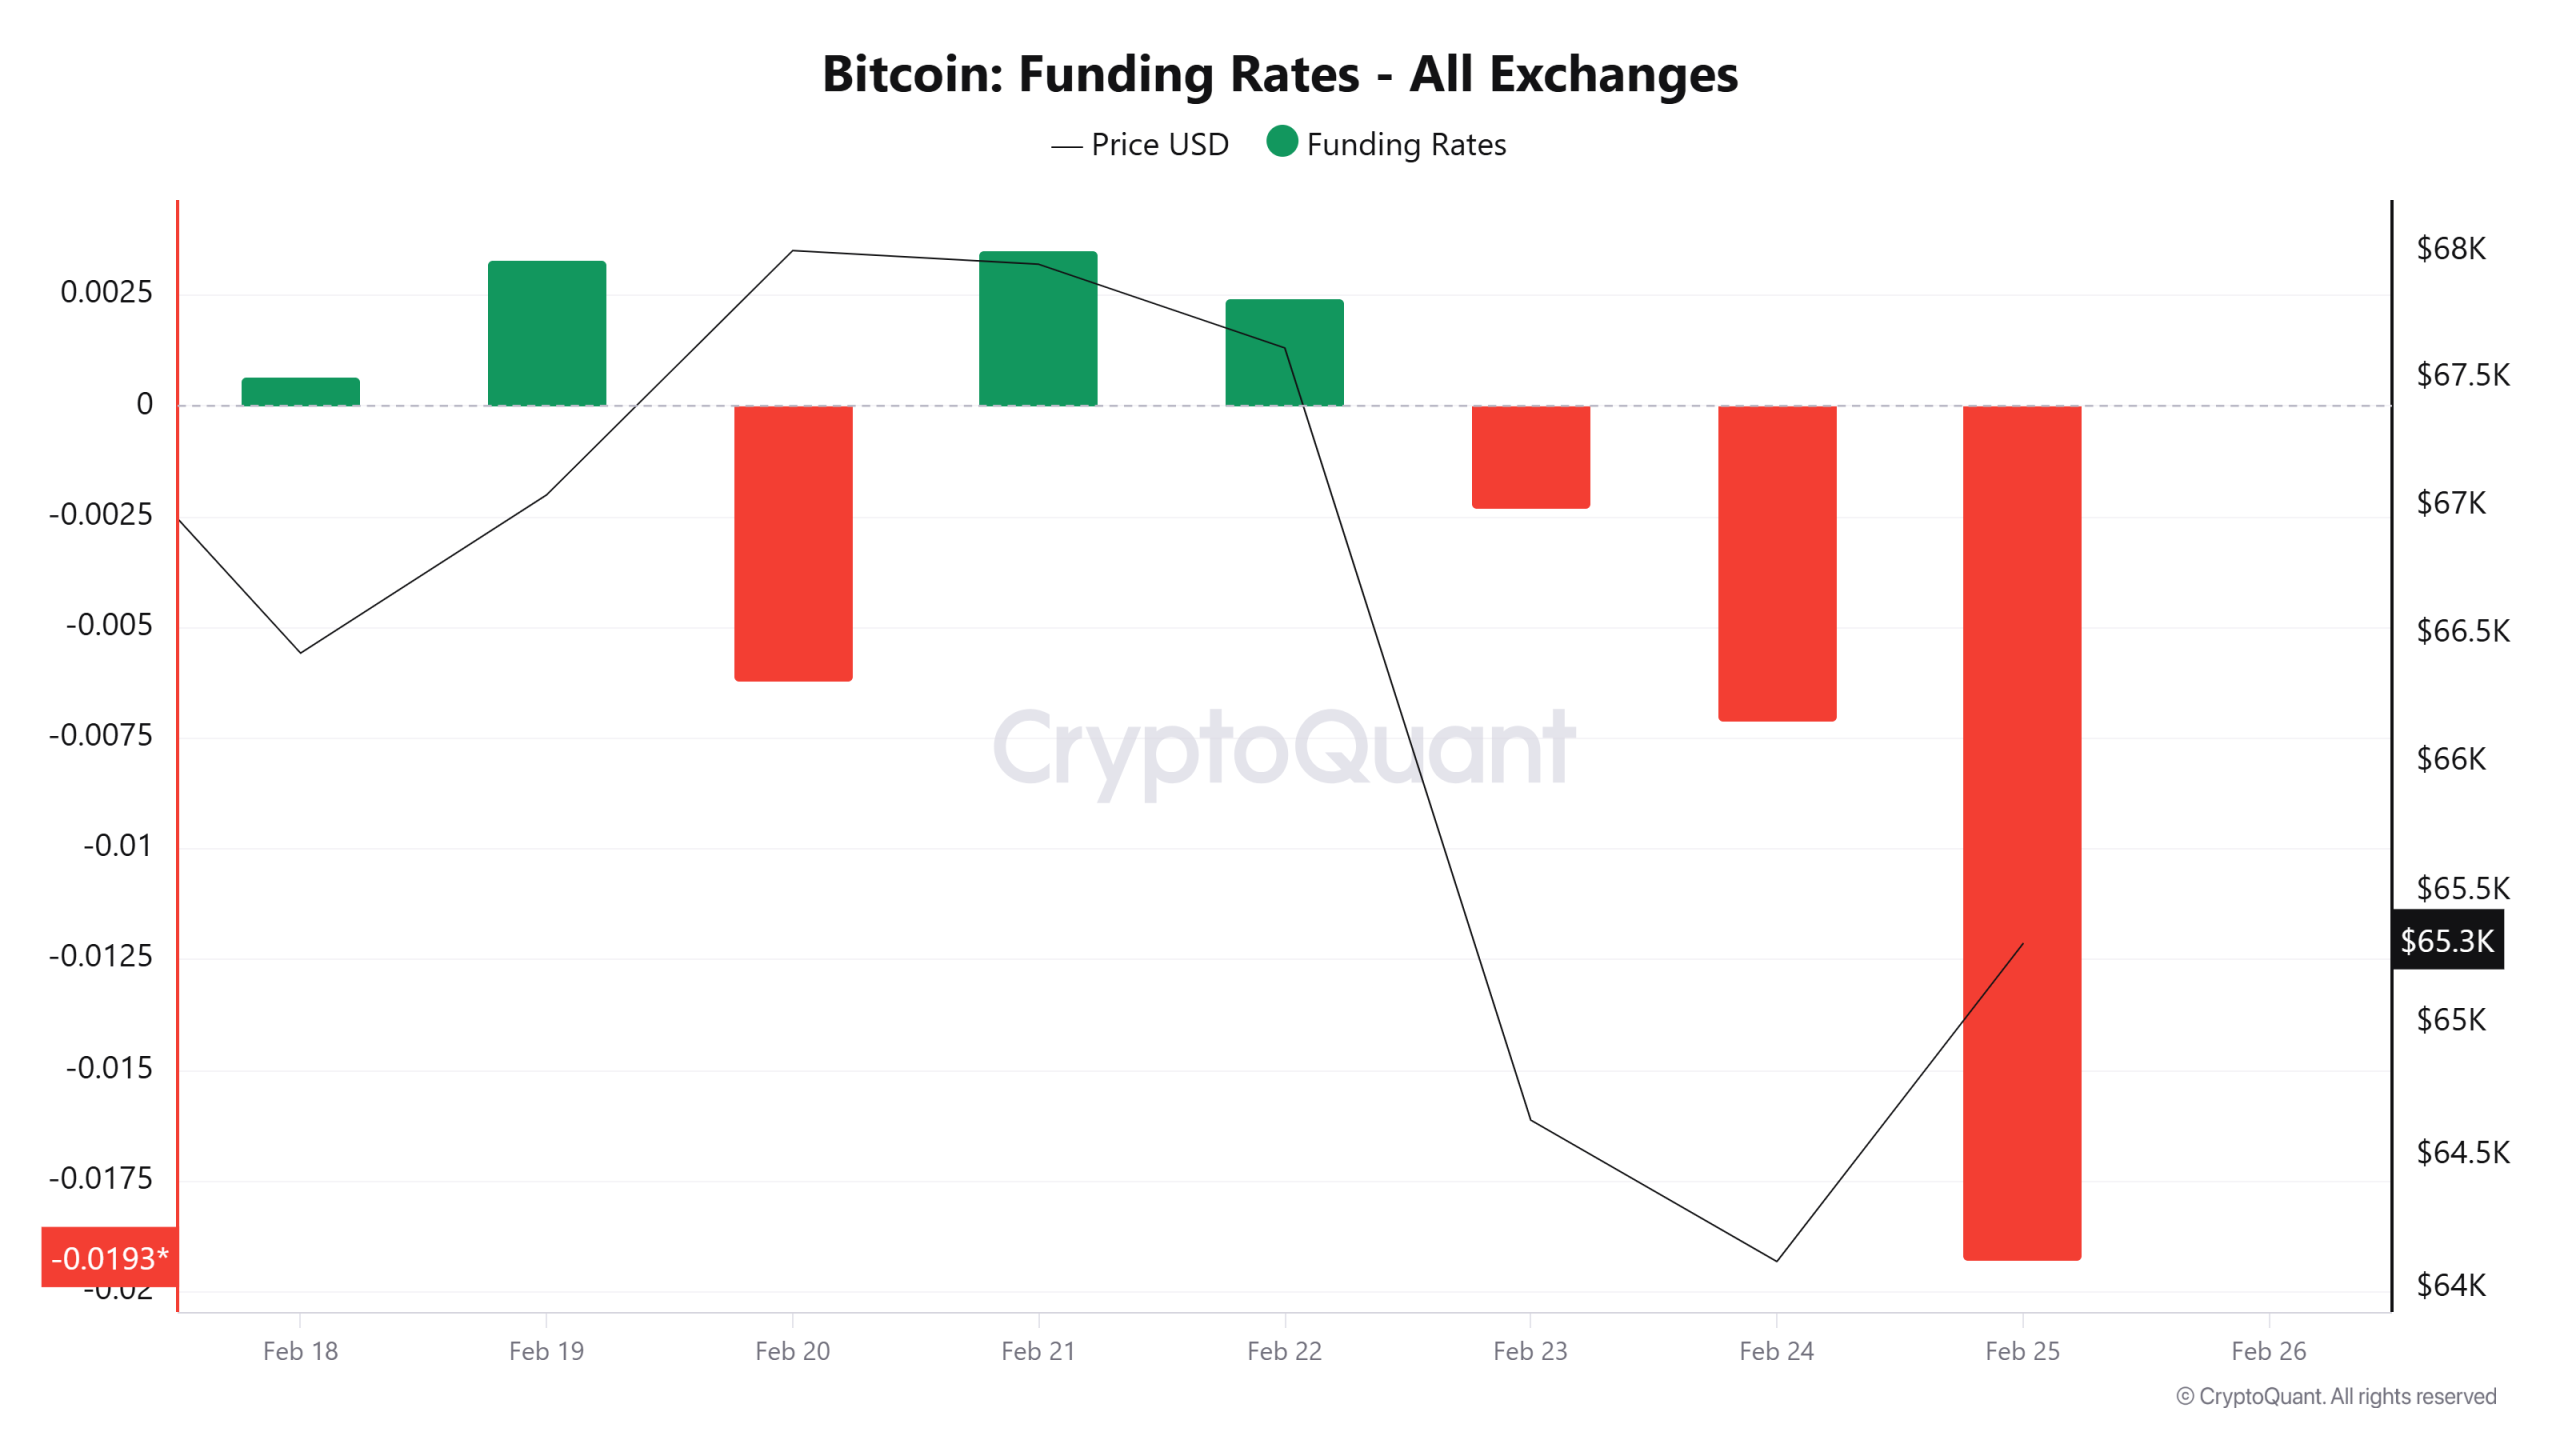
The BTC funding rate remained in positive territory around February 20–22 but quickly turned negative afterward. The deep negative values observed on February 24–25, in particular, indicate a significant increase in short positions. The price weakening during the same period confirms this picture. In summary, short pressure has increased in the market, but this structure also carries the risk of volatility and a possible short squeeze in the short term.
Long & Short Liquidations
Last week, the BTC price fell from $68,500 to $62,500. As a result, a total of $323 million in long positions were liquidated, while $141 million in short positions were liquidated.
| Date | Long Amount (Million $) | Short Amount (Million $) |
|---|---|---|
| February 18 | 54.41 | 15.32 |
| February 19 | 23.76 | 17.69 |
| February 20 | 25.56 | 39.73 |
| February 21 | 4.17 | 11.71 |
| February 22 | 12.79 | 1.73 |
| February 23 | 143.44 | 31.52 |
| February 24 | 59.65 | 23.96 |
| Total | 323.78 | 141.66 |
Supply Distribution
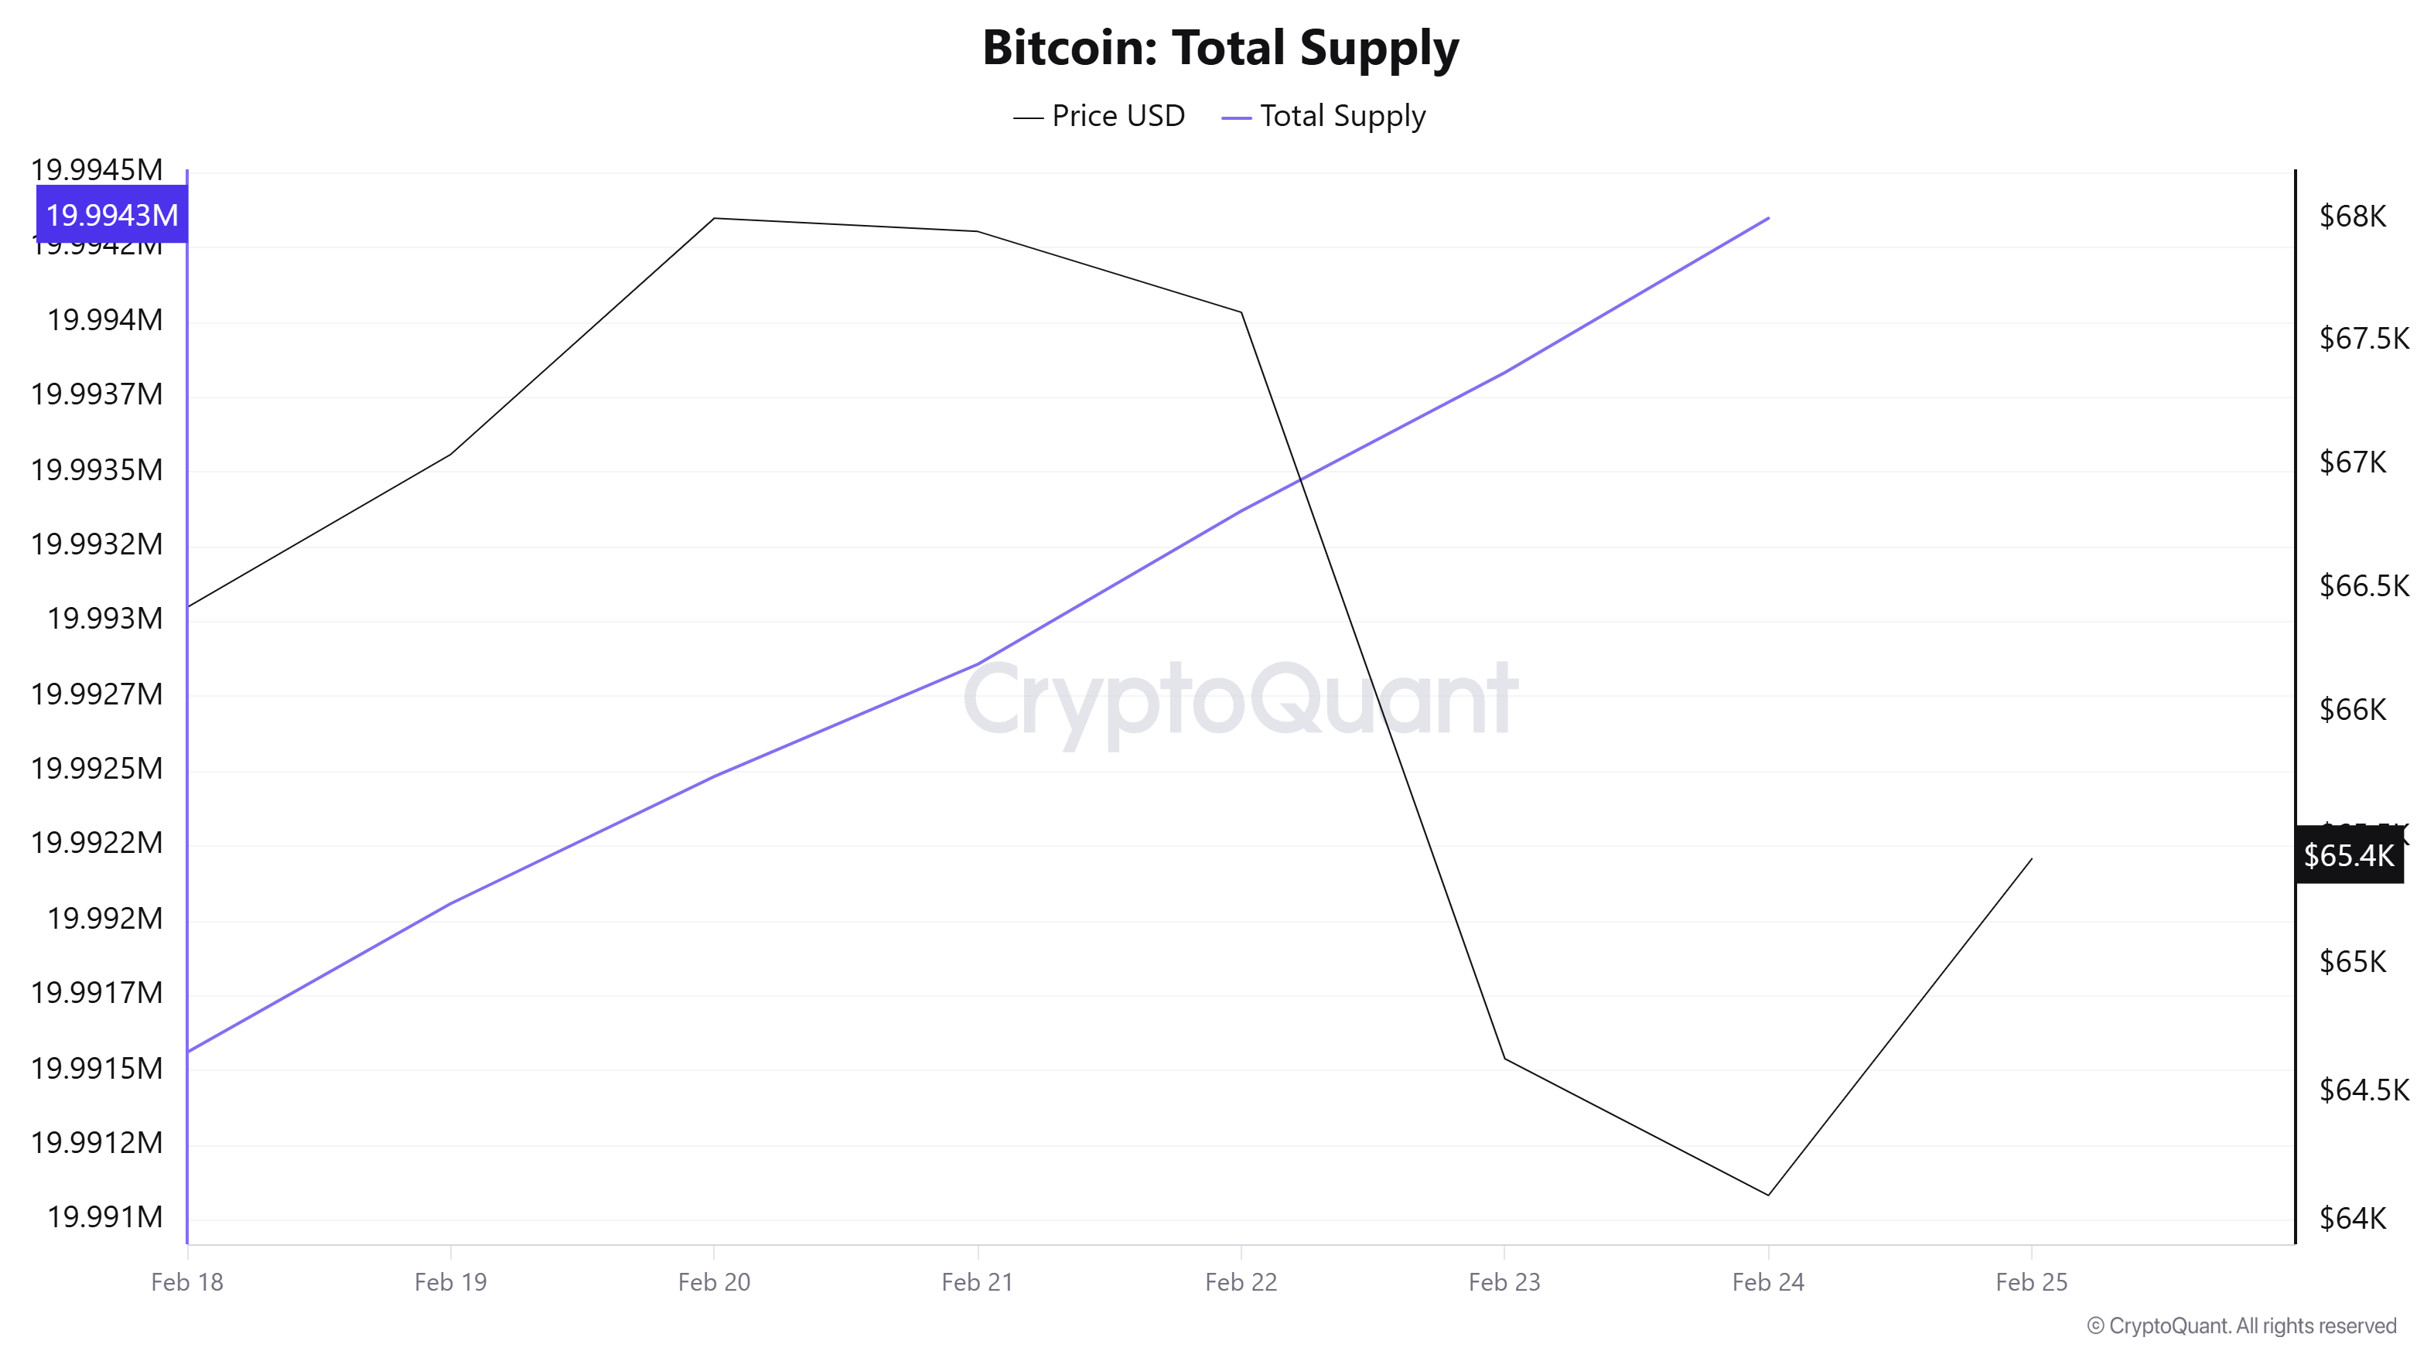
Total Supply: Reached 19,994,349 units, an increase of approximately +0.014% compared to last week.
New Supply: The amount of BTC produced this week was 515,625.
Velocity: The velocity, which was 12.74 last week, reached 12.76 as of February 17.
During the week of February 17–23, 2025, small BTC wallets (<1 BTC and 1–10 BTC) showed a slight increase, contributing to a small portion of the total supply. Mid-tier wallets (10–100 BTC and 100–1k BTC) remained largely stable, while 1k–10k BTC wallets strengthened mid-sized holder accumulation with a 0.3% increase. The largest wallets (10k+ BTC), however, declined slightly by −0.6%, indicating that large holders made minor sales.
Exchange Reserve
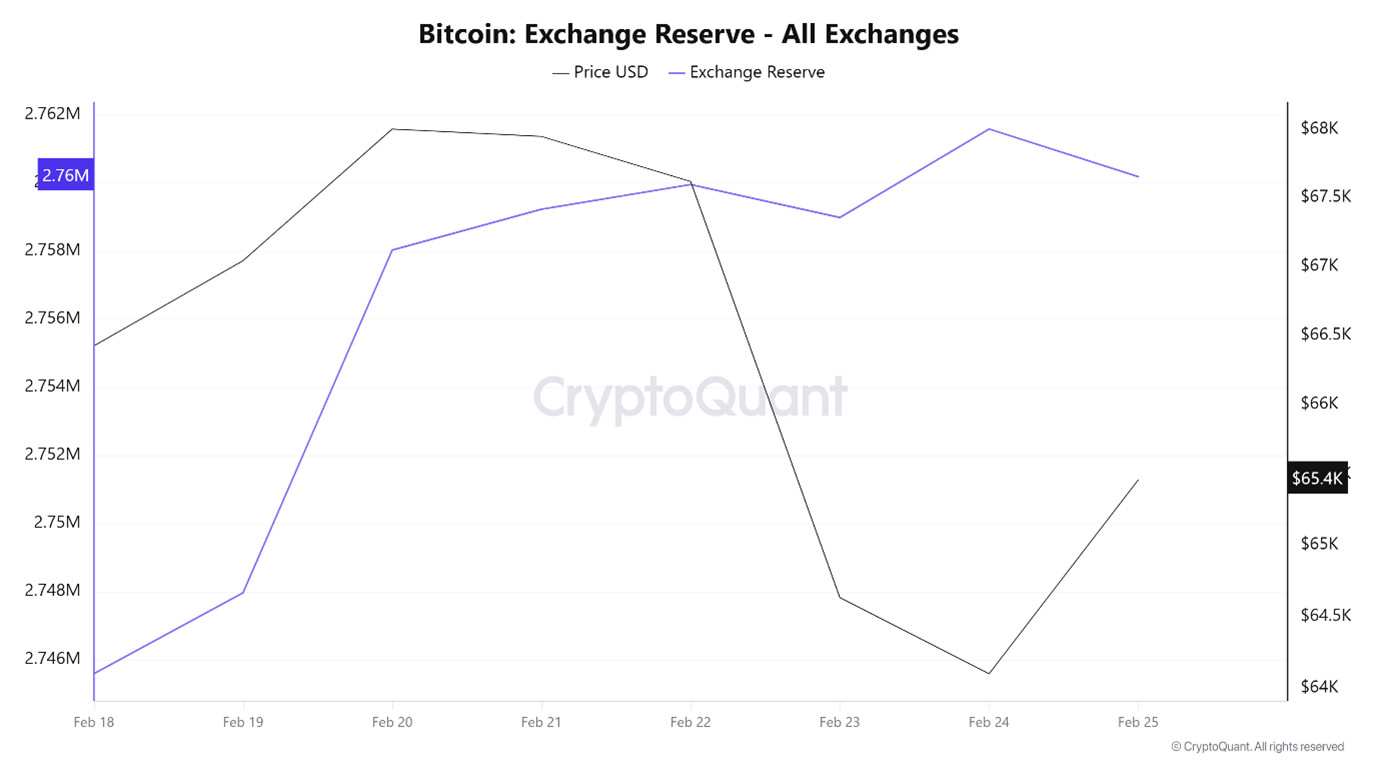
Between February 18 and 24, 2026, Bitcoin reserves on exchanges rose from 2,745,599 BTC to 2,769,188 BTC, resulting in a net inflow of 23,589 BTC. During this period, reserves increased by approximately 0.86%, while the BTC price fell from $66,837.6 to $62,900, losing 5.89% of its value.
Although there were net outflows on some days during the week, the overall picture pointed to a limited but steady inflow into the stock markets. During this period, when the price fell by approximately 5.9%, the 0.86% increase in reserves indicated that investors were inclined to avoid risk and take a cautious stance rather than expecting a strong rise.
| Date | 18-Feb | 19-Feb | 20-Feb | 21-Feb | February 22 | February 23 | February 24 |
|---|---|---|---|---|---|---|---|
| Exchange Inflow | 25,203 | 26,411 | 53,703 | 16,101 | 7,501 | 29,092 | 34,737 |
| Exchange Outflow | 31,541 | 24,034 | 43,652 | 14,901 | 6,776 | 30,059 | 32,140 |
| Exchange Netflow | -6,338 | 2,377 | 10,056 | 1,200 | 724 | -967 | 2,596 |
| Exchange Reserve | 2,745,599 | 2,749,111 | 2,748,589 | 2,753,452 | 2,751,959 | 2,750,383 | 2,751,938 |
| BTC Price | 66,423 | 67,041 | 68,007 | 67,952 | 64,620 | 64,633 | 64,100 |
Whale Activities
Whale Data:
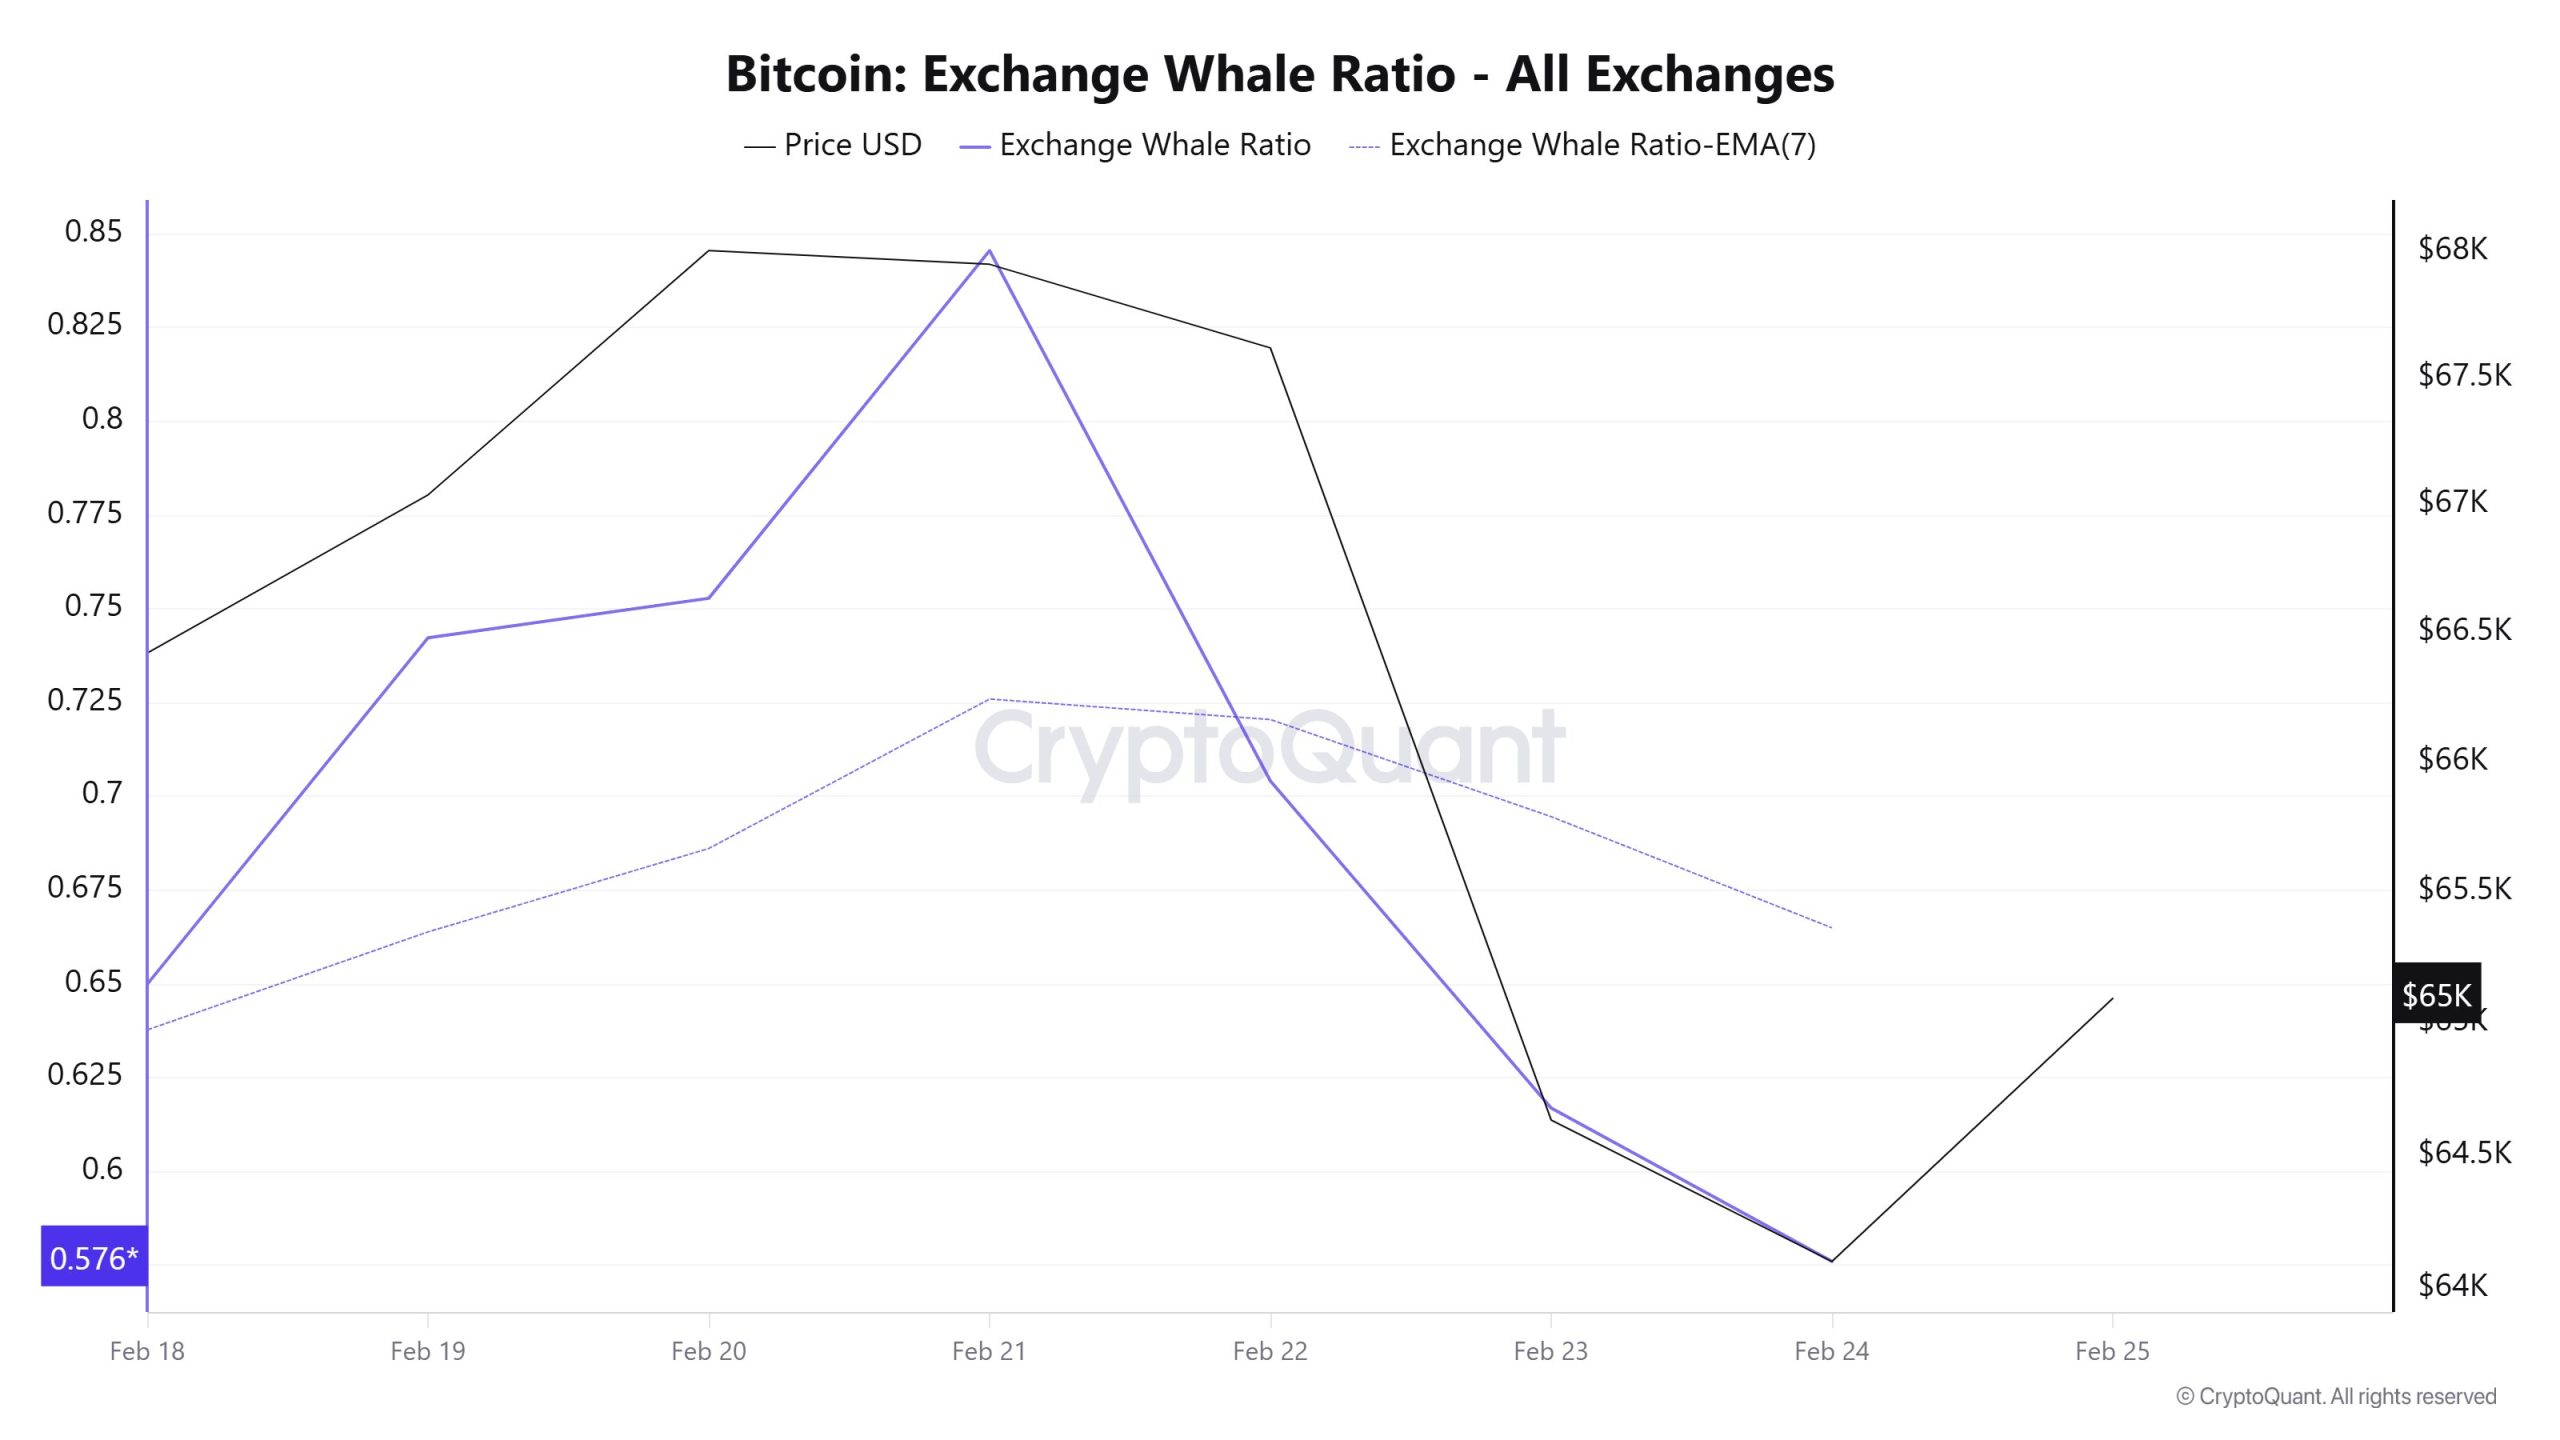
Looking at whale activity on centralized exchanges over the past 7 days based on cryptocurrency market data, the metric, which experienced an increase at the beginning of the process, showed a decline from the middle to the end of the process. Looking at the Exchange Whale Ratio metric, on February 18, the first day of the 7-day period, the ratio of whales using centralized exchanges was 0.650. The metric peaked on February 21, reaching a value of 0.845. This was the highest level since 2015. After this date, the metric, which showed a downward trend, formed its lowest point and fell to 0.576. When this ratio is above the 0.35-0.45 band, it usually means that whales frequently use centralized exchanges. During this period, the price fluctuated between $68,000 and $62,500. This indicated that whales were creating selling pressure for BTC on centralized exchanges. At the same time, total BTC transfers showed parallelism with last week, with 5,192,174 BTC moving. Data showed that small wallets increased their BTC holdings by 2.5% since October’s all-time high, while large holders reduced theirs by 0.8%. Bitcoin wallets holding less than 0.1 BTC increased their supply share to the highest level since mid-2024, despite the price hovering around $60,000. Large investors holding between 10 and 10,000 bitcoins have reduced their positions since October’s peak. As a result, whales are exiting centralized exchanges, but the metric value remains high.
Legal Notice
The investment information, comments, and recommendations contained in this document do not constitute investment advisory services. Investment advisory services are provided by authorized institutions on a personal basis, taking into account the risk and return preferences of individuals. The comments and recommendations contained in this document are of a general nature. These recommendations may not be suitable for your financial situation and risk and return preferences. Therefore, making an investment decision based solely on the information contained in this document may not result in outcomes that align with your expectations.
NOTE: All data used in Bitcoin on-chain analysis is based on CryptoQuant.
