
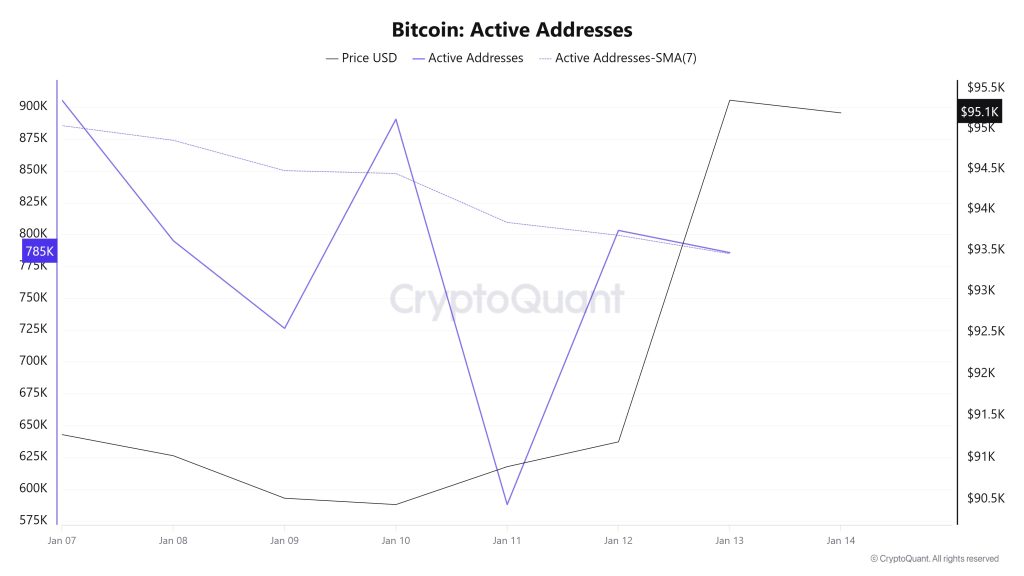
Active Addresses
Between January 7 and January 14, recorded 785,738 active addresses on the Bitcoin network. During this period, the Bitcoin price rose to $95,000. From a technical perspective, the 7-day simple moving average (SMA) shows a downward trend.
Active Sending Addresses
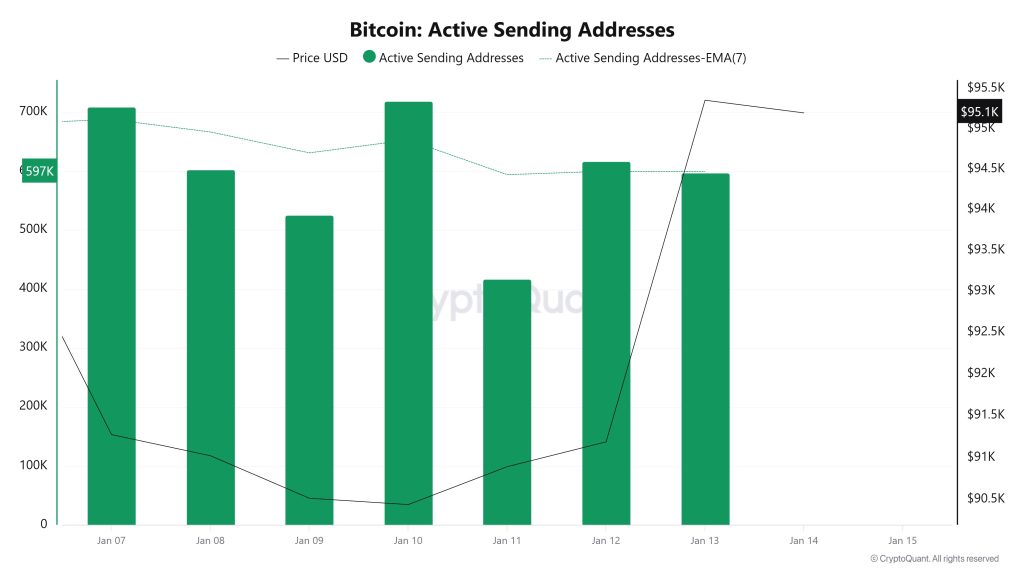
Between January 7 and January 14, an upward trend was observed in the active sending addresses metric. On the day the price reached its highest level, this metric stood at 718,615, indicating that user activity on the Bitcoin network was moving in parallel with the price. This data indicates that the $90,000 level is supported not only by price-based factors but also by on-chain address activity. Overall, the Active Sending Addresses metric followed an upward trend during this period.
Active Receiving Addresses
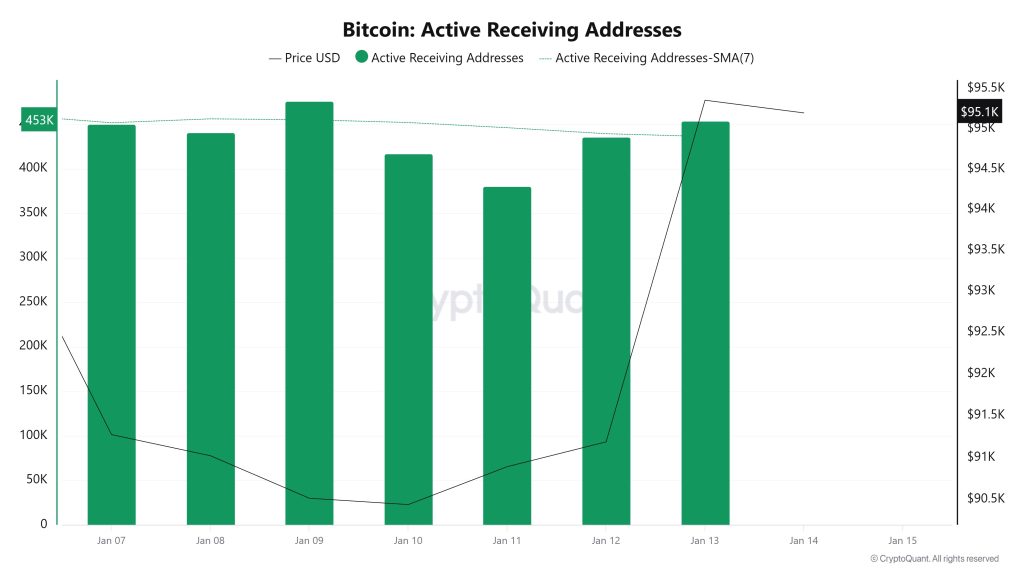
Between January 7 and January 14, active buying addresses experienced a normal rise along with the Black Line (price line). On the day the price reached its peak, active buying addresses rose to 475,789 levels, indicating that buyers purchased Bitcoin at around $90,000 levels.
Breakdowns
MRVR
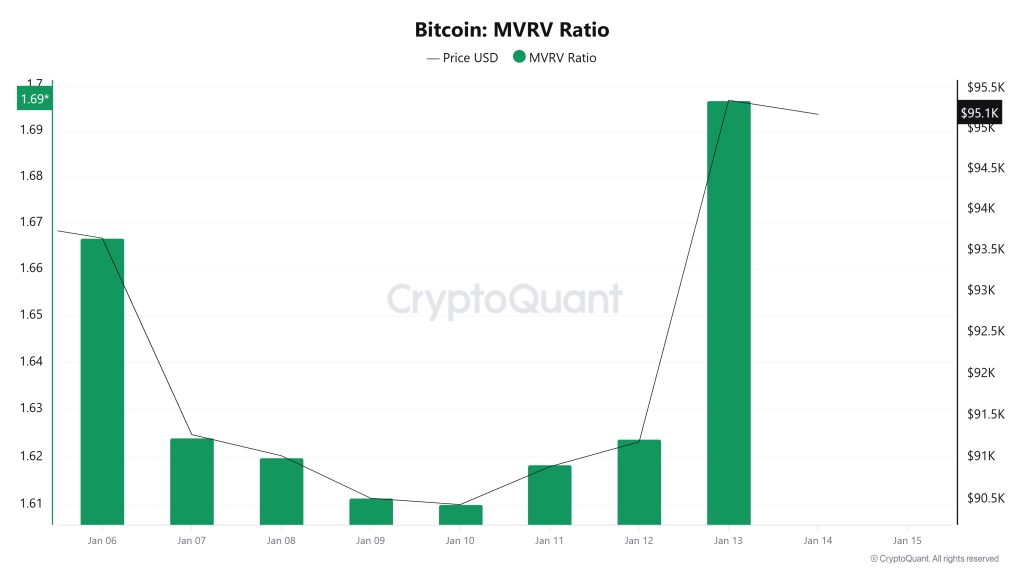
On January 7, while the Bitcoin price was trading at $91,273, the MVRV Ratio stood at 1.623. As of January 13, the Bitcoin price rose to $95,357, recording a 4.47% increase, while the MVRV Ratio rose to 1.696, recording a 4.50% increase. The increase in the MVRV Ratio indicates that the price premium has expanded relative to the realized cost basis and that unrealized profits in the market have increased. While this points to short-term trend support, it may also increase the likelihood of profit-taking sales at certain levels as more investors move into profit territory.
Realized Price
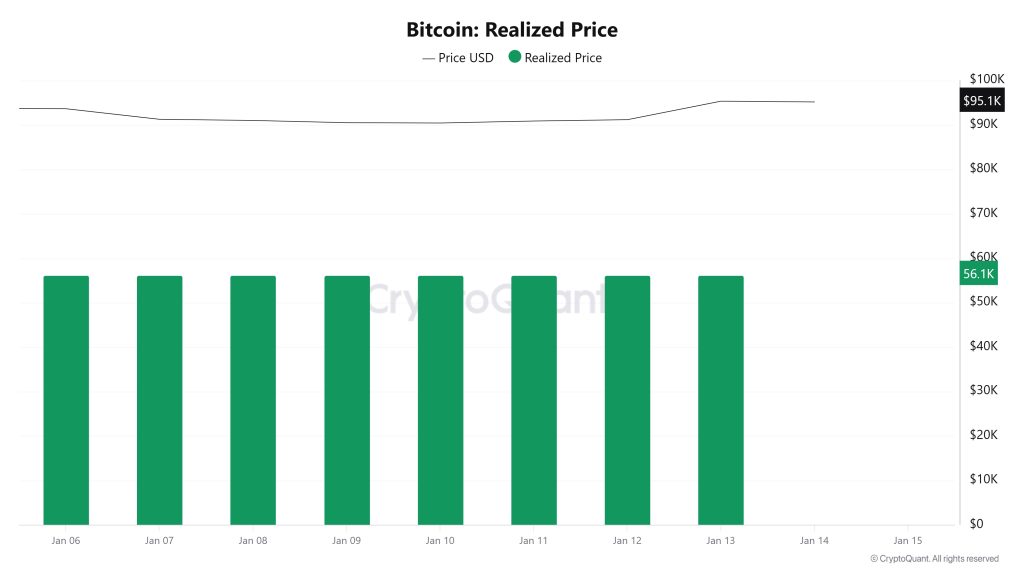
On January 7, while the Bitcoin price traded at $91,273, the Realized Price stood at $56,202. As of January 13, the Bitcoin price rose to $95,357, recording a 4.47% increase, while the Realized Price fell to $56,199, recording a limited 0.01% decline. The flat trajectory of the Realized Price indicates that the network’s average cost basis has not changed significantly this week. This outlook confirms that the price is maintaining its premium over the cost basis, while the opening of the premium may signal that the price could react more sensitively to pullbacks in the short term.
Spent Output Profit Ratio (SOPR)
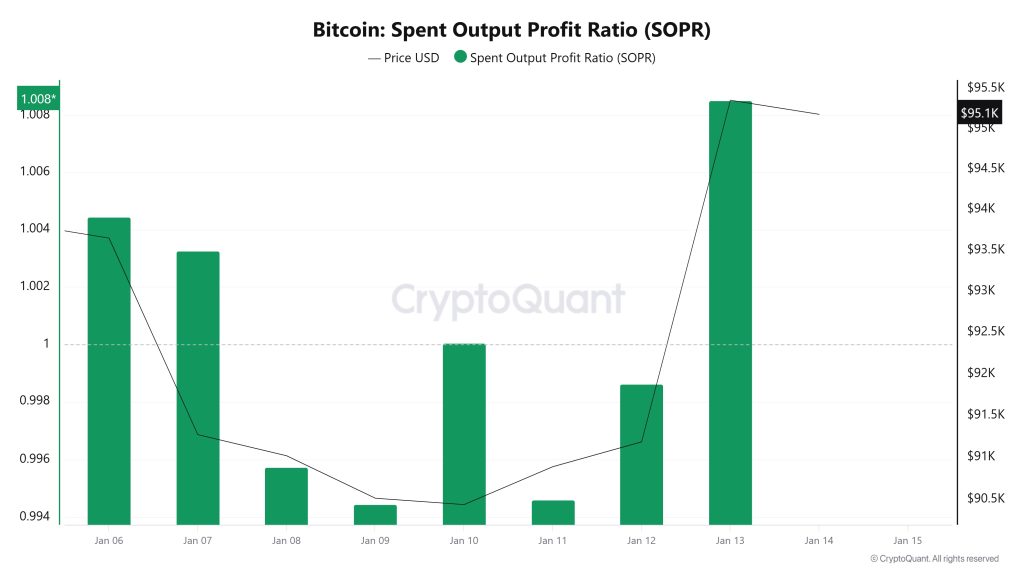
On January 7, while the Bitcoin price was trading at $91,273, the SOPR metric stood at 1.003. As of January 13, the Bitcoin price rose to $95,357, recording a 4.47% increase, while the SOPR metric rose to 1.008, recording a 0.50% increase. The SOPR value remaining above 1 indicates that spent coins are changing hands at an average profit and that sales are predominantly coming from profitable exits. While this is constructive from an overall perspective, the increase in profitable sales as the SOPR rises may increase the likelihood of the upward movement encountering more selling pressure at certain levels in the short term.
Derivatives
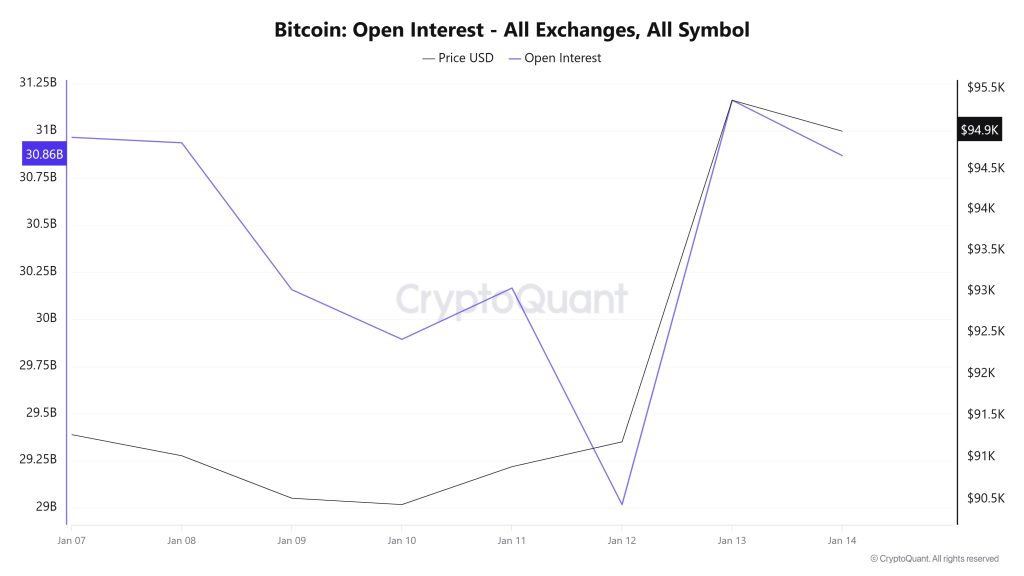
Open Interest
The BTC price experienced a pullback from the $91,000 range to the $90,000 level between January 7 and 10. During this period, the gradual decline in open interest indicates that leveraged positions in the market have decreased and investors are acting more cautiously. On January 12, a sharp decline in open interest was observed while the price remained relatively flat, indicating that long positions were being closed. Immediately afterwards, on January 13, a strong recovery in open interest and a rapid rise in price towards the $95,000 level showed that long positions were intensifying again. However, as of January 14, a slight pullback in open interest is noticeable. This structure suggests the possibility of a short-term pause in the market following the upward movement and that the price may become fragile.
Funding Rate
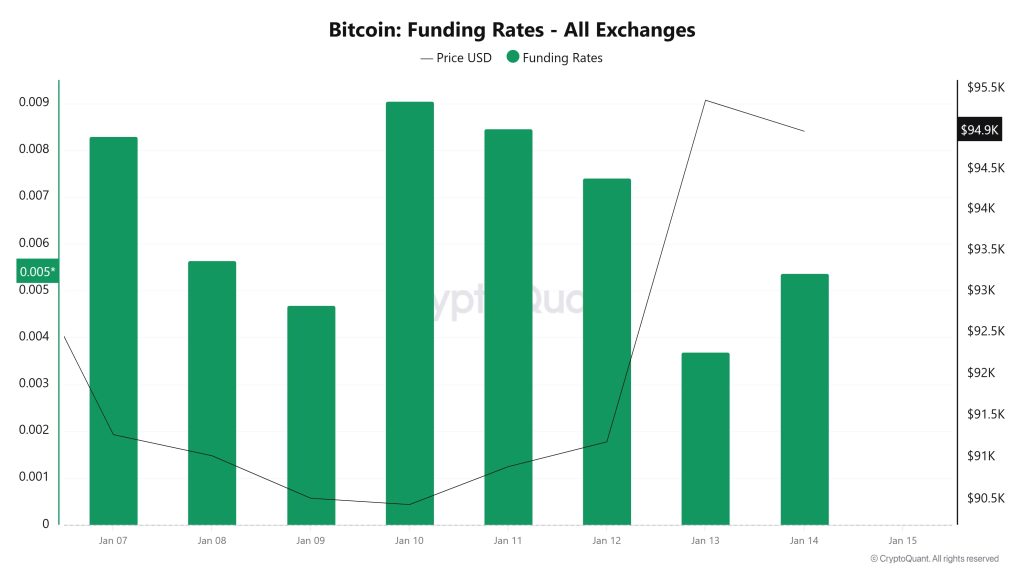
While the BTC funding rate showed a general downward trend throughout the week, the price continued to rise, suggesting that the movement was largely driven by spot purchases. Limited appetite on the futures side indicated that the rise was progressing in a more controlled manner. However, the sharp increase in the funding rate as of January 13 indicates that long positions are being aggressively opened in the futures market. At this point, where the price is attempting to stabilize near peak levels, the intense long buying highlights the importance of liquidity accumulating in lower regions. In summary, while the sudden rise in the funding rate strengthens expectations for upward- s in the short term, it also brings with it the risk of downward volatility and liquidation in this congested price area.
Long & Short Liquidations
Last week, the BTC price rose from $89,300 to $96,500. However, a total of $726 million in long positions were liquidated, while $218 million in short positions were liquidated.
| Date | Long Amount (Million $) | Short Amount (Million $) |
|---|---|---|
| January 7 | 274.35 | 5.20 |
| January 8 | 75.40 | 12.13 |
| January 9 | 19.82 | 14.95 |
| January 10 | 1.50 | 0.76 |
| January 11 | 4.43 | 3.61 |
| January 12 | 20.65 | 21.25 |
| January 13 | 330.06 | 160.98 |
| Total | 726.21 | 218.88 |
Supply Distribution
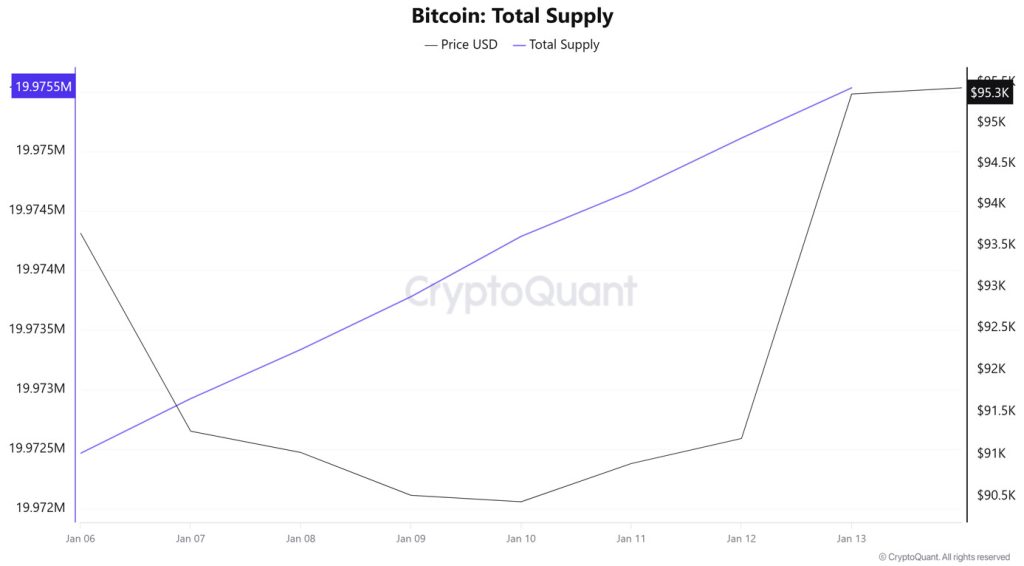
Total Supply: Reached 19,972,464 units, an increase of approximately 0.0154% compared to last week.
New Supply: The amount of BTC produced this week was 3,069.
Velocity: Last week’s velocity of 12.35 remained unchanged as of January 13.
|
While the 1 BTC and 1–10 BTC groups show that retail investors remain undecided, the decline in the 10–100 BTC band indicates a partial distribution in this segment. In contrast, the increase in the 100–1,000 BTC range reveals that mid-sized investors view prices as an opportunity. In large wallets, there is cautious position preservation rather than a significant outflow.
Exchange Supply Ratio
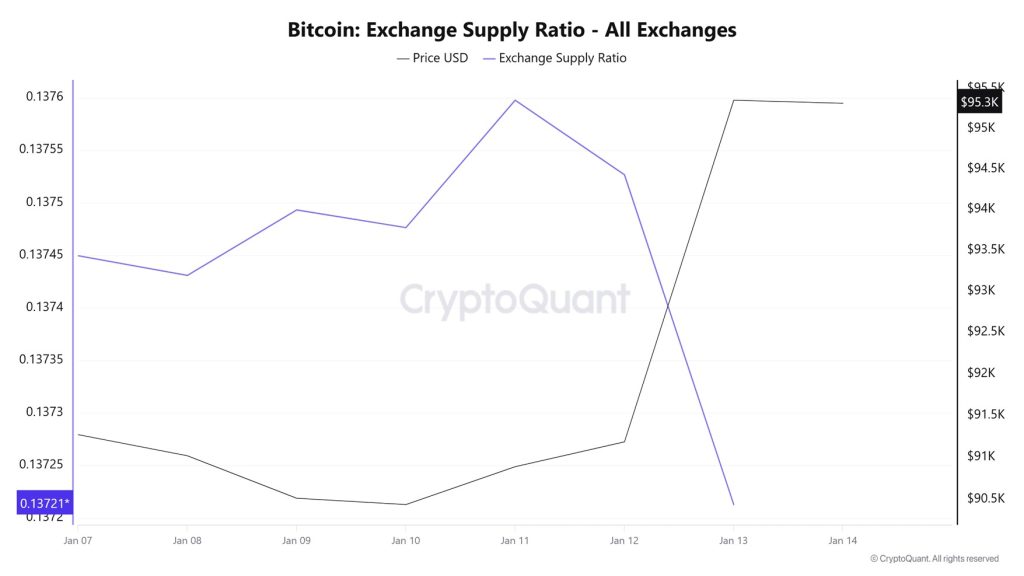
According to data obtained from the Bitcoin Exchange Supply Ratio table, which shows how much of the total supply of Bitcoins is held on exchanges, low ratios were observed this week. The general trend between the Bitcoin price and the supply ratio entering exchanges shows that a negative correlation between these two variables has been dominant as of January 7. Between January 7 and January 14, the Bitcoin Exchange Supply Ratio decreased from 0.13744975 to 0.13721288. During this period, the Bitcoin price rose from $91,000 to $95,000.
Exchange Reserve
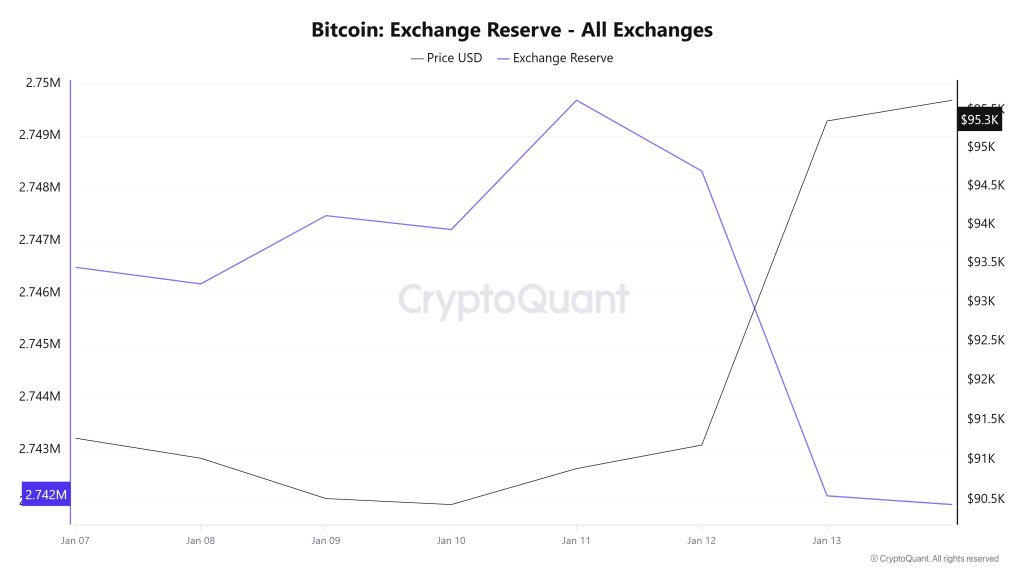
Between January 7 and 13, 2026, Bitcoin reserves on exchanges declined from 2,745,470 BTC to 2,742,121 BTC. A net outflow of 3,349 BTC occurred. During this period, exchange reserves decreased by approximately 0.12%, while the BTC price rose from $93,698 to $95,358, an increase of 1.77%. Despite the significant price increase during this period, the continued decline in reserves indicated that investors did not view this rise as an opportunity to sell. The net outflows in recent days, in particular, signaled that a cautious but positive stance was maintained in the market. Although limited profit-taking could be seen in the short term following the price increase, the continued decline in exchange reserves could continue to create a supportive structure for the BTC price by limiting supply.
|
Fees and Revenues
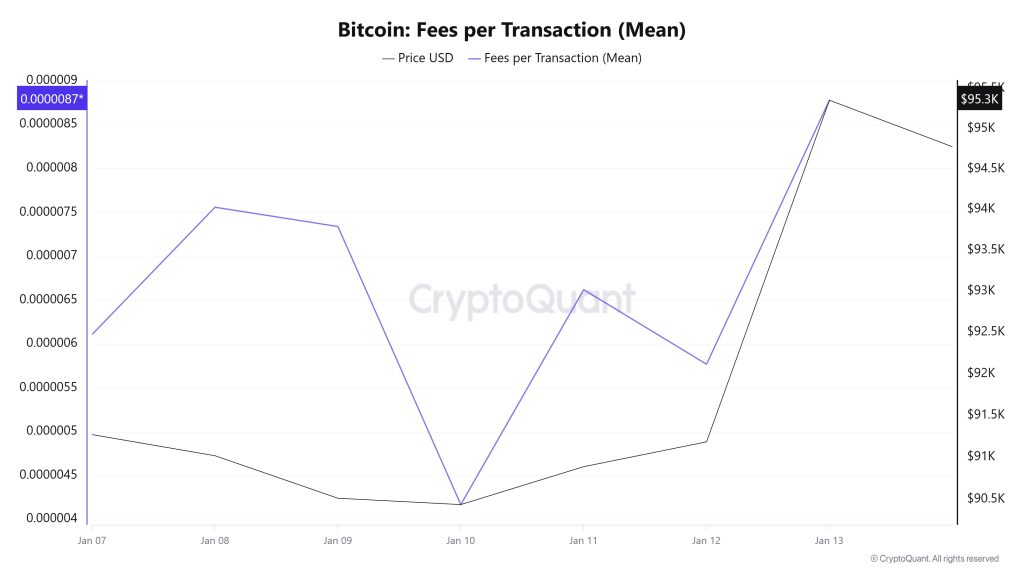
When examining the Bitcoin Fees per Transaction (Mean) data between January 7 and 13, it is observed that the indicator reached 0.00000611 on January 7, the first day of the week.
A decline was observed until January 10, and on this date, the indicator recorded the week’s lowest value at 0.00000417.
In this context, as of January 10, the indicator regained momentum as a result of increased Bitcoin price volatility and followed a positive trend due to the impact of price volatility.
On January 13, the last day of the weekly period, the indicator closed the week at 0.00000878 .
Bitcoin: Fees (Total)
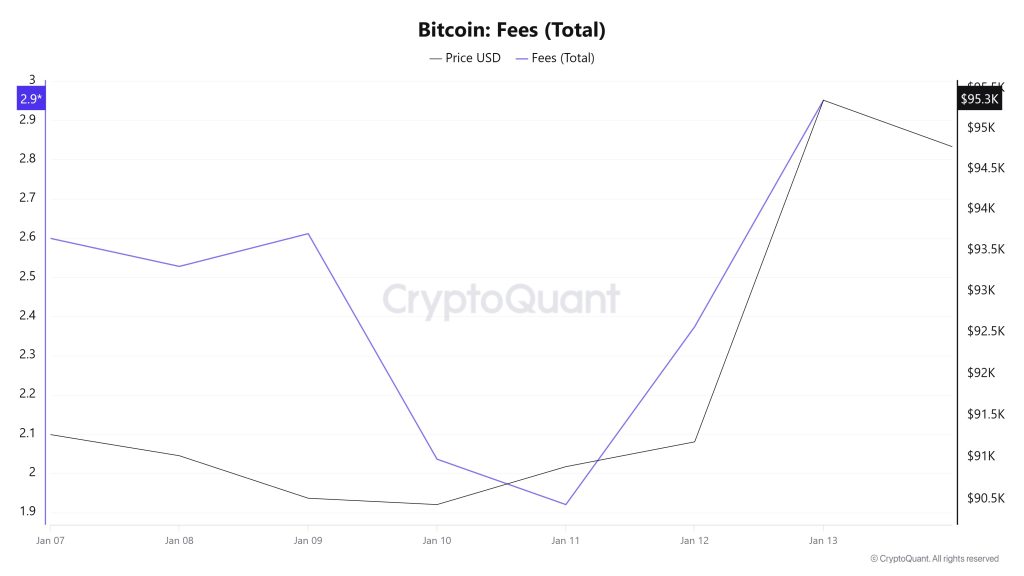
Similarly, when examining the Bitcoin Fees (Total) data for the period between January 7 and 13, it is observed that the indicator reached 2.59890473 on January 7, the first day of the week.
A decline was observed until January 11, and on that date, the indicator recorded its lowest value of the week at 1.9199271.
In this context, as a result of the increase in Bitcoin price volatility as of January 11, the indicator regained momentum and followed a positive trend due to the impact of price volatility.
On January 13, the last day of the weekly period, the indicator closed the week at 2.95137224.
Miner Flows
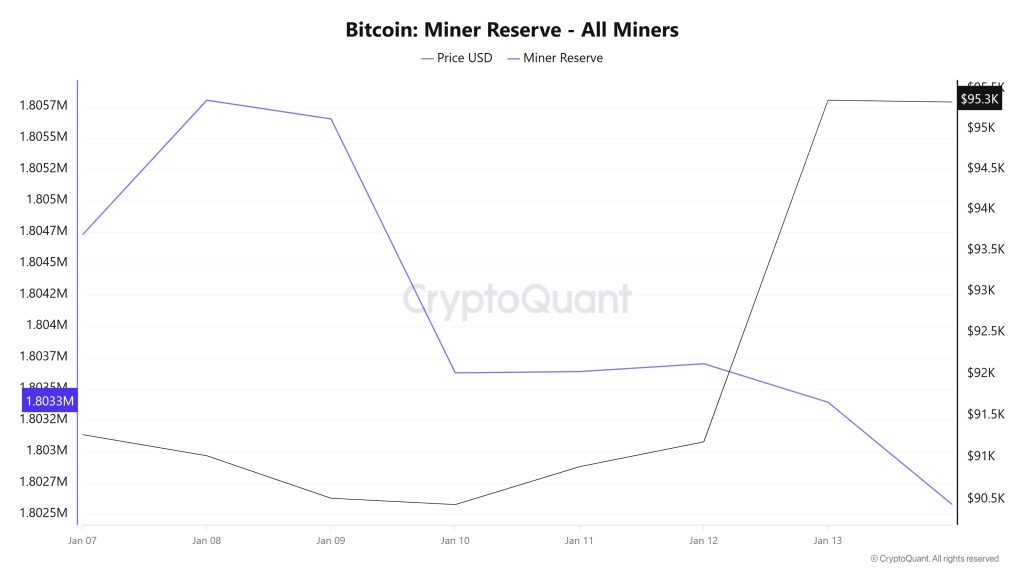
According to data obtained from the Miner Reserve table, a slight decrease in Bitcoin reserves held in miners’ wallets has been observed this week. A time-dependent correlation structure between the Bitcoin price and miner reserve was observed during the period examined. However, the general trend indicates that a negative correlation between these two variables is dominant.
Miner Inflow, Outflow, and Netflow
Between January 7 and 13, 39,173 Bitcoin were withdrawn from miners’ wallets, while 38,259 Bitcoin were deposited into miners’ wallets during the same period. This week’s Miner Netflow was -914 Bitcoin. Meanwhile, the Bitcoin price was $91,273 on January 7 and $95,357 on January 13.
Throughout the week, Bitcoin inflows into miner wallets (Miner Inflow) were less than Bitcoin outflows from miner wallets (Miner Outflow), resulting in a negative net flow (Miner Netflow).
|
Transaction
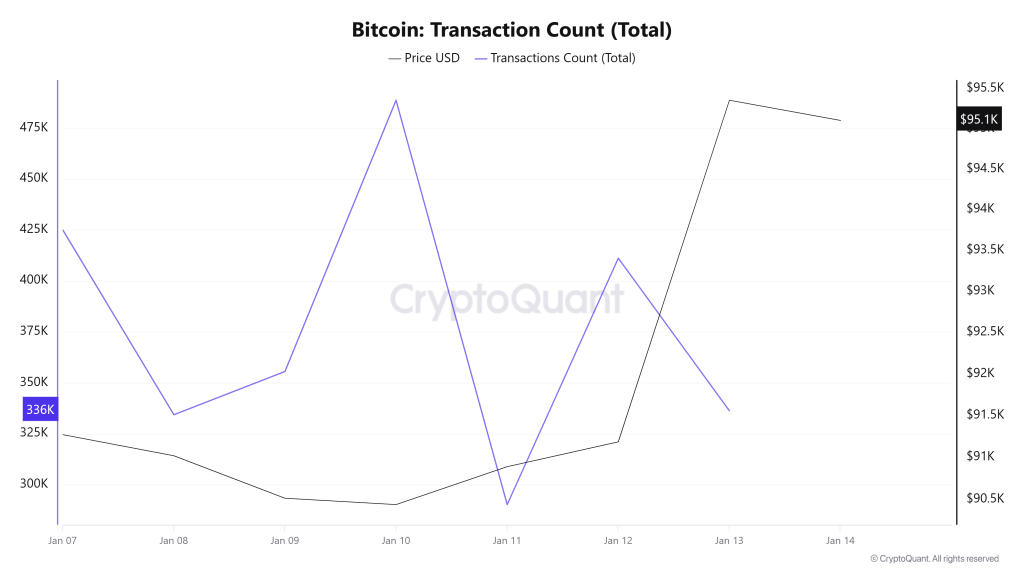
Last week, 3,145,056 transactions took place on the Bitcoin network, while this week the number of transactions fell to 2,640,960, recording a decrease of approximately 16%. The highest transaction volume for the period was recorded on January 10 at 488,624, while the lowest transaction volume was measured on December 11 at 290,195.
When examining the transaction count chart, it is evident that the number of transactions occurring on weekend days (Saturday/Sunday) diverges significantly from each other, with this difference forming the extreme points of the week. Saturday, the first day of the weekend, in particular, has begun to be used as a sort of accounting and transfer day for on-chain activity. When the relationship between transaction count and price is examined over the period as a whole, negative divergences appear to be in the majority.
Tokens Transferred
During the previous period, a total of 5,265,998 BTC was transferred, while this week the period volume declined by 8.47% to 4,820,000 BTC. The highest daily transfer volume of the week was recorded on January 13 at 1,006,158 BTC, while the lowest daily volume was recorded on January 11 at 480,834 BTC. The correlation between the amount of BTC transferred and the price showed a more positive trend throughout the period, creating an appearance of more coordinated movement between the two.
While the amount of Bitcoin transferred has decreased, the proportionally larger decline in transaction count data indicates that the amount of Bitcoin per transaction on the network has increased compared to last week. This shows that higher-volume and larger transactions have gained prominence during this period. This structure indicates that network usage has decreased in every sense compared to last week, but the size of active users’ holdings has increased.
Whale Activities
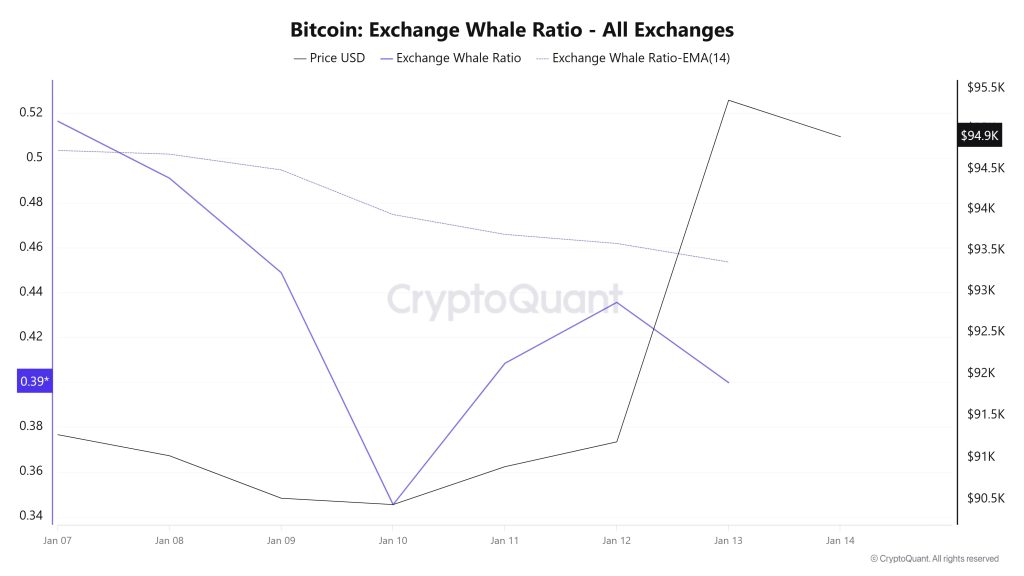
Whales Data:
Looking at whale activity on centralized exchanges over the past 7 days based on cryptocurrency market data, the metric, which declined from the beginning to the middle of the period, showed a slight increase in the remainder of the period, indicating an increase in activity on centralized exchanges. Looking at the Exchange Whale Ratio metric, on January 7, the first day of the 7-day period, the ratio of whales using centralized exchanges was 0.516, which was the peak of the process. On January 10, it fell to 0.345, which was the lowest point of the process. When this ratio is above the 0.35–0.45 band, it generally means that whales are frequently using centralized exchanges. Currently at 0.399, the metric corresponds to a time when whales are using centralized exchanges within the standard range during the period. During this process, the price fluctuated between $90,000 and $96,500. This indicated that the buying side prevailed in the trading battle between whales on centralized exchanges. At the same time, total BTC transfers decreased by 8% compared to last week, with 4,823,369 BTC moving. The data showed us many signals that could lead to price increases, indicating a slowdown in long-term selling pressure. Similarly, whales who consistently buy continued to add BTC in 2026, accumulating approximately 136,000 BTC in just 11 days this month.
BTC Onchain Overall
|
*The metrics and guidance provided in the table do not alone explain or imply any expectation of future price changes for any asset. Digital asset prices can fluctuate based on many different variables. The on-chain analysis and related guidance are intended to assist investors in their decision-making process, and basing financial investments solely on the results of this analysis may lead to unfavorable outcomes. Even if all metrics produce positive, negative, or neutral results simultaneously, the expected outcomes may not materialize depending on market conditions. It would be beneficial for investors reviewing the report to take these warnings into consideration.
Legal Notice
The investment information, comments, and recommendations contained in this document do not constitute investment advisory services. Investment advisory services are provided by authorized institutions on a personal basis, taking into account the risk and return preferences of individuals. The comments and recommendations contained in this document are of a general nature. These recommendations may not be suitable for your financial situation and risk and return preferences. Therefore, making an investment decision based solely on the information contained in this document may not result in outcomes that align with your expectations.
NOTE: All data used in Bitcoin on-chain analysis is based on CryptoQuant.
