
Active Addresses
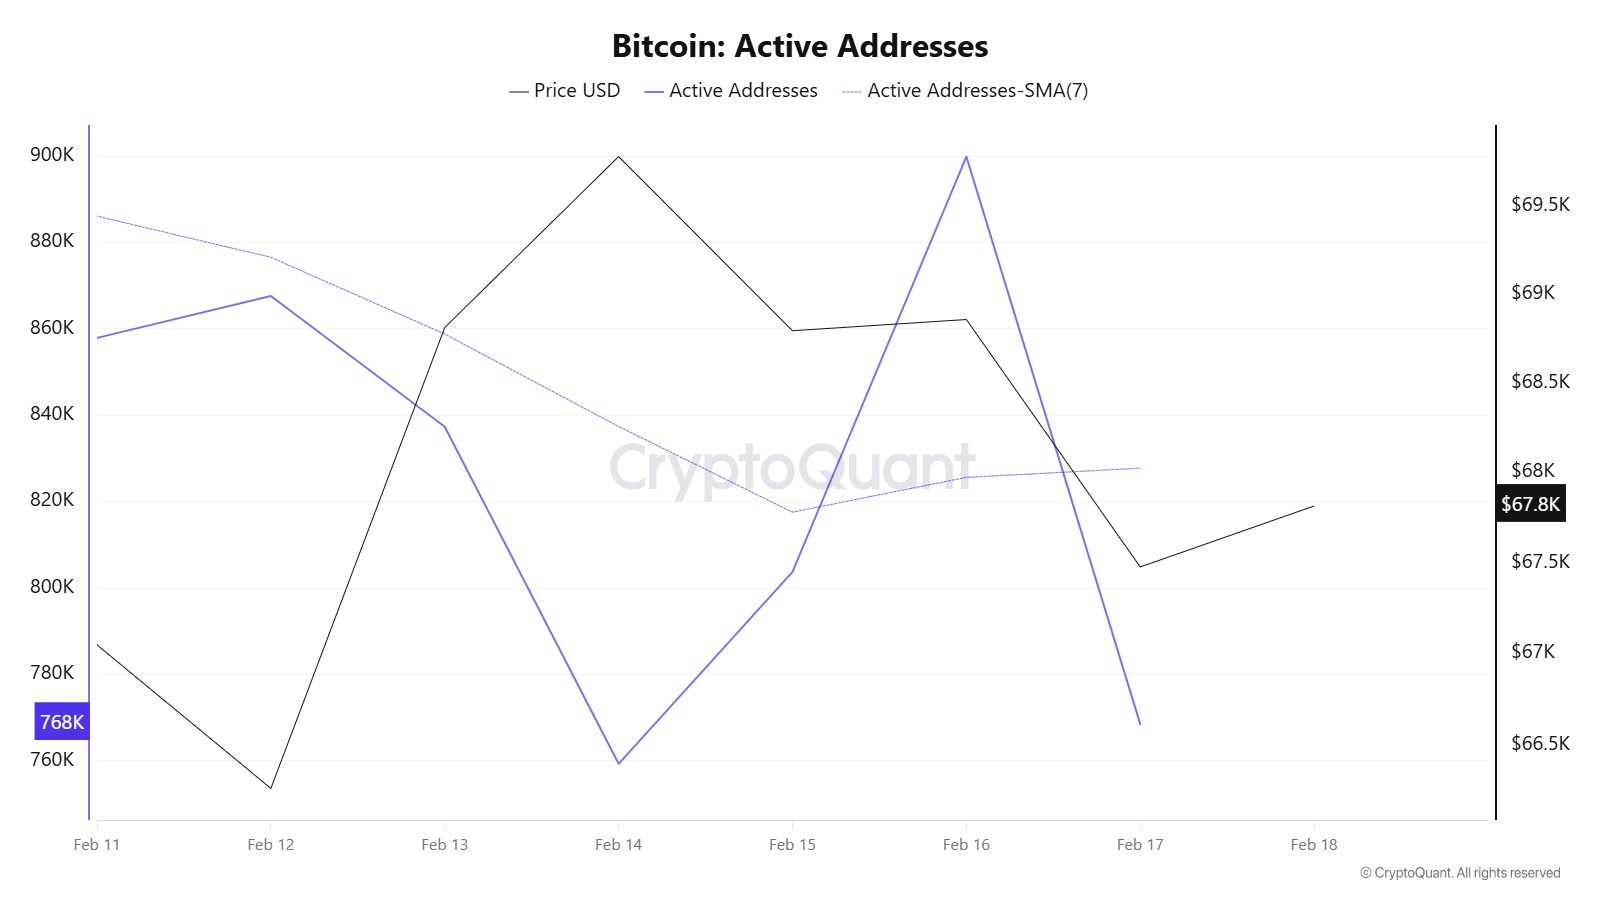
Between February 11 and February 18, recorded 899,888 active addresses on the Bitcoin network. During this period, Bitcoin’s price fell from $69,738 at the beginning of the week to $67,477 on February 17. From a technical perspective, the 7-day simple moving average (SMA) shows horizontal movement.
Active Sending Addresses
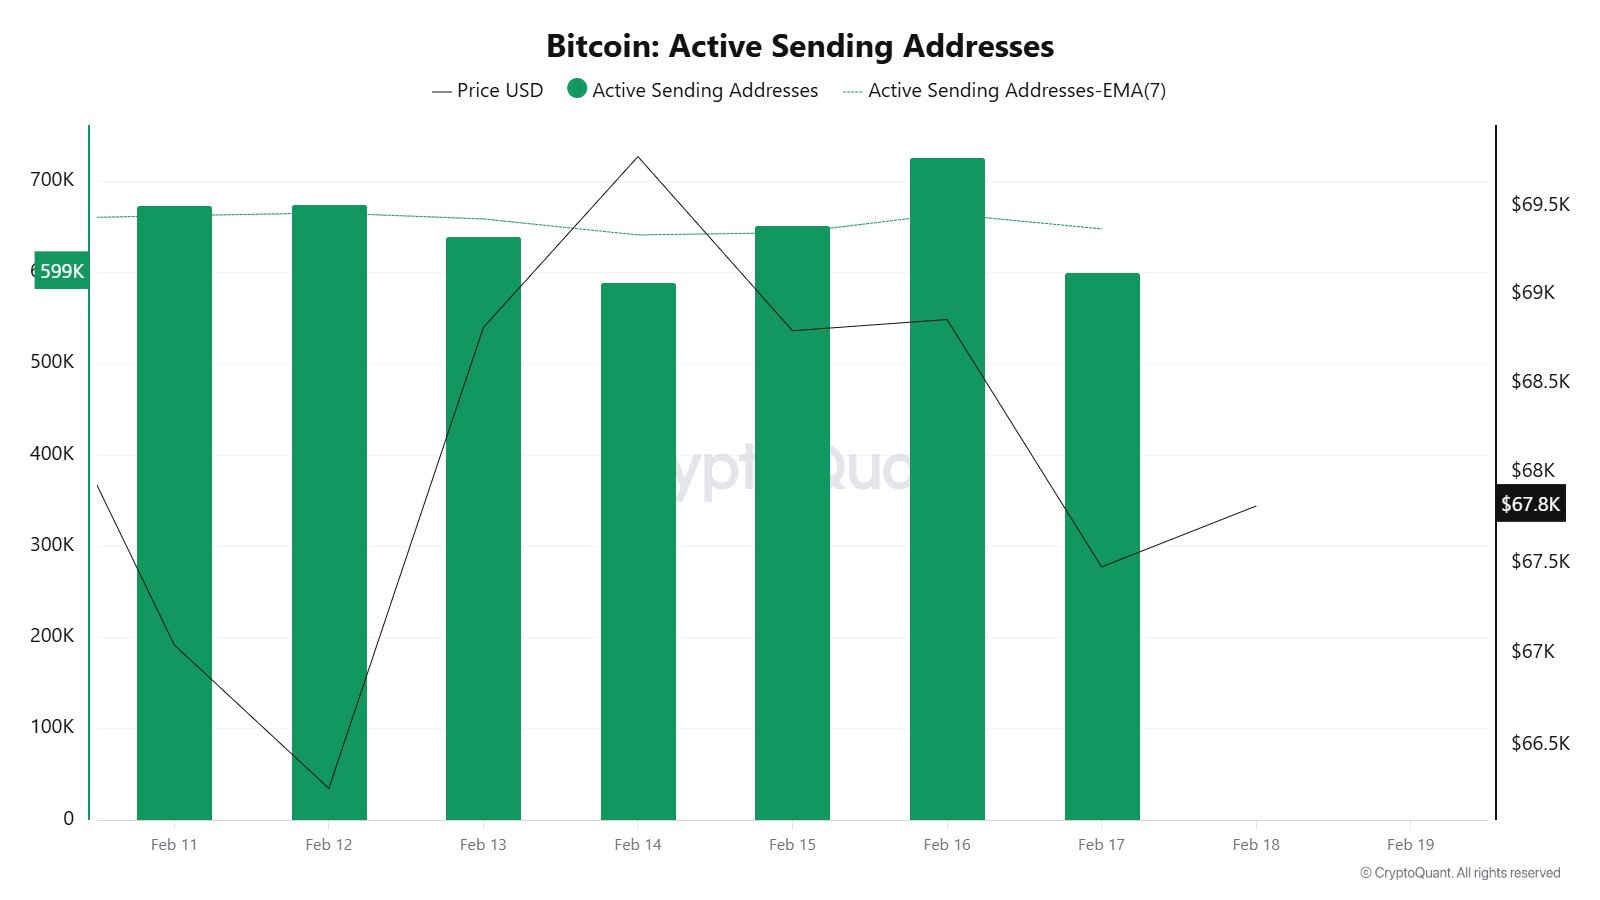
Between February 11 and February 18, an upward trend was observed in the active sending addresses metric. On the day the price reached its highest level, this metric stood at 725,448, indicating that user activity on the Bitcoin network was moving in parallel with the price. This data shows that the $68,000 level is supported not only by price but also by on-chain address activity. Overall, the Active Sending Addresses metric has followed a high trajectory during this period.
Active Receiving Addresses
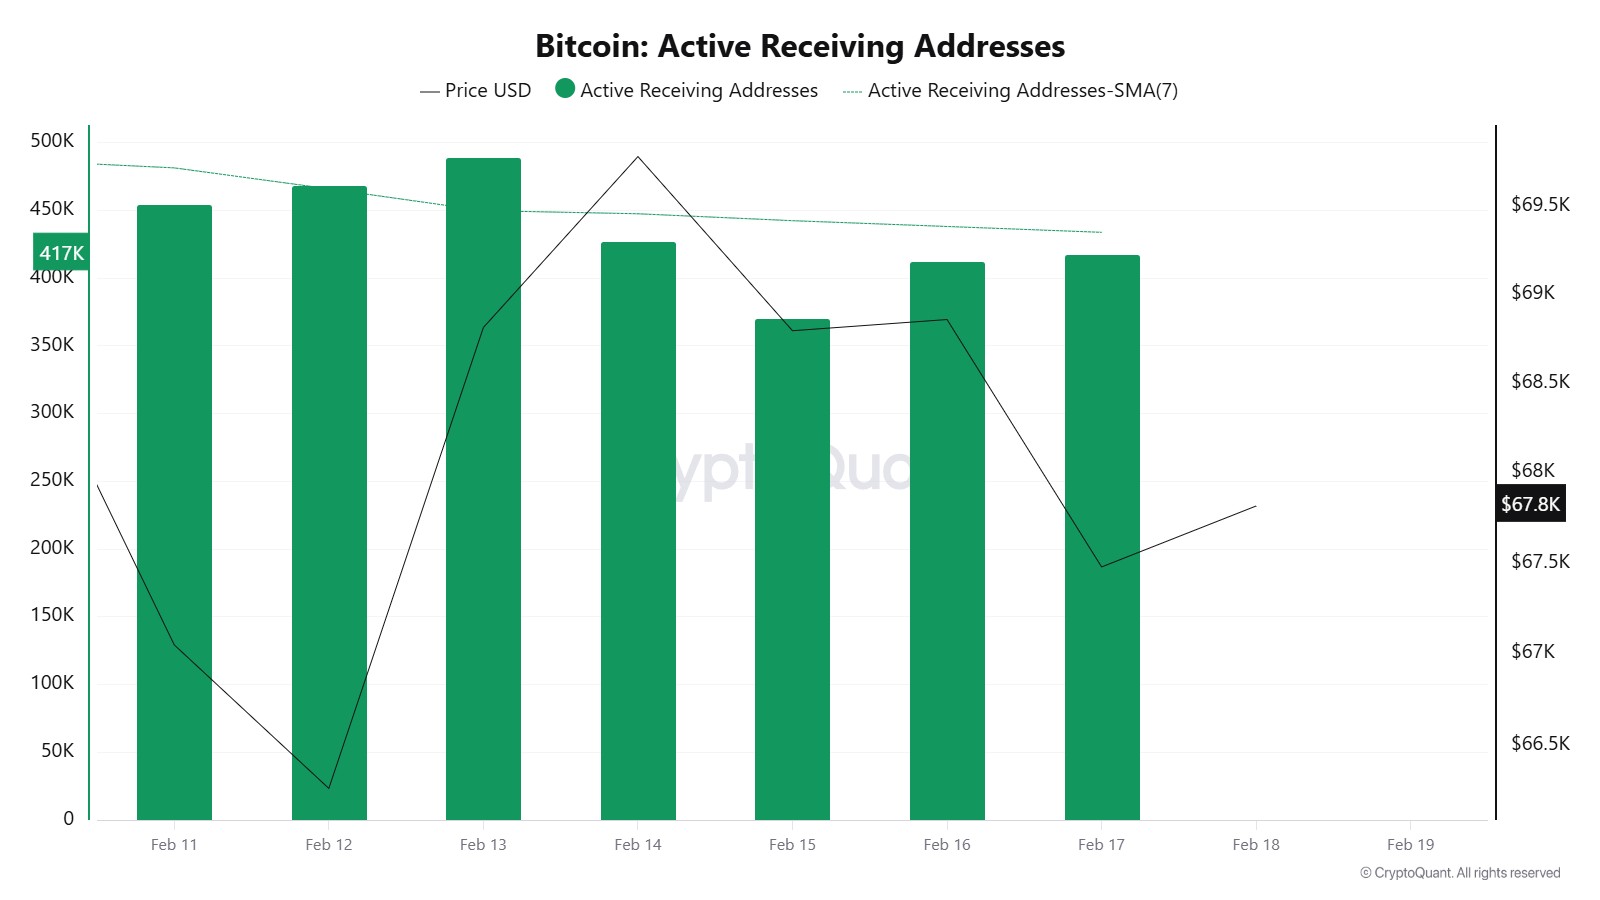
Between February 11 and February 18, active receiving addresses experienced a typical rise alongside the Black Line (price line). On the day the price reached its peak, active receiving addresses rose to 488,644 levels, indicating that buyers acquired Bitcoin at around the $68,800 level.
Breakdowns
MRVR
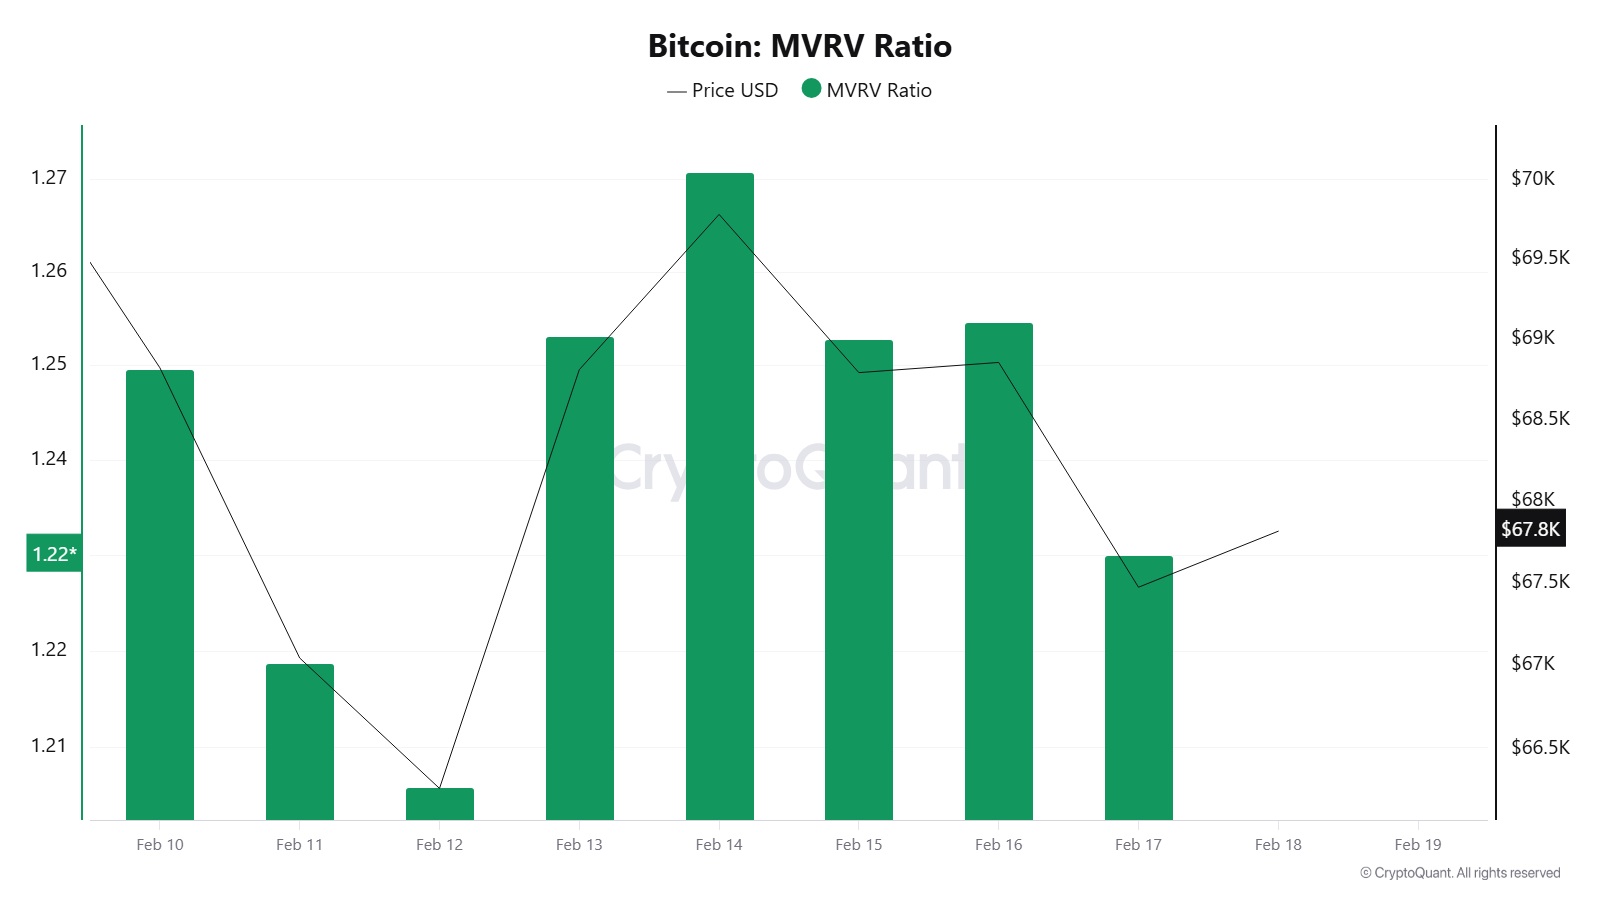
On February 11, while the Bitcoin price was trading at $67,047, the Market Value to Realized Value Ratio (MVRV) was at 1,218. As of February 17, the Bitcoin price rose to $67,477, recording a 0.64% increase, while the MVRV rose to 1.299, recording a 0.90% increase. The recovery in the MVRV indicates that the spot price’s premium over the realized cost base has widened again, albeit to a limited extent. However, as the current level still points to a low premium zone, the upward movement can be said to be more of a short-term balancing and reaction rather than a strong appetite for risk. In this scenario, while the MVRV accompanying the price increase is a positive detail, the premium expansion needs to become more permanent for the trend to strengthen.
Realized Price
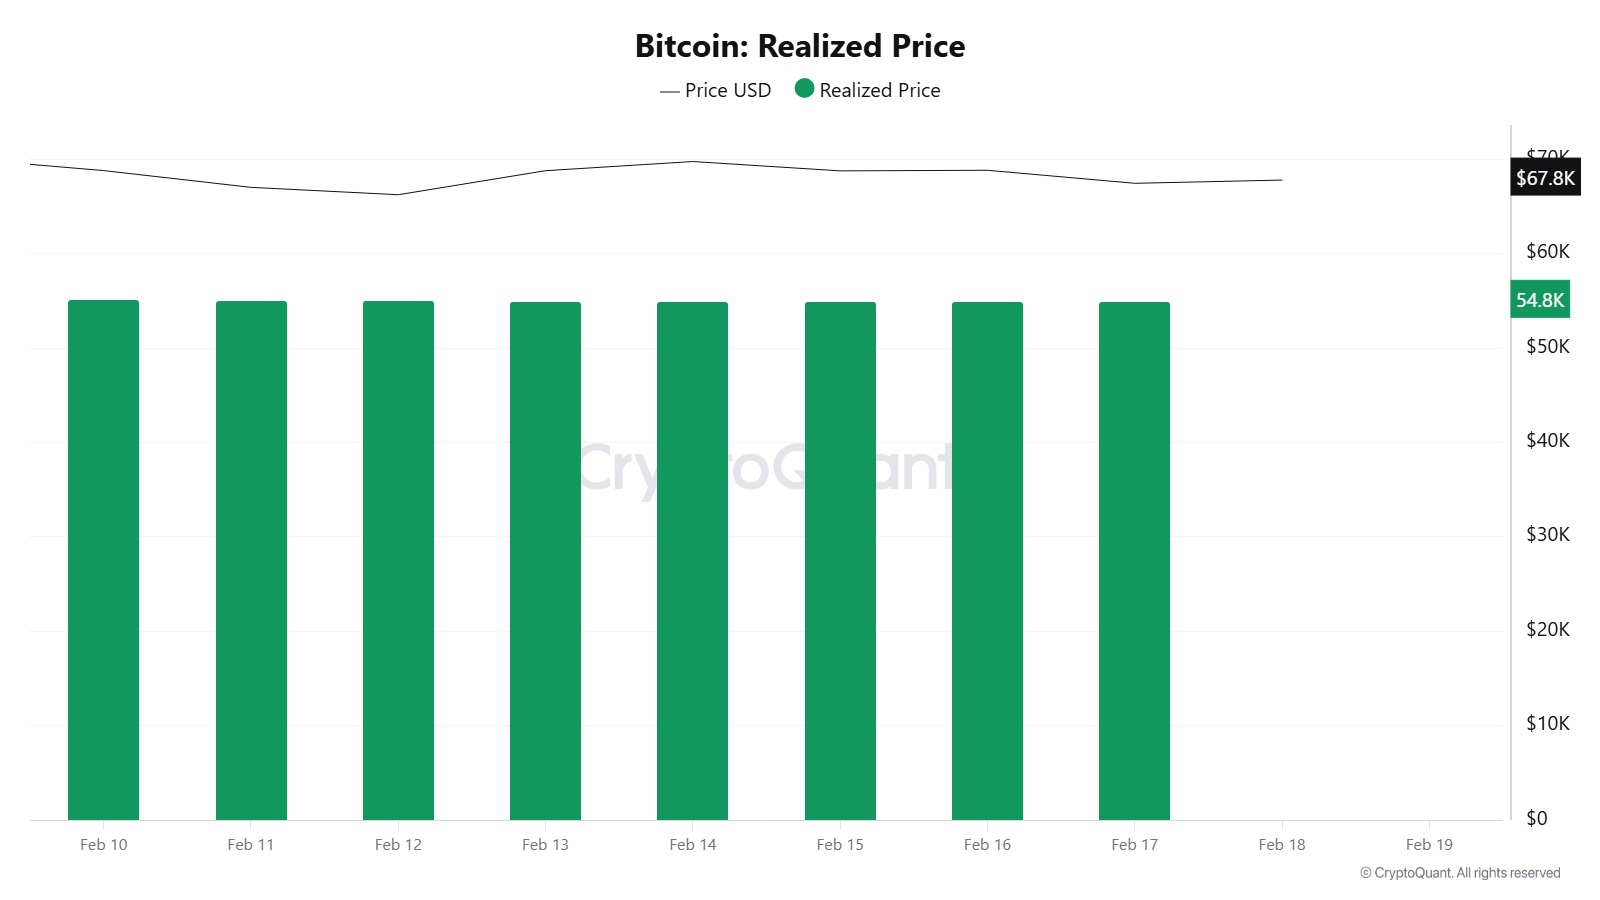
On February 11, while the Bitcoin price was trading at $67,047, the Realized Price was at $55,019. As of February 17, the Bitcoin price rose to $67,477, recording a 0.64% increase, while the Realized Price fell to $54,864, recording a limited 0.28% decline. The slight pullback in the Realized Price suggests that the cost basis has not fully strengthened even if the spot price recovers, and the average cost remains under downward pressure. However, the rise in the spot price during the same period confirms that the premium relative to the cost basis has widened to a limited extent this week rather than narrowing again. Nevertheless, the weak performance of the Realized Price suggests that the cost base has not yet gained clear upward momentum and that the sustainability of the recovery on the spot side needs to be tested.
Spent Output Profit Ratio (SOPR)
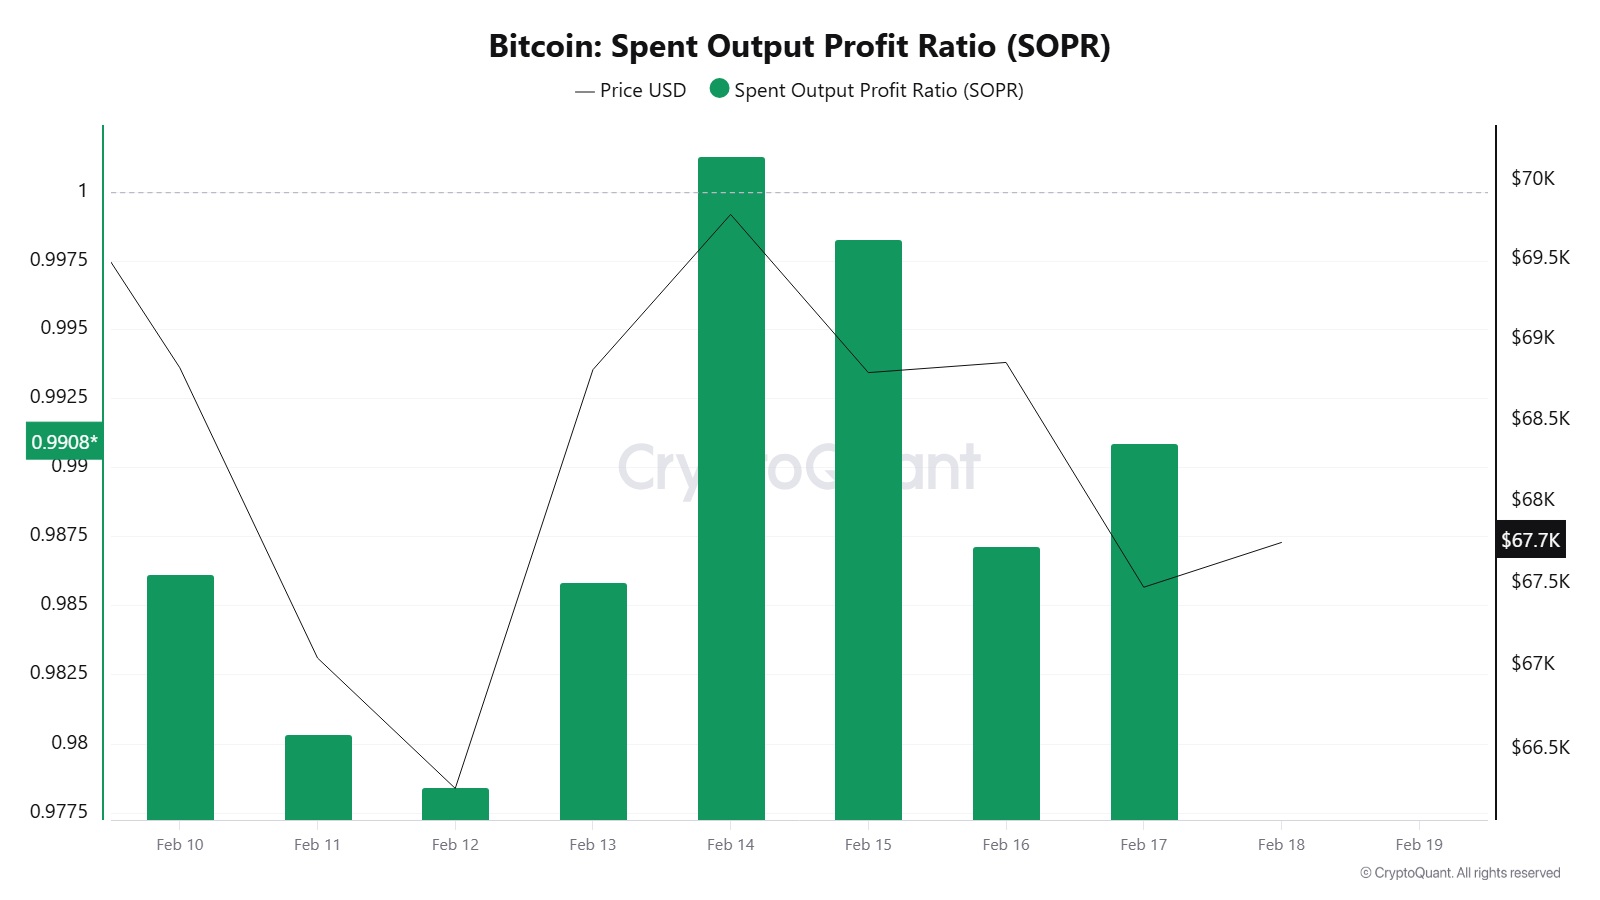
On February 11, when the Bitcoin price was trading at $67,047, the SOPR metric was at 0.980. As of February 17, the Bitcoin price rose to $67,477, recording a 0.64% increase, while SOPR rose to 0.990, recording a 1.02% increase. The SOPR remaining below 1 indicates that spent coins are still changing hands at a loss on average. However, the rise towards 1 signals that the intensity of loss-making sales is decreasing and that transactions are approaching break-even levels. This picture is not enough to say that selling pressure has completely ended in the short term, but it produces a clearer signal that balancing efforts in the bottom regions are strengthening.
Derivatives
Open Interest
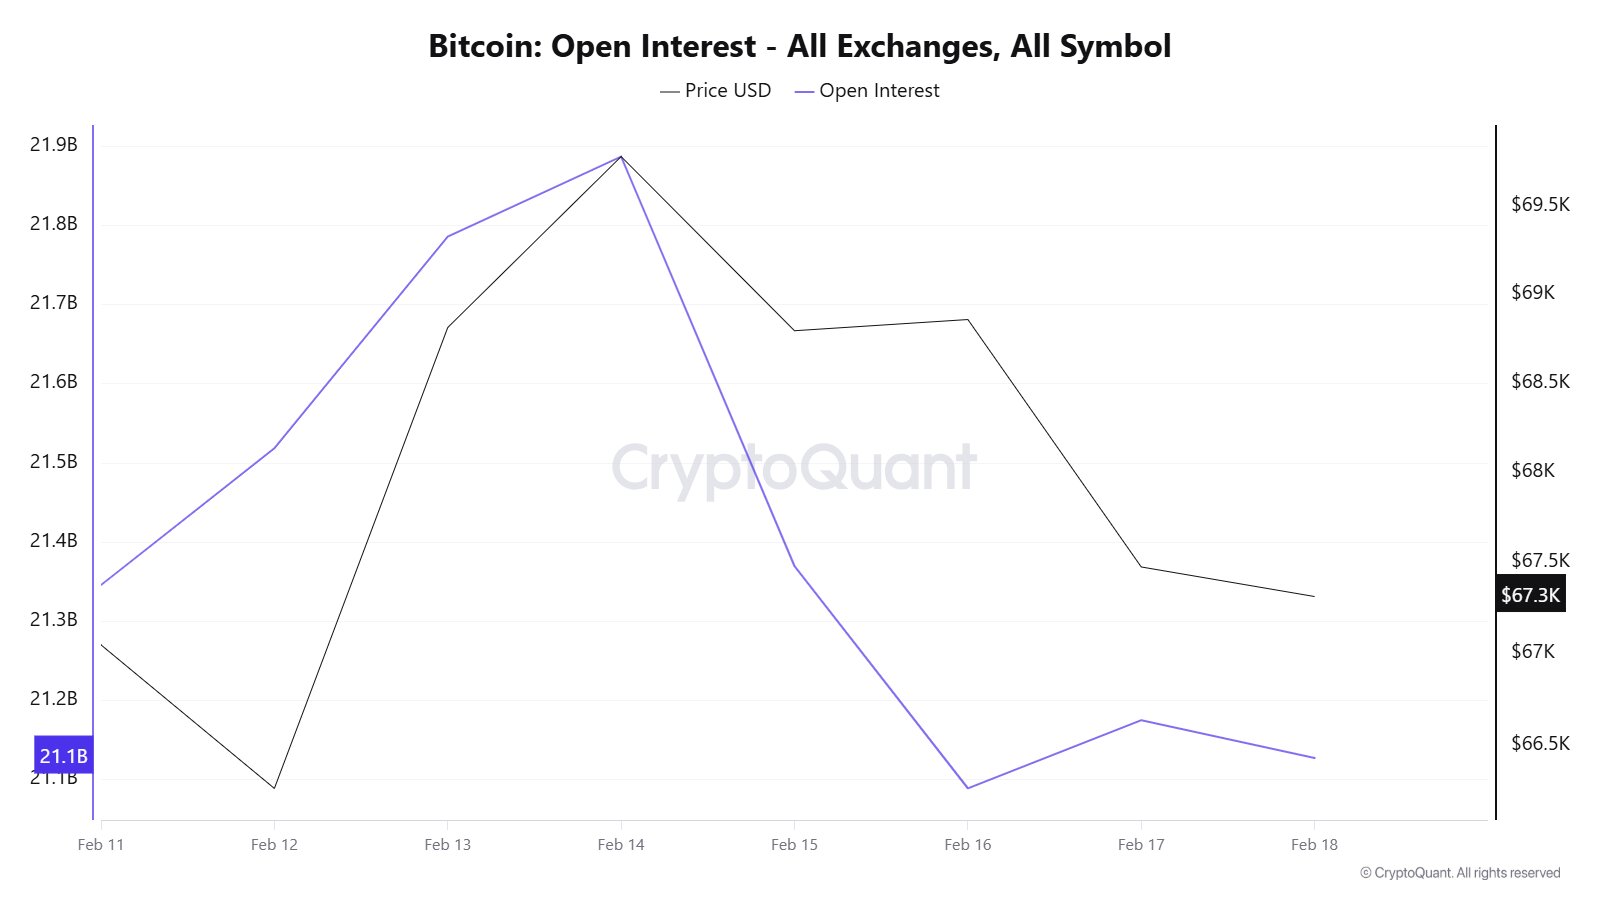
BTC open interest showed a gradual increase between February 11 and 14, drawing attention to the rise in market leverage usage. However, despite the sharp pullback in open interest during the February 15–16 period, the relatively limited decline in price indicates that long positions have been significantly cleared. The weak recovery in open interest in recent days suggests that new leverage entering the market remains cautious and that price movements in the short term may be more dependent on spot flows.
Funding Rate
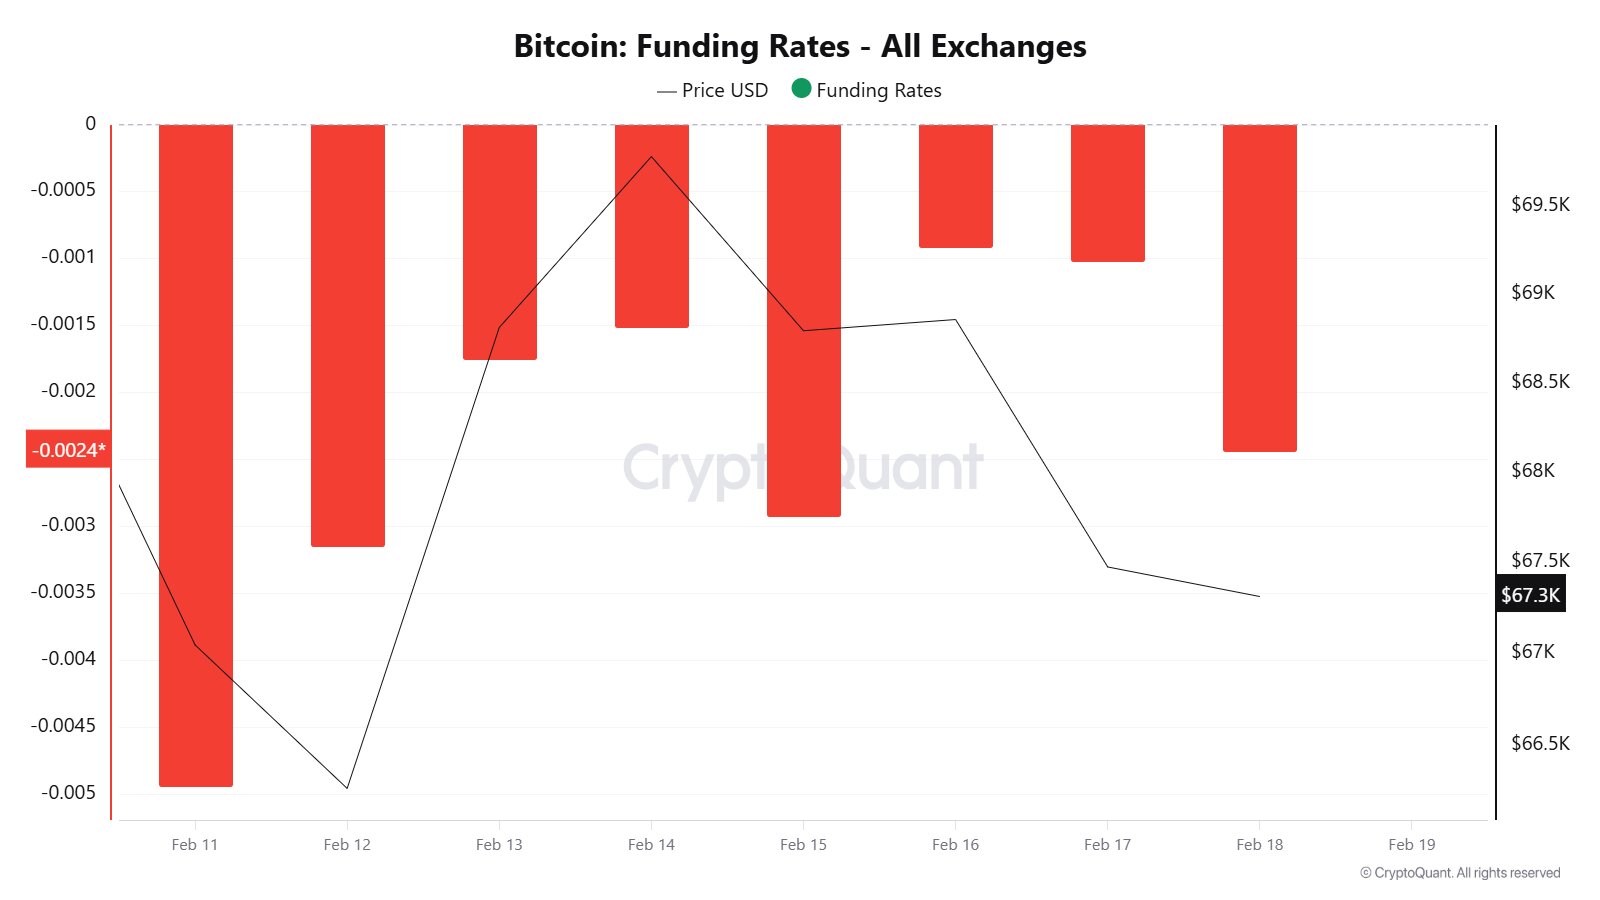
The BTC funding rate chart shows that the negative zone has been clearly maintained in recent days. This structure indicates that short positions have gained weight in the market and that traders are cautious, even slightly bearish. Despite the relatively limited pullback in price, the fact that funding remains negative suggests that there is no excessive accumulation of longs and that the potential for a short squeeze in possible upward movements remains on the table.
Long & Short Liquidations
Last week, the BTC price first rose to the $71,000 level and then fell back to the $66,600 level. However, while a total of $1.39 billion in short positions were liquidated, $324 million in long positions were liquidated.
| Date | Long Amount (Million $) | Short Amount (Million $) |
|---|---|---|
| February 11 | 98.25 | 321.00 |
| February 12 | 66.27 | 217.44 |
| February 13 | 11.05 | 736.96 |
| February 14 | 14.15 | 47.31 |
| February 15 | 47.00 | 24.86 |
| February 16 | 40.39 | 25.97 |
| February 17 | 47.12 | 18.90 |
| Total | 324.23 | 1,392.44 |
Supply Distribution
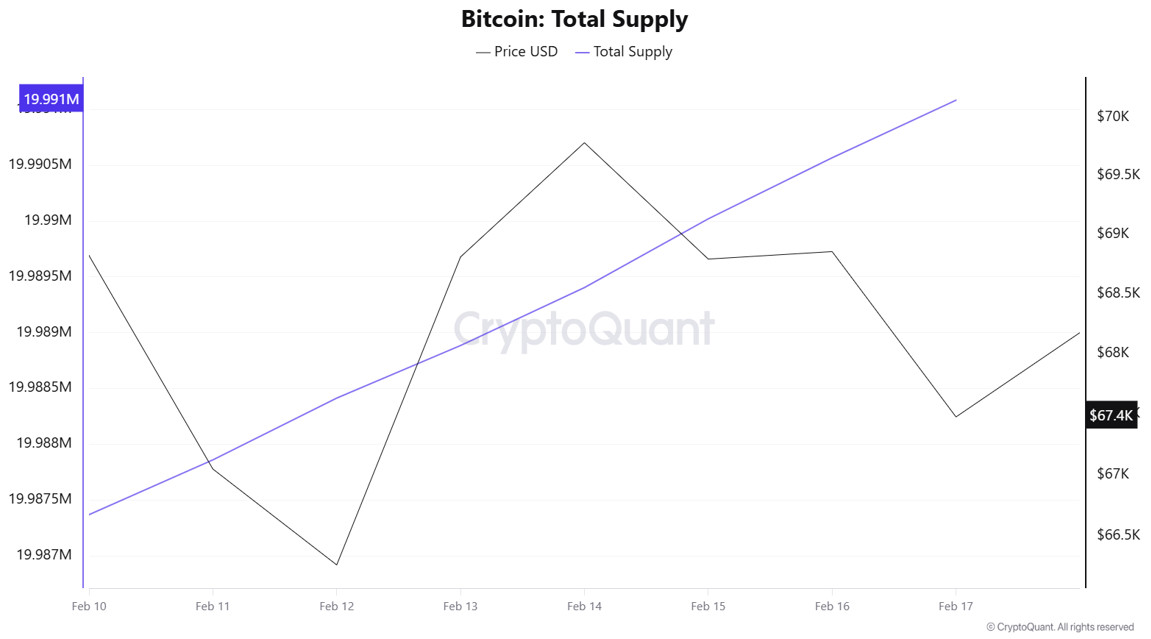
Total Supply: Reached 19,991,081 units, an increase of approximately 0.019% compared to last week.
New Supply: The amount of BTC produced this week was 3,712.
Velocity: The velocity, which was 12.68 last week, reached 12.74 as of February 17.
| Wallet Category | February 10, 2025 | February 17, 2025 | Change (%) |
|---|---|---|---|
| < 1 BTC | 8.4668% | 8.4854% | 0.22% |
| 1 – 10 BTC | 11.2868% | 11.3078% | 0.19% |
| 10 – 100 BTC | 22.8971% | 22.9937% | 0.42% |
| 100 – 1k BTC | 28.2239% | 28.1246% | −0.35% |
| 1k – 10k BTC | 21.1871% | 21.3233% | 0.64% |
| 10k+ BTC | 7.9379% | 7.7648% | −2.18% |
The limited increase in the <1 and 1–10 BTC segments indicates that retail investors remain cautious. While expansion continues in the 10–100 BTC segment, the contraction in the 100–1,000 BTC segment points to a medium-term resolution. While the increase in the 1,000–10,000 BTC group is noteworthy, the significant decline in 10k+ BTC shows that the largest whales are selling.
Exchange Supply Ratio
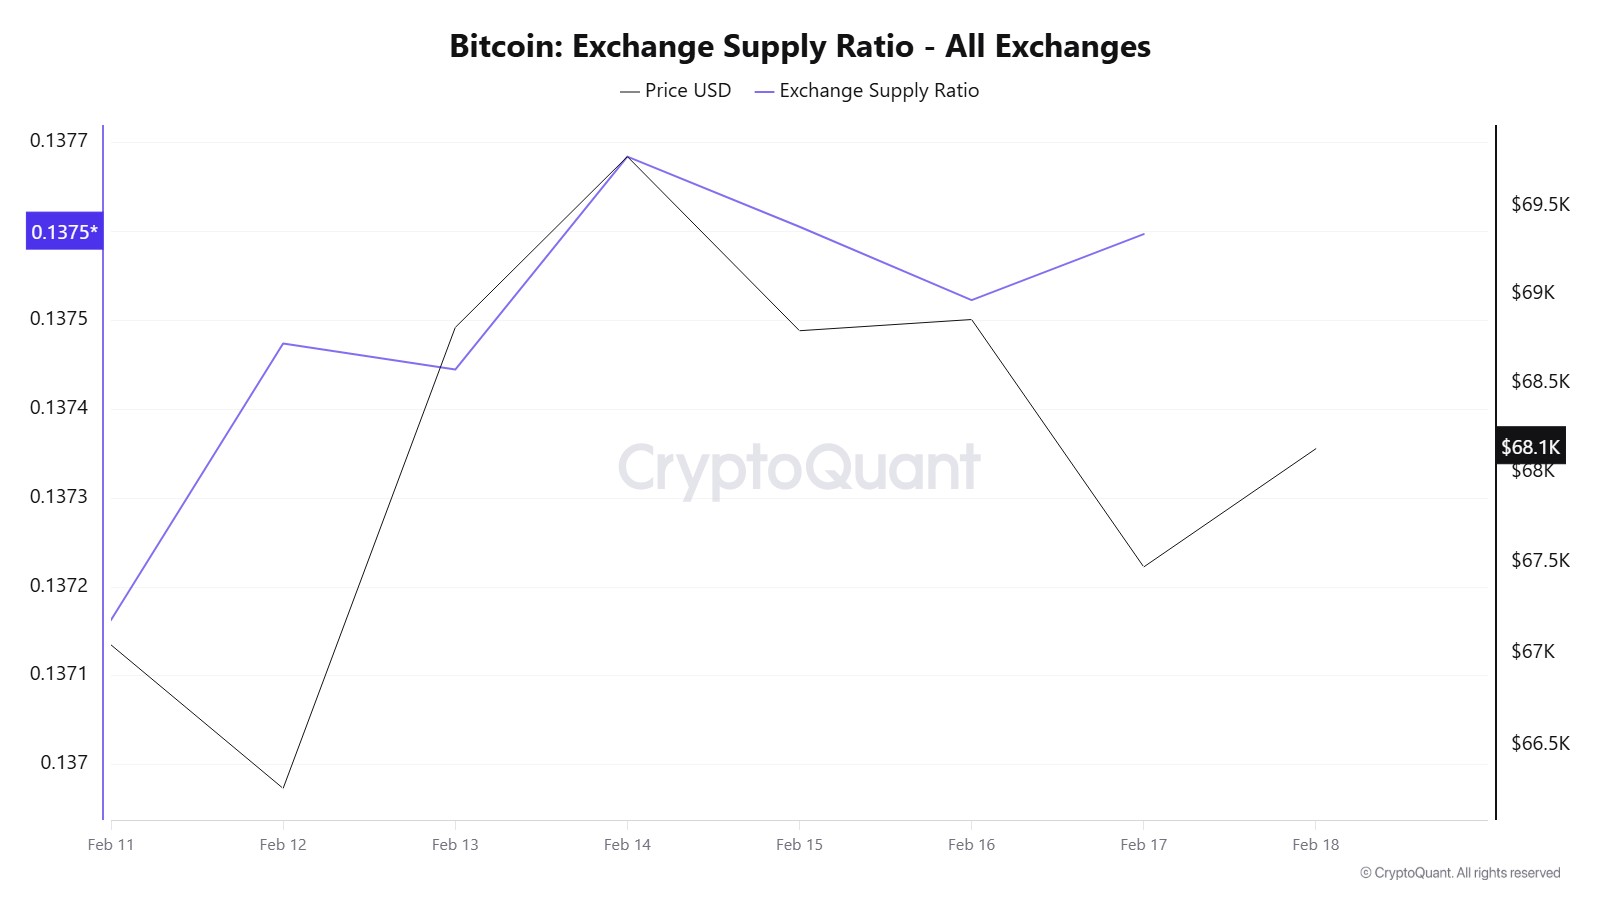
According to Bitcoin Exchange Supply Ratio data, a decline in the Bitcoin supply ratio held on exchanges was observed throughout the week under review. This week, a positive correlation between the Bitcoin price and the supply ratio on exchanges appears to be dominant. The decline in the Exchange Supply Ratio indicates that Bitcoins are being withdrawn from exchanges and held in cold wallets, and that selling pressure remains limited in the short term. Between February 11 and February 18, the Bitcoin Exchange Supply Ratio declined slightly from approximately 0.13847413 to 0.13765828. During the same period, the Bitcoin price retreated from the $69,000 level to the $67,000 range.
The fact that both the price and the Exchange Supply Ratio moved downwards in the same direction during this period indicates that risk appetite among market participants has weakened and that new Bitcoin inflows to exchanges have remained limited.
Exchange Reserve
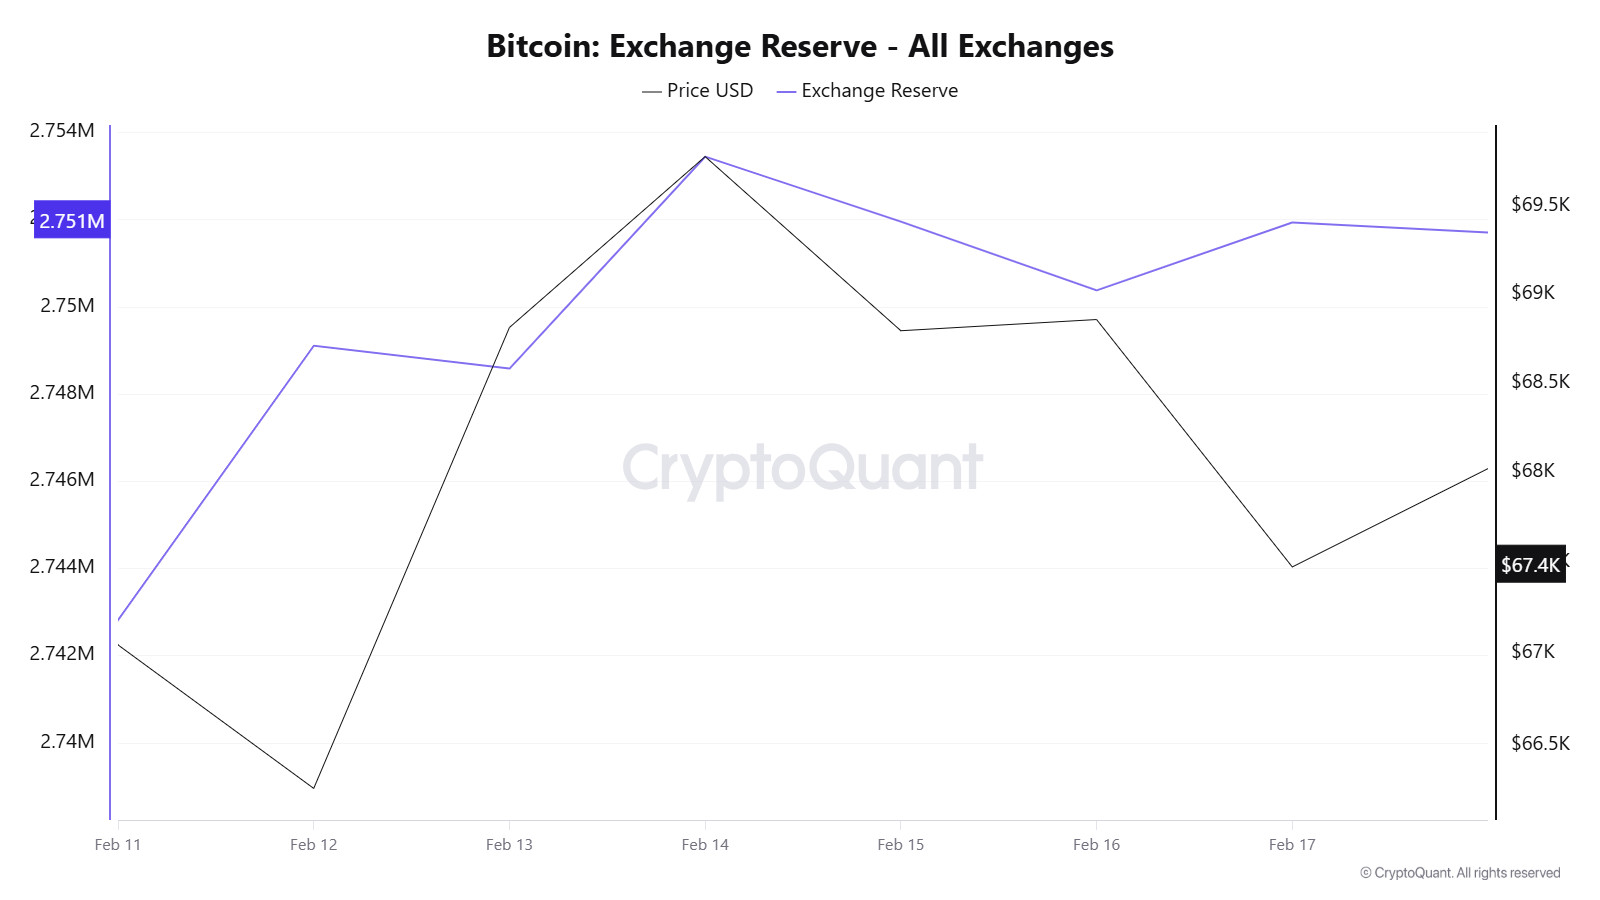
Between February 11-17, 2026, Bitcoin reserves on exchanges rose from 2,738,959 BTC to 2,751,938 BTC, resulting in a net inflow of 12,979 BTC. During this period, reserves increased by approximately 0.47%, while the BTC price fell from $68,802 to $67,477, losing 1.92% of its value. Although there were net outflows on some days during the week, the overall picture pointed to a limited but steady inflow into exchanges. The increase in reserves during this period of weak and volatile prices indicated that investors were cautious rather than optimistic about a rise.
| Metric | 11-Feb | 12-Feb | 13-Feb | 14-Feb | February 15 | February 16 | February 17 |
|---|---|---|---|---|---|---|---|
| Exchange Inflow | 36,405 | 36,260 | 38,093 | 16,447 | 7,700 | 13,410 | 25,552 |
| Exchange Outflow | 32,548 | 29,965 | 38,615 | 11,584 | 9,192 | 14,986 | 23,997 |
| Exchange Netflow | 3,857 | 6,295 | -522 | 4,863 | -1,493 | -1,576 | 1,555 |
| Exchange Reserve | 2,738,959 | 2,749,111 | 2,748,589 | 2,753,452 | 2,751,959 | 2,750,383 | 2,751,938 |
| BTC Price | 68,802 | 66,264 | 68,814 | 69,784 | 68,796 | 68,859 | 67,477 |
Fees and Revenues
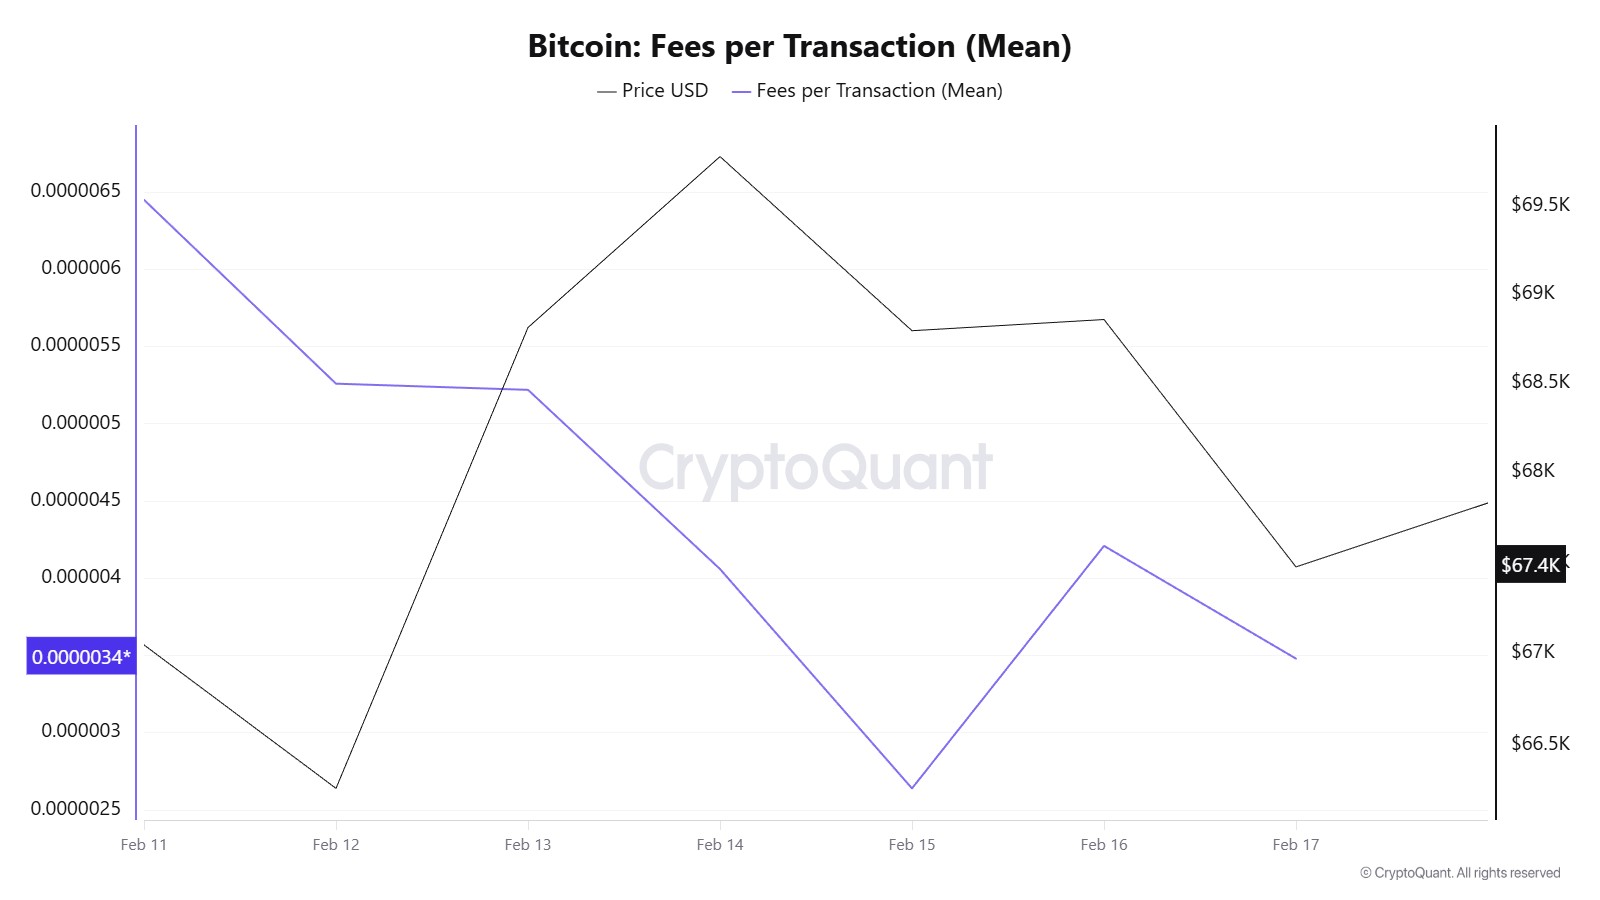
When examining the Bitcoin Fees per Transaction (Mean) data between February 11 and 17, it is seen that the indicator reached 0.00000645 on February 11, the first day of the week.
A decline was observed until February 15, and on that date, the indicator recorded its lowest value of the week at 0.00000264.
In this context, as a result of the increase in Bitcoin price volatility as of February 15, the indicator regained momentum and followed a positive trend due to the impact of price volatility.
On February 17, the last day of the weekly period, the indicator closed the week at 0.00000348 .
Bitcoin: Fees (Total)
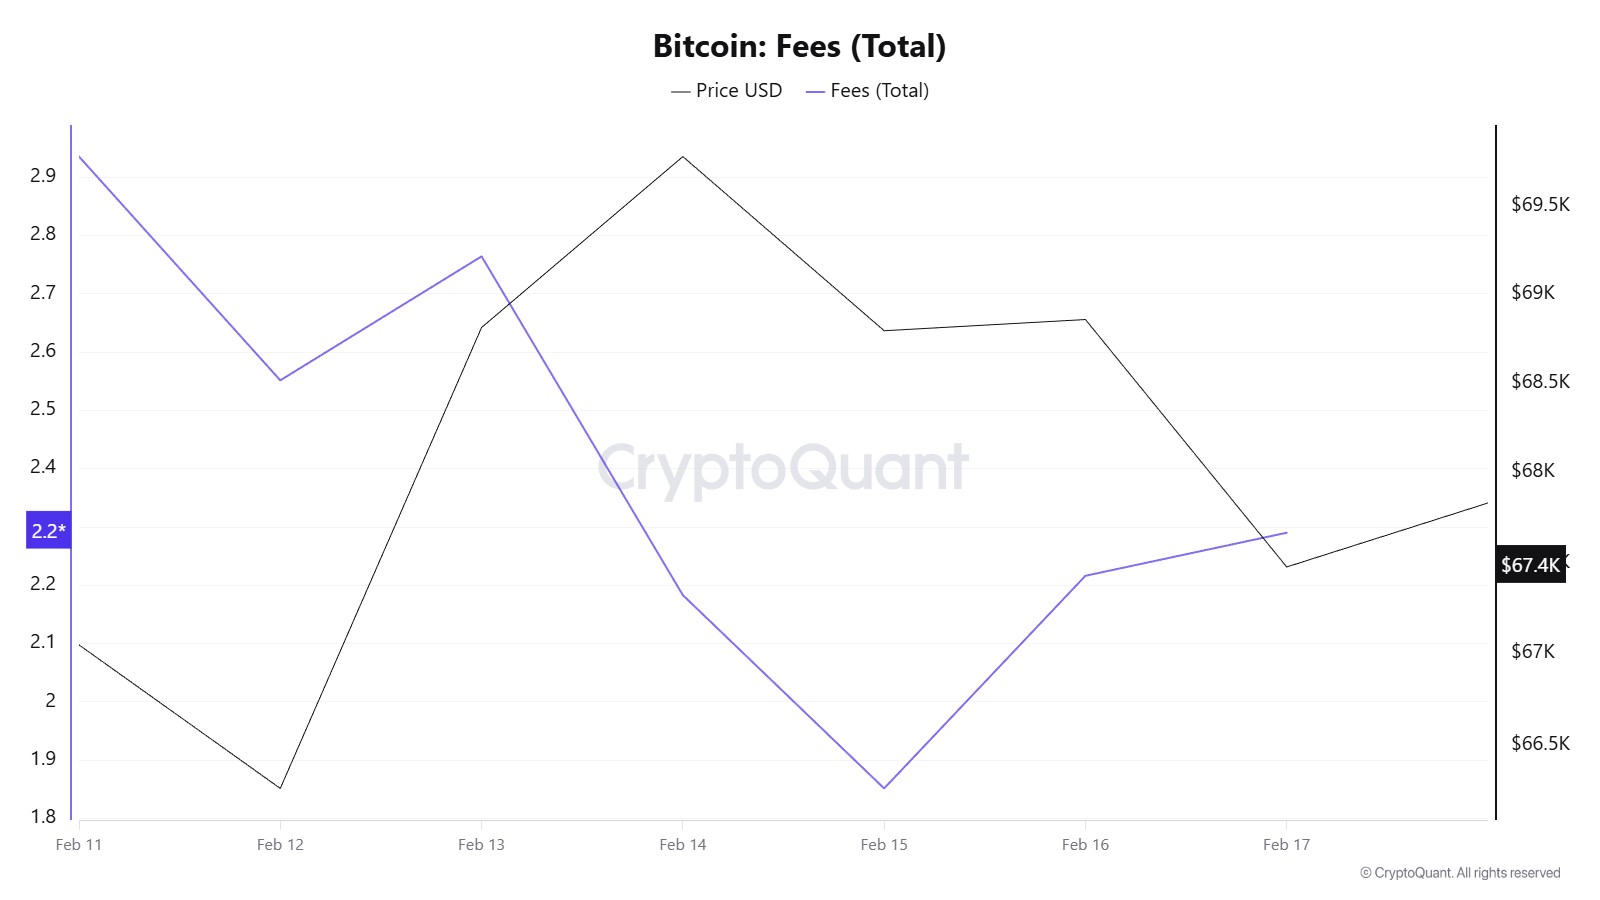
Similarly, when examining the Bitcoin Fees (Total) data for the period between February 11 and 17, it is observed that the indicator reached 2.93574854 on February 11, the first day of the week.
A decline was observed until February 15, and on that date, the indicator recorded the week’s lowest value at 1.85144308.
In this context, as a result of the increase in Bitcoin price volatility as of February 15, the indicator regained momentum and followed a positive trend due to the impact of price volatility.
On February 17, the last day of the weekly period, the indicator closed the week at 2.29023986.
Miner Flows
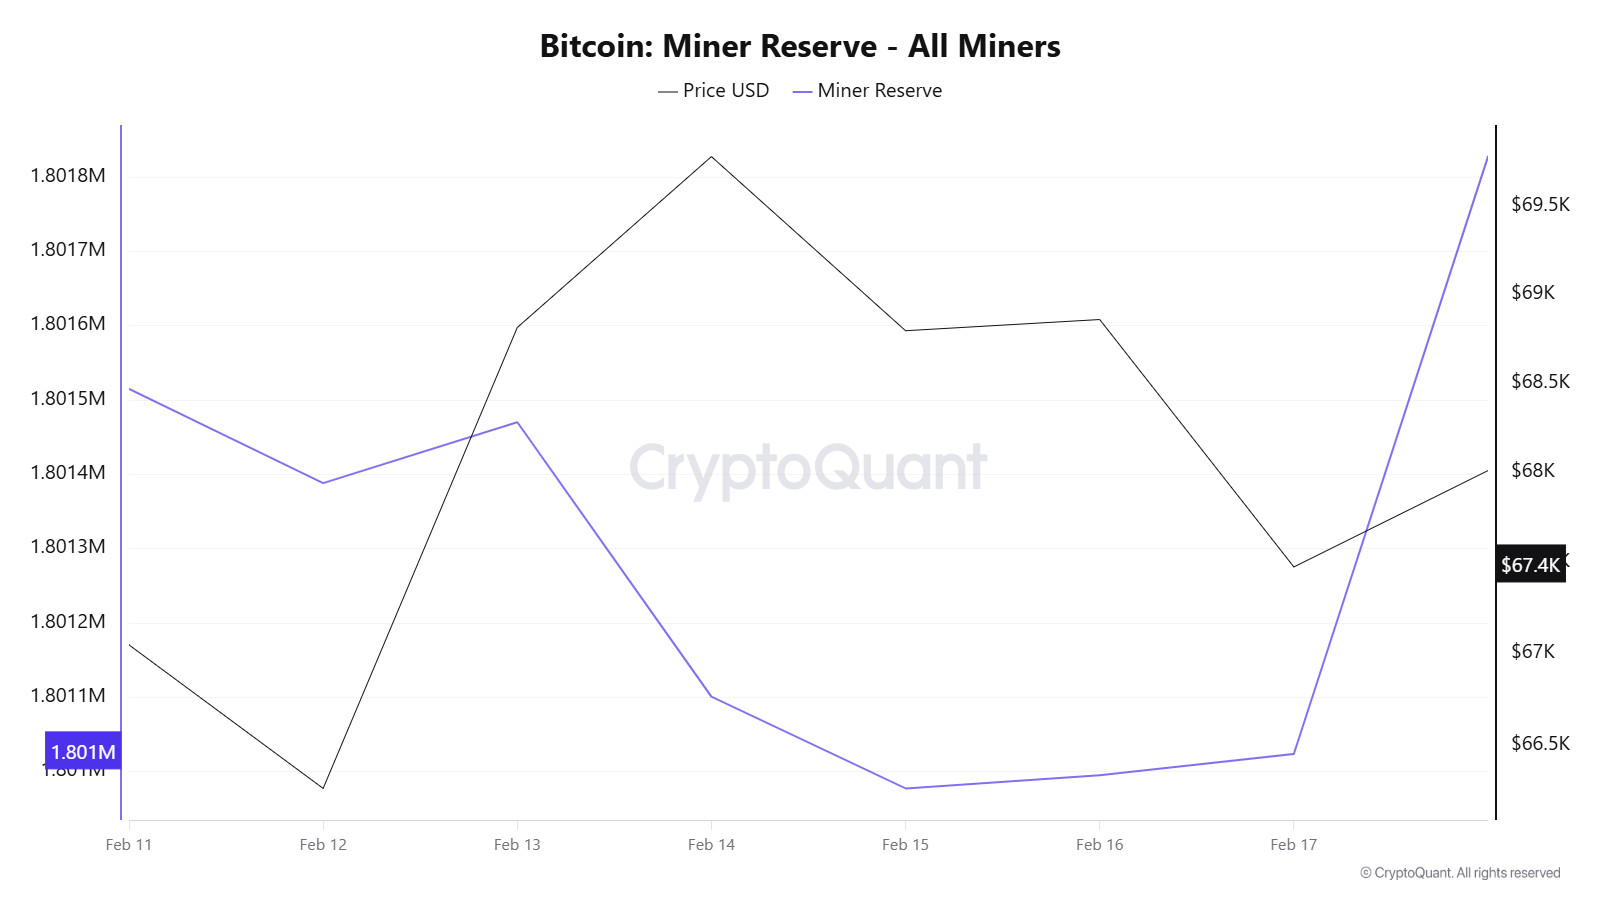
According to data obtained from the Miner Reserve table, a decrease in Bitcoin reserves held in miners’ wallets was observed this week. A time-dependent correlation structure between the Bitcoin price and miner reserve was observed during the period under review. However, the general trend shows that a positive correlation between these two variables is dominant.
Miner Inflow, Outflow, and Netflow
Between February 11 and 17, 48,708 Bitcoin were withdrawn from miners’ wallets, while 48,655 Bitcoin were deposited into miner wallets during the same period. This week’s Miner Netflow was -53 Bitcoin. Meanwhile, the Bitcoin price was $67,047 on February 11 and $67,477 on February 17.
Throughout the week, Bitcoin inflows into miner wallets (Miner Inflow) were less than Bitcoin outflows from miner wallets (Miner Outflow), resulting in a negative net flow (Miner Netflow).
| Metric | Feb. 11 | Feb. 12 | Feb. 13 | Feb. 14 | Feb. 15 | Feb. 16 | Feb. 17 |
|---|---|---|---|---|---|---|---|
| Miner Inflow | 12,152.35 | 10,794.06 | 9,538.76 | 3,814.86 | 2,735.58 | 4,285.56 | 5,334.12 |
| Miner Outflow | 11,713.60 | 10,921.08 | 9,456.67 | 4,184.31 | 2,859.16 | 4,267.81 | 5,305.39 |
| Miner Netflow | 438.76 | -127.02 | 82.09 | -369.46 | -123.58 | 17.75 | 28.73 |
Transaction
![]()
Last week, 2,994,527 transactions took place on the Bitcoin network, while this week the number of transactions rose to 3,893,241, recording a strong increase of approximately 30%. During the period under review, the highest daily transaction count was recorded on February 15 at 701,772, while the lowest level was recorded on February 11 at approximately 385,000. Looking at the relationship between transaction count and price, a weaker correlation compared to previous periods is noticeable. The overall picture shows that despite the increase in transaction volume, the relationship with price has been predominantly negative and disconnected.
Tokens Transferred
While a total of 8,811,646 BTC was transferred in the previous period, this week’s transfer volume decreased by 41.2% to 5,185,753 BTC. The highest daily transfer volume during the time frame was recorded on February 11 at 936,953 BTC, while the lowest daily volume was recorded on February 15 at 527,096 BTC. The correlation between the amount of BTC transferred and the price showed a more balanced picture throughout the period.
Despite the sharp decline in total transfer volume, the strong increase in the number of transactions indicates that the amount of BTC per transaction on the network has declined significantly. This picture shows that smaller transactions have gained weight and network activity has spread to the base. In other words, while whale volume has declined, retail intensity appears to have increased. Price movements are typically more volatile during such periods. An increase in transaction volume does not always signal a strong and sustained uptrend; if volume support is weak, momentum sustainability may be limited.
Whale Activities
Whale Data:
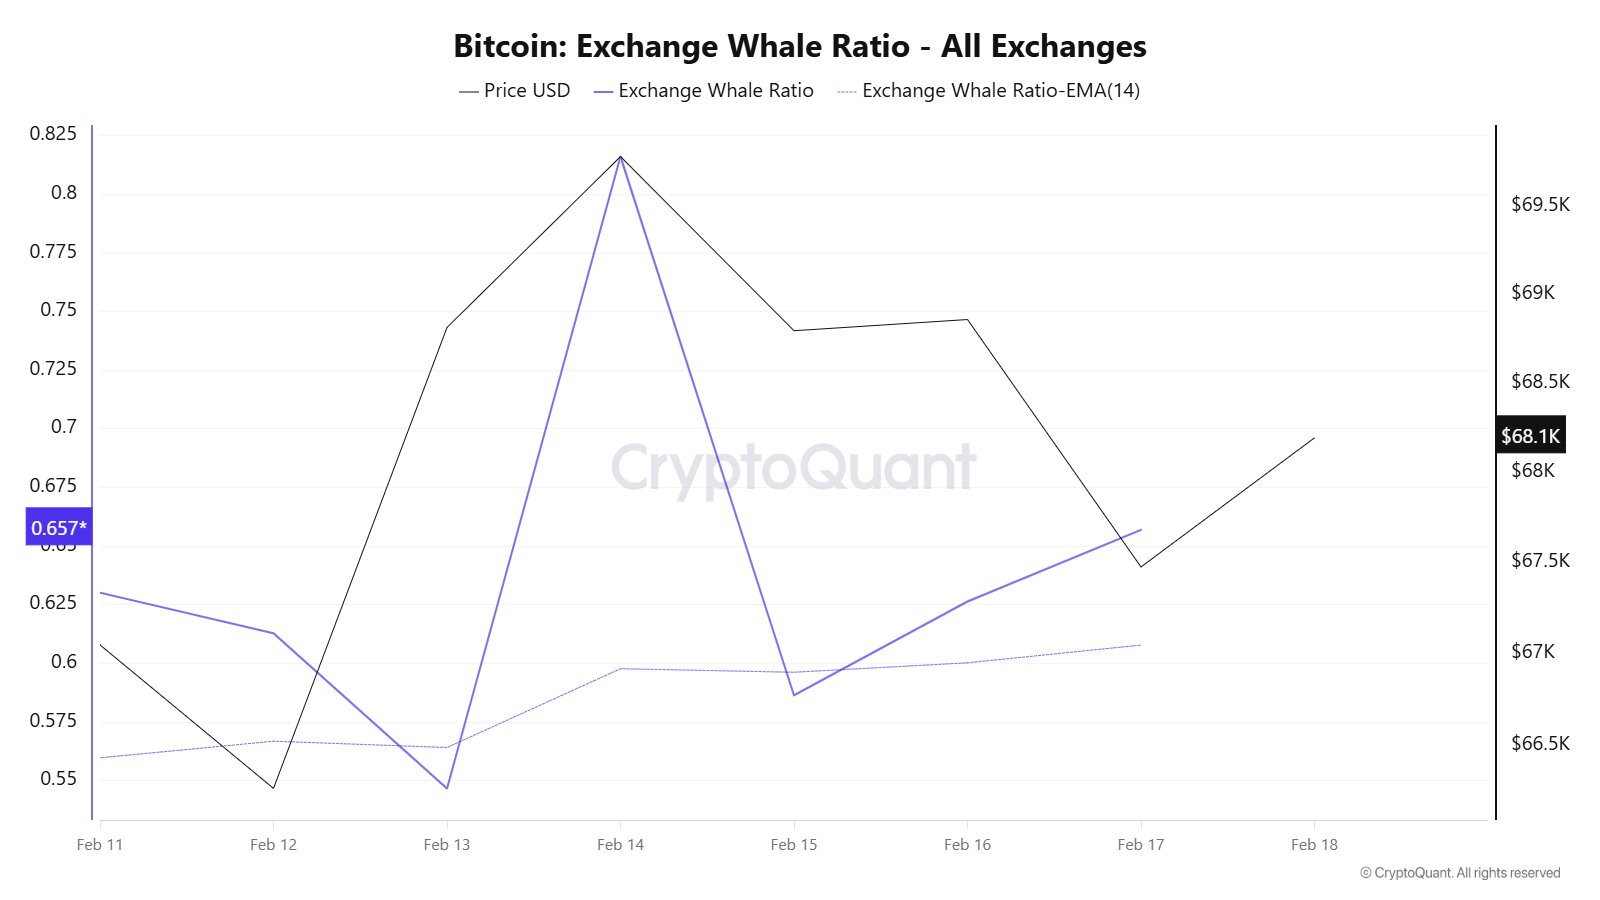
Looking at whale activity on centralized exchanges over the last 7 days based on crypto market data, the metric experienced a slight pullback at the beginning of the process but rose in the middle of the process. This indicated increased activity on these centralized exchanges. In the final days of the process, it experienced a pullback. Looking at the Exchange Whale Ratio metric, on February 11, the first day of the 7-day period, the ratio of whales using centralized exchanges was 0.630. The lowest point of the process occurred on February 13, falling to 0.546. After this date, the metric began to rise, reaching its peak on February 14 at 0.816. When this ratio is above the 0.35–0.45 band, it generally means that whales are frequently using centralized exchanges. Currently at 0.657, the metric is valued in what we could call the middle range of the process. During this process, the price traded in a narrow band between $65,200 and $70,700. This signaled that whales were engaged in a balanced battle for BTC on centralized exchanges. At the same time, total BTC transfers decreased by approximately 41% compared to last week, with 5,185,749 BTC moving. The data indicated that despite continued selling pressure, whale accumulation increased by 200,000 BTC. While whale inflows into exchanges have increased recently, their overall holdings continued to grow. A medium-term perspective shows a change in whale behavior. Following a sharp 7% drop on December 15, 2025, whale holdings increased by 3.4%. As a result, during this period, the supply held by whales rose from 2.9 million BTC to over 3.1 million BTC. The last significant whale movement on this scale occurred during the April 2025 correction, which helped absorb selling pressure and supported the rally, pushing BTC to $126,000.
BTC Onchain Overall
| Metric | Positive 📈 | Negative 📉 | Neutral ➖ |
|---|---|---|---|
| Active Addresses | ✓ | ||
| Breakdowns | ✓ | ||
| Derivatives | ✓ | ||
| Supply Distribution | ✓ | ||
| Exchange Supply Ratio | ✓ | ||
| Exchange Reserve | ✓ | ||
| Fees and Revenues | ✓ | ||
| Miner Flows | ✓ | ||
| Transaction | ✓ | ||
| Whale Activity | ✓ |
*The metrics and guidance provided in the table do not alone explain or imply any expectation of future price changes for any asset. Digital asset prices can fluctuate based on many different variables. The on-chain analysis and related guidance are intended to assist investors in their decision-making process, and basing financial investments solely on the results of this analysis may lead to unfavorable outcomes. Even if all metrics produce positive, negative, or neutral results simultaneously, the expected outcomes may not materialize depending on market conditions. It would be beneficial for investors reviewing the report to take these warnings into consideration.
Legal Notice
The investment information, comments, and recommendations contained in this document do not constitute investment advisory services. Investment advisory services are provided by authorized institutions on a personal basis, taking into account the risk and return preferences of individuals. The comments and recommendations contained in this document are of a general nature. These recommendations may not be suitable for your financial situation and risk and return preferences. Therefore, making an investment decision based solely on the information contained in this document may not result in outcomes that align with your expectations.
NOTE: All data used in Bitcoin on-chain analysis is based on CryptoQuant.
