
Active Addresses
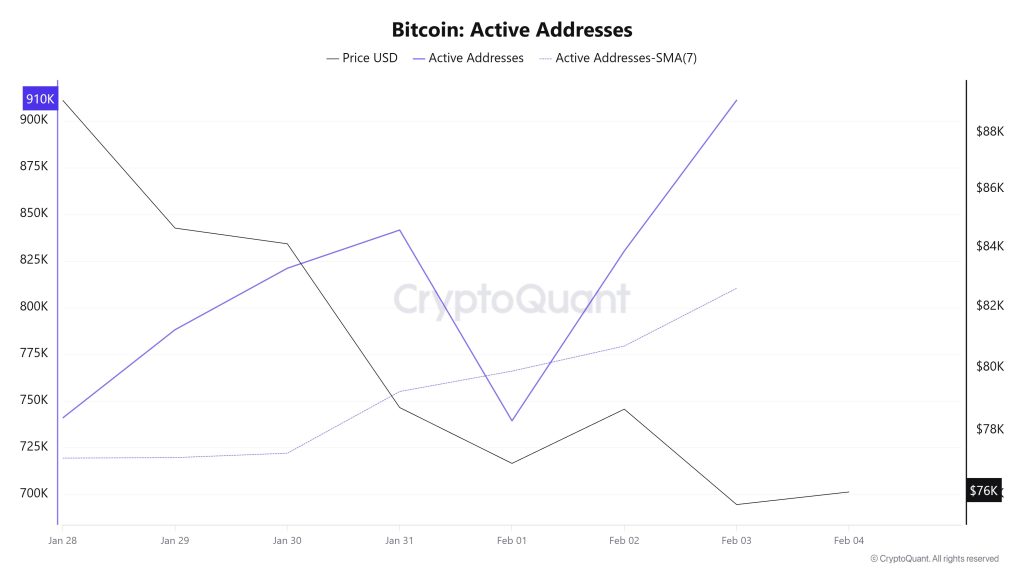
Between January 28 and February 4, recorded 910,947 active addresses on the Bitcoin network. During this period, Bitcoin’s price fell from $89,000 at the beginning of the week to $79,000 on February 4. From a technical perspective, the 7-day simple moving average (SMA) shows a downward trend.
Active Sending Addresses
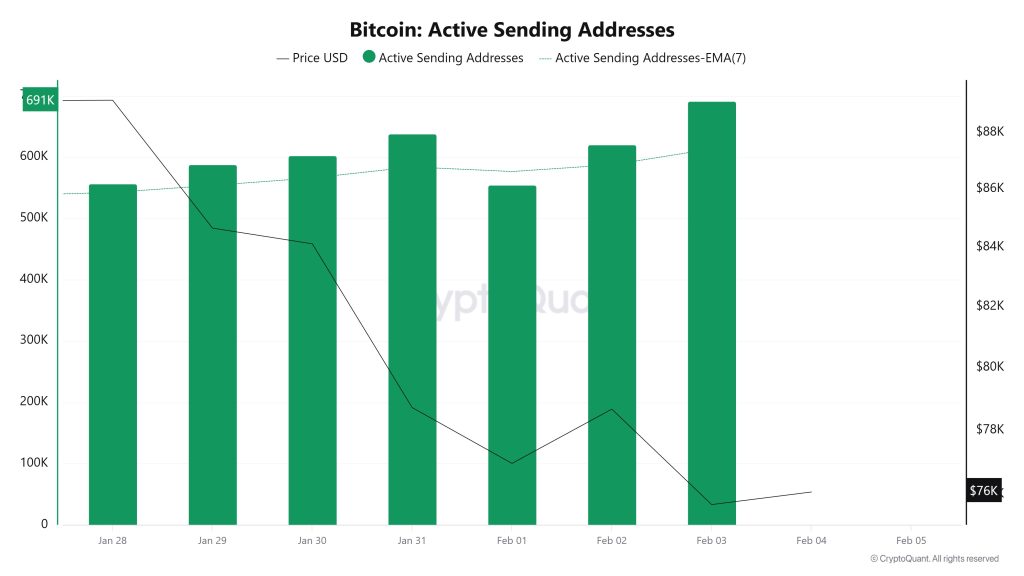
Between January 28 and February 4, an upward trend was observed in the active sending addresses metric. On the day the price reached its highest level, this metric stood at 691,289, indicating that user activity on the Bitcoin network was moving in parallel with the price. This data shows that the $75,000 level is supported not only by price but also by on-chain address activity. Overall, the Active Sending Addresses metric has been trending upward during this period.
Active Receiving Addresses
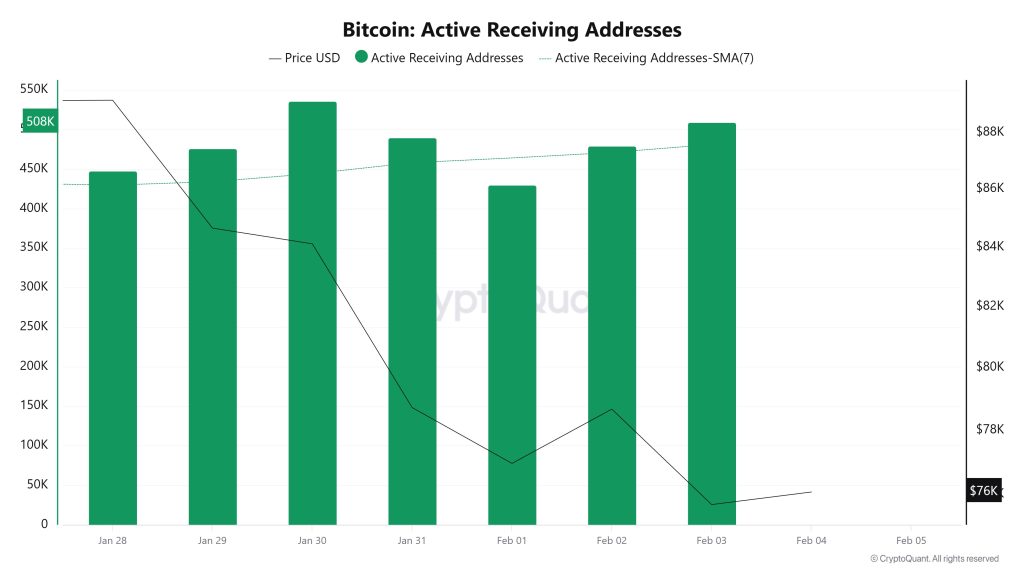
Between January 28 and February 4, active receiving addresses experienced a typical rise alongside the Black Line (price line). On the day the price reached its peak, active receiving addresses rose to 535,784 levels, indicating that buyers acquired Bitcoin at around the $76,000 level.
Breakdowns
MVRV
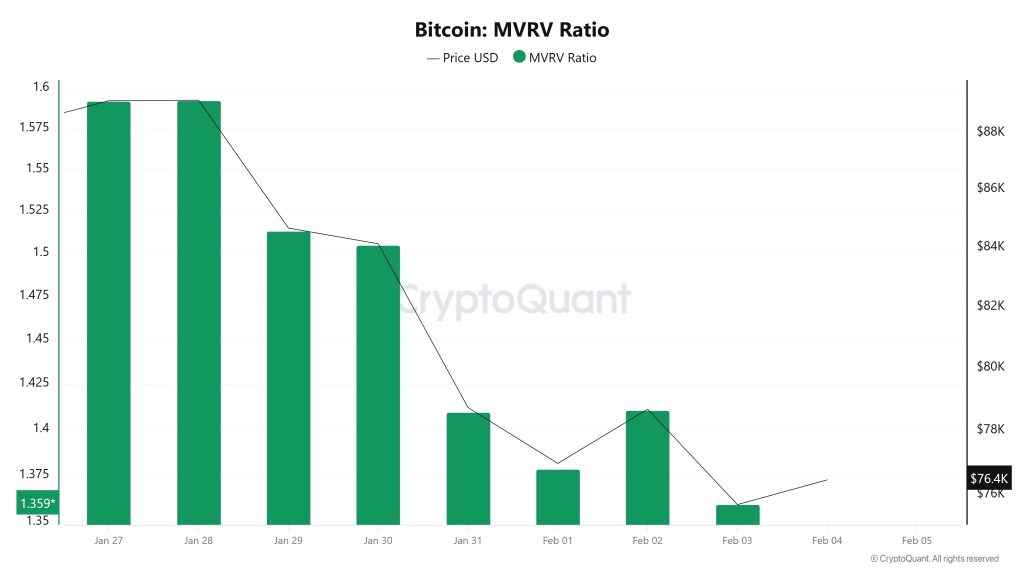
On January 28, while the Bitcoin price was trading at $89,163, the MVRV Ratio stood at 1.592. As of February 3, the Bitcoin price fell to $75,682, recording a 15.12% decline, while the MVRV Ratio fell to 1.359, recording a 14.64% decline. The sharp pullback in the MVRV Ratio indicates that the price premium relative to the realized cost basis is rapidly narrowing and unrealized profits in the market are significantly compressed. This outlook signals a weakening of risk appetite in the short term, and as price pressure persists, upward attempts may be met with greater caution, and a recovery may require stronger confirmation.
Realized Price
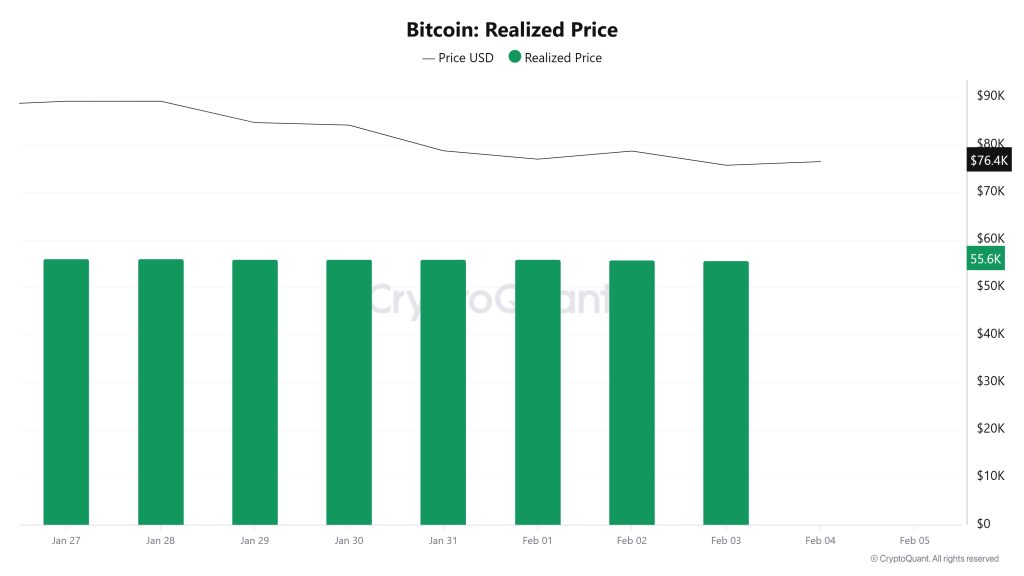
On January 28, while the Bitcoin price traded at $89,163, the Realized Price was at $55,987. As of February 3, the Bitcoin price fell to $75,682, recording a 15.12% decline, while the Realized Price fell to $55,686, recording a limited 0.54% decline. The slight pullback in the Realized Price signals a limited downward adjustment in the network’s average cost basis, confirming that the spot price’s premium over the cost basis has rapidly narrowed this week. This picture suggests that while spot pricing remains the main driver of the pullback, the cost basis has also begun to follow suit, albeit weakly.
Spent Output Profit Ratio (SOPR)
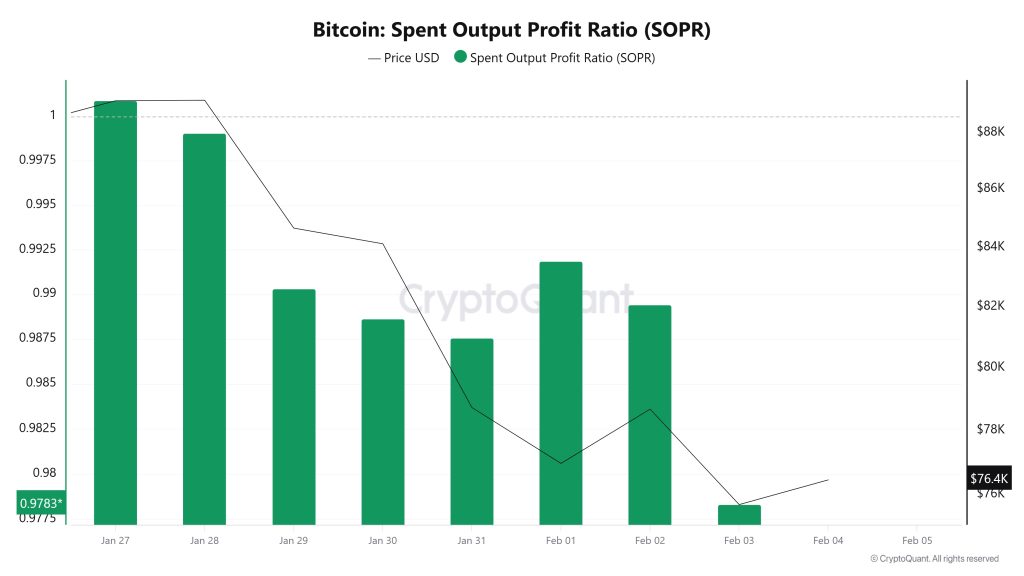 On January 28, while the Bitcoin price was trading at $89,163, the SOPR metric was at 0.999. As of February 3, the Bitcoin price fell to $75,682, recording a 15.12% decline, while the SOPR metric fell to 0.978, recording a 2.10% decline. The SOPR falling more clearly below the 1 level indicates that spent coins changed hands at an average loss and that sales were dominated by loss-making transactions rather than profitable exits. This situation may indicate that selling pressure has strengthened in the short term and that any potential recovery attempts may proceed on fragile ground.
Derivatives
Open Interest
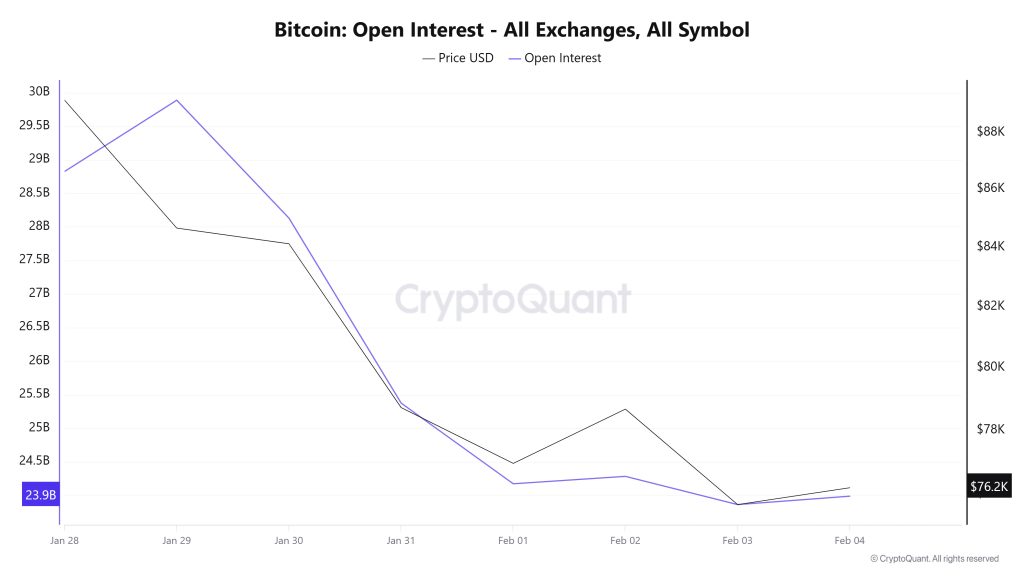
The BTC price experienced a sharp decline from last week until yesterday, falling from around $89,000 to $73,000. Similarly, open interest also experienced a sharp decline, falling from $30 billion to $23.9 billion. This indicates that traders have closed positions at a very high level and that risk aversion continues.
Funding Rate
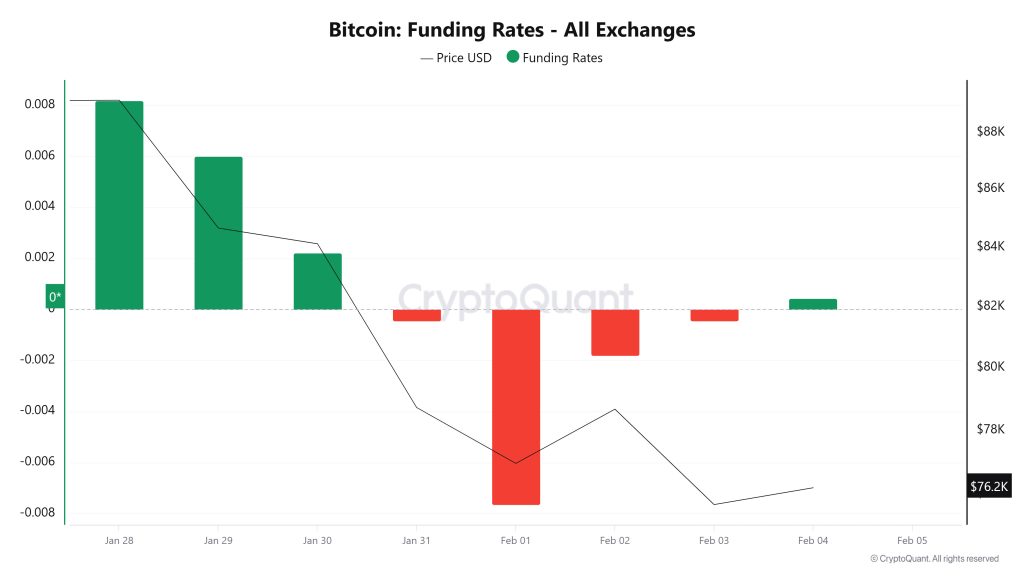
The funding rate started the week positive and relatively high, then gradually weakened. The funding rate turning negative around January 31–February 1 indicates that leveraged long positions were quickly closed and caution increased in the market. Although the funding rate has recovered towards zero in recent days, there is no strong appetite for long positions. In short, the structure indicates that the excessive long enthusiasm has dissipated and the market has shifted to a more balanced position.
Long & Short Liquidations
Last week, the BTC price fell sharply to below the $73,000 level. As a result, a total of $2.365 billion in long positions were liquidated, while $190 million in short positions were liquidated.
| Date | Long Amount (Million $) | Short Amount (Million $) |
|---|---|---|
| January 28 | 10.15 | 11.83 |
| January 29 | 524.66 | 7.85 |
| January 30 | 413.01 | 28.18 |
| January 31 | 570.21 | 28.79 |
| February 1 | 52.95 | 21.77 |
| February 2 | 274.99 | 55.01 |
| February 3 | 519.17 | 37.39 |
| Total | 2,365.14 | 190.82 |
Supply Distribution
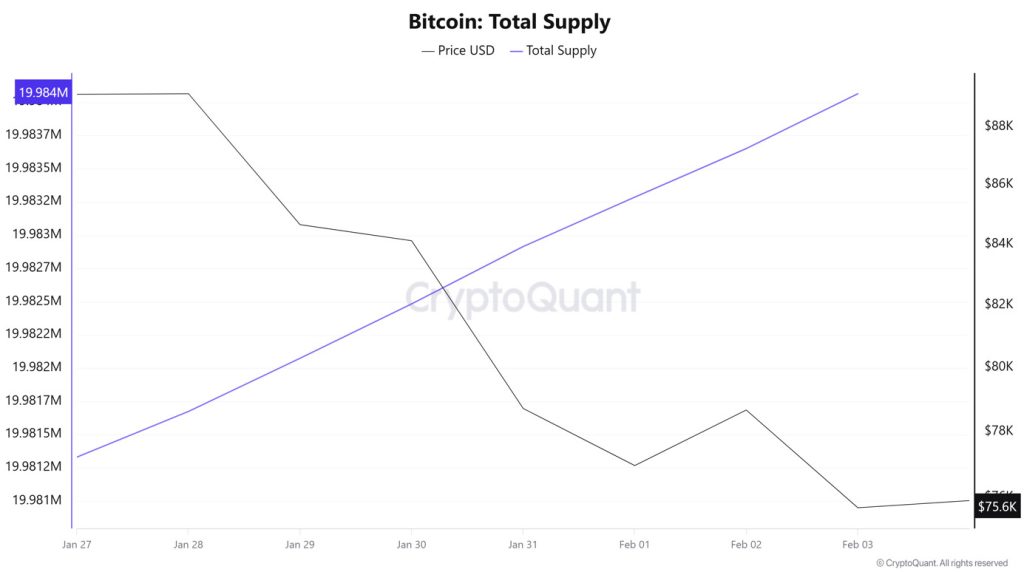
Total Supply: Reached 19,984,064 units, an increase of approximately 0.0137% compared to last week.
New Supply: The amount of BTC produced this week was 2,734.
Velocity: The velocity, which was 12.32 last week, reached 12.43 as of February 3.
| Wallet Category | 01/27/2025 | 03/02/2025 | Change (%) |
|---|---|---|---|
| < 1 BTC | 8.4592% | 8.4632% | 0.0040% |
| 1 – 10 BTC | 11.2931% | 11.2838% | -0.0093% |
| 10 – 100 BTC | 22.8814% | 22.9137% | 0.0323% |
| 100 – 1k BTC | 28.3403% | 28.2702% | -0.0701% |
| 1k – 10k BTC | 21.1791% | 21.1940% | 0.0149% |
| 10k+ BTC | 7.8465% | 7.8748% | 0.0283% |
The limited change in the <1 BTC and 1–10 BTC ranges indicates that retail investors remain cautious, while the increase in the 10–100 BTC range points to gradual accumulation. The decline in the 100–1,000 BTC group points to a medium-scale distribution, while the increase in the 1k–10k BTC and 10k+ BTC groups shows that concentration in large wallets continues.
Exchange Supply Ratio
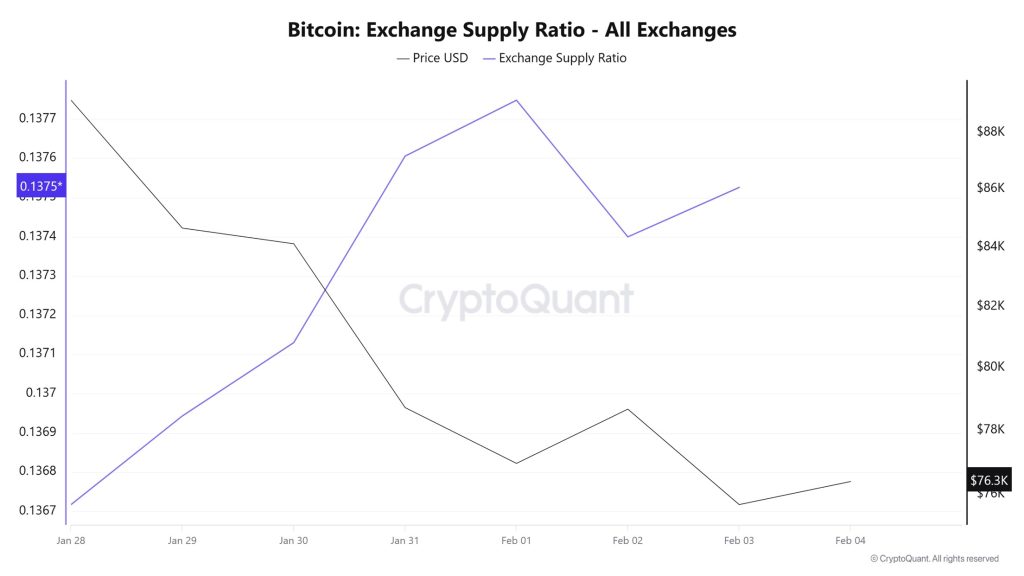
According to Bitcoin Exchange Supply Ratio data, a gradual decline in the Bitcoin supply ratio held on exchanges was observed throughout the week under review. This week, a positive correlation between the Bitcoin price and the supply ratio on exchanges was dominant. The decline in the Exchange Supply Ratio indicates that Bitcoins are being withdrawn from exchanges and held in cold wallets, limiting selling pressure in the short term. Between January 28 and February 4, the Bitcoin Exchange Supply Ratio declined slightly from approximately 0.1367176 to 0.1375259. During the same period, the Bitcoin price retreated from the $89,000 level to the $75,000 range.
The fact that both the price and the Exchange Supply Ratio moved downwards in the same direction during this period indicates that risk appetite among market participants has weakened and that new Bitcoin inflows into exchanges have remained limited.
Exchange Reserve
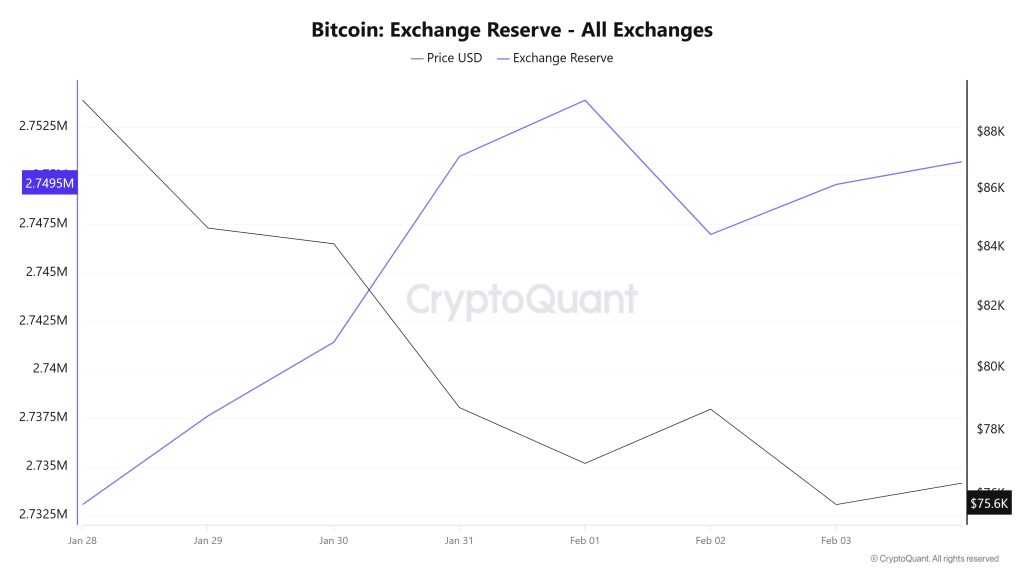
Between January 28 and February 3, 2026, Bitcoin reserves on exchanges rose from 2,733,752 BTC to 2,749,549 BTC, with a net inflow of 15,797 BTC. Exchange reserves increased by approximately 0.58%. During this period, the BTC price fell by 15.09%, dropping from $89,134 to $75,683. The sharp decline in the BTC price while Bitcoin reserves on exchanges increased showed that investors viewed the decline as an opportunity to sell and moved their BTC to exchanges during this period. The continued inflows, especially on days when the decline deepened, indicated that selling pressure was concentrated on the exchange side. It is likely that pressure on the price will continue in the short term and the volatile trend will persist.
| Date | 28-Jan | 29-Jan | 30-Jan | 31-Jan | 01-Feb | 02-Feb | 03-Feb |
|---|---|---|---|---|---|---|---|
| Exchange Inflow | 23,913 | 32,787 | 50,161 | 37,577 | 27,357 | 59,035 | 56,172 |
| Exchange Outflow | 24,598 | 28,215 | 46,372 | 28,018 | 24,460 | 65,945 | 53,597 |
| Exchange Netflow | -685 | 4,572 | 3,789 | 9,559 | 2,897 | -6,910 | 2,575 |
| Exchange Reserve | 2,733,752 | 2,737,639 | 2,741,428 | 2,750,987 | 2,753,884 | 2,746,974 | 2,749,549 |
| BTC Price | 89,134 | 84,659 | 84,122 | 78,719 | 76,957 | 78,668 | 75,683 |
Fees and Revenues
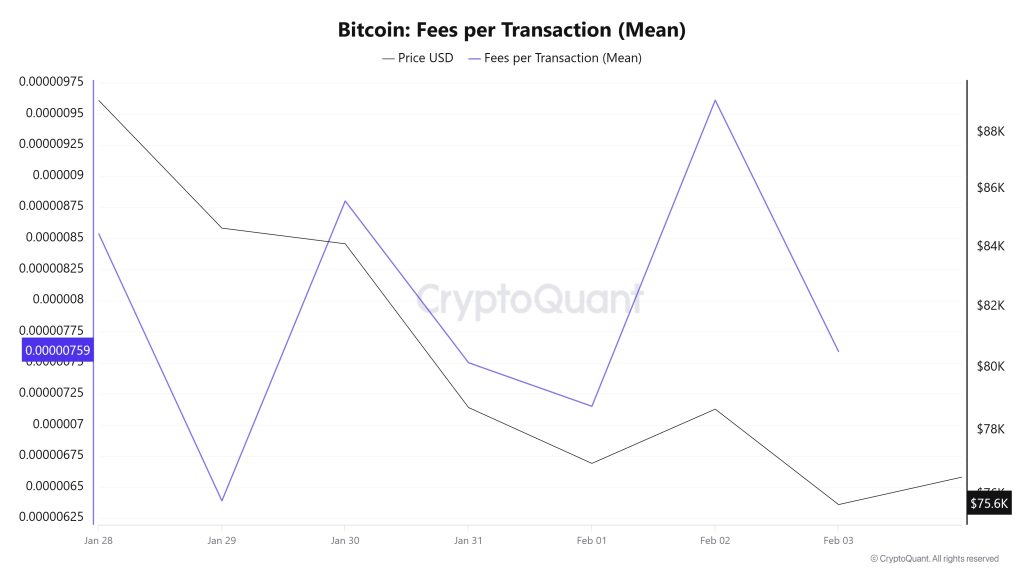
When examining the Bitcoin Fees per Transaction (Mean) data between January 28 and February 3, it is seen that on January 28, the first day of the week, the indicator reached 0.00000854.
A decline was observed until January 29, when the indicator recorded its lowest value of the week at 0.00000639.
In this context, as a result of the increase in Bitcoin price volatility as of January 29, the indicator regained momentum and followed a positive trend due to the impact of price volatility.
On February 3, the last day of the weekly period, the indicator closed the week at 0.00000759 .
Bitcoin: Fees (Total)
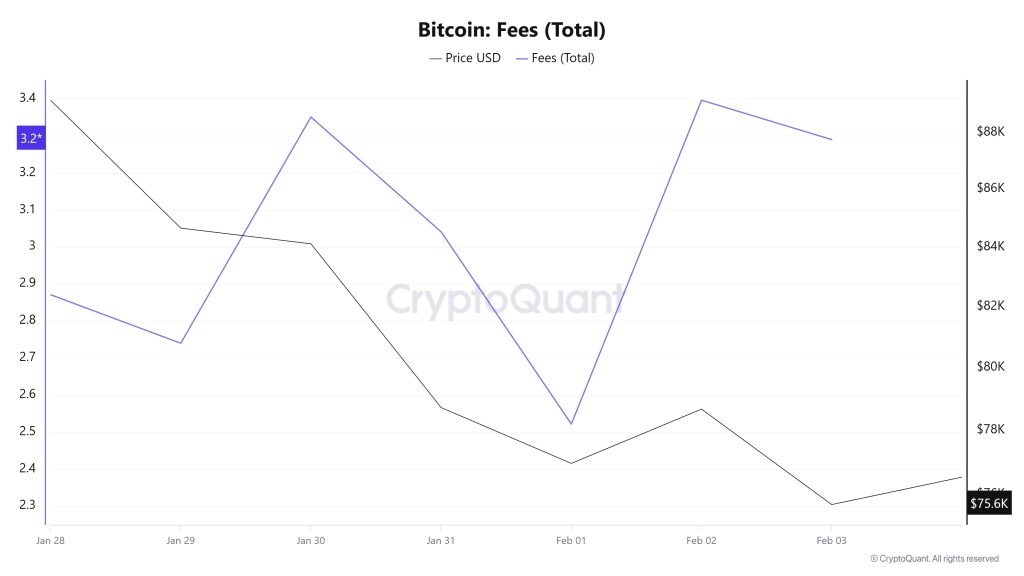
Similarly, when examining the Bitcoin Fees (Total) data for the period between January 28 and February 3 at , it is observed that the indicator reached 2.87090808 on January 28, the first day of the week.
A decline was observed until February 1, and on that date, the indicator recorded the week’s lowest value at 2.73977676.
In this context, as a result of the increase in Bitcoin price volatility as of February 1, the indicator regained momentum and followed a positive trend due to the impact of price volatility.
On February 3, the last day of the weekly period, the indicator closed the week at 3.28973653.
Miner Flows
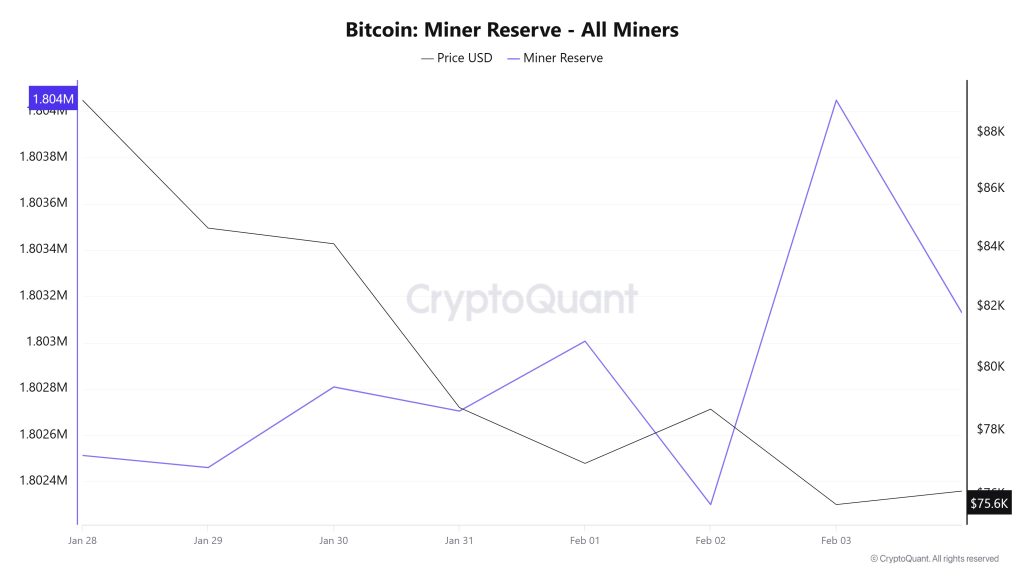
According to data obtained from the Miner Reserve table, an increase in the Bitcoin reserves held in miners’ wallets was observed this week. A time-dependent correlation structure between the Bitcoin price and miner reserve was observed during the period under review. However, the general trend shows that a negative correlation between these two variables is dominant.
Miner Inflow, Outflow, and Netflow
Between January 28 and February 3, 72,630 Bitcoin flowed out of miners’ wallets, while 74,203 Bitcoin flowed into miner wallets during the same period. This week’s Miner Netflow was 1,573 Bitcoin. Meanwhile, the Bitcoin price was $89,163 on January 28 and $75,682 on February 3.
Throughout the week, Bitcoin inflows into miner wallets (Miner Inflow) exceeded Bitcoin outflows from miner wallets (Miner Outflow), resulting in a positive net flow (Miner Netflow).
| Date | Jan. 28 | Jan. 29 | Jan. 30 | Jan. 31 | Feb. 01 | Feb. 02 | Feb. 03 |
|---|---|---|---|---|---|---|---|
| Miner Inflow | 6,457.27 | 9,385.36 | 9,847.56 | 9,984.36 | 10,619.99 | 11,033.37 | 16,874.82 |
| Miner Outflow | 6,420.15 | 9,439.62 | 9,497.18 | 10,088.57 | 10,317.94 | 11,739.65 | 15,127.04 |
| Miner Netflow | 37.12 | -54.26 | 350.38 | -104.21 | 302.06 | -706.29 | 1,747.78 |
Transaction
![]()
Last week, 2,483,019 transactions took place on the Bitcoin network, while this week the number of transactions rose to 3,052,468, recording an increase of approximately 23%. During this period, the highest daily transaction count was 433,533 on February 3, while the lowest transaction count was 335,985 on January 28.
When evaluating the transaction count alongside the price chart, the relationship between transfer amounts and price appears neutral due to the balanced distribution of positive and negative days. However, the overall downward trend in price during the period indicates that the total amount of BTC transferred, rather than the number of transactions, provides a more meaningful indicator for reading market dynamics.
Tokens Transferred
While a total of 5,325,042 BTC was transferred in the previous period, this week’s volume rose to 7,317,360 BTC, an increase of 37%. The highest daily transfer volume in the analyzed time frame was recorded on February 3 at 1,186,756 BTC, while the lowest daily volume was recorded on January 28 at 731,386 BTC. The correlation between the amount of BTC transferred and the price followed a predominantly negative trend throughout the period.
On the other hand, the higher proportional increase seen in the transaction count data, parallel to the increase in the total amount of Bitcoin transferred, indicates that the amount of BTC per transaction on the network has increased compared to the previous period. This indicates that higher-volume transactions gained prominence during the analyzed period.
When evaluating the overall structure, it can be said that Bitcoin usage on the network has increased significantly compared to the previous period, and active users have exhibited a more dynamic profile in terms of transaction sizes.
Whale Activities
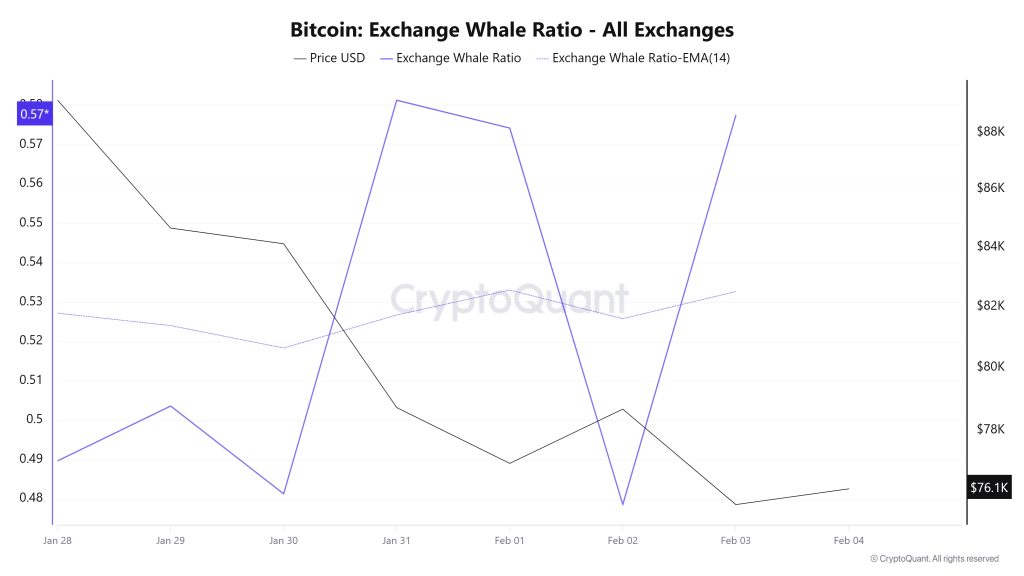
Whale Data:
Looking at whale activity on centralized exchanges over the last 7 days based on crypto market data, the metric followed a flat trajectory at the beginning of the period but experienced fluctuations for the remainder of the period. This indicated an increase in activity on these centralized exchanges. Looking at the Exchange Whale Ratio metric, on January 28, the first day of the 7-day period, the ratio of whales using centralized exchanges was 0.489. The lowest point of the process occurred on February 2, falling to 0.478. It reached its peak on January 31st, reaching a value of 0.581. When this ratio is above the 0.35-0.45 band, it generally means that whales are frequently using centralized exchanges. Currently, the metric is valued at 0.577, which is close to its peak. During this period, it traded in a wide range between $90,400 and $73,000. This signaled that whales were moving to offload BTC on centralized exchanges. At the same time, total BTC transfers decreased by approximately 2% compared to last week, with 4,826,567 BTC moving. The Bitcoin price fell below $75,000 for the first time since April 2025. Data shows that whales have sold 50,181 BTC recently. This represents approximately 68% of the circulating supply. The wave of sales increased volatility and raised concerns about liquidity. However, retail investors continued to buy during the decline. There is a clear difference between the activities of large and small wallets. As a result, while the largest whales are selling, relatively smaller whales are buying. This may mean that market sages could continue to sell in the metric.
BTC Onchain Overall
| Metric | Positive 📈 | Negative 📉 | Neutral ➖ |
|---|---|---|---|
| Active Addresses | ✓ | ||
| Breakdowns | ✓ | ||
| Derivatives | ✓ | ||
| Supply Distribution | ✓ | ||
| Exchange Supply Ratio | ✓ | ||
| Exchange Reserve | ✓ | ||
| Fees and Revenues | ✓ | ||
| Miner Flows | ✓ | ||
| Transaction | ✓ | ||
| Whale Activity | ✓ |
*The metrics and guidance provided in the table do not alone explain or imply any expectation regarding future price changes in any asset. The prices of digital assets can fluctuate based on numerous different variables. The on-chain analysis and related guidance are intended to assist investors in their decision-making process, and basing financial investments solely on the results of this analysis may lead to unfavorable outcomes. Even if all metrics simultaneously produce positive, negative, or neutral results, the expected outcomes may not materialize depending on market conditions. It would be beneficial for investors reviewing the report to take these warnings into consideration.
Legal Notice
The investment information, comments, and recommendations contained in this document do not constitute investment advisory services. Investment advisory services are provided by authorized institutions on a personal basis, taking into account the risk and return preferences of individuals. The comments and recommendations contained in this document are of a general nature. These recommendations may not be suitable for your financial situation and risk and return preferences. Therefore, making an investment decision based solely on the information contained in this document may not result in outcomes that align with your expectations.
NOTE: All data used in Bitcoin on-chain analysis is based on CryptoQuant.
