
Active Addresses
Active Receiving Addresses
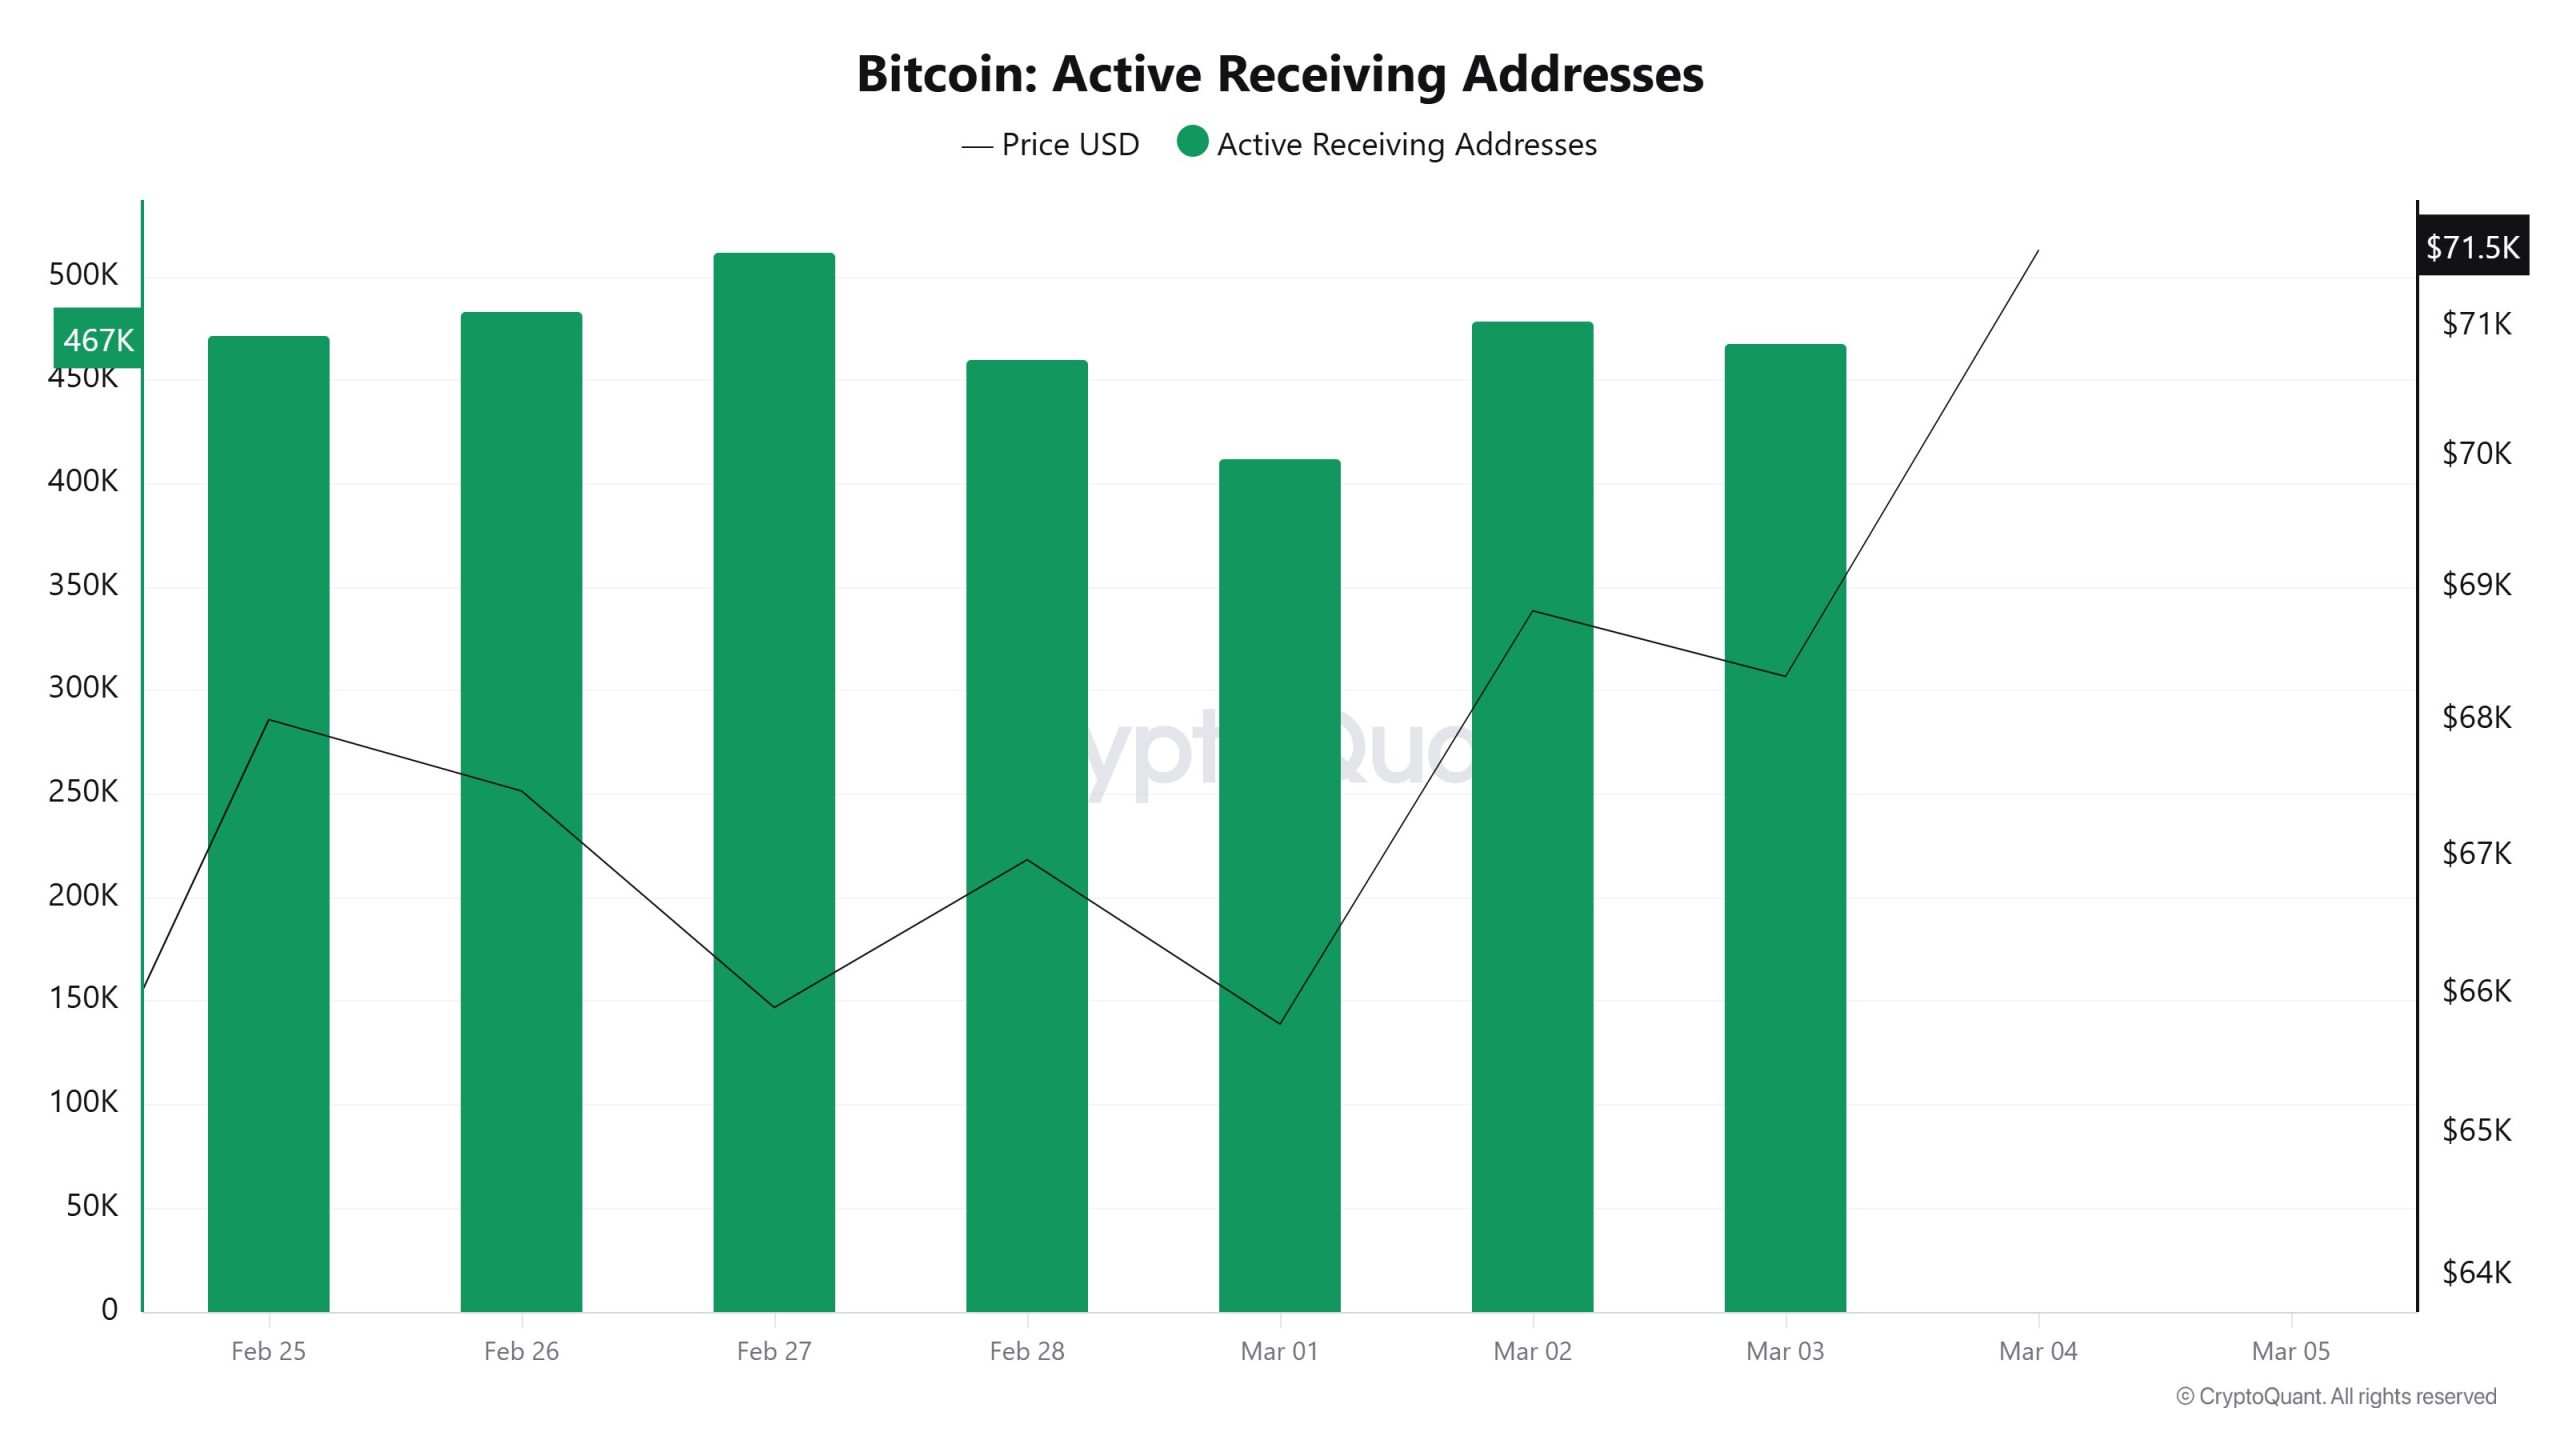
During the week of February 25 to March 3, the number of active buyer addresses on the Bitcoin network showed a generally volatile but balanced picture. Starting at around 467,000 at the beginning of the week, the metric rose to around 510,000 on February 27, reaching its highest level for the week. It then fell back to around 410,000 on March 1, showing a brief weakening. Its recovery to around 470,000 toward the end of the week indicates that demand on the network has not completely disappeared. Overall, there is no strong expansion in receiving addresses, but network activity continues in a healthy manner.
Active Sending Addresses
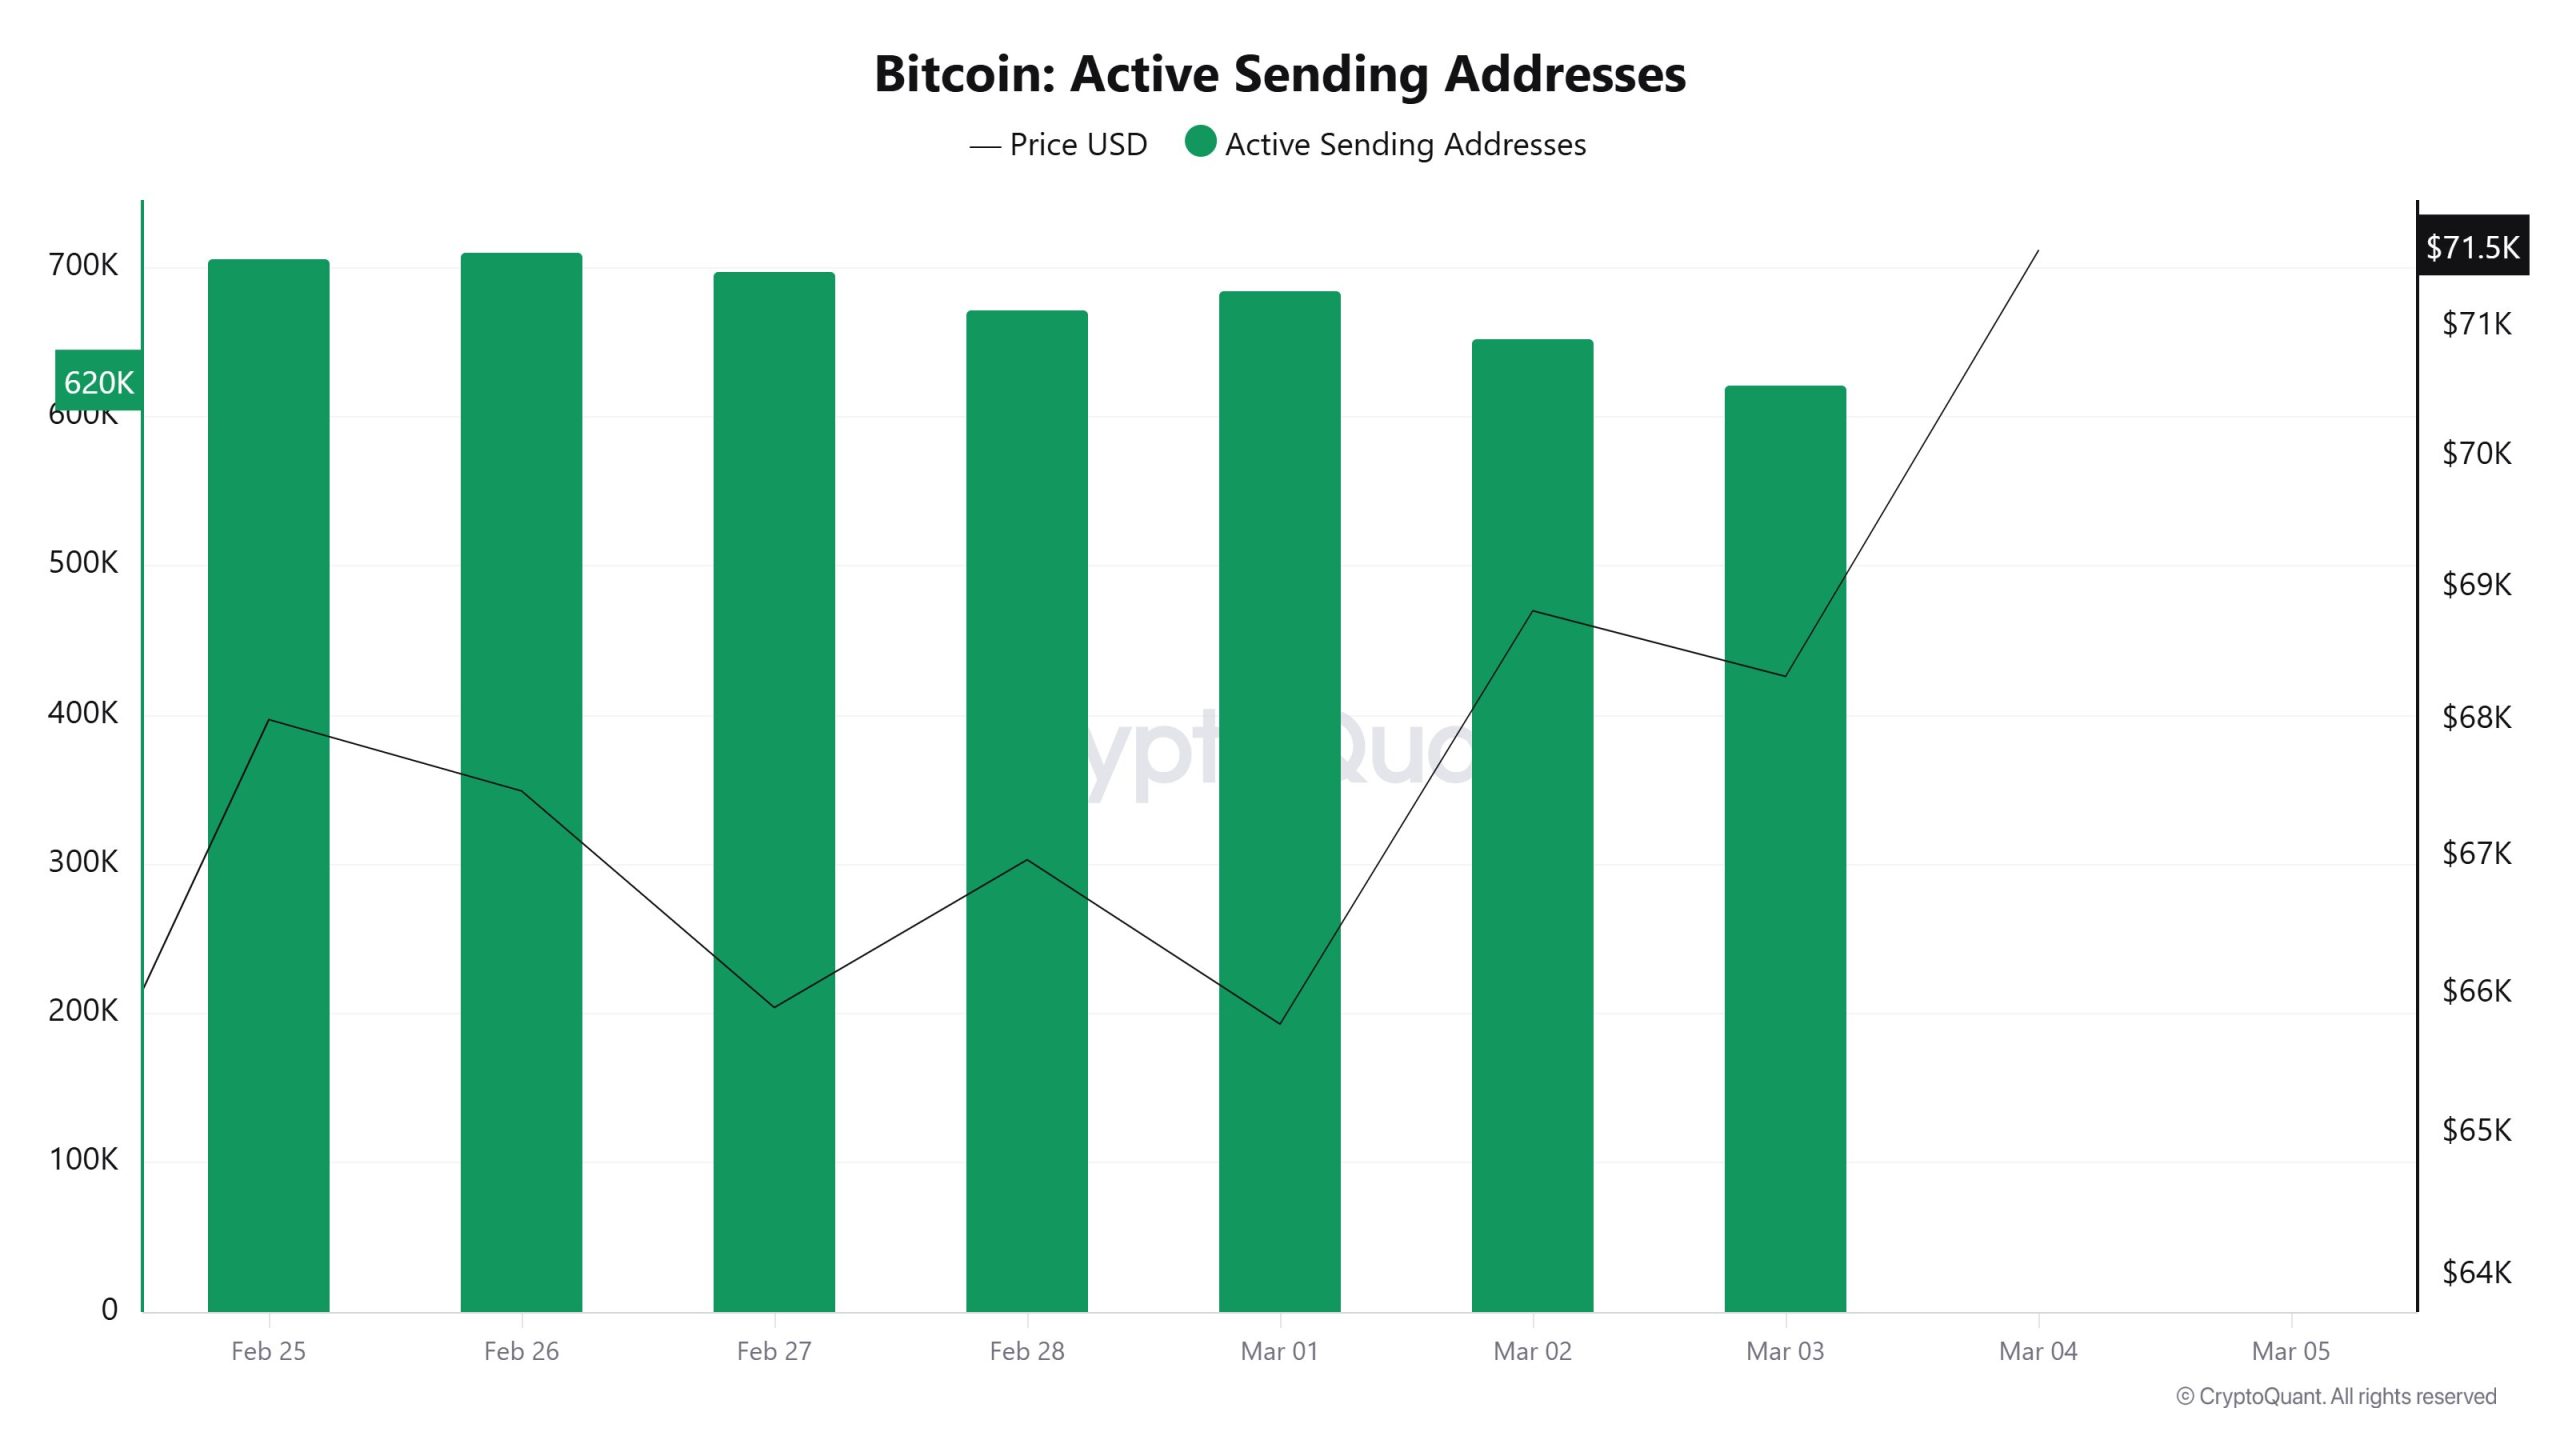
During the same period, the number of active sender addresses showed a gradual decline throughout the week, starting at over 700,000 at the beginning of the week. The metric peaked at approximately 705,000 on February 26 and declined to 620,000 by March 3. This decline in sender addresses suggests that sales or transfer activity on the network has decreased somewhat. This indicates that investors may be inclined to maintain their positions rather than sell in the short term.
Breakdowns
MRVR
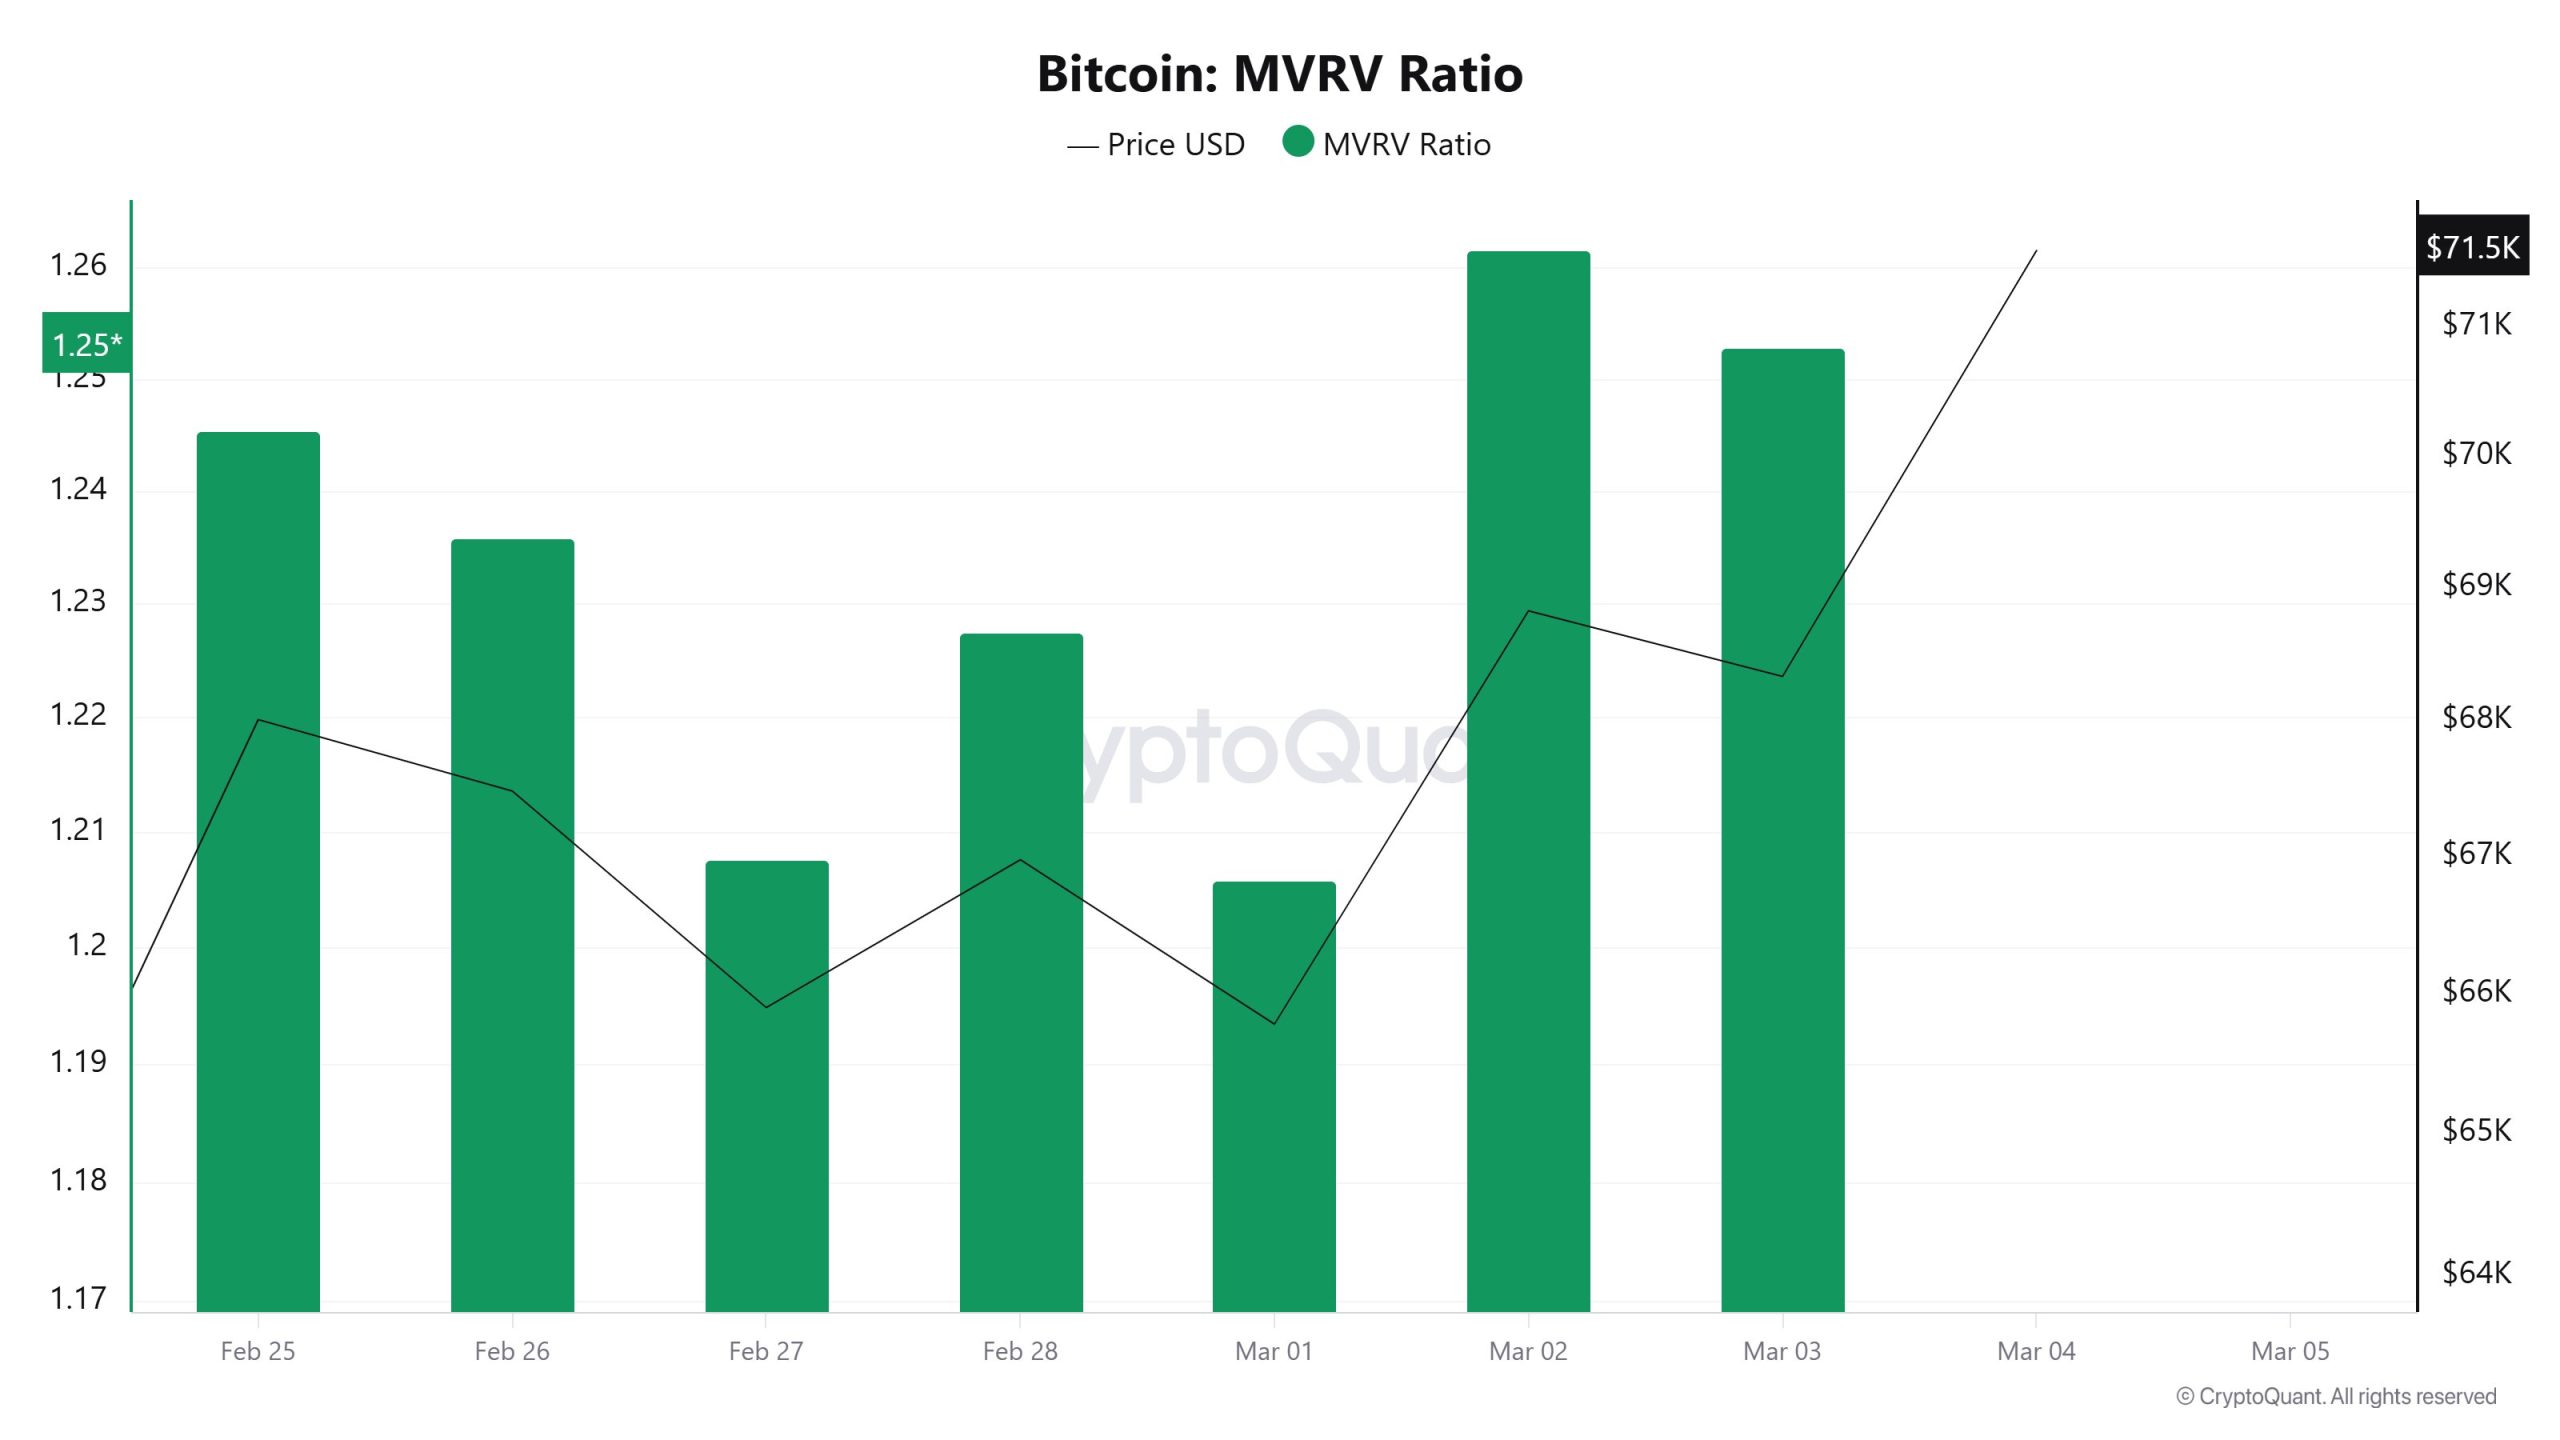
The MVRV Ratio showed a slight decline in the first part of the week before rising again. The metric, which was around 1.24 at the beginning of the week, fell to around 1.20 levels on February 27. In the second half of the week, with the price recovering, the MVRV rose again to around 1.26 levels and ended the week at around 1.25. This table shows that investors are generally still in profit, but the market has not yet entered the excessive profit zone.
Spent Output Profit Ratio (SOPR)
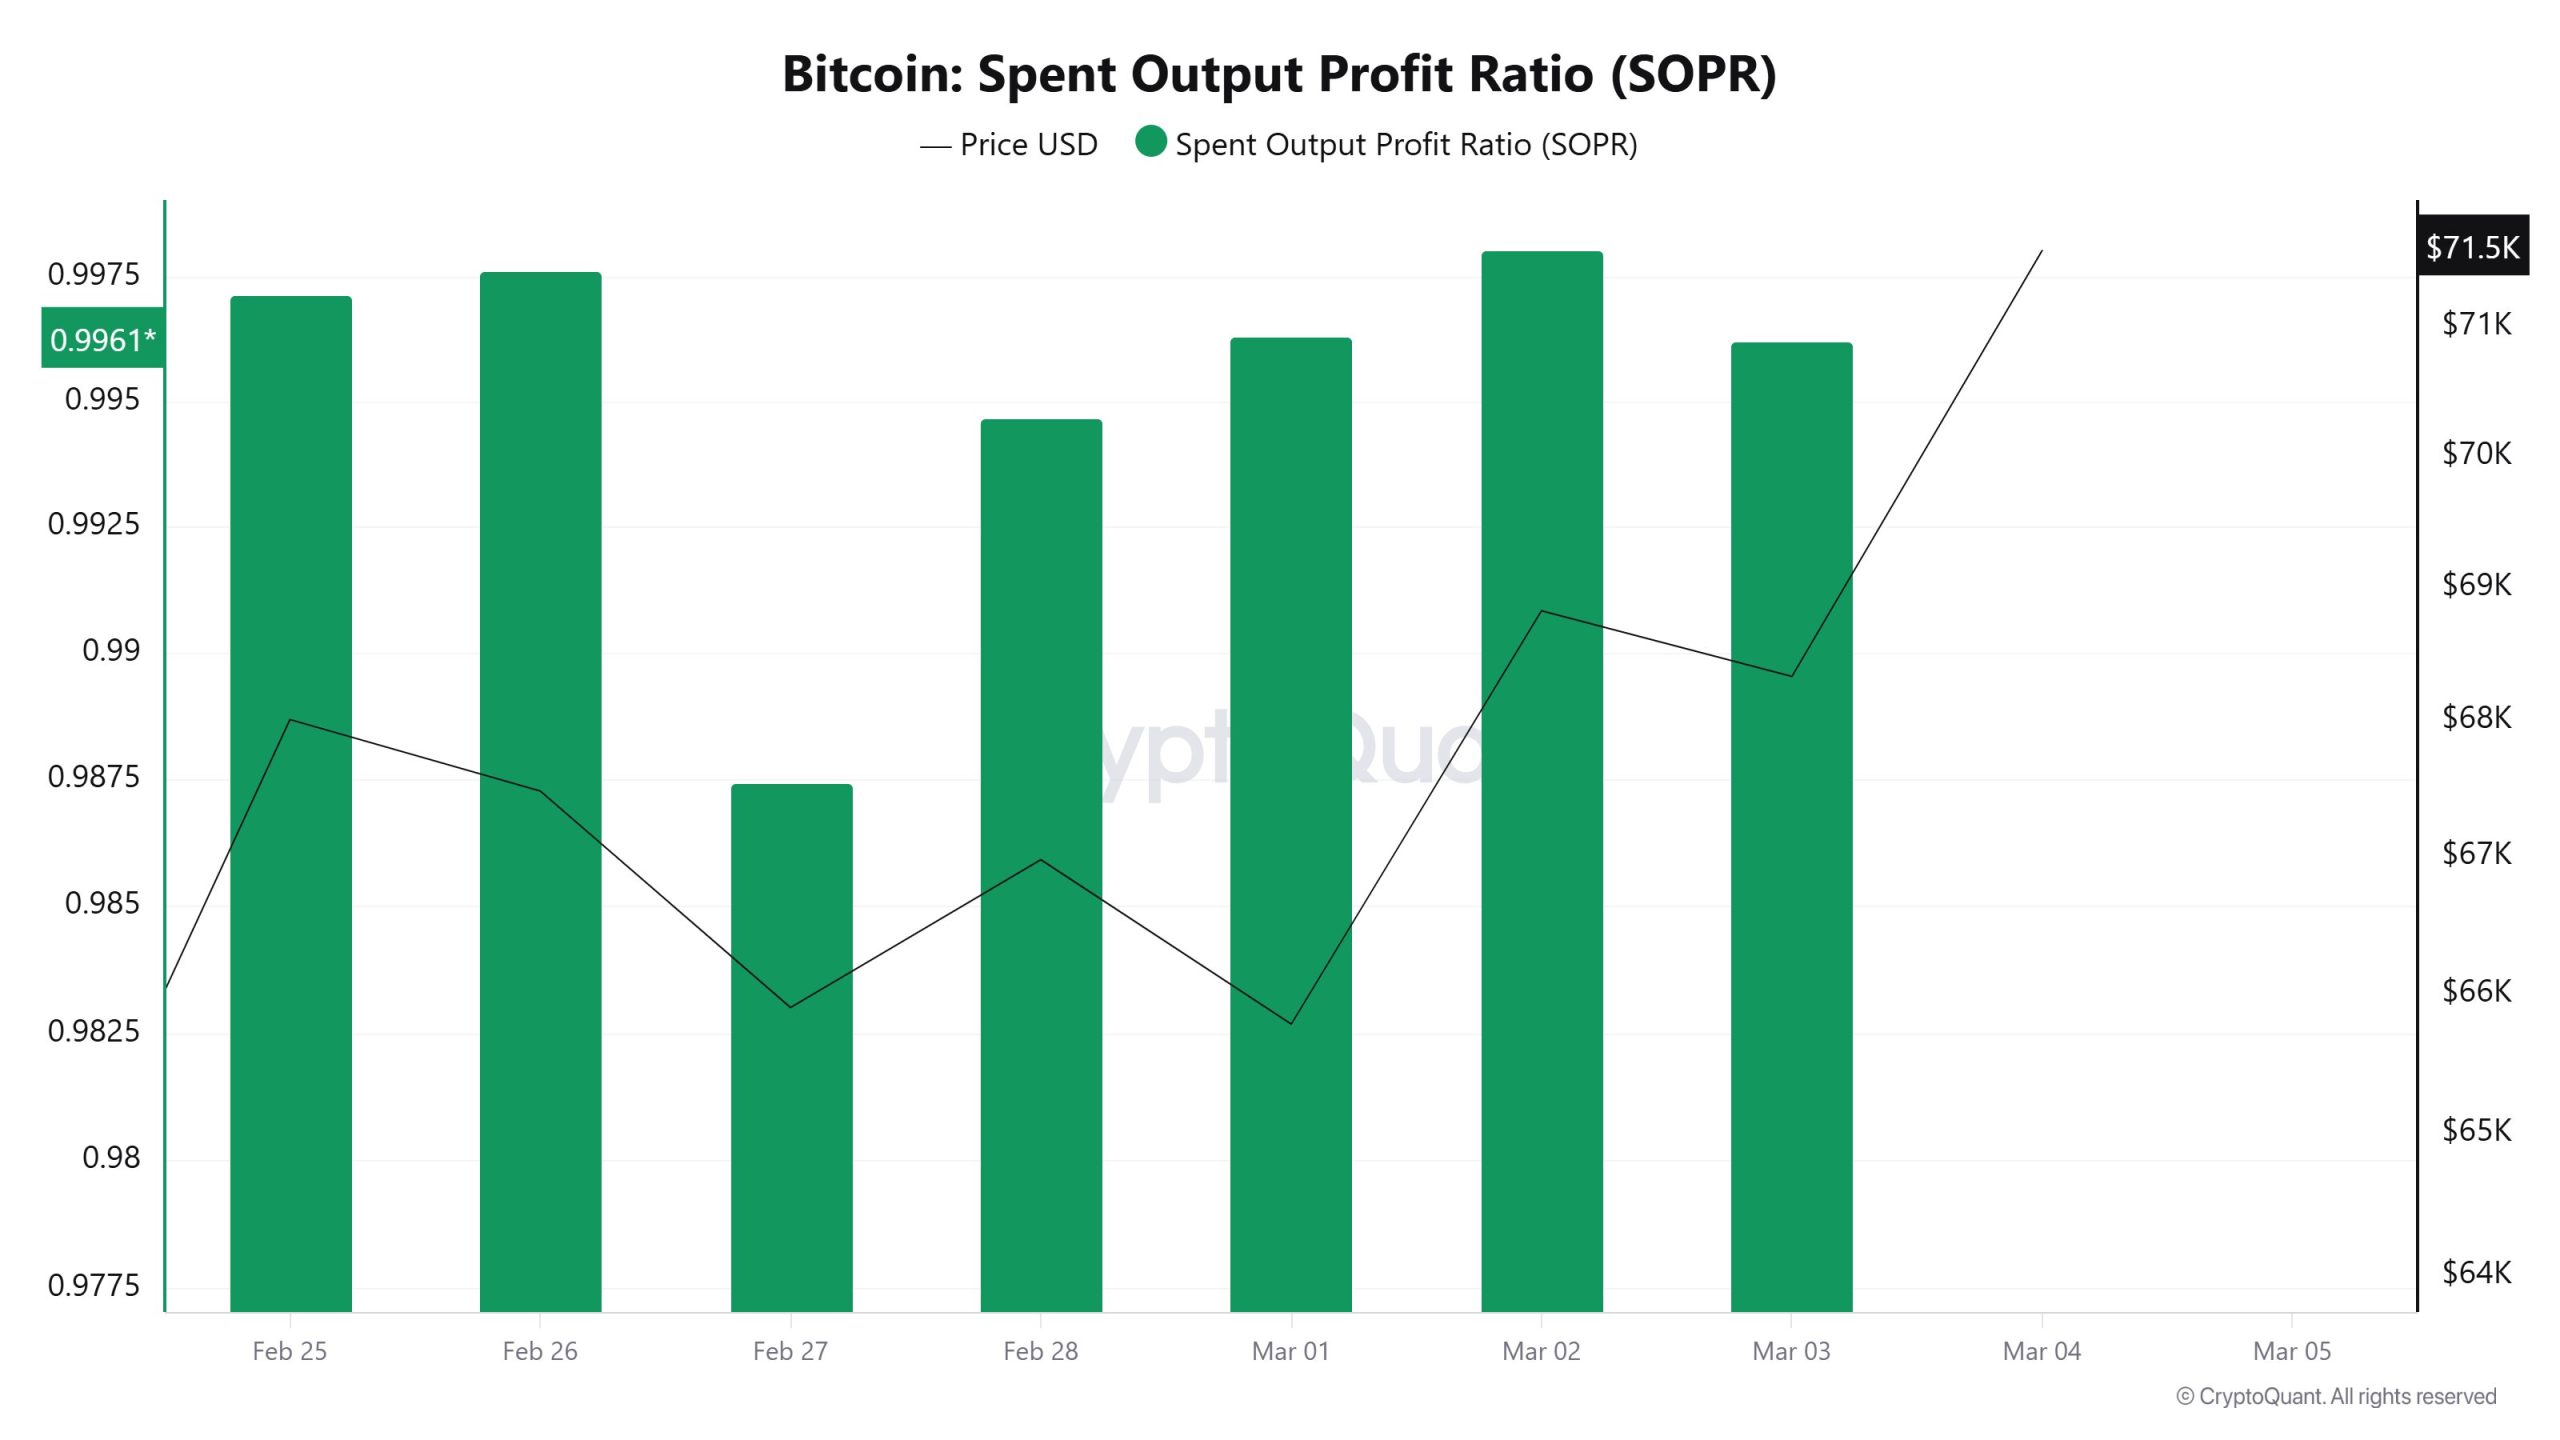
The Spent Output Profit Ratio (SOPR) remained mostly just below the 1 level throughout the week. Starting at around 0.996 at the beginning of the week, the metric fell to 0.983 on some days. This indicates that coins transferred on the network changed hands at an average small loss. The fact that SOPR approached the 1 level again later in the week suggests that selling pressure weakened and the market began to stabilize.
Derivatives
Open Interest
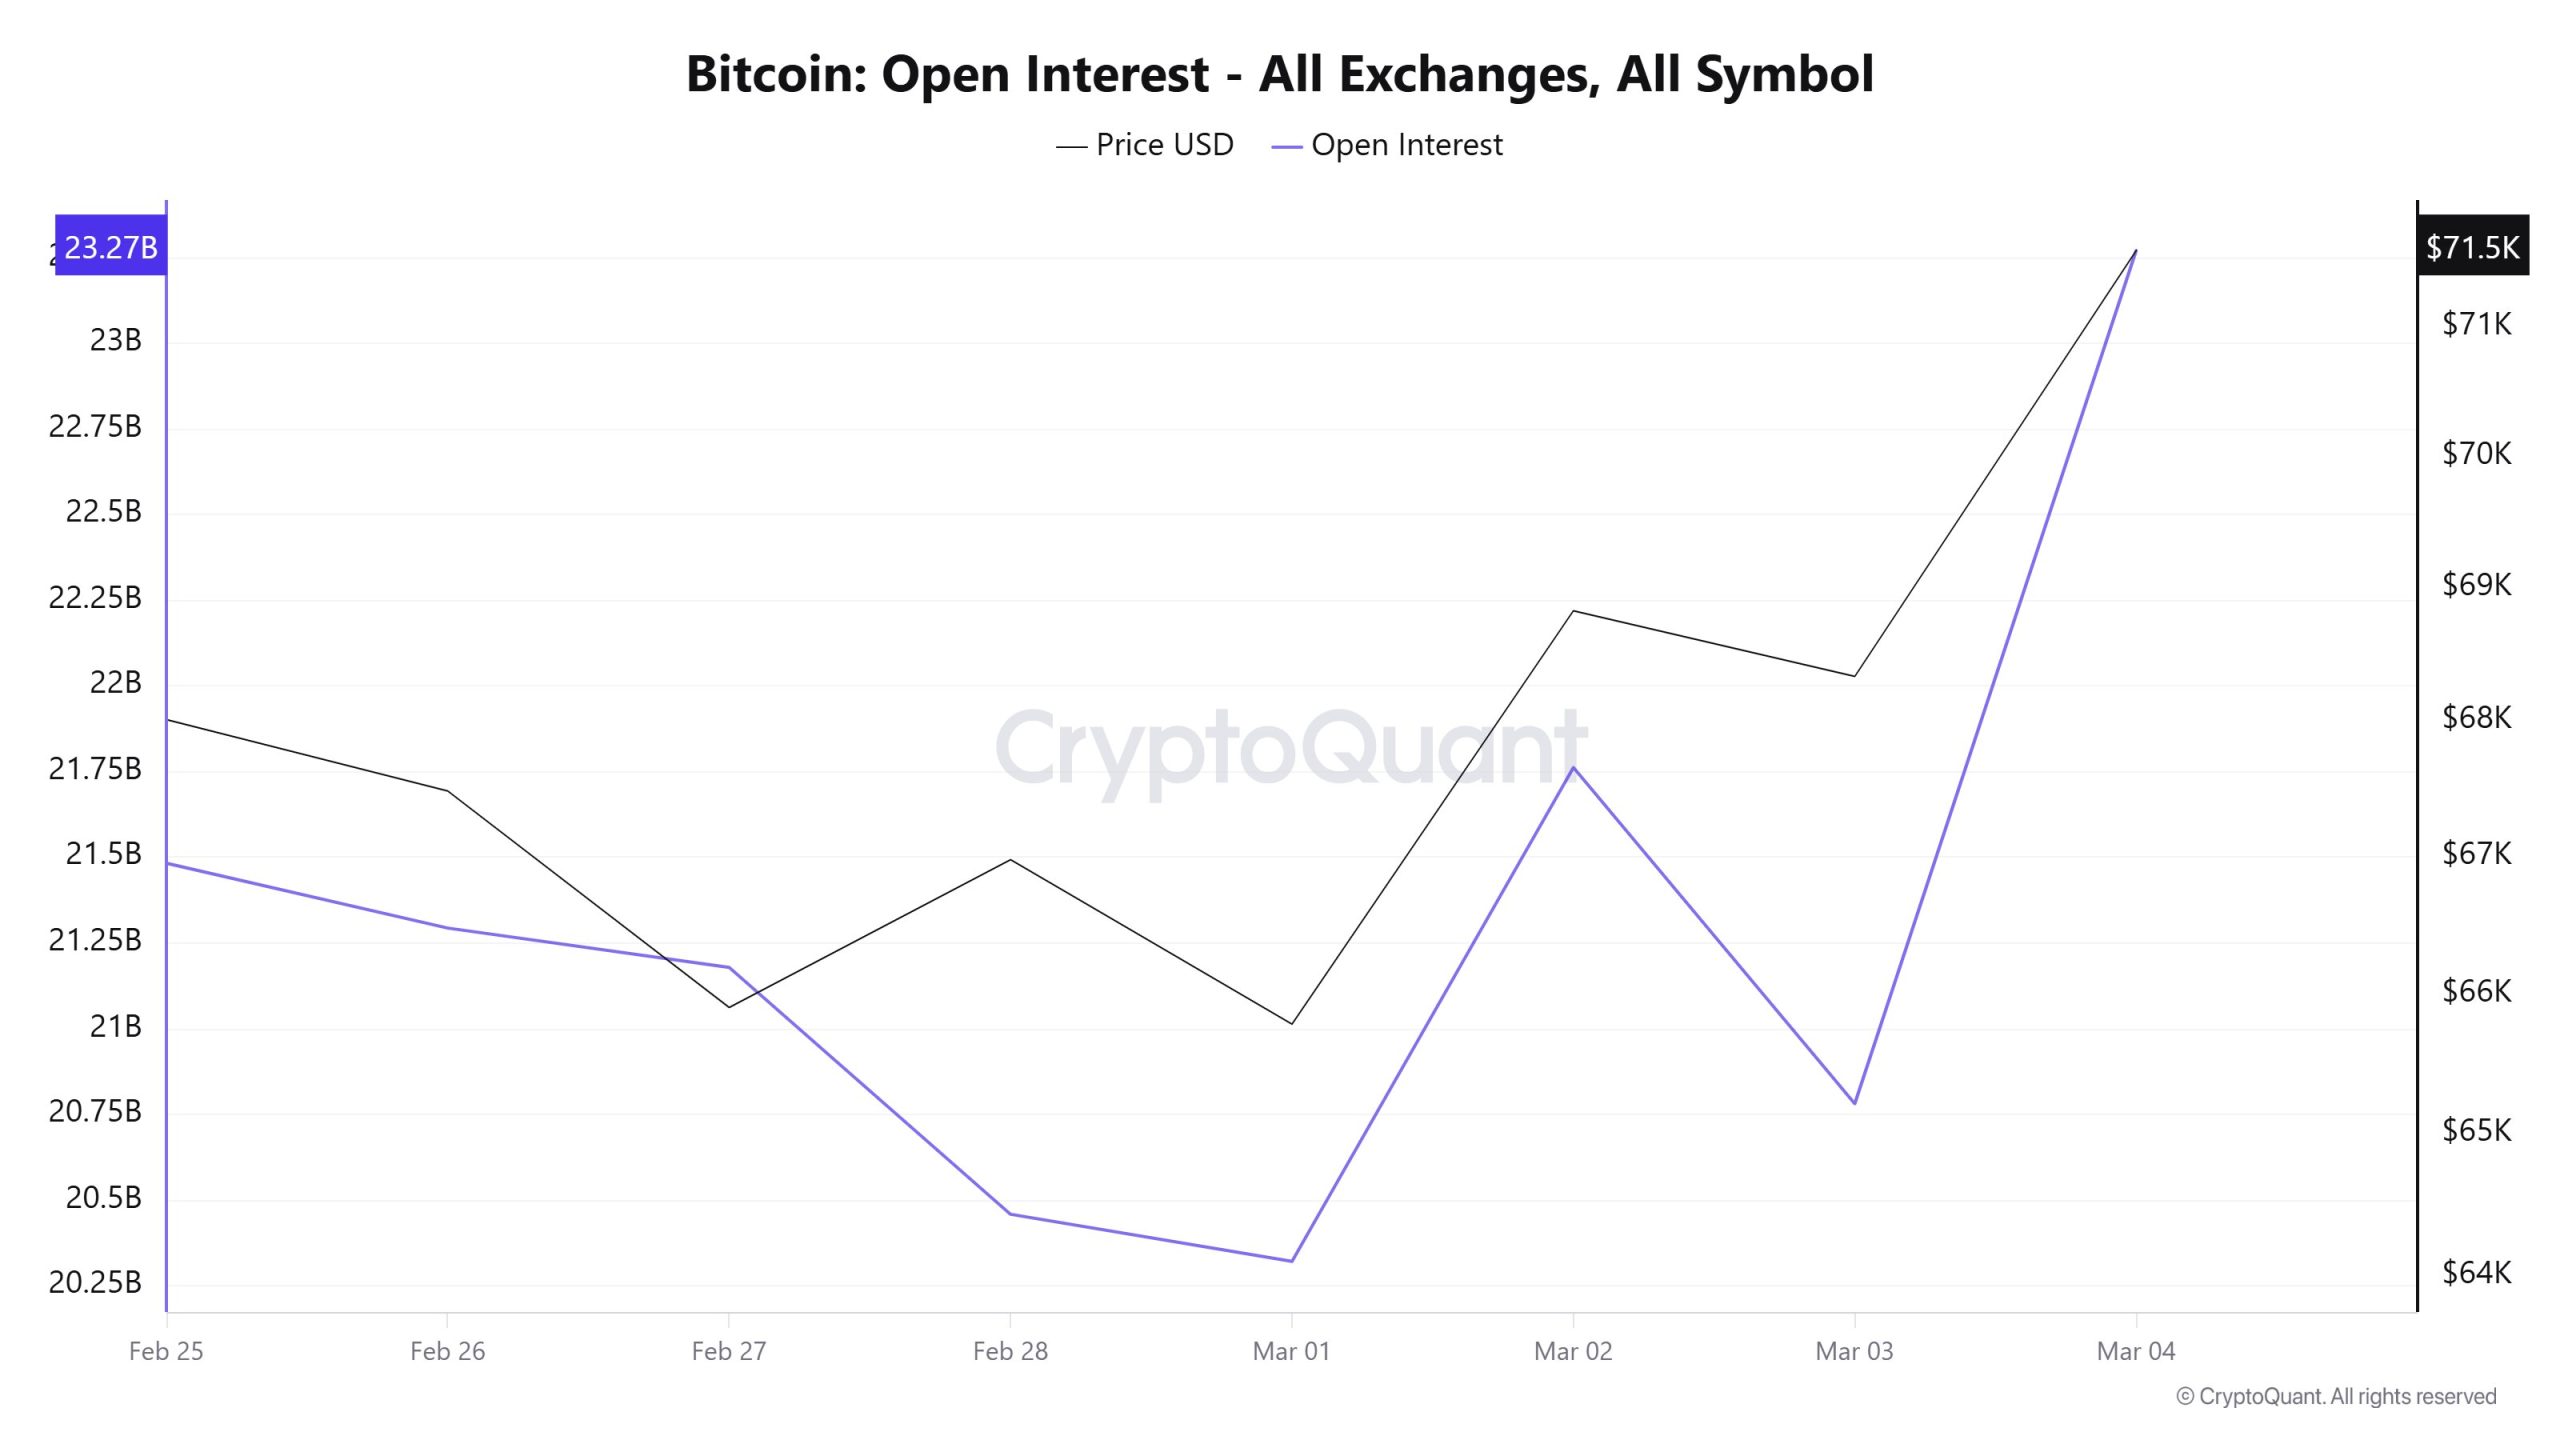
Open Interest data showed a decline in the first part of the week, followed by a strong recovery. The metric, which stood at around $21.4 billion on February 25, fell to around $20.3 billion by March 1. However, there was a rapid increase in the second half of the week, and Open Interest rose above $23 billion by March 4. This increase indicates that new positions are entering the derivatives market as prices rise.
Funding Rate
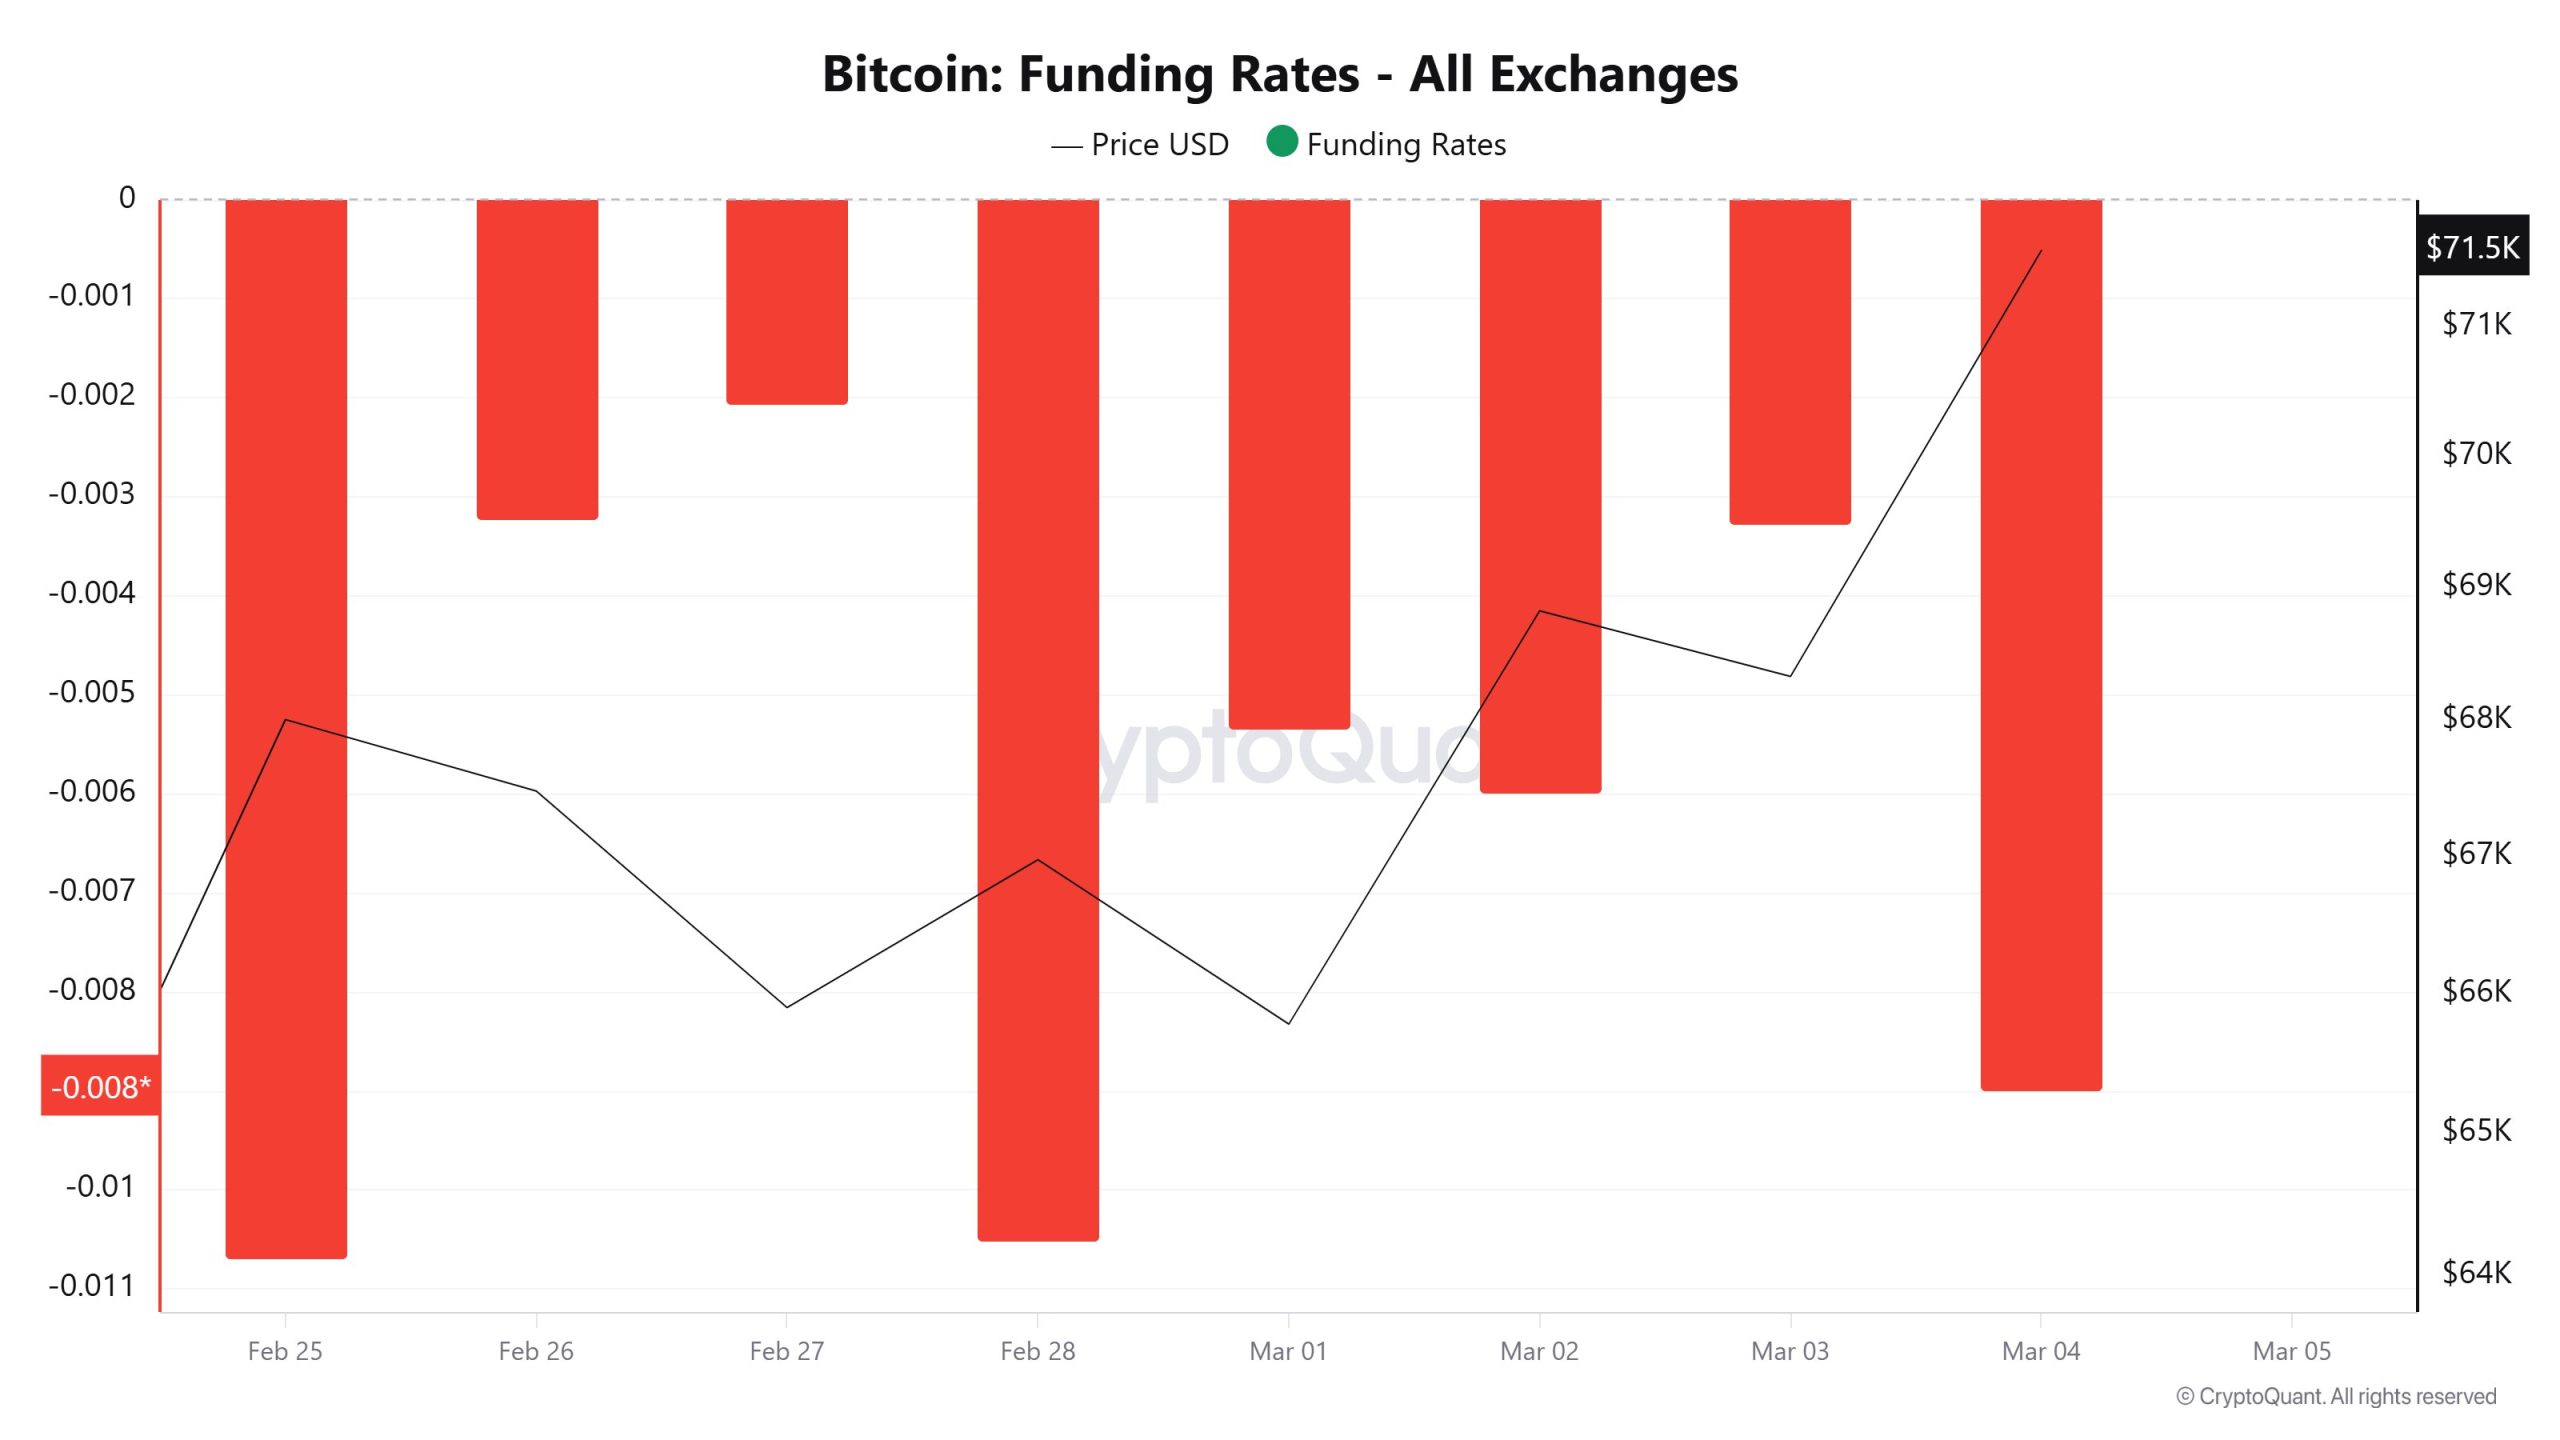
Funding rate data remained mostly in negative territory throughout the week. The metric, which fell to around -0.011 at the beginning of the week, then fluctuated between -0.003 and -0.006, ending the week at around -0.008. A negative funding rate indicates that short positions are more dominant in the market. This situation also creates a structure that could increase the likelihood of a short squeeze during price increases.
Long & Short Liquidations
Last week, the BTC price rose from $64,000 to $70,000. However, while $982 million worth of long positions were liquidated, $1 billion worth of short positions were liquidated.
| Date | Long Amount (Million $) | Short Amount (Million $) |
|---|---|---|
| February 25 | 426.63 | 440.35 |
| February 26 | 44.13 | 24.35 |
| February 27 | 61.86 | 17.68 |
| February 28 | 109.99 | 203.47 |
| March 1 | 54.27 | 66.29 |
| March 02 | 229.14 | 131.67 |
| March 3 | 56.20 | 121.53 |
| Total | 982.22 | 1,005.34 |
Exchange Supply Ratio
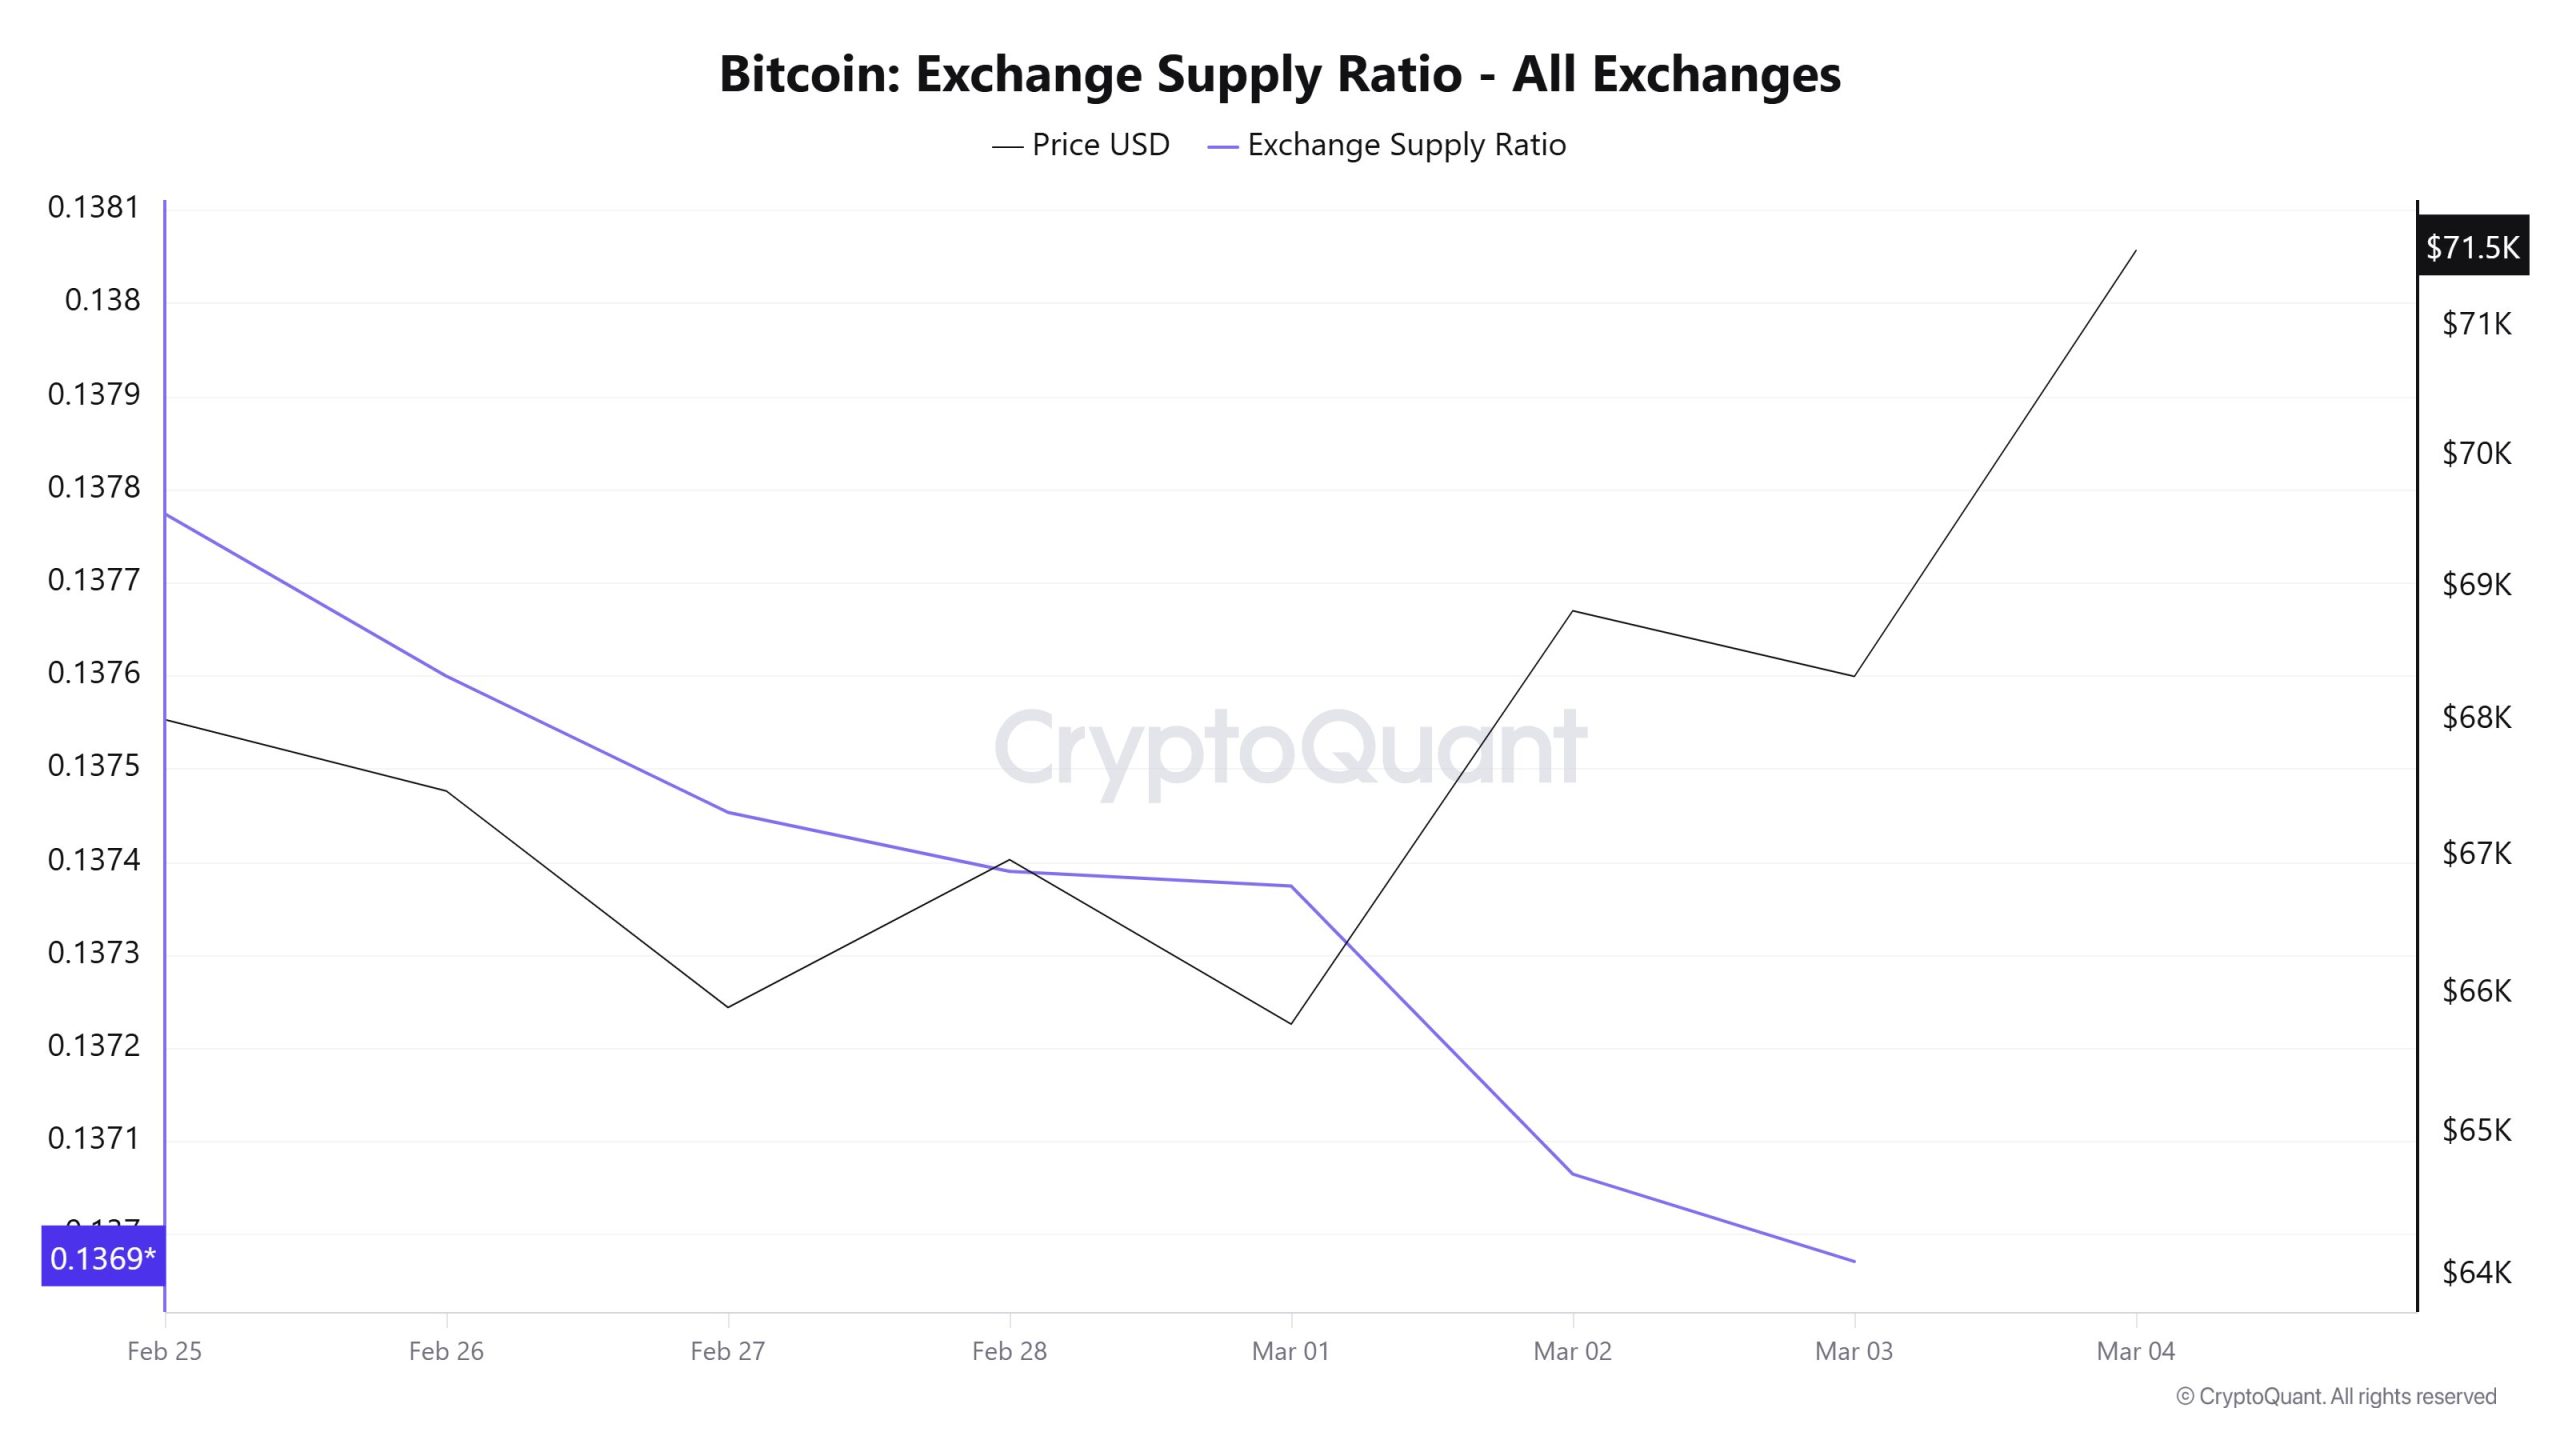
The Exchange Supply Ratio data moved downward throughout the week. The metric, which stood at approximately 0.1377 on February 25, fell to around 0.1369 as of March 3. This decline indicates that a smaller portion of the Bitcoin supply in the market is being held on exchanges. In other words, investors are withdrawing their coins to their own wallets rather than holding them on exchanges. This development can be seen as a sign that selling pressure may remain limited.
BTC On-Chain Overview
| Metric | Positive 📈 | Negative 📉 | Neutral ➖ |
|---|---|---|---|
| Active Addresses | ✓ | ||
| Breakdowns | ✓ | ||
| Derivatives | ✓ | ||
| Exchange Supply Ratio | ✓ |
* The metrics and guidance provided in the table do not alone explain or imply any expectation of future price changes for any asset. Digital asset prices can fluctuate based on many different variables. The on-chain analysis and related guidance are intended to assist investors in their decision-making process, and basing financial investments solely on the results of this analysis may lead to unfavorable outcomes. Even if all metrics produce positive, negative, or neutral results simultaneously, the expected outcomes may not materialize depending on market conditions. It would be beneficial for investors reviewing the report to take these warnings into consideration.
Legal Notice
The investment information, comments, and recommendations contained in this document do not constitute investment advisory services. Investment advisory services are provided by authorized institutions on a personal basis, taking into account the risk and return preferences of individuals. The comments and recommendations contained in this document are of a general nature. These recommendations may not be suitable for your financial situation and risk and return preferences. Therefore, making an investment decision based solely on the information contained in this document may not result in outcomes that align with your expectations.
NOTE: All data used in Bitcoin on-chain analysis is based on CryptoQuant.
