Technical Analysis – January 9, 2026 – Evening
BTC/USDT
The non-farm payroll data released in the US falling below expectations highlighted signs of a slowdown in the labor market and reinforced expectations that the Fed will pursue a more cautious policy in the short term. On the crypto side, Ripple’s approval by the UK’s FCA drew attention in terms of regulatory compliance and institutional expansion.
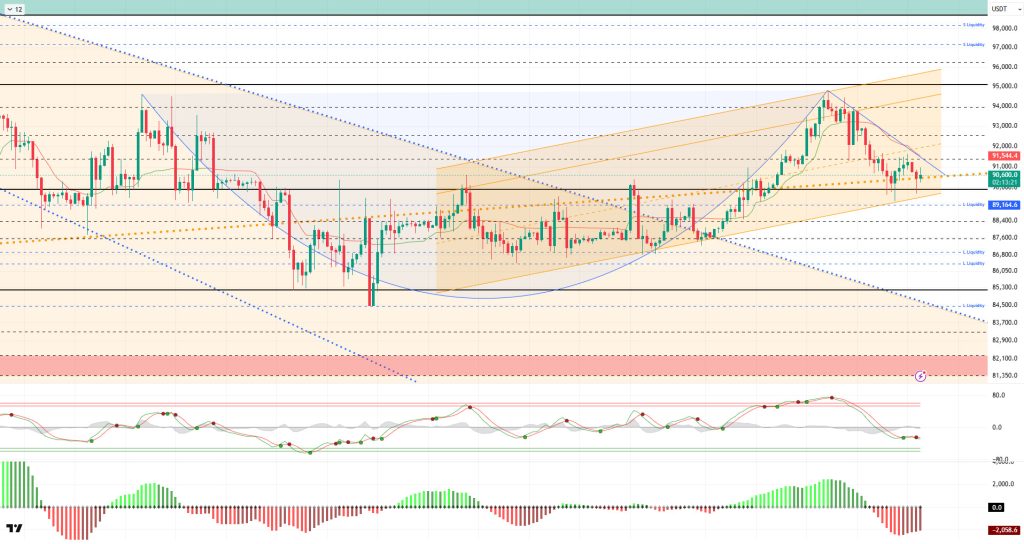
From a technical perspective, BTC spiked below the 90,000 mark once again, which has long served as a reference point for both support and resistance breakouts. Here, the price, which bought liquidity, quickly recovered and first crossed above the major uptrend line. The cup-and-handle and flag continuation patterns it formed became invalid due to the deep correction in price. Accordingly, a minor downtrend channel formed in BTC, and a breakout above the 91,400 resistance level, where the uptrend channel breakout line passes, is possible. Otherwise, selling pressure could cause us to lose the 90,000 level again.
Technical indicators show that the Wave Trend (WT) oscillator has turned its buy signal, given just above the oversold zone, into a sell signal. The histogram on the Squeeze Momentum (SM) indicator is losing momentum in the negative zone. The Kaufman Moving Average (KAMA) is currently trading above the price at the $91,556 level.
Looking at liquidation data, buy-side transactions are being liquidated in the short term at the 89,000 – 90,000 level, while accumulation continues in the long term at the 86,000 – 87,000 level. In contrast, selling levels are accumulating again in the short term in the 92,000 – 95,000 band, while in the monthly time frame, intense selling clusters continue above the 97,000 level.
In summary, developments in the US economy, politics, and elections present a busy agenda. The announced macro data set did not provide the Fed with a reason to cut interest rates. The Trump administration, which is said to have taken a partial step back on Venezuela sanctions, is showing its power in the region. President Trump, who has adopted a populist approach in domestic politics ahead of the midterm elections, is making unusual offers to Greenland in foreign policy. Meanwhile, the protests in Iran and the BoJ interest rate path are other developments dominating the agenda. Looking at liquidation data, short-term sales followed by purchases were targeted. Long-term transactions are still accumulating, as no clear directional breakout has been determined yet. Technically, BTC started the new year with positive momentum, continuing its parallel movement with the upward channel and rising to the 94,800 level. With profit-taking from this point, the price retreated to the 89,300 region. In the next phase, 91,400 stands out as a critical resistance area, and if this level is broken, a breakout of the short-term minor downtrend will follow. Otherwise, whether it holds above the 90,000 reference area will be decisive.
Supports: 90,000 – 89,000 – 88,000
Resistances: 91,400 – 92,600 – 94,000
ETH/USDT
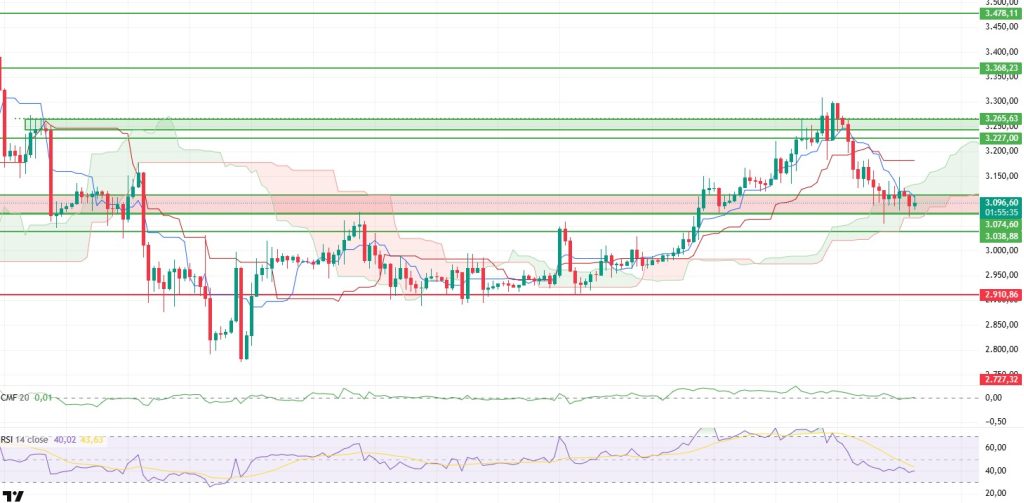
The ETH price continued its downward movement during the day, falling to the lower band of the kumo cloud at the $3,066 level. The decline stopped with buyers re-entering the market in this region, and the price recovered towards the $3,100 level. Although there was a brief fluctuation following the release of US non-farm payroll and unemployment data, the price managed to find equilibrium after this movement. The price behavior during the day indicates that selling remained limited and buyers are still active at critical levels.
The liquidity picture is more positive compared to the morning hours. The Chaikin Money Flow (CMF) managed to stay in positive territory despite the sharp movements throughout the day. This outlook reveals that the amount of money entering the market has increased and that pullbacks are not supported by strong liquidity outflows. This liquidity structure suggests that the decline is a controlled correction rather than panic selling.
The momentum outlook is largely preserved. Although the Relative Strength Index (RSI) remains in weak territory, as noted in the previous analysis, the pace of decline has slowed. The positive divergence between the RSI and price continues. This indicates that the downward movement is more of a technical correction than a sharp trend reversal.
Technically, the Ichimoku indicator maintains its structure. The price managed to hold within the kumo cloud, and there has been no permanent transition to the lower band yet. The regaining of the Tenkan level improves the short-term outlook, while the maintenance of the Kijun level indicates that the medium-term positive structure remains intact.
The main area to watch in the overall assessment remains unchanged. The range between $3.074 and $3.038 continues to be a critical support area on the downside. As long as the price remains above this zone during the day, pullbacks can be considered corrections, and upward attempts may remain on the agenda. Conversely, a downward breach of this band could increase selling pressure. Although the ETH price is fluctuating in the current scenario, the technical structure does not yet indicate a clear downward trend.
Supports: 3,074 – 3,019 – 2,910
Resistances: 3,227 – 3,265 – 3,368
XRP/USDT
The XRP price retreated to the $2.07 level during the day as selling continued. With limited buying in this region, the price rebounded to the $2.10 level. Although the reaction indicates that the downward momentum has slowed, the price is still moving within a weak band. The short-lived nature of upward attempts suggests that buyers have yet to demonstrate clear strength.
The liquidity outlook has not changed significantly. The Chaikin Money Flow (CMF) remains in negative territory, but the slight upward shift in its slope is noteworthy. This structure indicates that liquidity outflows are continuing but beginning to lose momentum. At this stage, this recovery is not strong enough to push the price higher, but it is possible to say that the downward pressure is not as severe as before.
The momentum picture remains weak. The Relative Strength Index (RSI) maintains its downward trend and is still at low levels. This RSI structure indicates that buyers have not yet gained momentum and that pressure on the price continues. Without a clear recovery in momentum, it seems difficult to expect a healthy upward movement.
The technical structure maintains its morning outlook in terms of the Ichimoku indicator. While the negative structure at the Tenkan and Kijun levels remains valid, the price continues to stay above the kumo cloud. This picture shows that the pressure continues in the short term, but a clear trend change in the medium term has not yet been confirmed.
In the broader picture, the $2.17 level retains its importance. As long as the price remains below this level during the day, downward pressure is expected to continue. Conversely, if $2.17 is breached again, a limited recovery area could form for the price. In the current outlook, the XRP price continues its weak trend, and the buyer side needs to produce clearer signals.
Supports: 2.0500 – 1.9742 – 1.9005
Resistances: 2.1731 – 2.2729 – 2.3512

SOL/USDT
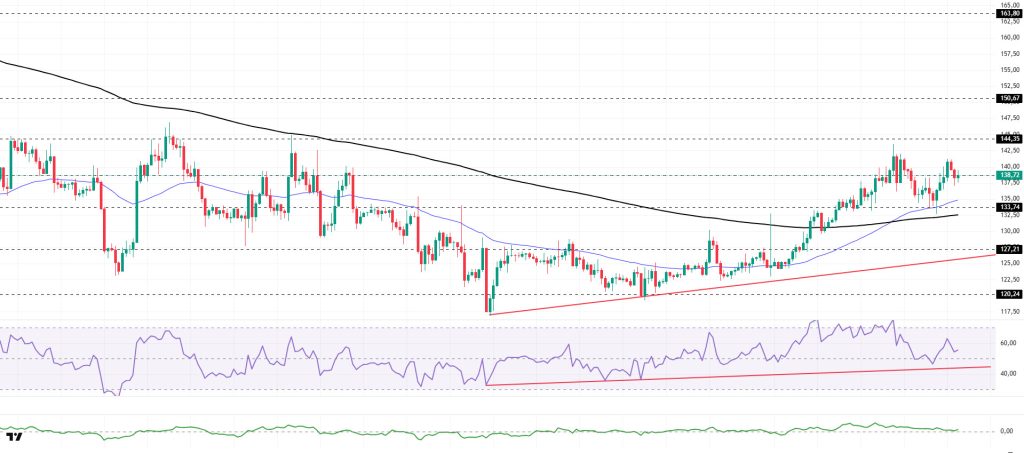
The SOL price showed a slight decline during the day. The asset continued to stay in the upper region of the rising line that started on December 18. Testing the 200 EMA (Black Line) moving average as support, the price gained momentum from there and rose, breaking above the strong resistance level of $138.73 and continuing its upward movement. Currently trading below this level, the asset may test the 50 EMA (Blue Line) moving average as support if the decline continues. In an upward scenario, the $144.35 level could act as resistance.
On the 4-hour chart, it remained above the 50 EMA (Exponential Moving Average – Blue Line) and 200 EMA (Black Line). This indicated that an uptrend could begin in the medium term. At the same time, the price being above both moving averages signaled that the asset was trending upward in the short term. The Chaikin Money Flow (CMF-20) is in positive territory. Furthermore, the balance of money inflows may keep the CMF in positive territory. The Relative Strength Index (RSI-14) rose from the negative zone to the middle of the positive level, supported by the upward trend that began on December 18. This signaled increased buying pressure. If an uptrend occurs due to macroeconomic data or positive news related to the Solana ecosystem, the $150.67 level stands out as a strong resistance point. If this level is broken upwards, the rise is expected to continue. If there are pullbacks due to developments in the opposite direction or profit-taking, it may test the $127.21 level. A decline to these support levels may increase buying momentum, presenting a potential upside opportunity.
Support: 133.74 – 127.21 – 120.24
Resistance: 138.73 – 144.35 – 150.67
DOGE/USDT
The Financial Industry Regulatory Authority (FINRA) announced on its daily institutional trading list that Dogecoin Cash, Inc. (OTC: DOGP), which trades on the US over-the-counter market, has completed its stock dividend payment using other securities.
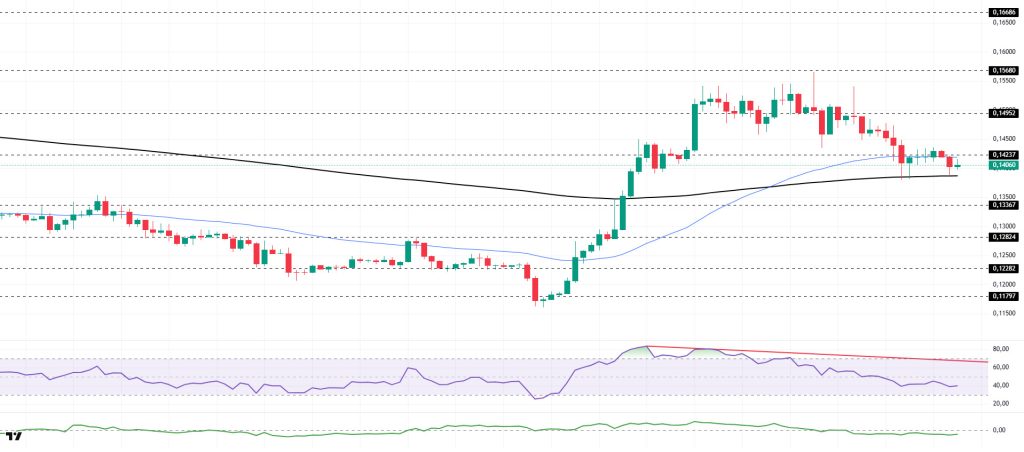
The DOGE price showed a slight decline during the day. The asset reacted at the $0.15680 level, experienced a pullback, and tested the 200 EMA (Black Line) moving average as support. Gaining momentum from there, the asset rose and crossed above the 50 EMA (Blue Line) moving average. However, the asset experienced a pullback from there and is currently testing the 50 EMA moving average as resistance and the 200 EMA (Black Line) moving average as support. If the candle closes below the 200 EMA, the $0.13367 level could act as support. If the candle closes above the 50 EMA, the $0.14952 level should be monitored.
On the 4-hour chart, the 50 EMA (Exponential Moving Average – Blue Line) remained above the 200 EMA (Black Line). This indicated that a medium-term uptrend was forming. The price being between the two moving averages, however, showed that the price was in a decision phase in the short term. The Chaikin Money Flow (CMF-20) remained in negative territory. Additionally, the decrease in money inflows could push the CMF deeper into negative territory. The Relative Strength Index (RSI-14) remained in the middle of negative territory. It is also below the downward trend that began on January 3. This signaled that selling pressure continues. In the event of a rise driven by political developments, macroeconomic data, or positive news flow in the DOGE ecosystem, the $0.15680 level stands out as a strong resistance zone. Conversely, in the event of negative news flow, the $0.13367 level could be triggered. A decline to these levels could increase momentum and initiate a new wave of growth.
Support: 0.13367 – 0.12824 – 0.12282
Resistance: 0.14237 – 0.14952 – 0.15680
Legal Notice
The investment information, comments, and recommendations contained herein do not constitute investment advice. Investment advisory services are provided individually by authorized institutions taking into account the risk and return preferences of individuals. The comments and recommendations contained herein are of a general nature. These recommendations may not be suitable for your financial situation and risk and return preferences. Therefore, making an investment decision based solely on the information contained herein may not produce results in line with your expectations.