
BTC/USDT
A state-level Bitcoin reserve initiative from Florida draws attention in terms of integrating crypto assets into public balance sheets, while weekly jobless claims in the US falling below expectations showed that the labor market remains strong. In the derivatives market, $2.22 billion worth of BTC and ETH options expiring point to increased volatility risk, particularly around $90,000 for Bitcoin. On the Fed front, Milan’s expectation of a 150 basis point rate cut in 2026 suggests that a more dovish policy path is beginning to be discussed in the medium term.
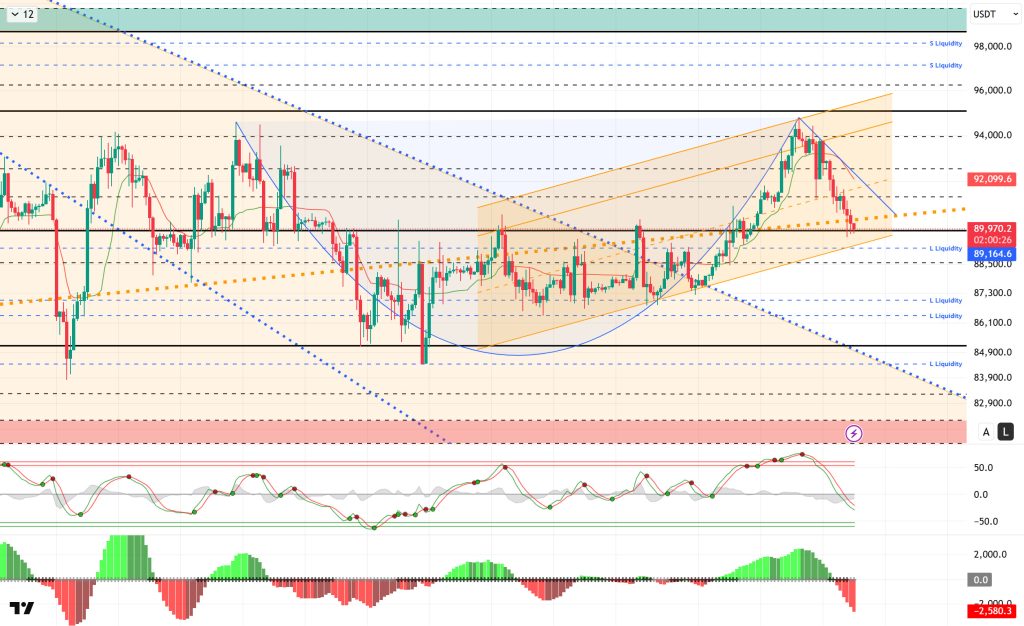
From a technical perspective, BTC continues to give back its gains after testing the 94,800 level. The deepening of the flag pattern formed in parallel with the uptrend has created a descending minor channel. In this context, the price, which lost the 91,400 level in the short term, spiked to the 89,600 level. Although the price rose above the major uptrend during the day, it failed to hold there and continues to trade below the 90,000 reference level. While selling pressure is expected to increase if BTC, which is struggling to hold in a critical area, loses the 90,000 reference zone, we will follow the breakout of the minor uptrend line for a new upward movement.
Technical indicators show the Wave Trend (WT) oscillator moving its sell signal from the overbought zone to the channel midband, where it has begun to weaken. The histogram on the Squeeze Momentum (SM) indicator has gained momentum in negative territory. The Kaufman Moving Average (KAMA) is currently trading above the price at the $92,100 level.
When examining liquidation data, buy-side transactions are being liquidated in the short term at the 89,000 – 90,000 level, while accumulation continues in the long term at the 86,000 – 87,000 level. In contrast, selling levels are accumulating again in the short term in the 92,000 – 95,000 band, while in the monthly time frame, intense selling clusters continue above the 97,000 level.
In summary, strong macroeconomic data in the US continues to push back expectations of a Fed rate cut, while the Trump administration appears to be accelerating its preparations for the midterm elections. In addition, Washington is notably increasing its control over oil and cash flows from Venezuela. The U.S. Treasury Department continues to take steps to hold seized Bitcoins as a strategic asset. When examining liquidity data, long-term trades were liquidated following the price breakout after areas of concentrated short-term trading, and the buying level gained weight in the short term. In technical terms, BTC started the new year with positive momentum, continuing its parallel movement with the upward channel and rising to the 94,800 level. With profit-taking from this point, the price retreated to the 89,600 region. In the next phase, 91,400 stands out as a critical resistance area, and if this level is broken, a breakout of the short-term minor downtrend will follow. Otherwise, whether it holds above the 90,000 reference area will be decisive.
Supports: 90,000 – 89,000 – 88,000
Resistances: 91,400 – 92,600 – 94,000
ETH/USDT
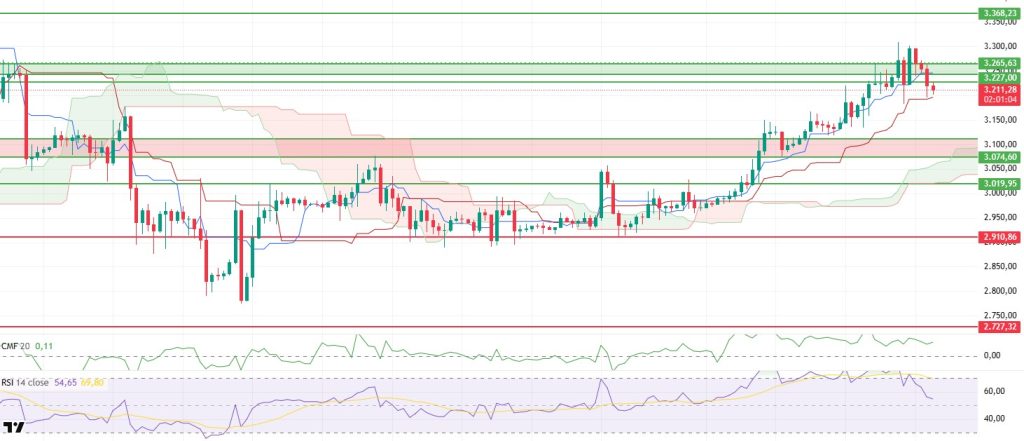
The ETH price continued to retreat during the day due to selling pressure and fell to the support zone marked in red on the chart. As of now, the price is trying to stabilize at around $3,100. The movement since the morning shows that sellers are more active in the short term, but the decline is not yet out of control.
The liquidity picture is noteworthy. Chaikin Money Flow (CMF) managed to stay positive despite the price decline. This suggests there hasn’t been a sharp outflow of money from the market and that the decline is largely driven by selling in the futures market. The absence of a strong sell-off in the spot market indicates the downward movement may remain limited.
The weakening in momentum is clear. The Relative Strength Index (RSI) continued its decline, falling below the 40 level. This indicates a significant weakening of momentum in the short term. However, the continued positive divergence between the RSI and the price is an important detail. This structure keeps alive the possibility that the current pullback may be a correction rather than a trend reversal.
The technical outlook is producing mixed signals from the Ichimoku indicator. The Tenkan level cutting below the Kijun level created a short-term negative signal. Nevertheless, the price remaining above the upper band of the kumo cloud indicates that the main structure has not completely broken down. The kumo region acting as support shows that selling has remained limited for now.
In the overall assessment, the area between the $3.074 support level and the $3.038 lower band of the kumo cloud is critical. As long as the price stays above this area during the day, downward movements can be considered corrections, and upward attempts from these levels can be seen. On the other hand, if this area is breached downward, the decline could take on a more severe structure. In the current scenario, although the ETH price is under pressure, it does not appear to have entered a clear negative trend yet.
Supports: 3,074 – 3,019 – 2,910
Resistances: 3,227 – 3,265 – 3,368
XRP/USDT
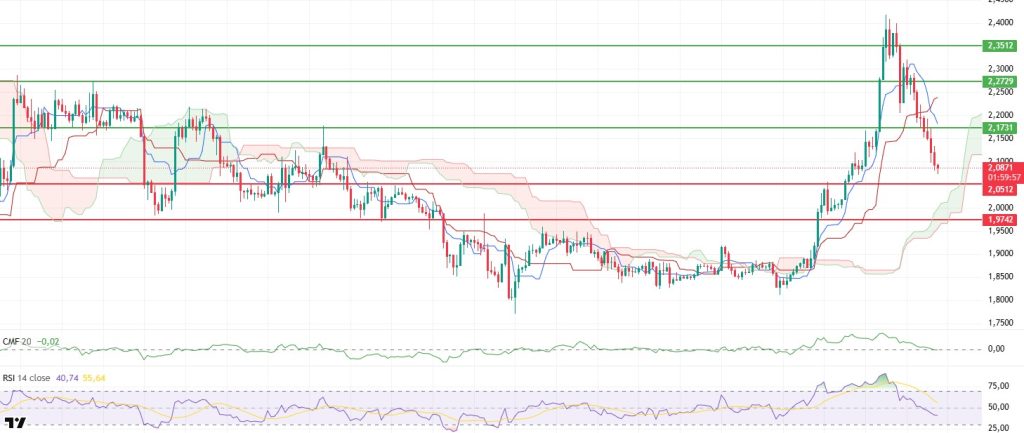
Selling pressure continued to affect the XRP price throughout the day, and the pullback deepened to the $2.08 level. Although there was a brief pause at this level, there has been no strong reaction at this stage. The price slowing down on its way down indicates that sellers are catching their breath, but buyers still appear weak.
The search for balance in liquidity is prominent. Chaikin Money Flow (CMF) is moving sideways around the zero line. This view indicates that the money entering and leaving the market is currently balanced. There is no clear liquidity inflow, nor is there a sharp outflow. Therefore, price movement is shaped more by technical pressure.
The picture is clearly negative on the momentum side. The Relative Strength Index (RSI) continues its decline, remaining in weak territory. This sharp pullback in the RSI reveals that buyers have lost control and that selling pressure remains strong. There is no sign of a recovery in momentum yet.
The technical structure maintains its previous outlook from the Ichimoku indicator perspective. While the negative structure formed by the Tenkan and Kijun intersection continues, the price remains above the kumo cloud. This indicates that pressure persists in the short term, but a clear trend reversal in the medium term has not yet been confirmed.
In the broader picture, the $2.17 level retains its importance. As long as the price remains below this level during the day, a downward movement is likely to continue. If $2.17 is breached again, recovery attempts for the price may come to the fore. In the current scenario, the XRP price remains under pressure, and there is no clear sign yet that buyers are gaining strength.
Supports: 2.0500 – 1.9742 – 1.9005
Resistances: 2.1731 – 2.2729 – 2.3512
SOL/USDT
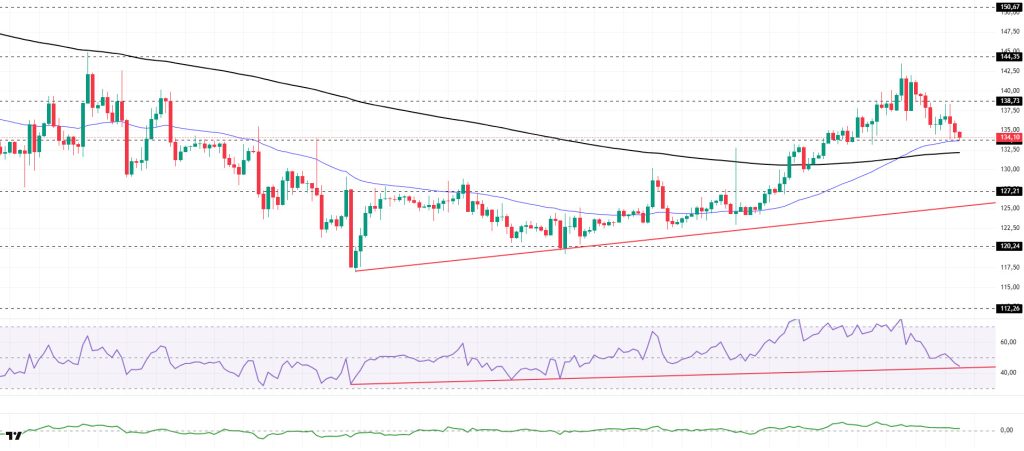
The SOL price continued to pull back during the day. The asset remained in the upper region of the rising line that began on December 18. Deepening its pullback, the asset is currently testing the strong support level of $133.74 and the 50 EMA (Blue Line) moving average. It may test the 200 EMA (Black Line) moving average as support in the event of closes below this level. If it experiences an uptrend, the $144.35 level may act as resistance.
On the 4-hour chart, it remained above the 50 EMA (Exponential Moving Average – Blue Line) and 200 EMA (Black Line). This indicated that an uptrend could begin in the medium term. At the same time, the price being above both moving averages signaled that the asset was trending upward in the short term. The Chaikin Money Flow (CMF-20) is in positive territory. However, the balance of money inflows and outflows may keep the CMF in positive territory. The Relative Strength Index (RSI-14) has fallen from neutral to negative territory. At the same time, it is currently testing the upward trend that began on December 18 as support. This indicates that buying pressure continues, albeit at a reduced level. If there is an uptrend due to macroeconomic data or positive news related to the Solana ecosystem, the $150.67 level stands out as a strong resistance point. If this level is broken upwards, the uptrend is expected to continue. In case of pullbacks due to developments in the opposite direction or profit-taking, it may test the $127.21 level. A decline to these support levels could increase buying momentum, presenting a potential upside opportunity.
Supports: 133.74 – 127.21 – 120.24
Resistances: 138.73 – 144.35 – 150.67
DOGE/USDT
The DOGE price experienced a pullback during the day. The asset reacted at the $0.15680 level, experienced a pullback, and moved below the $0.14237 level and the 50 EMA (Blue Line) moving average. This indicated that selling pressure had strengthened. Currently testing the 200 EMA (Black Line) moving average as support, the price could test the $0.13367 level if it closes below this level. If it rallies, the $0.14237 level should be monitored.
On the 4-hour chart, the 50 EMA (Exponential Moving Average – Blue Line) remained above the 200 EMA (Black Line). This indicated that an uptrend was forming in the medium term. The price being above both moving averages indicates that the price is trending upward in the short term. Chaikin Money Flow (CMF-20) remained in negative territory. Additionally, the decrease in cash inflows may keep the CMF in negative territory. The Relative Strength Index (RSI-14) retreated from the overbought level to the middle of the negative zone. It is also located below the downward trend that began on January 3. This signaled the emergence of selling pressure. In the event of a rise due to political developments, macroeconomic data, or positive news flow in the DOGE ecosystem, the $0.15680 level stands out as a strong resistance zone. Conversely, in the event of negative news flow, the $0.13367 level could be triggered. A decline to these levels could increase momentum and start a new wave of growth.
Supports: 0.13367 – 0.12824 – 0.12282
Resistances: 0.14237 – 0.14952 – 0.15680

Legal Notice
The investment information, comments, and recommendations contained herein do not constitute investment advice. Investment advisory services are provided individually by authorized institutions taking into account the risk and return preferences of individuals. The comments and recommendations contained herein are of a general nature. These recommendations may not be suitable for your financial situation and risk and return preferences. Therefore, making an investment decision based solely on the information contained herein may not produce results in line with your expectations.