
Technical Analysis
BTC/USDT
U.S. Treasury Secretary Bessent stated that a 50-basis-point interest rate cut should be considered in September and that the cut could be implemented earlier if appropriate data becomes available. Bessent noted that rising tariff revenues could complicate the reversal of Trump’s trade policies and potentially impact legal proceedings. Meanwhile, according to Barclays, Stephen Moore, whom Trump nominated to replace Kugler, could be a surprise candidate for the Fed chairmanship. According to US Treasury Department data, the country’s national debt exceeded $37 trillion as of August 12, reaching a record high. Today, messages from Fed members Goolsbee and Bostic will be closely watched.
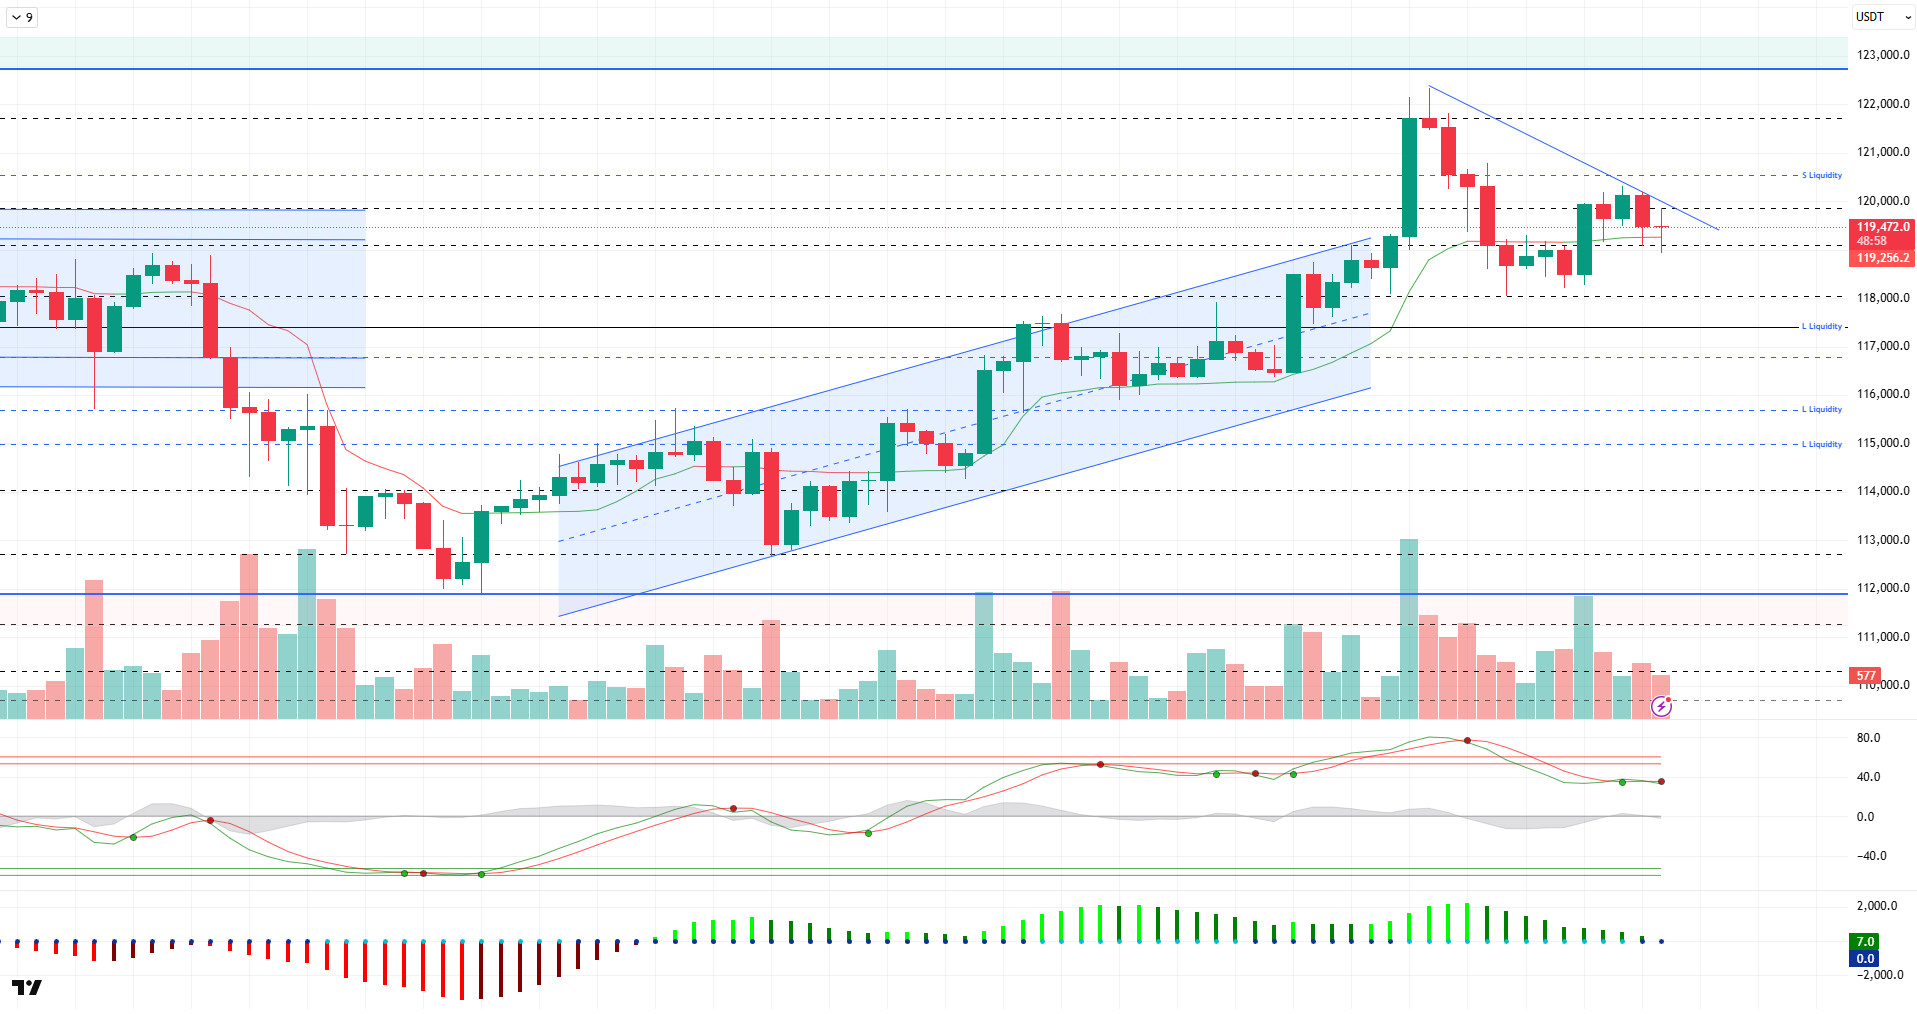
Looking at the technical picture, BTC, which recorded a short-term upward movement in the previous analysis, tested above the 120,000 level but did not remain there. The minor downward structure continues within the major upward trend that ended at the previous peak of 122,300. At the time of writing, BTC is trading at the 119,300 level.
Technical indicators show that the Wave Trend oscillator (WT) has reversed its direction downward after a short-term upward movement in the overbought zone. The Squeeze Momentum (SM) indicator shows a weakening of momentum in the positive zone, while the histogram is preparing to move into the negative zone. The Kaufman moving average is currently acting as support just below the price at the 119,200 level.
Looking at liquidity data, short positions are accumulating at the 121,000 and 123,000 levels in the short term, while long positions are showing increased activity at the 117,000 and 115,000 levels.
In summary, while corporate acquisitions continue to send positive signals in the key developments section, silence prevails on the Trump front. Following inflation data, expectations for an interest rate cut in September rose to 95%. The technical structure appears indecisive at the saturation point, but could reverse the trend. In liquidity data, 115,000 remains an important accumulation zone. In the event of a potential sell-off, the 118,000 level will be monitored as a support area, and in the event of a breakout, the 117,500 level will be followed by the 115,000 liquidity and reference area. In the event of a new upward attack attempt, 120,000 emerges as a critical resistance area. Closures above this level could trigger a new momentum to push the ATH level higher.
Support levels: 118,000 – 117,500 – 115,000
Resistance levels: 120,000 – 121,500 – 123,000
ETH/USDT
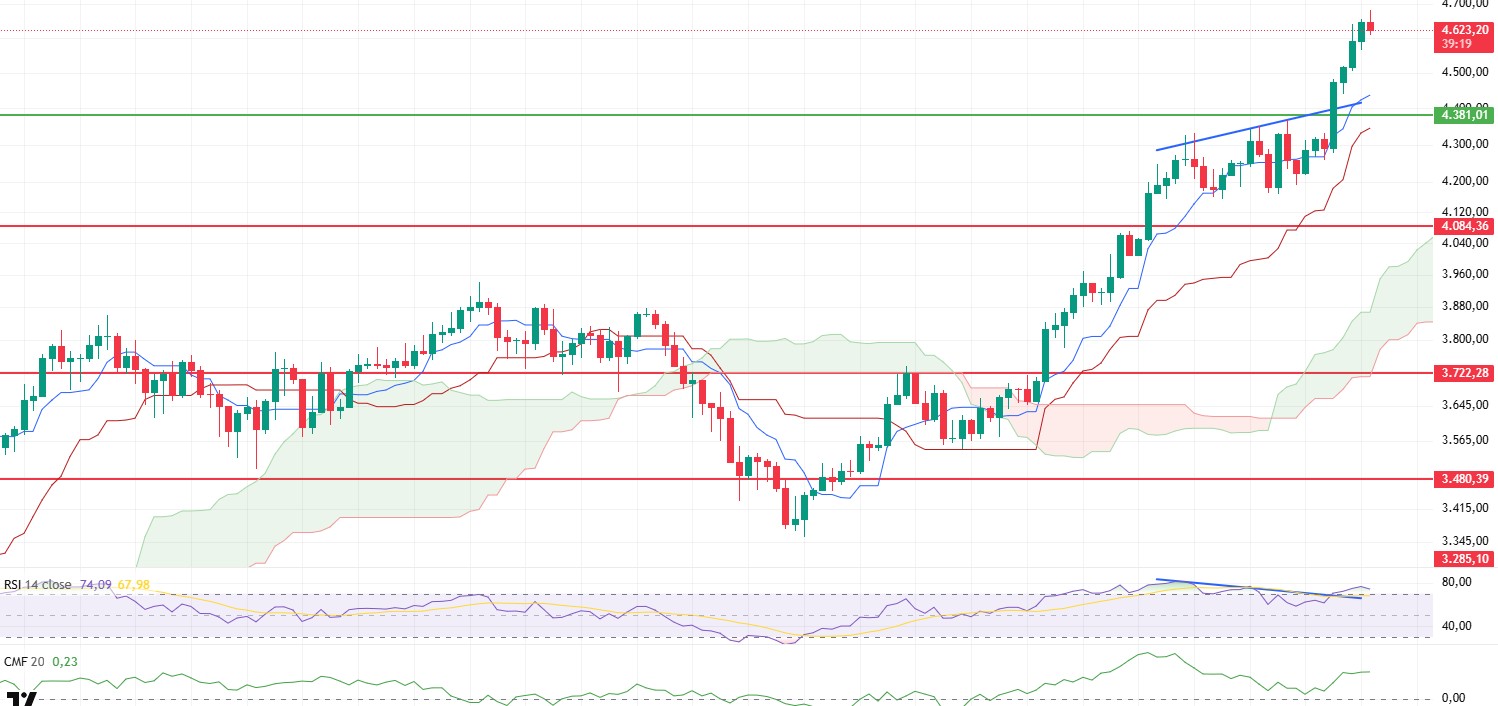
ETH broke above the 4,381 dollar resistance level yesterday evening and rose above the 4,600 dollar level. ETH continues to show a positive outlook as it moves toward its all-time high (ATH) of 4,800 dollars.
When on-chain data and technical indicators are evaluated together, the Cumulative Volume Delta (CVD) indicator shows that price increases are primarily driven by the futures market. This suggests that the uptrend is not based on organic spot demand but rather on a fragile structure dependent on leveraged trading. Such a structure increases the risk of sharp declines due to sudden liquidations, especially during periods of high leverage in long positions. Supporting this view, the open position size has reached $29 billion, and the funding rate remains positive. A positive funding rate indicates that long positions dominate the market, suggesting that a potential downward movement could lead to sharp pullbacks due to the liquidation of leveraged long positions.
On the Relative Strength Index (RSI) side, negative divergence is observed. While the price chart shows rising peaks, the formation of lower peaks on the RSI indicates that buyers are using less power at each new peak and that momentum is gradually shifting to sellers. This situation is generally accepted as one of the leading signals of a trend reversal.
Considering all these indicators, the price could continue its upward movement toward the 4,857 dollar level as long as it does not lose the 4,381 dollar support level. A break below the 4,381 dollar level could trigger sharp corrections.
Top of Form
Below the Form
Support levels: 4,381 – 4,084 – 3,722
Resistance levels: 4,550 – 4,857 – 5,000
XRP/USDT
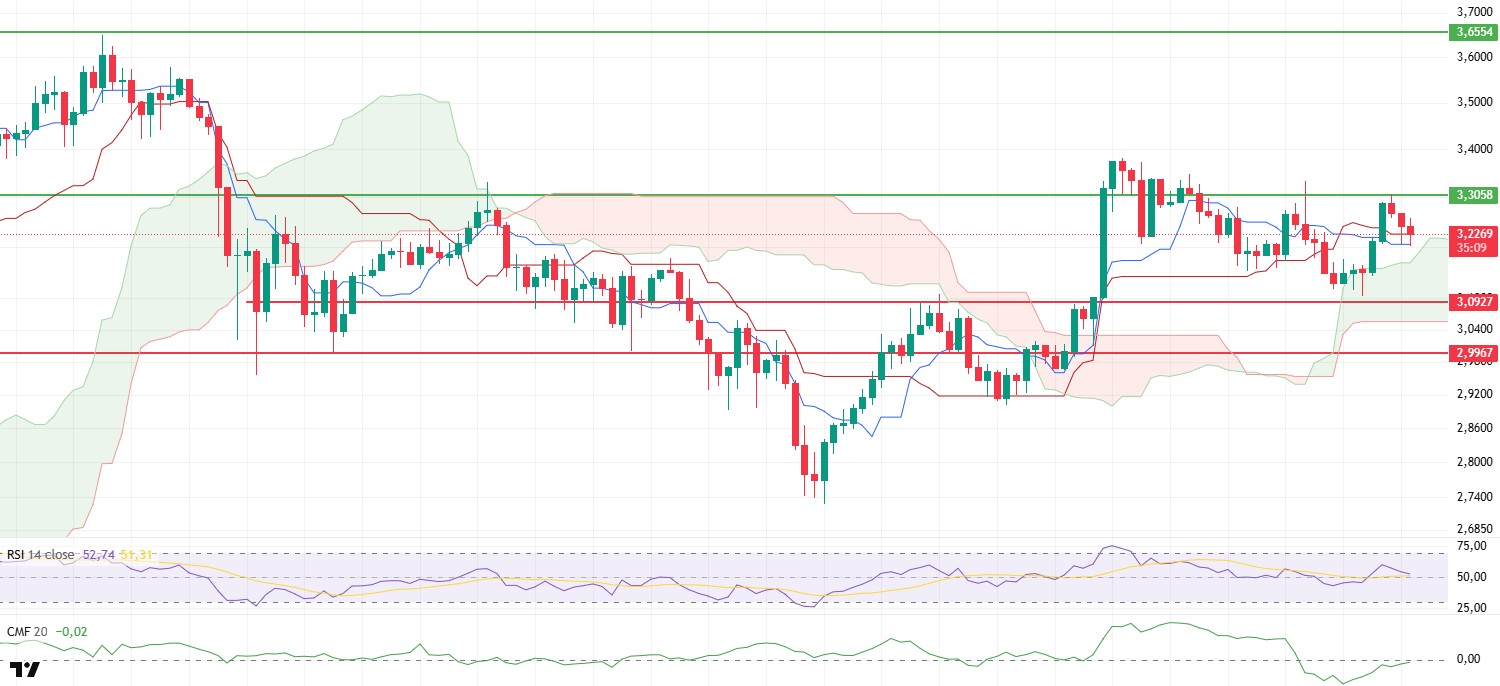
XRP rose to the $3.30 resistance level yesterday evening as expected. Facing selling pressure in this region, the continued strengthening trend in technical indicators has reinforced the upward outlook for XRP.
The RSI indicator falling below both the 50 level and the moving average line indicates that market momentum has clearly shifted to sellers. This suggests that buyers are losing strength and the likelihood of the price testing lower levels has increased. The momentum indicator losing its momentum is one of the signals that the downtrend could continue in the short term.
The rise of the Chaikin Money Flow (CMF) indicator into positive territory indicates an acceleration in capital inflows into the market. This suggests that short-term investors are closing their positions and that selling pressure is increasing.
In Ichimoku analysis, the “sell” signal formed by the price retreating back into the Kumo cloud and the Tenkan line falling below the Kijun line is currently inactive, strengthening expectations of an upward trend.
Overall, if the positive picture in the technical data persists, XRP is likely to retest the $3.30 resistance level during the day. Breaking above this level could lead to more significant gains. On the other hand, if the price breaks below the $3.09 support level, sharp declines could occur.
Supports: 3.0927 – 2.9967 – 2.7355
Resistances: 3.3058 – 3.6554 – 4.0055
SOL/USDT
Arthur Hayes, co-founder of BitMEX, has joined Upexi as an advisor. The committee will guide Upexi’s development in the Solana ecosystem. Asset company DeFi Development Corp. (DFDV) has increased its crypto reserves to over 1.3 million SOL, currently valued at approximately $250 million.
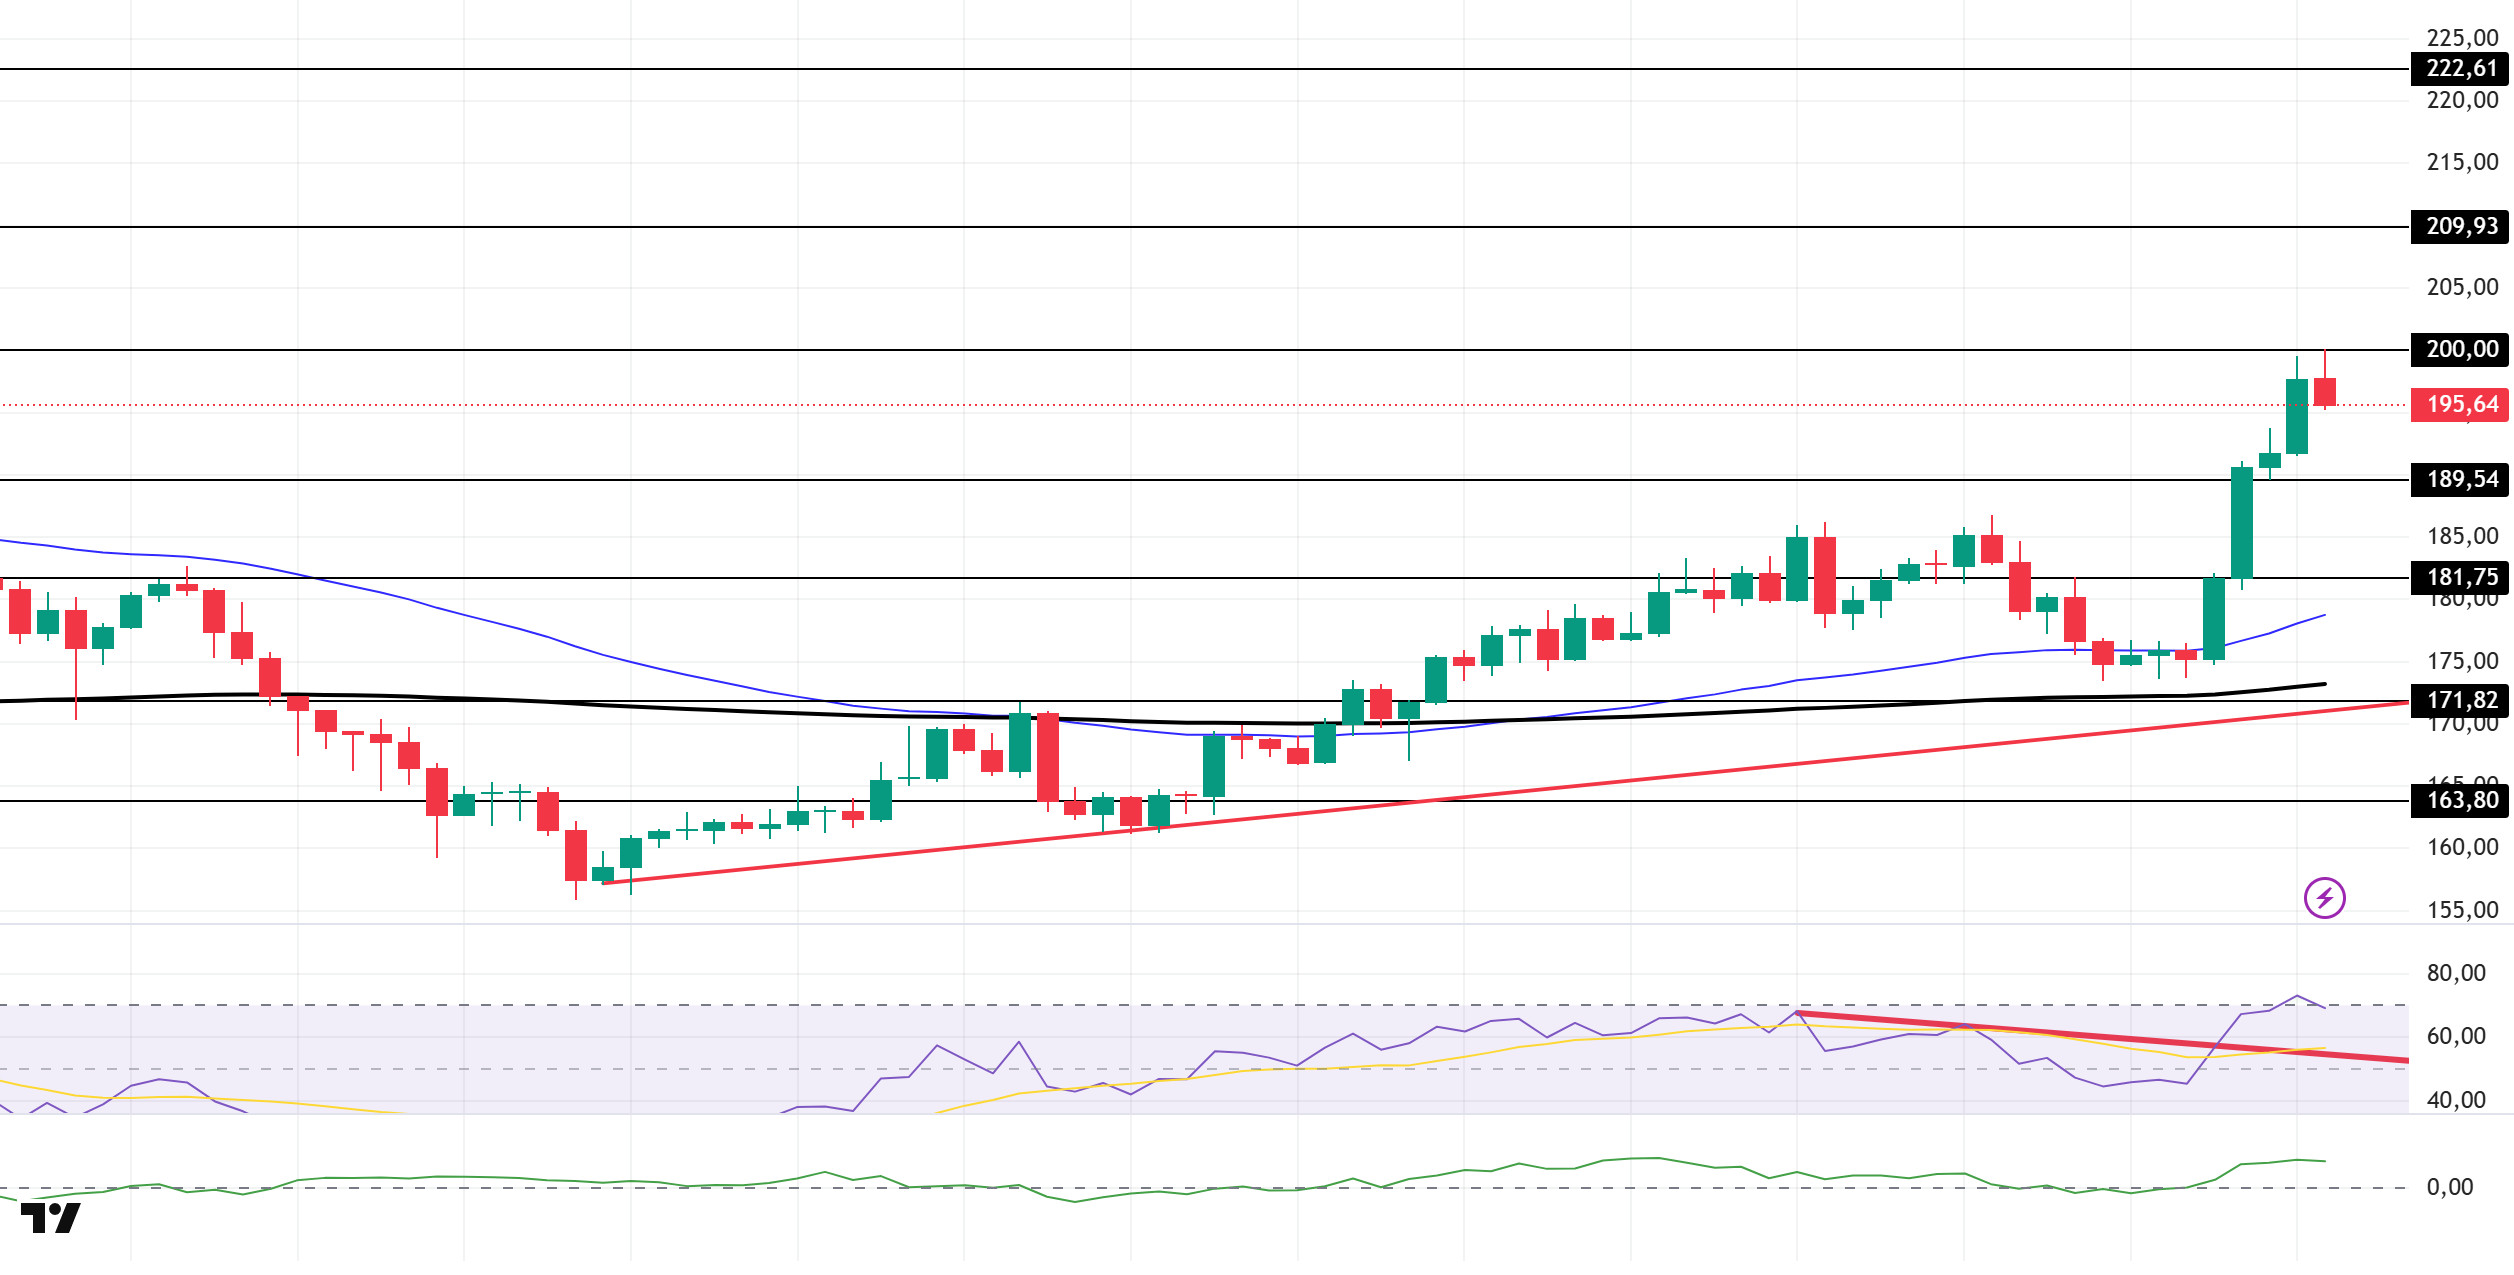
The SOL price has increased by approximately 13%. The asset has continued to remain above the upward trend line that began on August 2. The price, which broke through the major level of $181.75 with momentum from the 50 EMA (Blue Line) moving average and a strong candle, is currently testing the $200.00 level. If the upward trend continues, the 209.93 dollar level could be targeted. In the event of a pullback, the 189.54 dollar level could be tested.
On the 4-hour chart, the 50 EMA (Blue Line) remained above the 200 EMA (Black Line). This indicates that the upward trend may continue in the medium term. At the same time, the price being above both moving averages shows that the market is trending upward in the short term. The Chaikin Money Flow (CMF-20) has moved into positive territory. Furthermore, an increase in money inflows could push the CMF to higher levels within the positive zone. The Relative Strength Index (RSI-14) has broken above the downward trend that began on August 10. This indicates that buying pressure has started. However, the indicator being in the overbought zone could lead to profit-taking. In the event of an uptrend driven by positive macroeconomic data or news related to the Solana ecosystem, the $209.93 level emerges as a strong resistance point. If this level is broken to the upside, the uptrend is expected to continue. In the event of a pullback due to adverse developments or profit-taking, the $189.54 level could be tested. A decline to these support levels could see an increase in buying momentum, potentially presenting a buying opportunity.
Support levels: 189.54 – 181.75 – 171.82
Resistance levels: 200.00 – 209.93 – 222.61
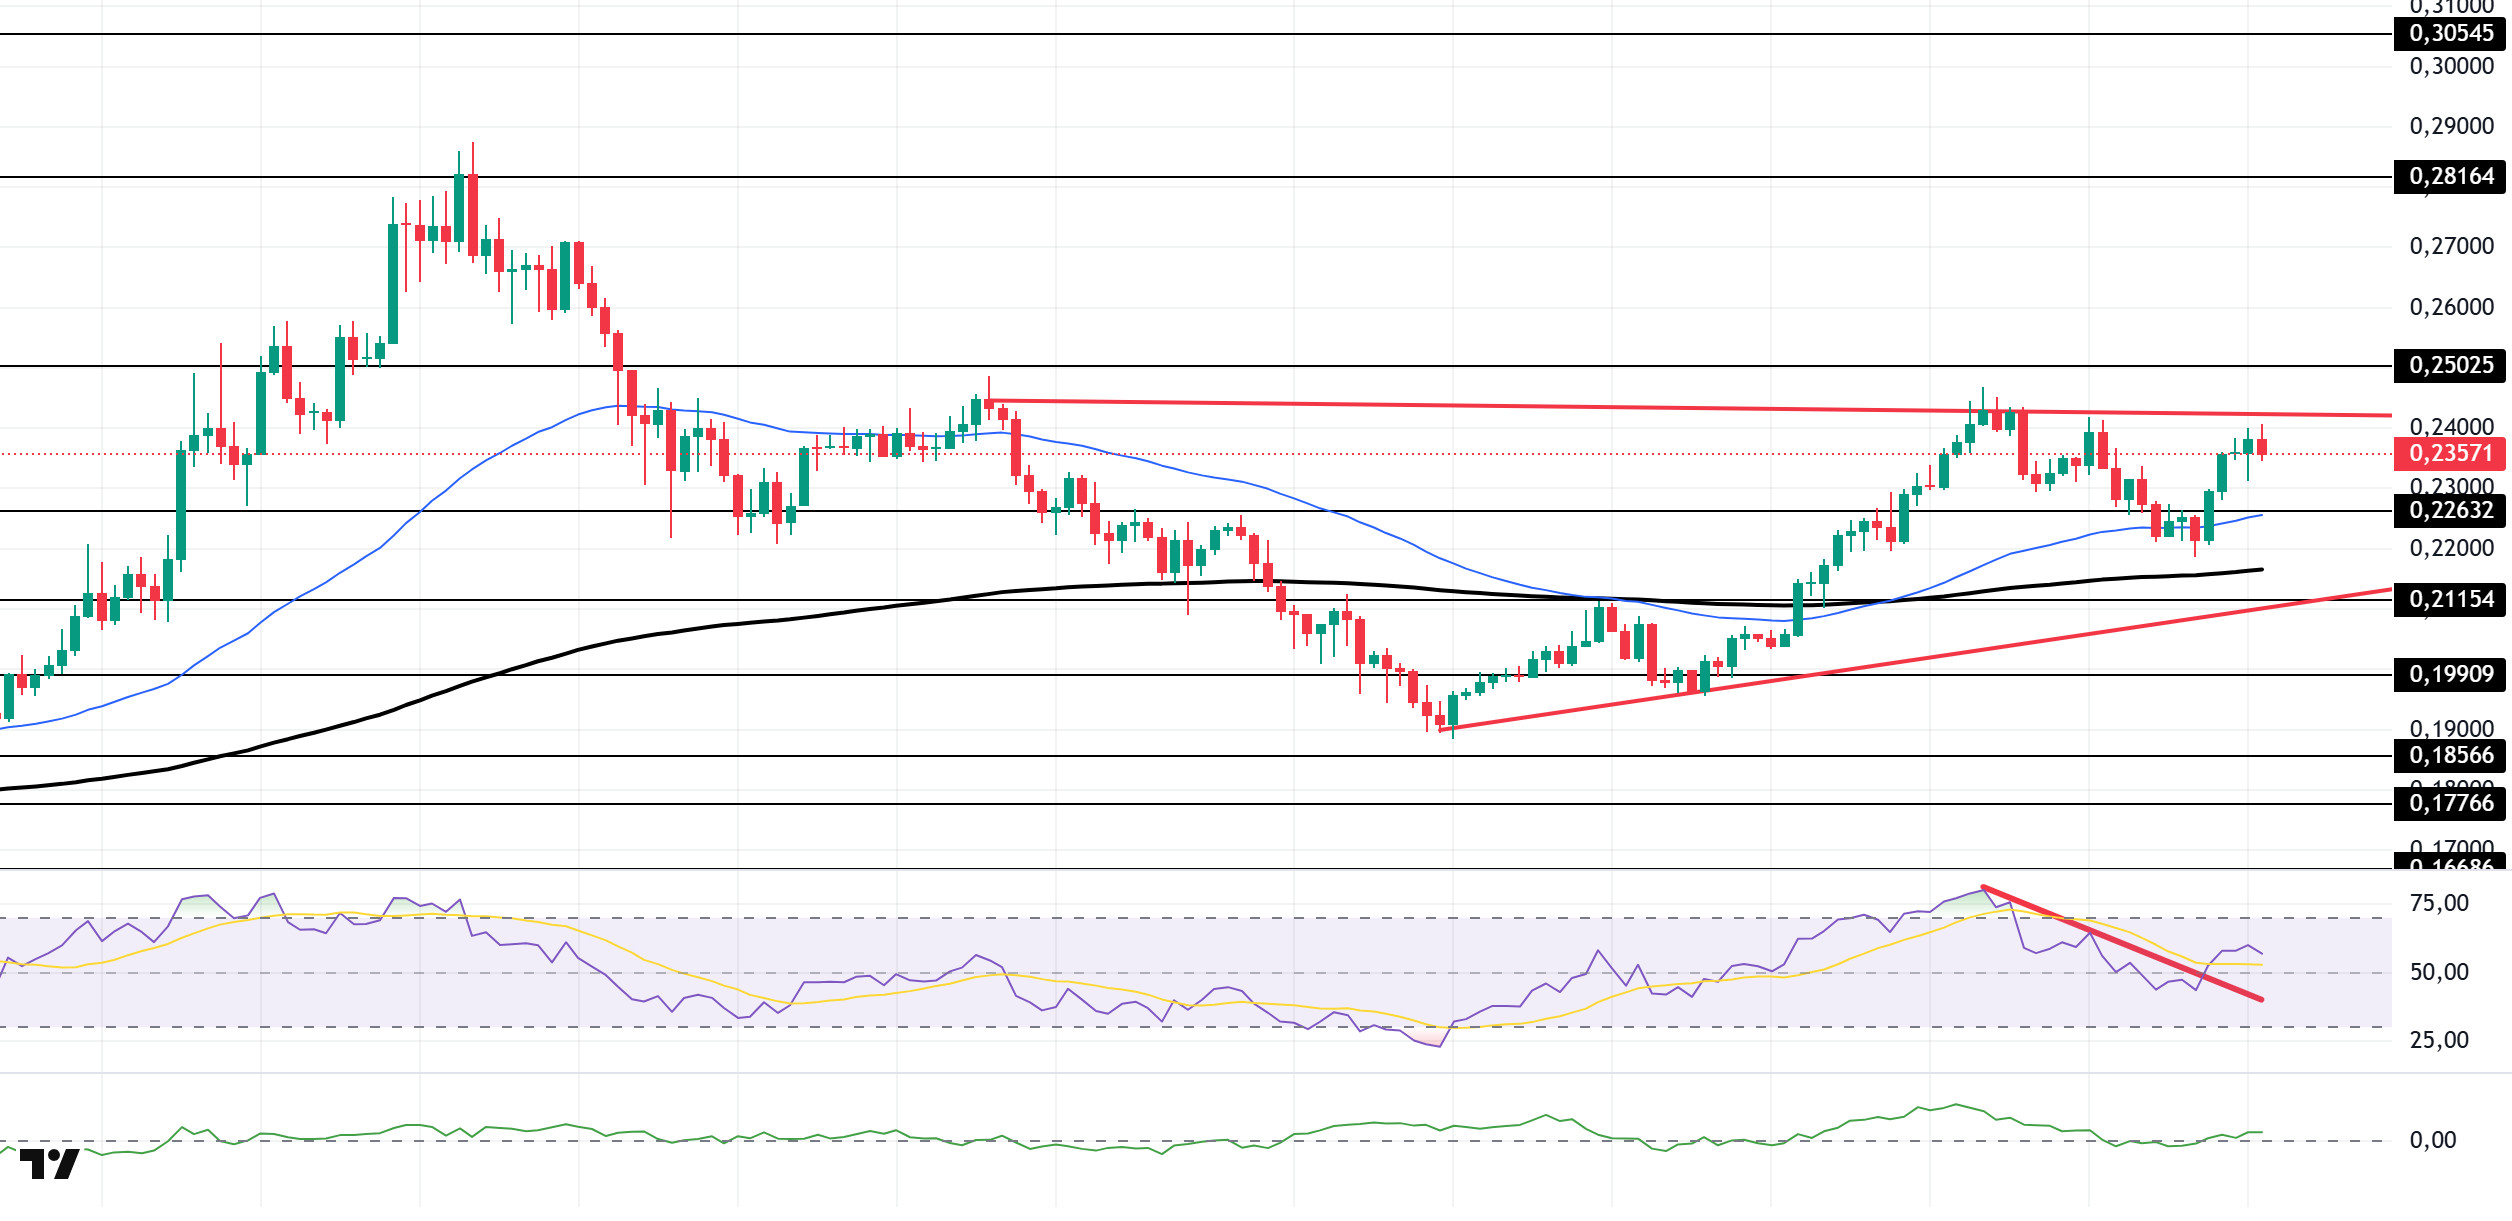
DOGE/USDT
The DOGE price has experienced an uptrend. The asset continues to remain within the symmetrical triangle formation that began on August 2. Breaking above the strong resistance level at $0.22632, the price has continued its upward movement and is currently testing the upper boundary of the symmetrical triangle formation. If the price closes above this level, the $0.25025 level could be targeted. In case of a pullback, the $0.22632 level could act as support.
On the 4-hour chart, the 50 EMA (blue line) remains above the 200 EMA (black line). This indicates that the asset is in an upward trend in the medium term. The price being above both moving averages also indicates that the asset is in an upward phase in the short term. The Chaikin Money Flow (CMF-20) has moved into the positive zone. Additionally, negative cash inflows could push the CMF into the negative zone. The Relative Strength Index (RSI-14) is in the positive zone. It has also crossed above the downward trend that began on August 9, indicating the start of buying pressure. In the event of upward movements driven by political developments, macroeconomic data, or positive news flow within the DOGE ecosystem, the $0.25025 level emerges as a strong resistance zone. In the opposite scenario or in the event of negative news flow, the 0.22632 dollar level could be triggered. A decline to these levels could lead to increased momentum, potentially initiating a new upward wave.
Support levels: 0.22632 – 0.21154 – 0.19909
Resistance levels: 0.25025 – 0.28164 – 0.30545
SHIB/USDT
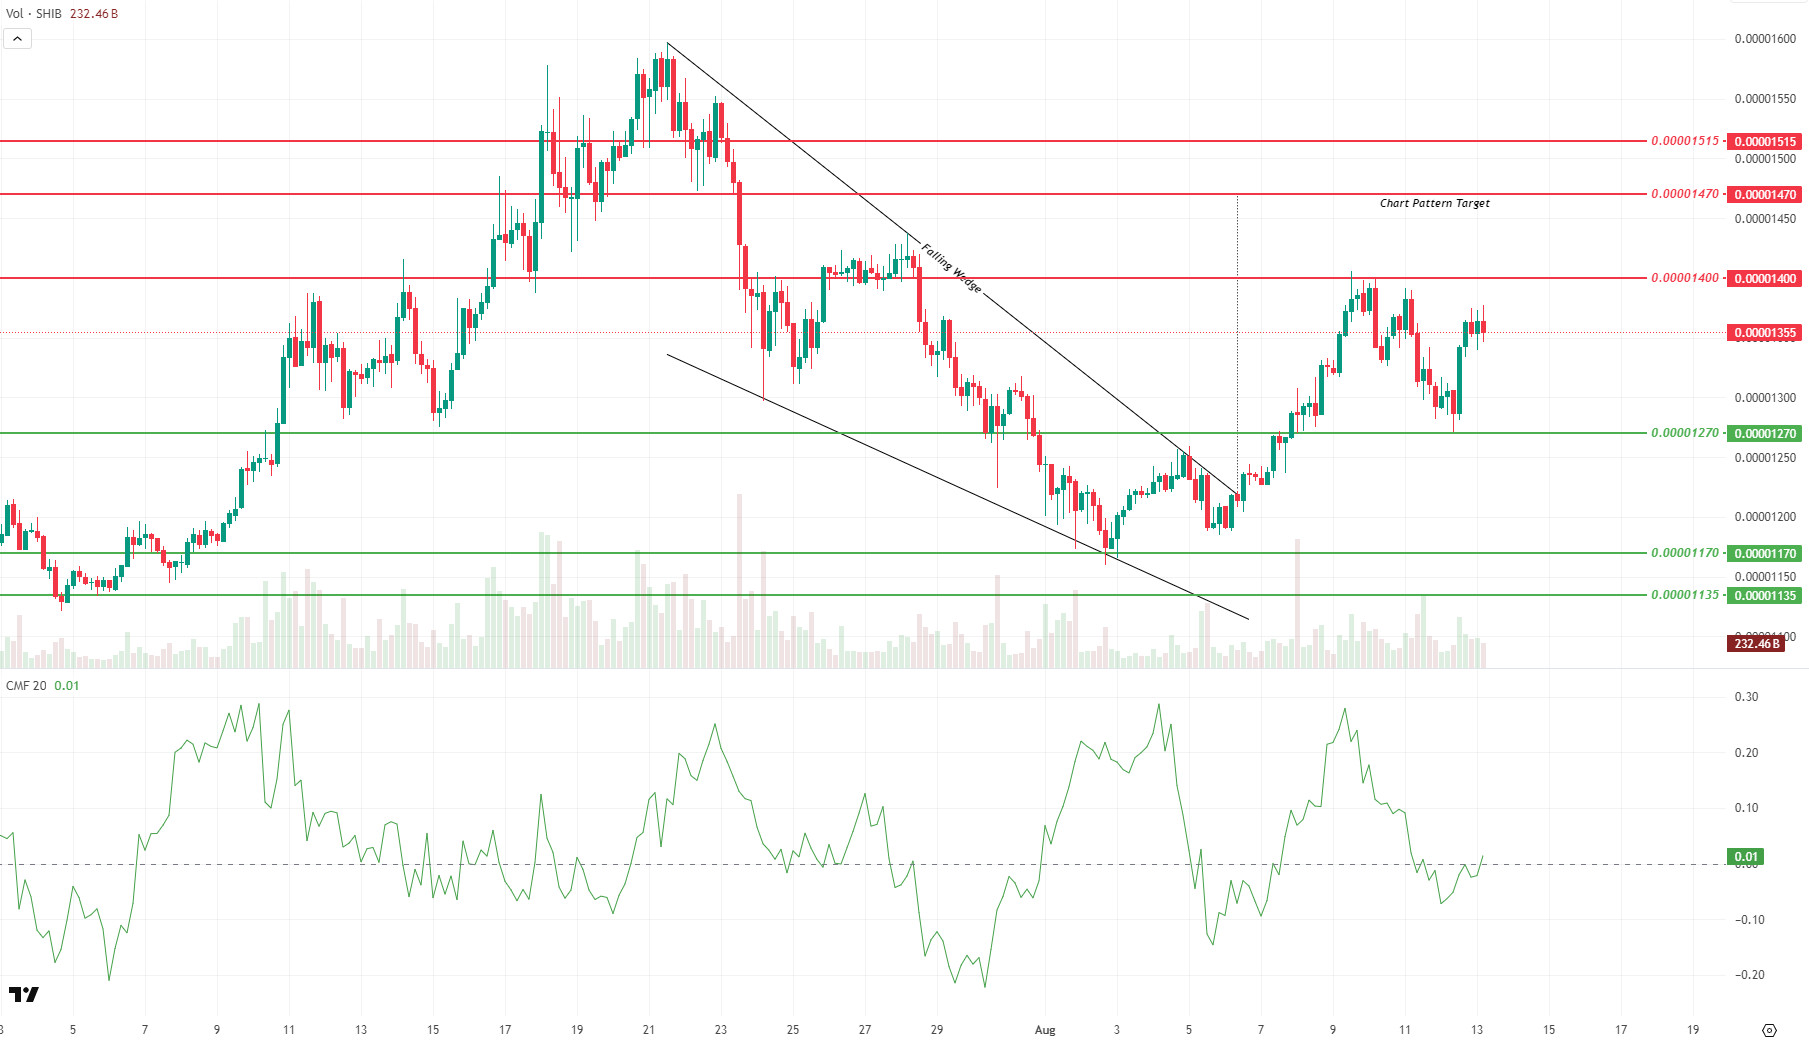
A large whale wallet with the address 0x7424 transferred approximately 202,489,814,762 SHIB (approximately $2.6 million) to Coinbase Prime. The return of this wallet, which had been inactive for two months, was interpreted by market participants as a potential profit realization or selling pressure. On-chain data shows that SHIB inflows to exchanges increased after the transfer, but there was no corresponding outflow. This suggests the possibility of one-sided selling pressure and that upward price movements could be fragile. Considering that in the whale’s previous similar transfers, the price retreated to support levels within a few days, investors should closely monitor this process.
On the technical side, the price recovered from the $0.00001270 support level and is currently trading at $0.00001354, above the critical $0.00001350 resistance level. If volume support strengthens, the price has the potential to gain momentum toward the 0.00001400–0.00001470 dollar range. However, if volume remains weak, the price could retreat back to the 0.00001320–0.00001270 dollar range. Although the Chaikin Money Flow (CMF) indicator is in the positive zone at 0.01, this value does not indicate sufficient capital flow for a strong breakout.
Especially, closes below the 0.00001270 dollar support level could deepen selling pressure, leading to tests of the 0.00001170 and 0.00001135 dollar support zones. The most important factor supporting the medium-term technical outlook is the breakout of the Falling Wedge formation formed since July 21 on August 6 and the continued validity of the formation target at the 0.00001470 dollar level.
Support levels: 0.00001270 – 0.00001170 – 0.00001135
Resistances: 0.00001400 – 0.00001470 – 0.00001515
ADA/USDT
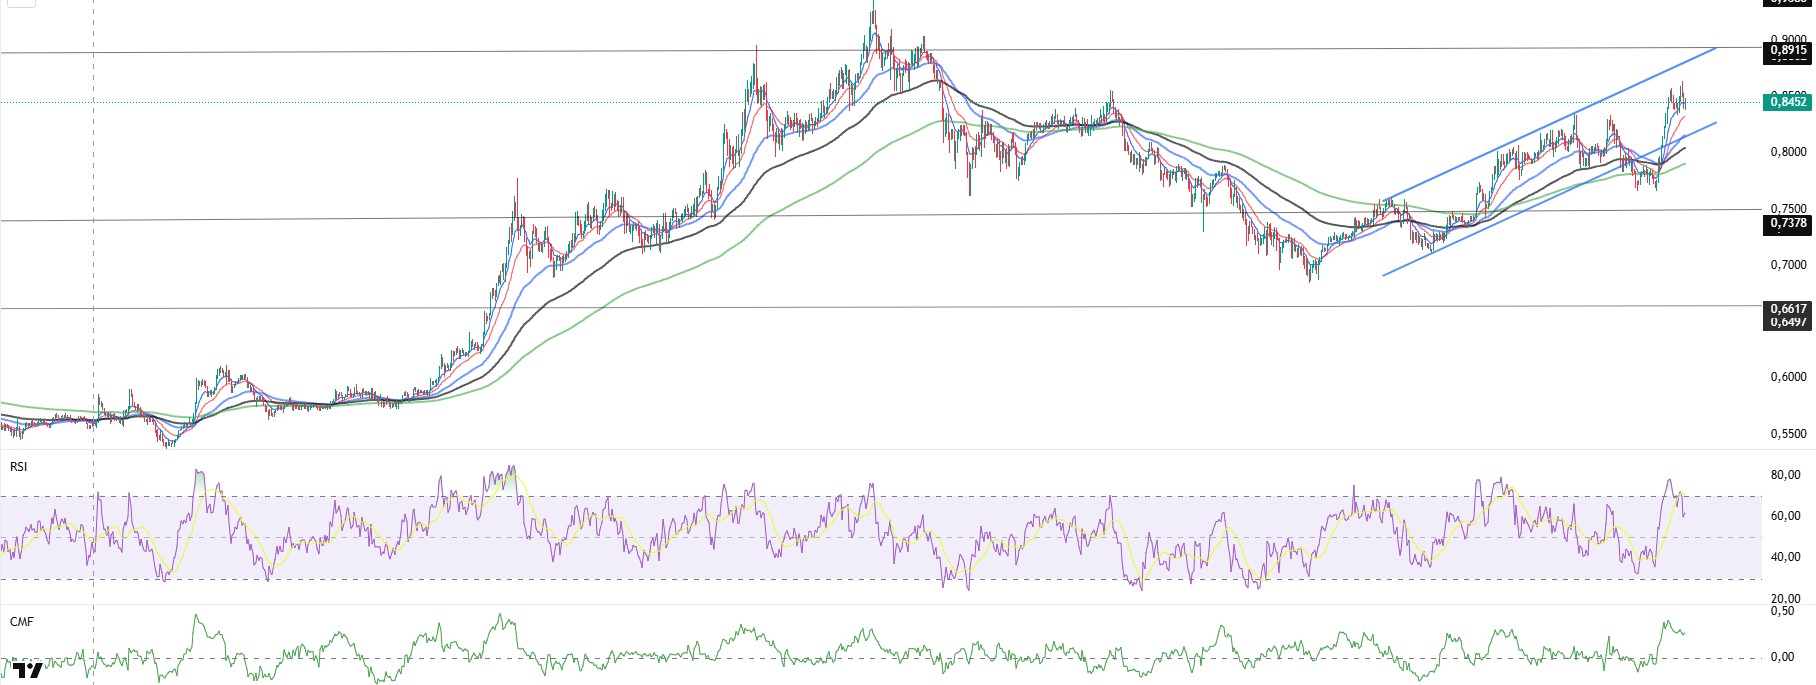
Yesterday, the crypto market priced in expectations of an interest rate cut, leading ADA back into its rising channel band. Headline inflation data released in the afternoon came in as expected. More importantly, core inflation came in worse than expected. However, the market interpreted these figures positively, as fears of inflation caused by customs duties are much higher. Yesterday, the expectation for an interest rate cut at the September FOMC meeting was 85%, and today it rose to 95%. An interest rate cut cycle could begin in September, and new resistance levels could be tested for ADA prices.
Technically, the price closed above the 50 and 100-day Exponential Moving Average (EMA-Blue Line) and (EMA-Black Line) on the 4-hour chart, rising to the first resistance level at 0.8413. If the price reaches the top of the rising channel band with possible increases during the day, the resistance level of 0.8811 will be the important level to watch. This situation may indicate that the upward trend could continue in the medium term. If the price breaks above all moving averages during the day, it could indicate that the upward trend may continue. The Relative Strength Index (RSI-14) has risen to 63 levels, signaling an upward trend alongside the Chaikin Money Flow (CMF-20). An increase in capital inflows could keep the CMF in the positive zone and indicate that buy-side transactions may continue.
In the event of an uptrend driven by macroeconomic data or positive news related to the Cardano ecosystem, the 0.9380 dollar level emerges as a strong resistance point. If this level is broken to the upside, the uptrend is expected to continue. In the event of a pullback due to adverse developments or profit-taking, the 0.7378 dollar level could be tested. A decline to these support levels could see an increase in buying momentum, potentially presenting an opportunity for an upward move.
Support levels: 0.7378 – 0.6938 – 0.6617
Resistance levels: 0.8811 – 0.9038 – 0.9380
Legal Notice
The investment information, comments, and recommendations contained herein do not constitute investment advice. Investment advisory services are provided individually by authorized institutions taking into account the risk and return preferences of individuals. The comments and recommendations contained herein are of a general nature. These recommendations may not be suitable for your financial situation and risk and return preferences. Therefore, making an investment decision based solely on the information contained herein may not produce results in line with your expectations.


