Technical Analysis
BTC/USDT
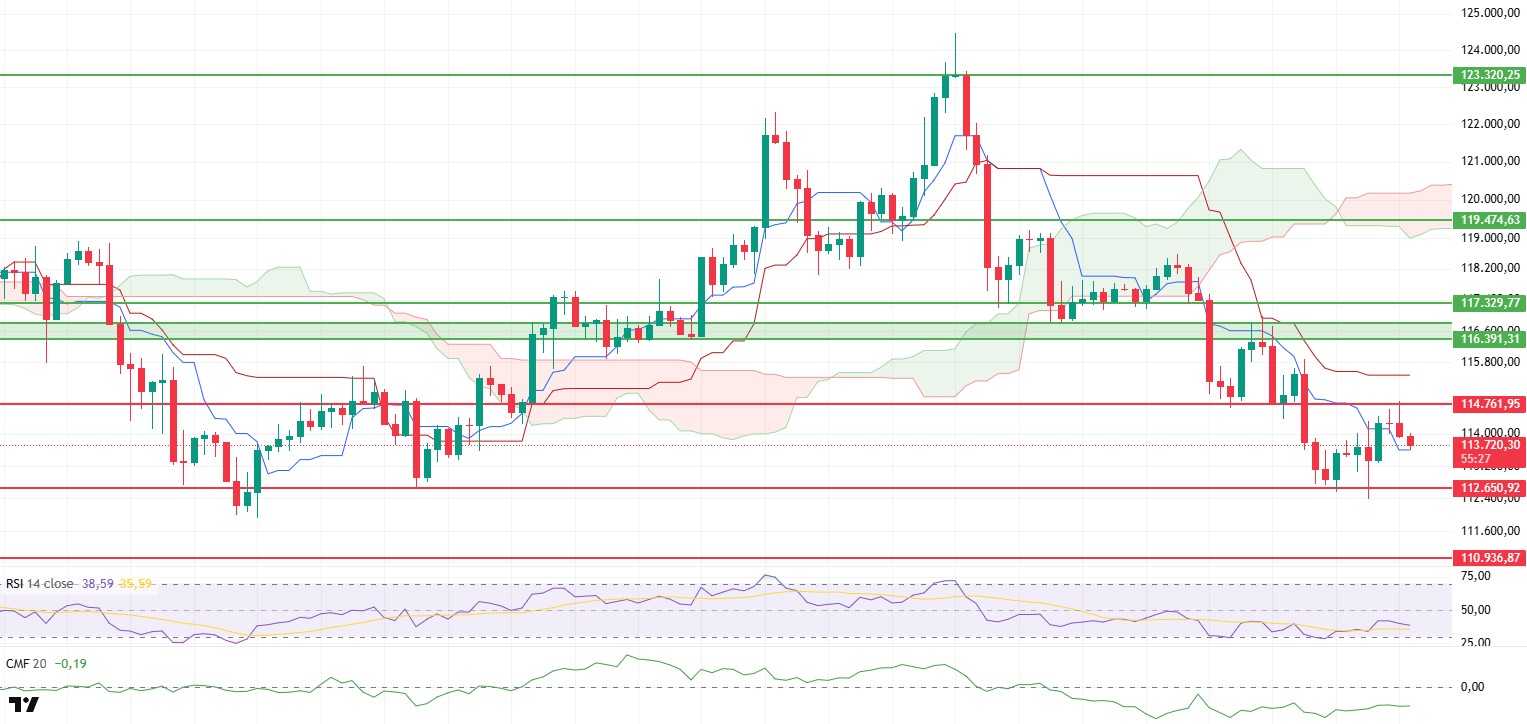
On the previous day, the BTC price rose to the 114,761-dollar level, which had been emphasized multiple times in analyses, but failed to break above this critical threshold. With increasing selling pressure, the price retreated to the 113,625 dollar support level. This movement indicates that a strong buyer base capable of supporting upward momentum has not yet entered the market. The sell-off that followed after the price tested the main resistance level underscores that the market remains structurally weak, with any upward movements likely to be limited.
Technical indicators also confirm this weak structure. The Chaikin Money Flow (CMF) indicator’s continued horizontal movement in the negative zone clearly indicates that there is no significant liquidity inflow into the market. This confirms that investors are acting cautiously and that there is no strong buying appetite, especially on the spot side. The CMF’s structurally negative trend indicates that the downtrend remains dominant not only in the short term but also in the medium term.
Although the price breaking above the Tenkan level in the Ichimoku indicator could be interpreted as a short-term recovery attempt, its failure to break above the main resistance level and subsequent pullback indicate that this movement was not sustainable. Additionally, the price remaining below the Kumo cloud and the cloud’s downward expansion clearly indicate that the overall technical structure continues to maintain a downward trend. This expansion in the Kumo cloud signals that selling pressure could intensify further. This structure particularly signals that short-term investors should exercise caution when opening upward positions.
Looking at the current chart, the price’s inability to sustainably break above the 114,761 dollar level indicates that downward risks are stronger. In this scenario, the price is likely to test the 112,600 dollar support level again. A break below this critical level could accelerate the downward movement and create a stronger selling wave in the market. However, if the price manages to break above the 114,761 dollar level, a strong recovery movement towards the resistance band between 116,300 and 117,600 dollars could be triggered. Any potential rise toward this region could be interpreted as a short-term relief reaction in the market; however, a sustained upward trend would require a clear strengthening of liquidity and positive structural indicators.
In general, the current market structure indicates that the BTC price may remain under pressure in the short term. Weak liquidity inflows and bearish signals from the Ichimoku indicator suggest that upward movements will continue to face selling pressure. Therefore, price movements in critical support and resistance zones should be closely monitored, with the 112,600 dollar level emerging as the most important breakout point in a potential downturn scenario.
Support levels: 112,650 – 110,936 – 107,886
Resistance levels: 114,761 – 117,329 – 119,474
ETH/USDT
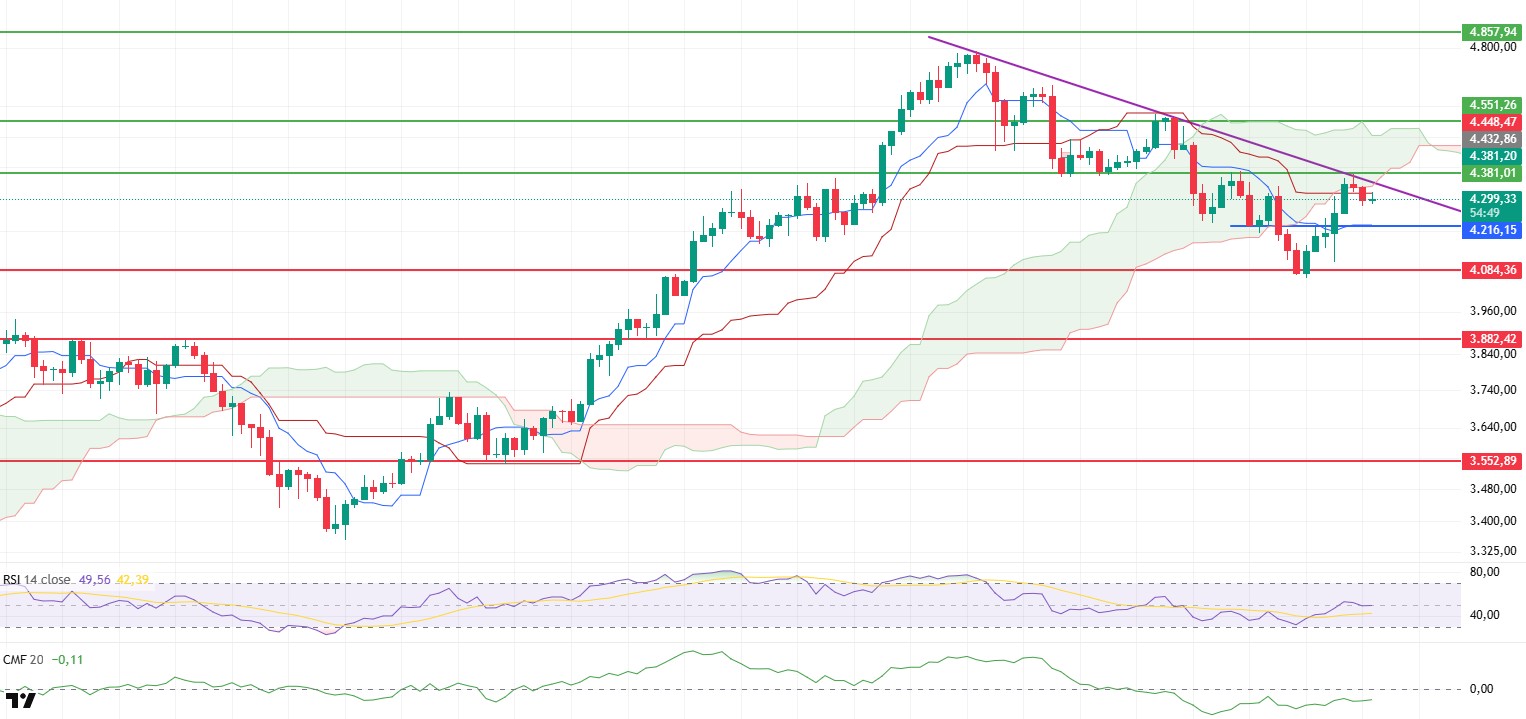
ETH experienced a strong buying wave yesterday evening, leading to a rapid rise and entering the cloud, but it failed to break through the key resistance level of $4,381 once again. The selling pressure from this area reversed the price’s direction downward, reinforcing the descending trend structure indicated by the purple line on the chart. This setup indicates that the price is still facing strong selling pressure at critical resistance levels and that any upward movements have not yet formed a sustainable structure.
Technical indicators and on-chain data are providing signals that support price movements. The Cumulative Volume Delta (CVD) indicator shows that there is significant buying activity in spot markets and that short-term demand is increasing. This scenario keeps the possibility of a short-term recovery on the table, despite the price struggling at critical resistance levels. The Chaikin Money Flow (CMF) indicator, while remaining in the negative zone, accompanies the upward movement, signaling the start of limited liquidity inflows. This outlook suggests that buyers are cautiously re-entering the market.
The Ichimoku indicator confirms that the weak structure is still in place. The price’s rejection within the kumo cloud and its subsequent drop below the kijun level indicate that the overall market structure remains negative. The inability to break above the kumo cloud suggests that the trend is still bearish and that any rallies are being met with selling pressure.
In terms of intraday price movements, the 4,345 dollar level of the kumon cloud boundary and the falling trend line stand out as critical thresholds. If this region is broken with strong buying volume, the price is expected to initiate a sharp upward movement in the short term and gain upward momentum. However, remaining below this level or new selling pressure from this area could reinforce the existing downward trend structure and deepen the price’s downward movement. Therefore, price behavior around the 4,345 dollar level will be decisive in determining the direction of the price in the coming period.
Top of Form
Below the Form
Support levels: 4,286 – 4,084 – 3,882
Resistance levels: 4,381 – 4,551 – 4,857
XRP/USDT
According to statements made by Bill Morgan yesterday evening in the US press, two important decisions are expected in October: the SEC’s final decision on spot XRP ETF applications and the OCC’s decision on Ripple’s application for a national bank license. Morgan stated that these two decisions could be a turning point in determining the future of XRP and its role in the global financial sector. The SEC has postponed its decision on spot XRP ETF applications submitted by CoinShares, Grayscale, and 21Shares for the second time, pushing the deadline to the end of October 2025. While this extension is possible under the current legal framework, the SEC’s upcoming decision is expected to result in a clear move toward either approval or rejection. An approval could enable XRP-linked regulated investment products to be listed on U.S. exchanges, significantly expanding access for institutional and individual investors. At the same time, the OCC’s decision on Ripple’s application for a national bank license could also greatly shape Ripple’s ability to provide financial services in the US and globally. According to Bill Morgan, October could be a “pivotal turning point” for Ripple, as both decisions could critically impact the token’s adoption and Ripple’s long-term strategy.
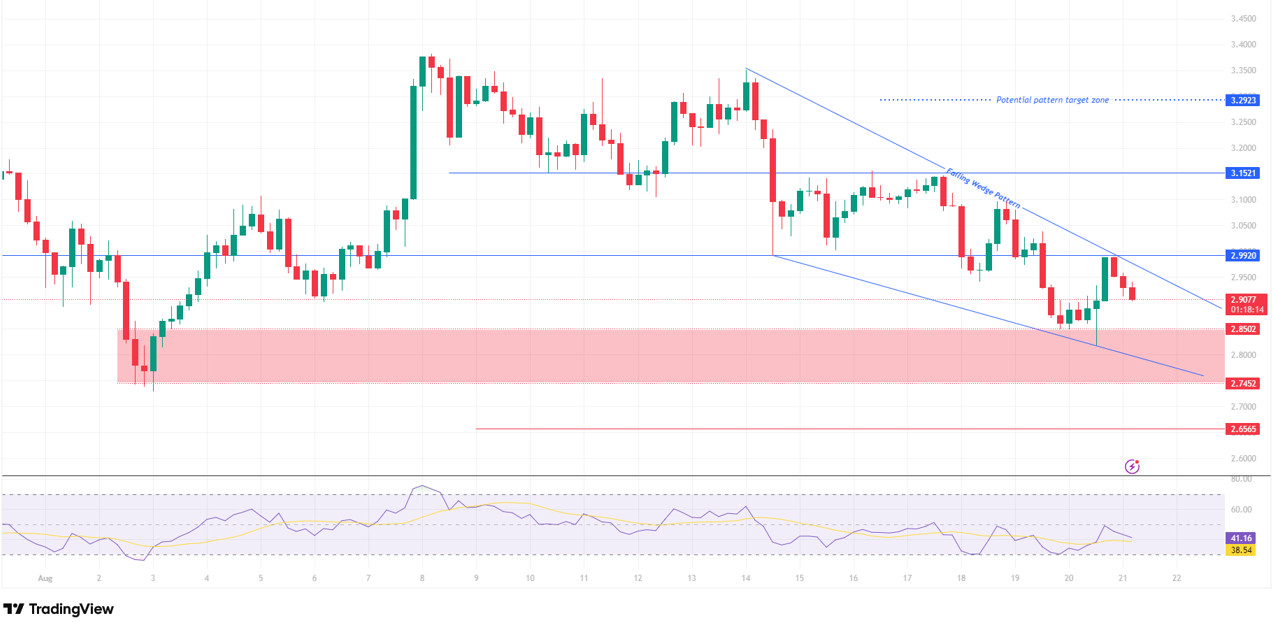
XRP fell by approximately 16% from $3.35 on August 14 to $2.81. We can see that the movements between these two prices took shape within a falling wedge formation. Despite testing the resistance line at the $3 level twice after rebounding from the $2.81 level, the price failed to break above it.
Looking at the current technical outlook, if the price encounters selling pressure again at the $3 level, there is a possibility of a pullback towards the $2.85–$2.74 range, which we have marked as the red-shaded area, in the short term. This price range can be considered a strong meeting area as it is both a horizontal support zone and the lower trend support of the formation. Buyer interest from these levels could push the price back to the upper band of the formation. In the event of a potential upward breakout, the price’s first target would be $3.15, and in the case of a stronger continuation move, the formation’s target zone of $3.29.
The Relative Strength Index (RSI) indicator is still in the negative zone. However, if the price retreats to the 2.74 dollar level, the RSI could enter the oversold zone and generate a recovery signal. Conversely, if the price breaks above the nearest resistance line, the RSI moving into the positive zone could increase demand pressure, triggering a momentum-driven rise toward target levels.
Support levels: 2.8502 – 2.7452 – 2.6565
Resistances: 2.9920 – 3.1521 – 3.2923
SOL/USDT
Rapper Kanye West launched the Solana-based meme coin ‘YZY’.
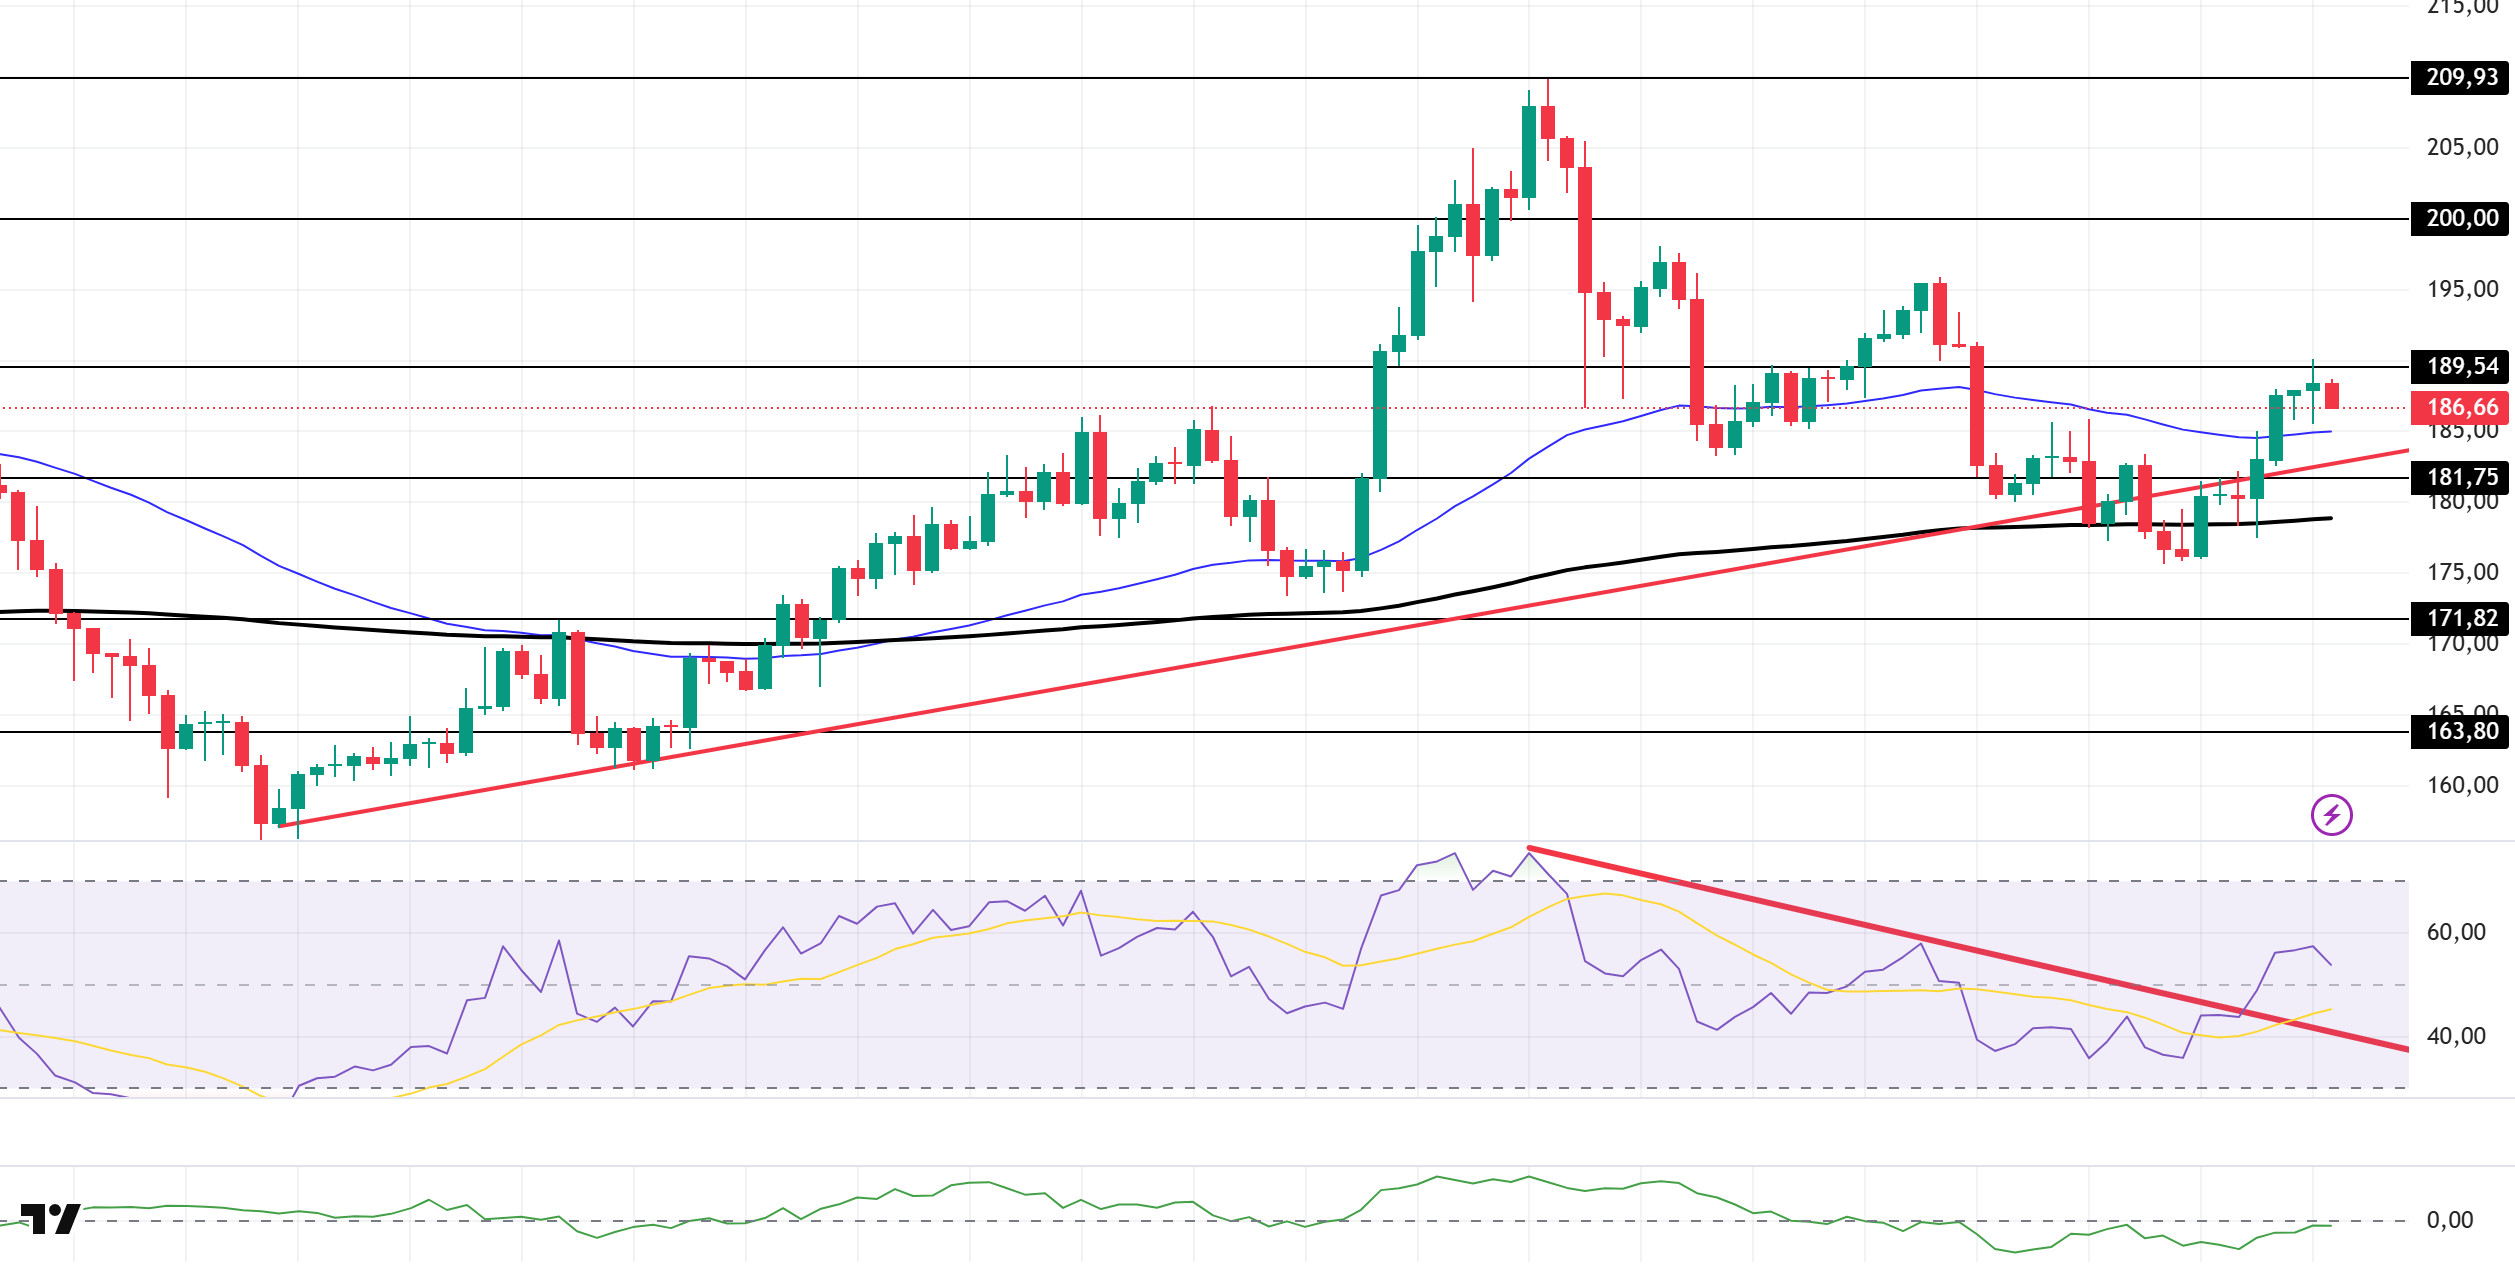
SOL experienced an upward price movement. The asset tested the 200 EMA (Exponential Moving Average – Black Line) moving average as support, gained momentum from there, and began to rise, trading above the upward trend line that began on August 2. This could create buying pressure. As of now, the price is testing the strong resistance level of $189.54. If it closes above this level, the upward trend could continue. In the event of a pullback, the $181.75 level should be monitored.
On the 4-hour chart, the 50 EMA (Blue Line) remains above the 200 EMA (Black Line). This indicates that the upward trend may continue in the medium term. Additionally, the price being above both moving averages suggests that the market is in an upward trend in the short term. The Chaikin Money Flow (CMF-20) has risen to a neutral level. However, an increase in money inflows could push the CMF into positive territory. The Relative Strength Index (RSI-14) broke above the downward trend that began on August 14 and moved into positive territory. This could create buying pressure. In the event of an upward movement driven by macroeconomic data or positive news related to the Solana ecosystem, the $200.00 level emerges as a strong resistance point. If this level is broken upward, the upward trend is expected to continue. In the event of developments in the opposite direction or profit-taking, pullbacks to the 181.75 dollar level could occur. A decline to these support levels could see an increase in buying momentum, potentially presenting an opportunity for an upward move.
Support levels: 181.75 – 171.82 – 163.80
Resistance levels: 189.54 – 200.00 – 209.93
DOGE/USDT
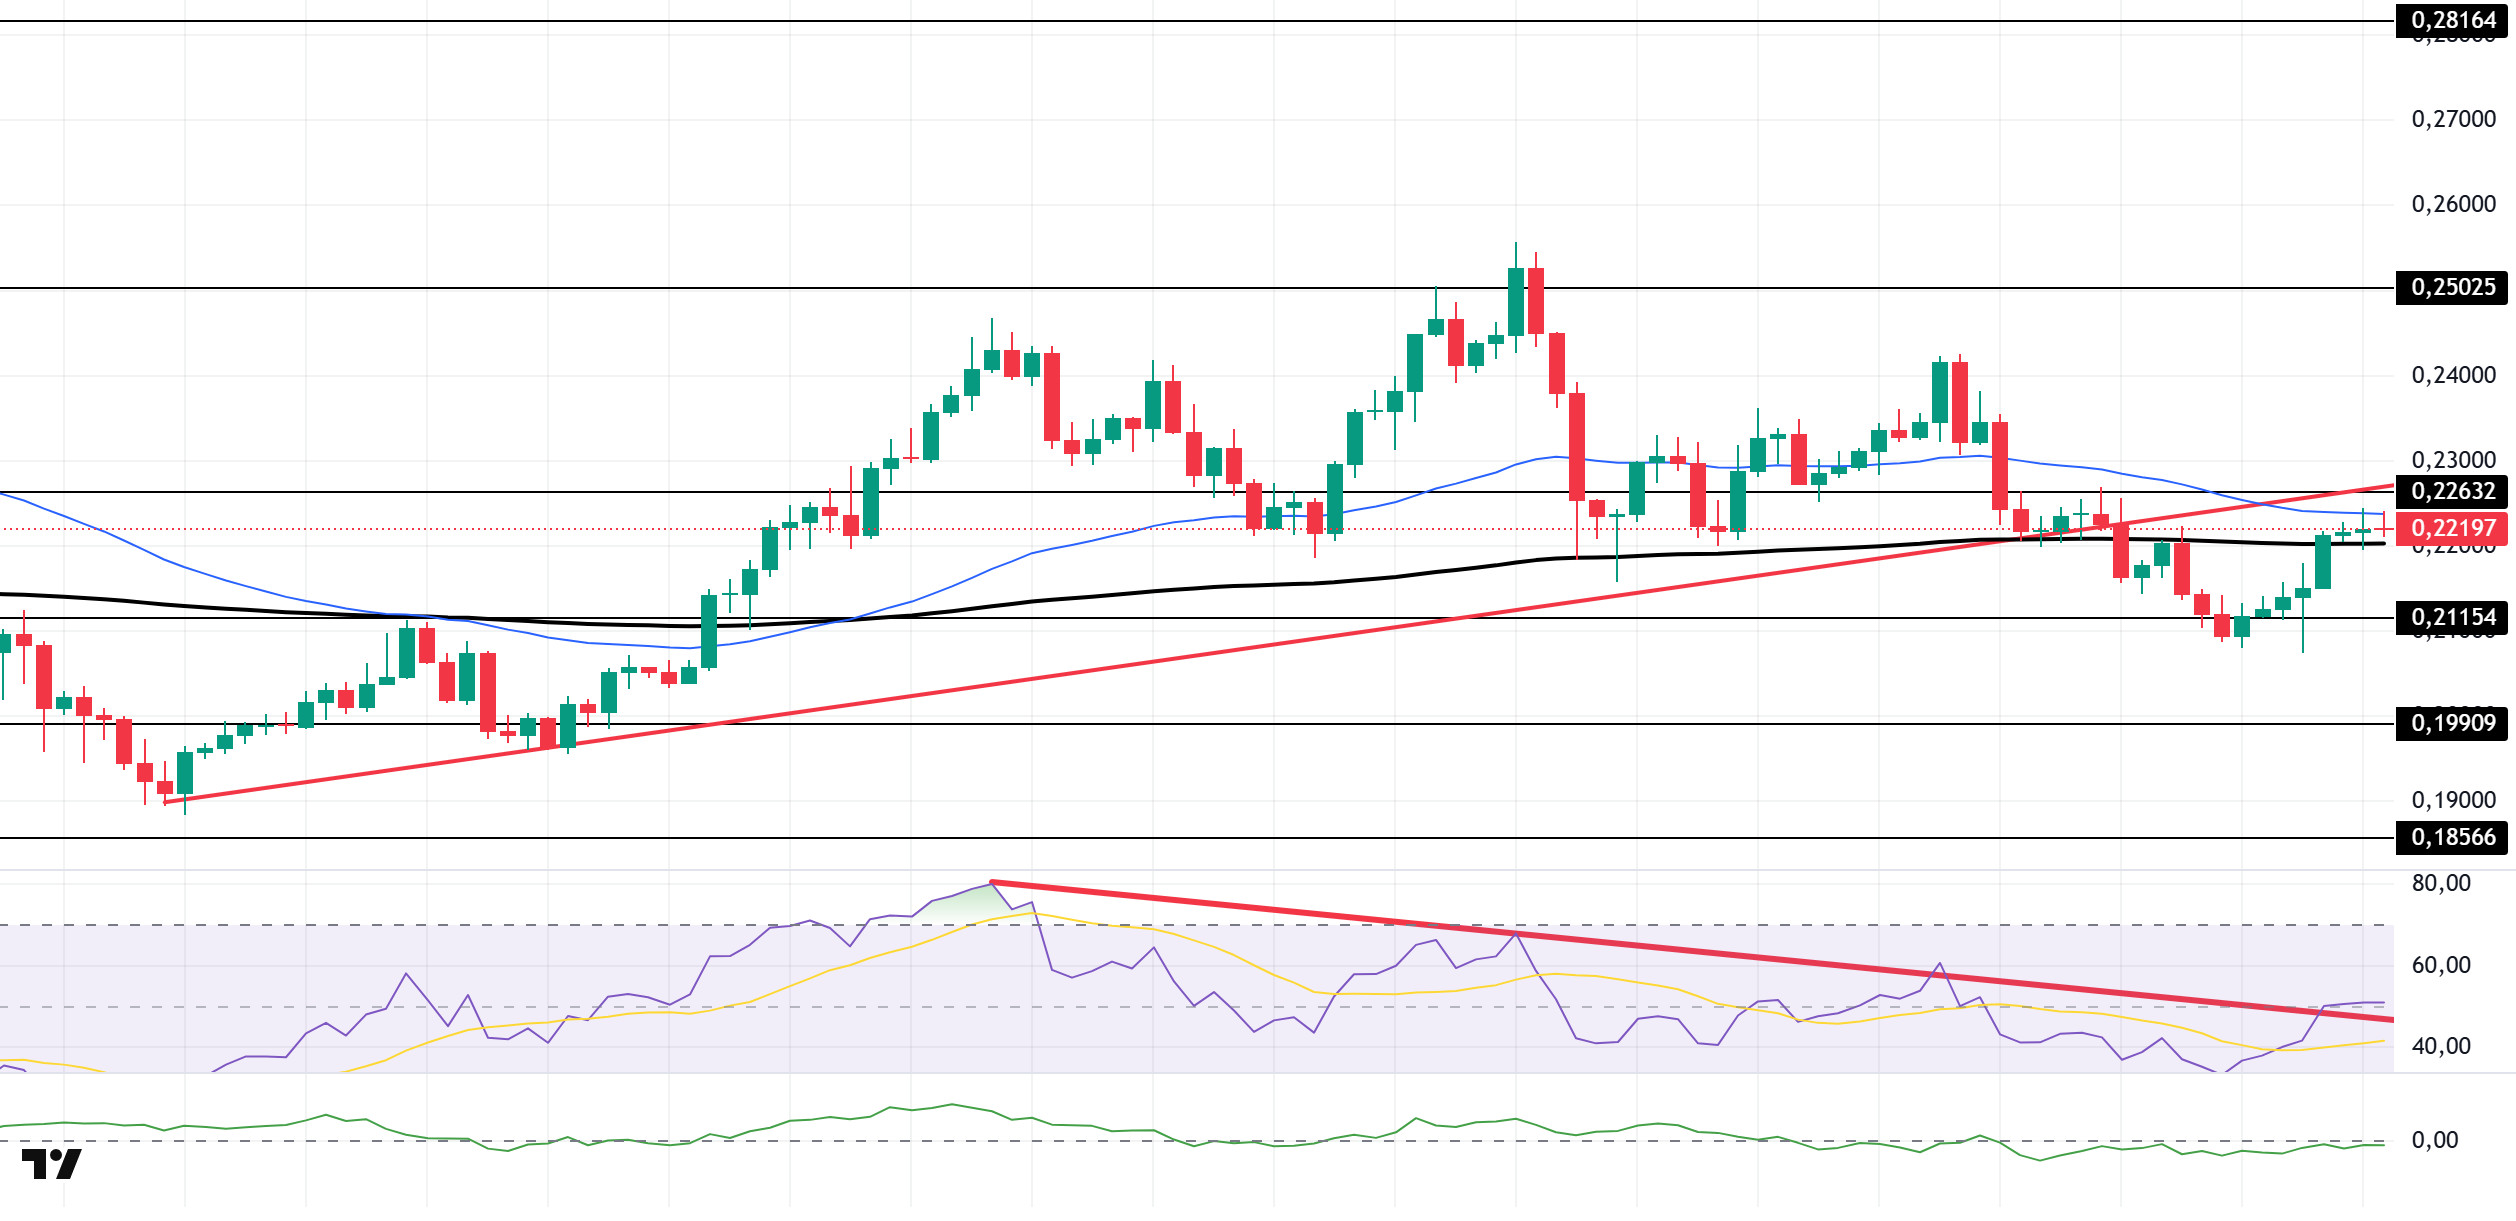
The DOGE price has experienced an uptrend. The asset continues to trade below the upward trend that began on August 2. This could keep selling pressure ongoing. As of now, the price has broken above the 200 EMA (Exponential Moving Average – Black Line) moving average and is testing the 50 EMA (Blue Line) moving average as resistance. If the price closes above this level, the 0.25025 dollar level can be monitored. In the event of a pullback, the 0.21154 dollar level should be monitored.
On the 4-hour chart, the 50 EMA (blue line) continues to remain above the 200 EMA (black line). This indicates that the asset is in an upward trend in the medium term. The fact that the price is between the two moving averages indicates that the asset is in a decision phase in the short term. Chaikin Money Flow (CMF-20) continues to remain in negative territory. Additionally, a decrease in money inflows could push the CMF further into the negative zone. The Relative Strength Index (RSI-14) has moved into the positive zone. At the same time, the indicator, which broke the downward trend that began on August 9, has maintained its momentum and continued to exert buying pressure. In the event of potential increases driven by political developments, macroeconomic data, or positive news flow within the DOGE ecosystem, the $0.25025 level emerges as a strong resistance zone. In the opposite scenario or in the event of negative news flow, the 0.21154 dollar level could be triggered. A decline to these levels could lead to increased momentum, potentially initiating a new upward wave.
Support levels: 0.21154 – 0.19909 – 0.18566
Resistance levels: 0.22632 – 0.25025 – 0.28164
LINK/USDT
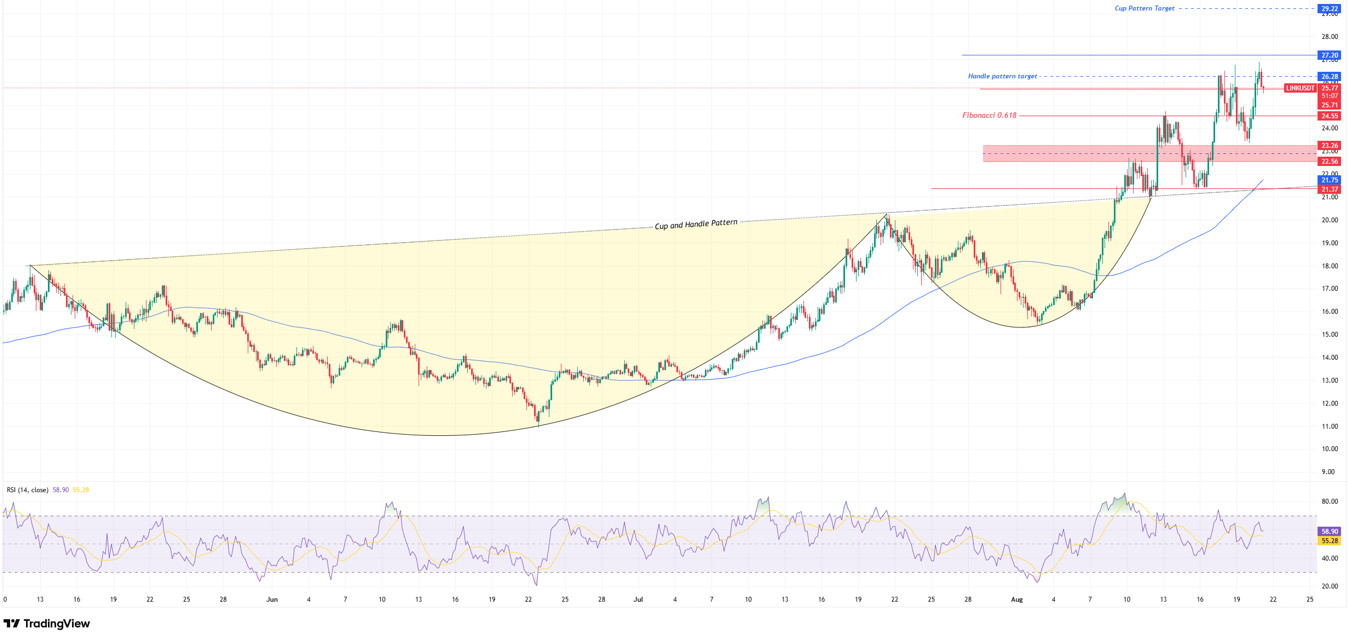
LINK, after breaking out of the cup-and-handle formation, gained strong upward momentum with support at the 24.55 level, rising to 26.28. This movement indicates that buyers’ desire to protect the breakout of the formation is quite strong. Although the price broke the consolidation process in the short term and continued its upward trend, the selling pressure encountered at this level triggered a downward movement again.
In an upward scenario, if the price breaks above 26.28 and then 27.20, it could bring our cup target of 29.72 dollars into focus. In the opposite scenario, if the price remains below the 25.71 support level, selling pressure could increase. In this case, there is a possibility of a pullback to the Fibonacci 0.618 retracement zone at the 24.55 level. Further down, the 21.40–21.50 band remains the main defense line, acting as both a trend support and a horizontal support. The Relative Strength Index (RSI) indicator is at 58 levels, indicating that buyers remain active in the market. However, for the upward momentum to gain strength, it is important for the RSI to rise above the 60 level.
Support levels: 24.55 – 23.26 – 21.37
Resistance levels: 25.75 – 26.28 – 29.22
ADA/USDT
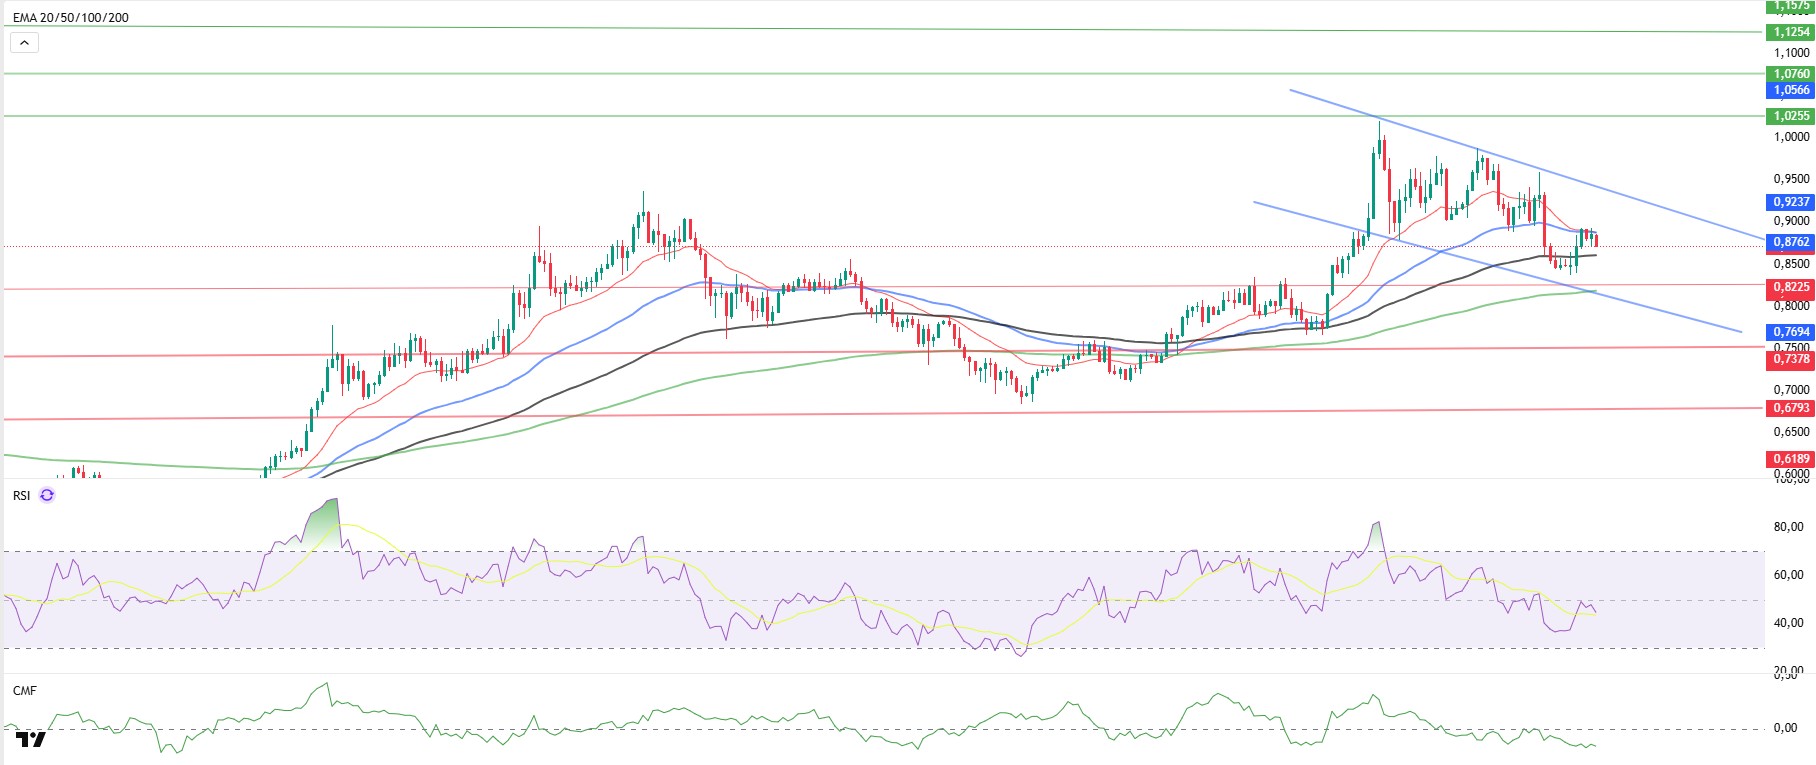
ADA gave its first reaction to a decline by crossing the 50 (Blue Line) and 20 (Red Line) at the 0.8738 level in 4 hours. The price remaining below the 100-day (Black Line) Exponential Moving Average (EMA) is putting downward pressure on the price. The symmetrical triangle formation failed to materialize, and ADA’s price entered a downtrend due to the sell-off in cryptocurrencies yesterday.
ADA, which began to recover from the support zone as of today, continues to trade in the 0.8762 – 0.8800 band. If it breaks above the descending channel again on the 4-hour chart, it is expected to remain above the 0.9237 level. The Relative Strength Index (RSI-14) has dropped to 44 levels and continues to move in the sell zone, while the Chaikin Money Flow (CMF-20) has fallen to -0.14 levels, confirming the downtrend signal. The decline in capital inflows may keep the CMF in the sell zone and exert a downward pressure on the price. In the event of positive macroeconomic data or news related to the Cardano ecosystem, the $1.0255 level could emerge as a strong resistance point. In the event of a decline, the 0.8241 level will be the key support level to monitor.
Support levels: 0.8241 – 0.7771 – 0.7360
Resistance Levels: 1.1141 – 1.0603 – 0.9936
Legal Notice
The investment information, comments, and recommendations contained herein do not constitute investment advice. Investment advisory services are provided individually by authorized institutions taking into account the risk and return preferences of individuals. The comments and recommendations contained herein are of a general nature. These recommendations may not be suitable for your financial situation and risk and return preferences. Therefore, making an investment decision based solely on the information contained herein may not produce results in line with your expectations.