
Technical Analysis
BTC/USDT
The US Department of Labor’s Office of the Inspector General reviewed the data collection and reporting processes of the BLS. US August PPI remained below expectations at 2.6% yoy, while the 10-year bond auction attracted strong demand. At the Fed, Lisa Cook was allowed to remain in office, while Miran’s nomination was approved by the Senate Committee. Trump asked the EU for higher tariffs on China and India; Mexico plans a 50% tax on imported cars from China. The possibility of bipartisan cooperation for the crypto market structure law is on the agenda in the Senate.
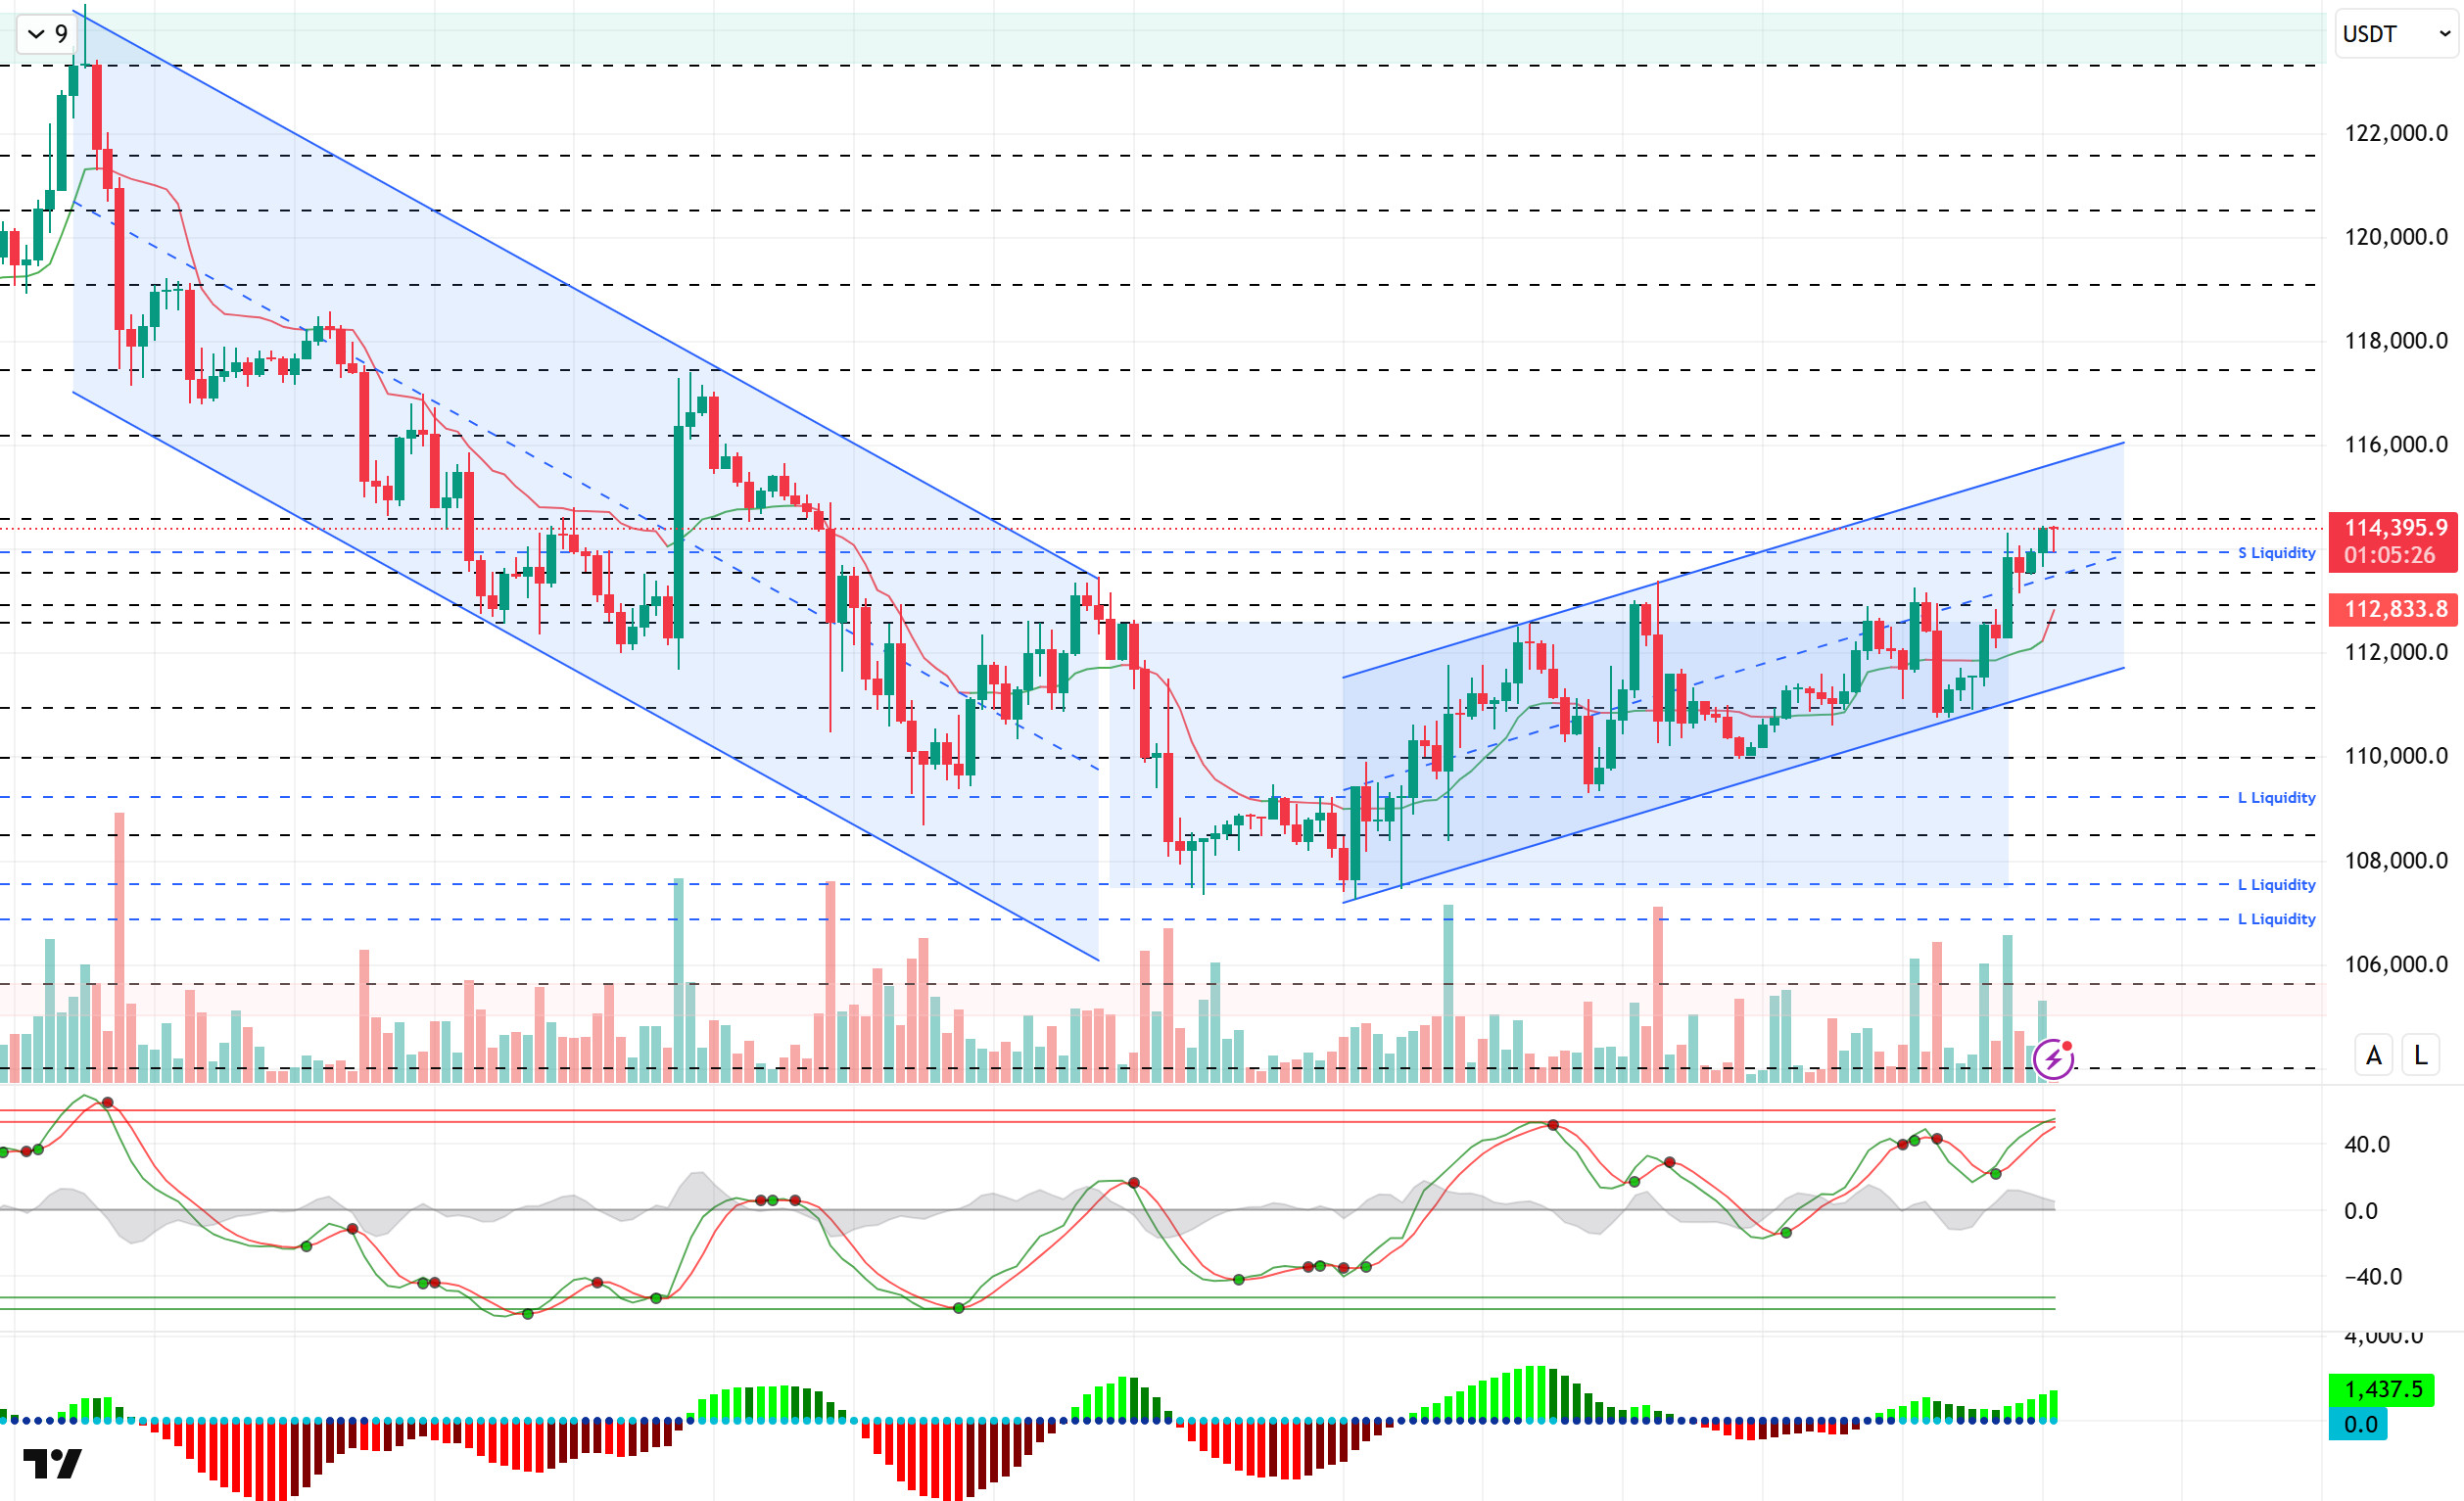
Looking at the technical outlook, BTC, which has been moving within the horizontal band range for a long time, has reached 114,300 levels by creating a minor bullish channel. At the time of writing, BTC, which maintains its gains, continues to trade at 114,300.
Technical indicators have once again reached the overbought zone, with the Wave Trend oscillator (WT) giving a buy signal, pointing to a trend reversal near the channel mid-band. On the Squeeze Momentum (SM) indicator, the histogram regained momentum in the positive area. The Kaufman moving average is currently moving below the price at 112,800.
Looking at the liquidity data, short-term accumulating sell trades were liquidated at 113.200, while broader timeframe sell accumulation was liquidated above 114.000. With the recent rise, sell trades reaccumulated around 115,000. The buying tier, on the other hand, provides an intense accumulation at the 113,000 level in the short term, while the 108,000 – 109,000 band continues to be the accumulation zone in the long term.
In summary, although the loss of the optimistic mood in recent days with fundamental developments, the interest rate cut discussions among Fed members, tariffs remaining on the agenda with the new distribution of duties and political tensions stand out as factors that put pressure on the price, US PPI data caused an increase in risk appetite. Following the favorable backdrop created by the technical structure, the price completed the consolidation within the horizontal band range for a long time and came to the 114,000 target zone with the minor bullish channel. When we look at the liquidity data, while selling transactions were liquidated, buying transactions gained weight and confirmed the rise. In order for the rise to be sustainable in the next period, we will follow the price to maintain the bullish channel it has formed. Closures above 112,600, which we follow as a reference area, are seen as critical for the continuation of the rise, while the minor support band 113,500 – 113,000 will be followed in a possible selling pressure.
Supports 114,000 – 113,500 – 112,600
Resistances 115,000 – 116,100 – 117,400
ETH/USDT
SharpLink transferred $379 million in stablecoins to Galaxy Digital’s OTC wallet. Onchain Lens reported withdrawing 7,766 ETH from a new address centralized exchange, bringing its total holdings to 15,543 ETH. Bitmine increased its reserve to 2,126,018 ETH with 46,255 ETH from Bitgo. The Ethereum network experienced a major slashing event on 39 validators connected to the SSV Network. On the same day, Ethereum spot ETFs saw inflows of $172 million, led by ETHA with $74.5 million and FETH with $49.5 million.
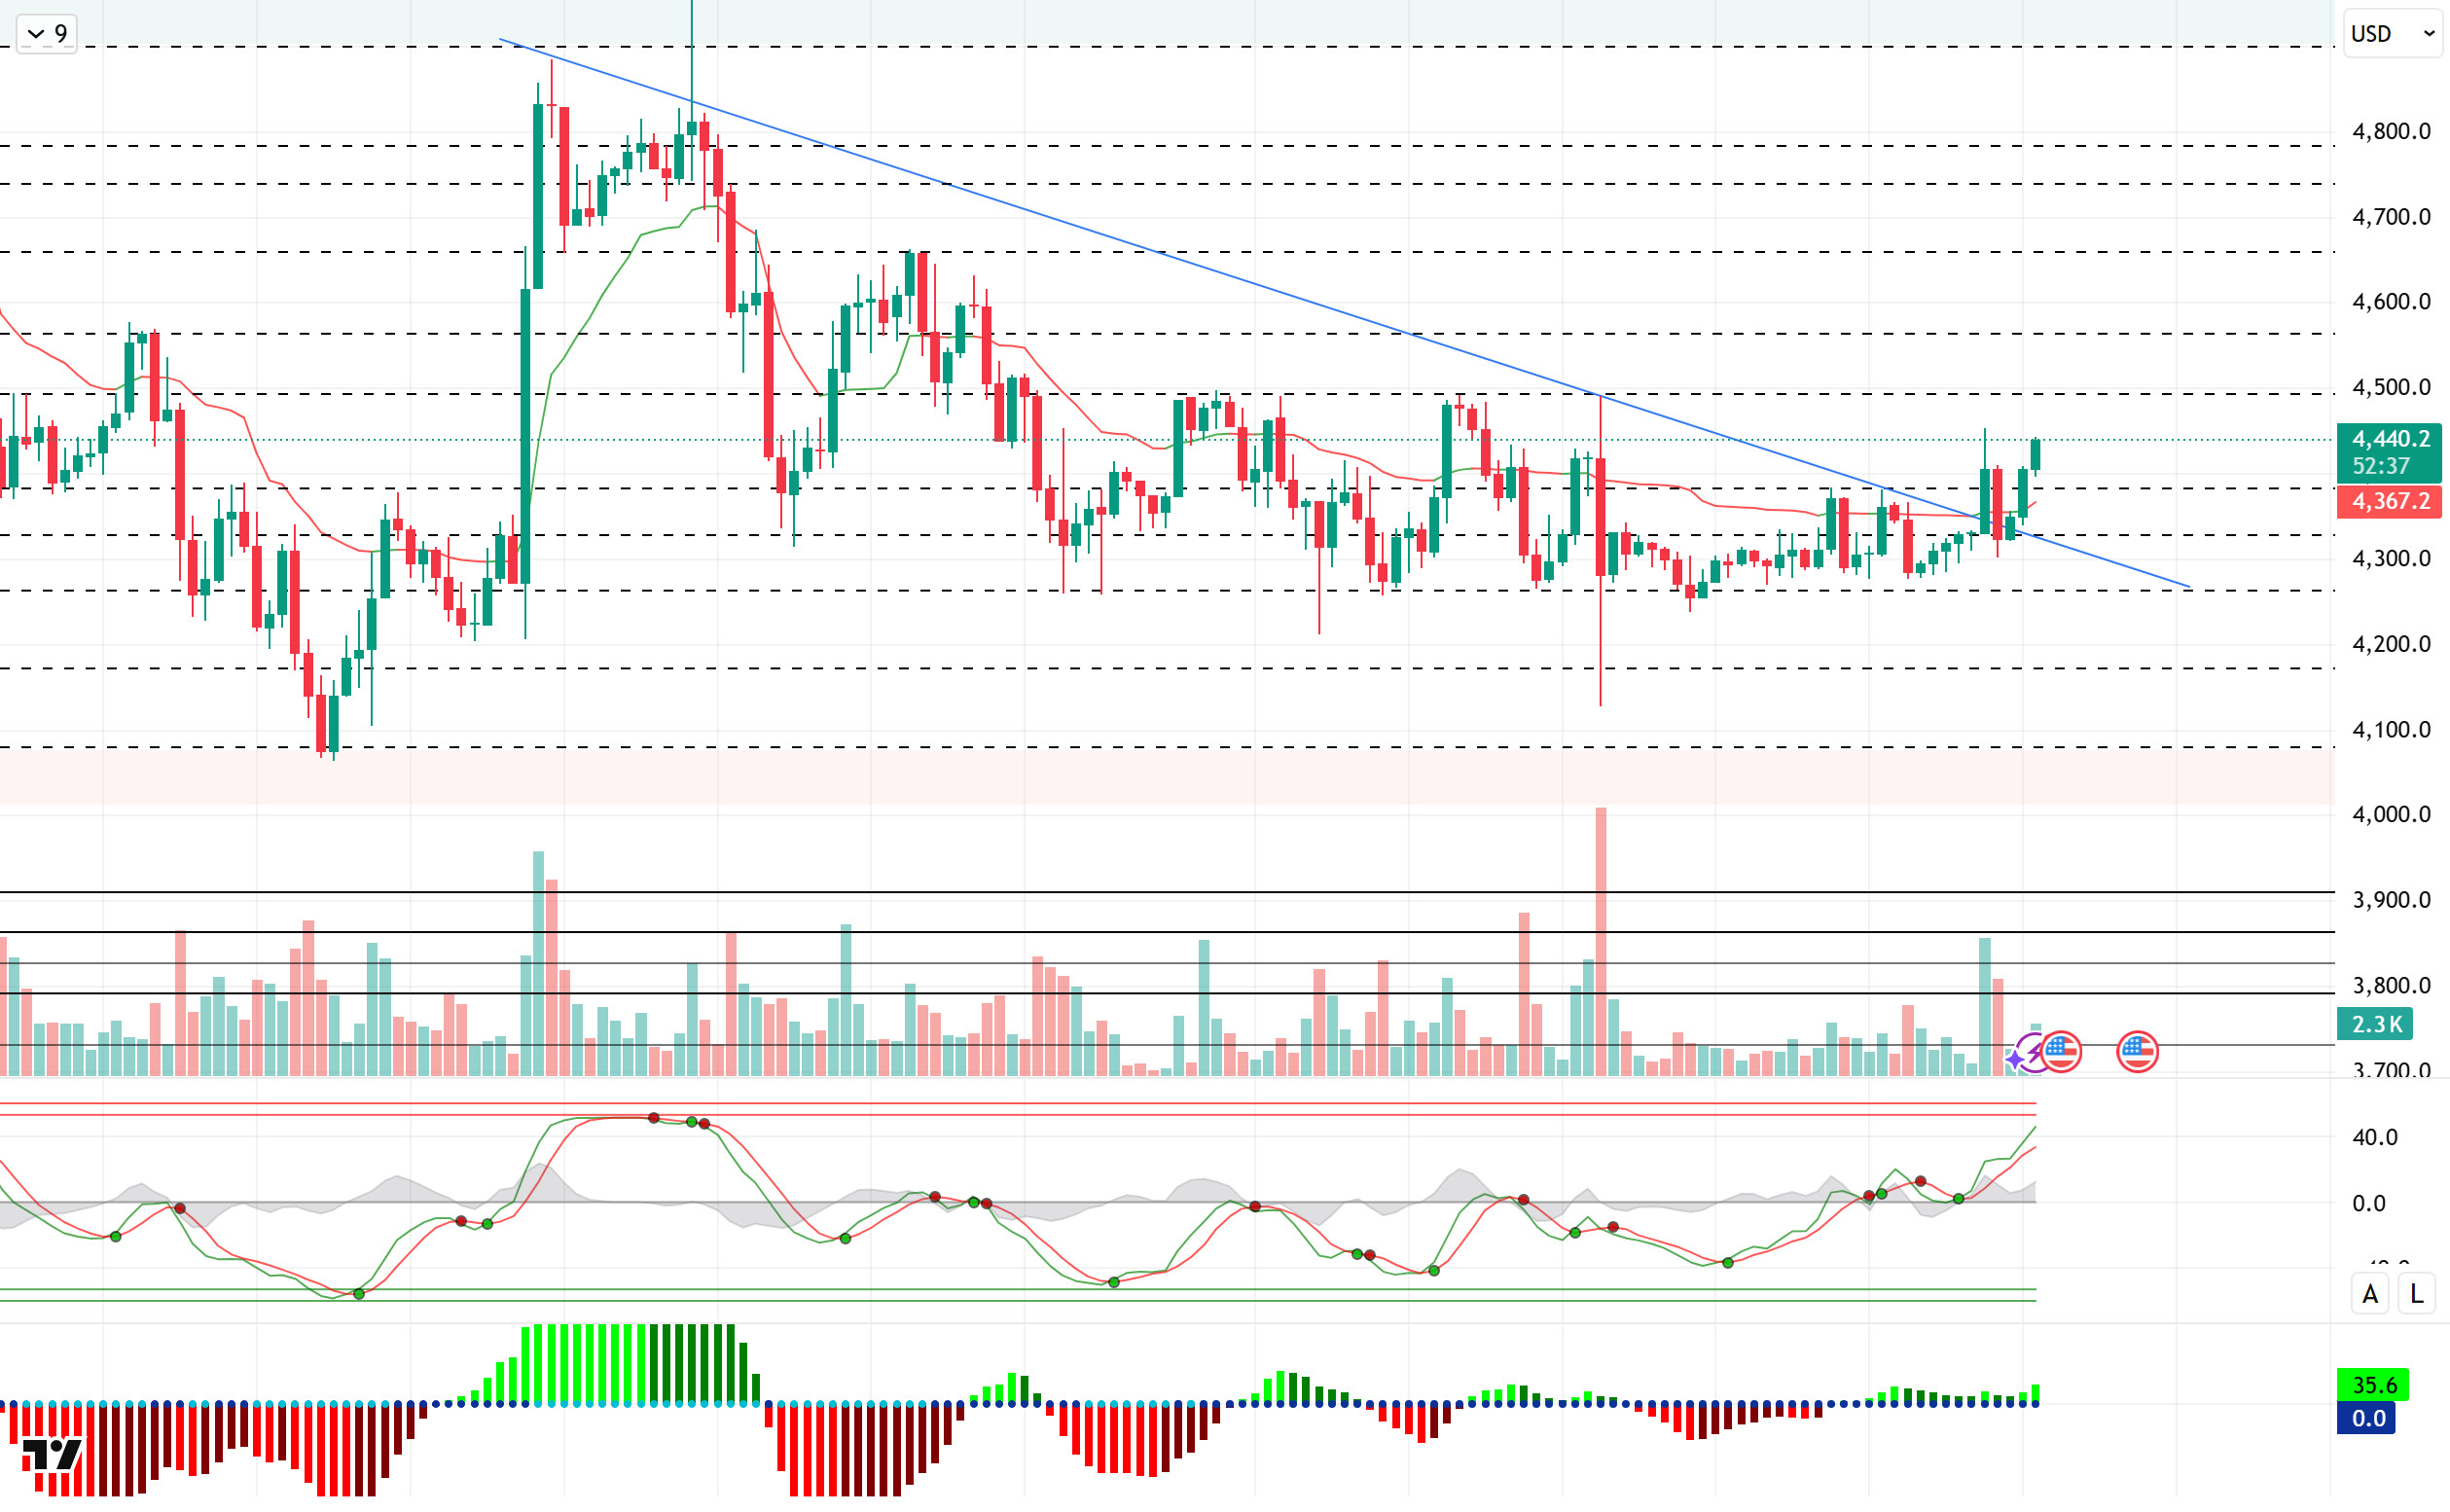
When we look at the technical outlook, ETH broke through the falling trend structure in the previous analysis and pinned the needle from 4,300 to 4,460. Then, ETH, which once again fell to the 4,300 level with selling pressure, recovered again and exceeded the 4,400 level. At the time of writing, it continues to trade at 4,440.
Technical indicators, Wave Trend oscillator (WT), after the weakening sell signal in the mid-channel band, has turned back to the overbought zone, leaving a buy signal in its place.In the Squeeze Momentum (SM) indicator, the histogram is trying to regain momentum in the positive area. The Kaufman moving average is currently moving below the price at 4.367.
When we look at the liquidity data, while the short and long term sparsity of sell trades continues to attract attention, it is seen that with the recent rise, buy trades have accumulated intensively at the 4,260 level.
To summarize, ETH continues to move in line with the general developments in the market. When we look at the fundamental dynamics specific to ETH, it is seen that institutional interest continues as ETF inflows turn positive again. On the technical side, while the price’s recovery effort continues, the intensity of buy trades is increasing while the sparsity of sell trades in Liquidity data is noteworthy. In this context, the effort to hold in this region will be followed in ETH, which came above the 4,400 level with the break of the falling trend structure. The momentum that may occur above this level may move the price to 4,490 and then 4,570 resistance zone. On the other hand, in case of a break of 4,385 in possible pullbacks, 4,330 will be followed as a support area. If this support is broken, the falling trend structure may deepen further, causing the price to fall to the liquidity area of 4,260.
Supports 4,385 – 4,330 – 4,260
Resistances 4,490 – 4,570 – 4,650
XRP/USDT
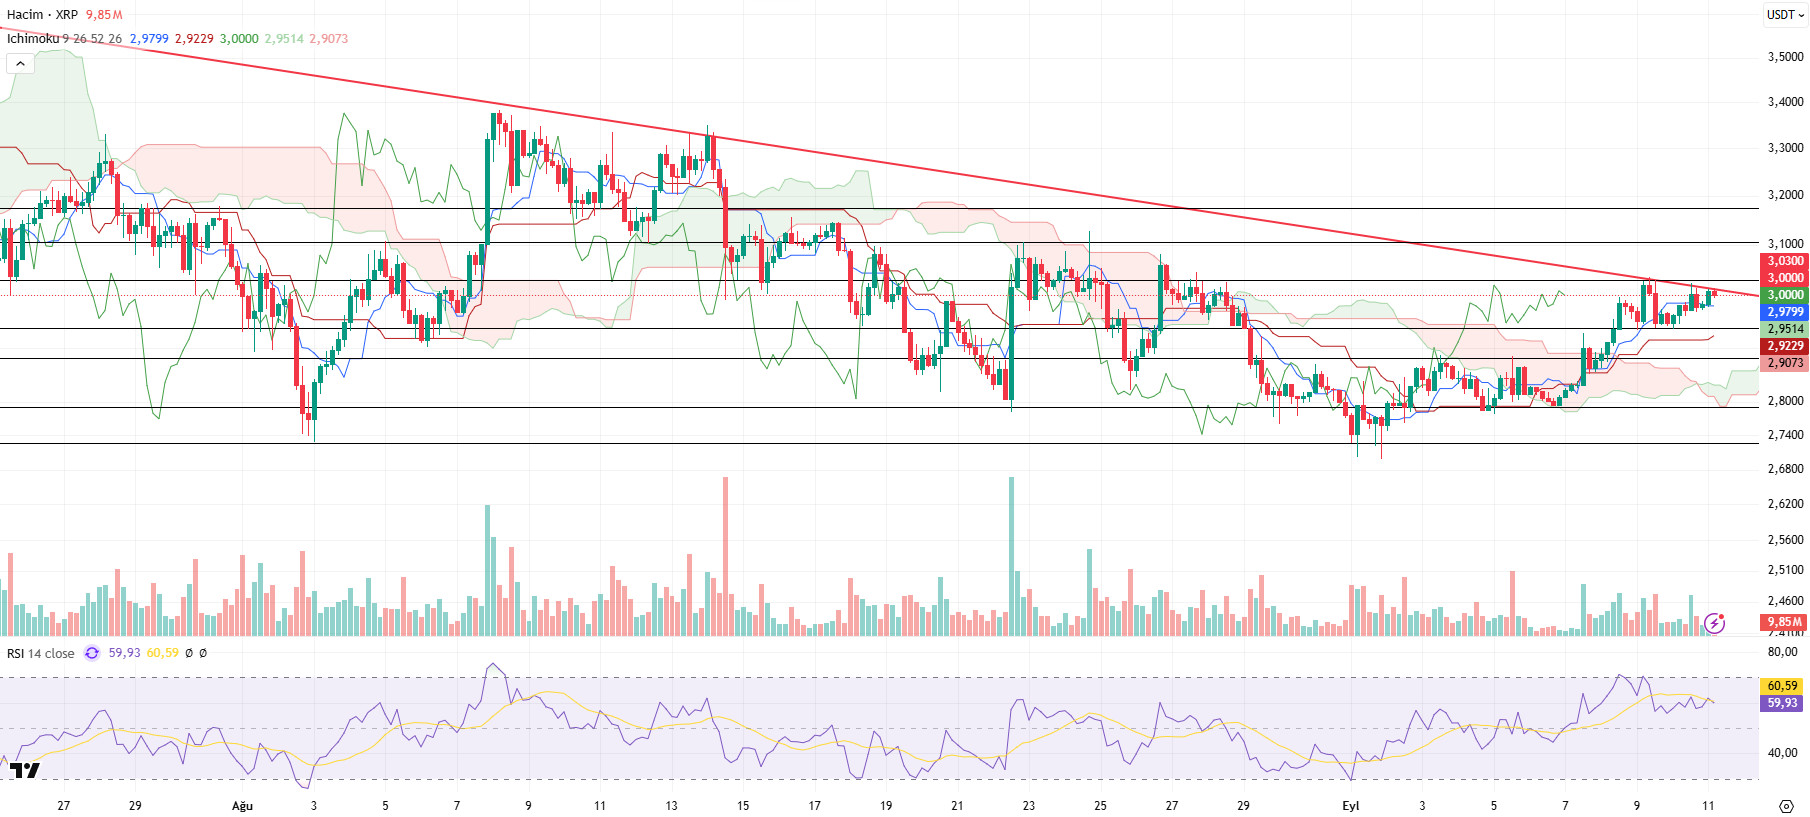
Yesterday, with the effect of the news flows on the fundamental side, XRP increased its positive momentum, which is currently above the Ichimoku indicators, with the support it received from the $ 2.9383 level and managed to rise to the downtrend. The fact that XRP maintains its momentum and persists above the downtrend indicates that the price will continue its accelerated upward trend.
From a technical perspective, XRP/USDT fell as low as $2.7270 on the four-hour chart with the recent pullbacks and regained bullish momentum with the support it received from this level. With this move, XRP recovered to the downtrend zone of $3.0000.
When the technical indicators for XRP/USDT, which is currently trading at $3.0000, are analyzed, the Relative Strength Index (RSI) has fallen below the average with the recent pullbacks, falling to 55 and turning its direction down. However, as the price found support at the $2.7270 level, RSI turned up again. This technical structure indicates that upward movements may continue in the short term.
Within the framework of the current outlook, if the buying momentum is maintained, it is expected to test the resistance level of 3.0300 dollars by breaking the downtrend in the first place. If this level is exceeded, it is possible that the price may turn towards the levels of 3.1050 dollars and 3.1750 dollars, respectively. On the other hand, if the downtrend cannot be overcome and selling pressure increases, the price is likely to retreat back to the support of $ 2.9383. If this level is broken downwards, the levels of $ 2.8800 and $ 2.7900 stand out as critical follow-up zones.
Supports: 2,9383 – 2,8800 – 2,7900
Resistances: 3,0300 – 3,1050 – 3,1750
SOL/USDT
SEC delays Franklin Spot Solana ETF.
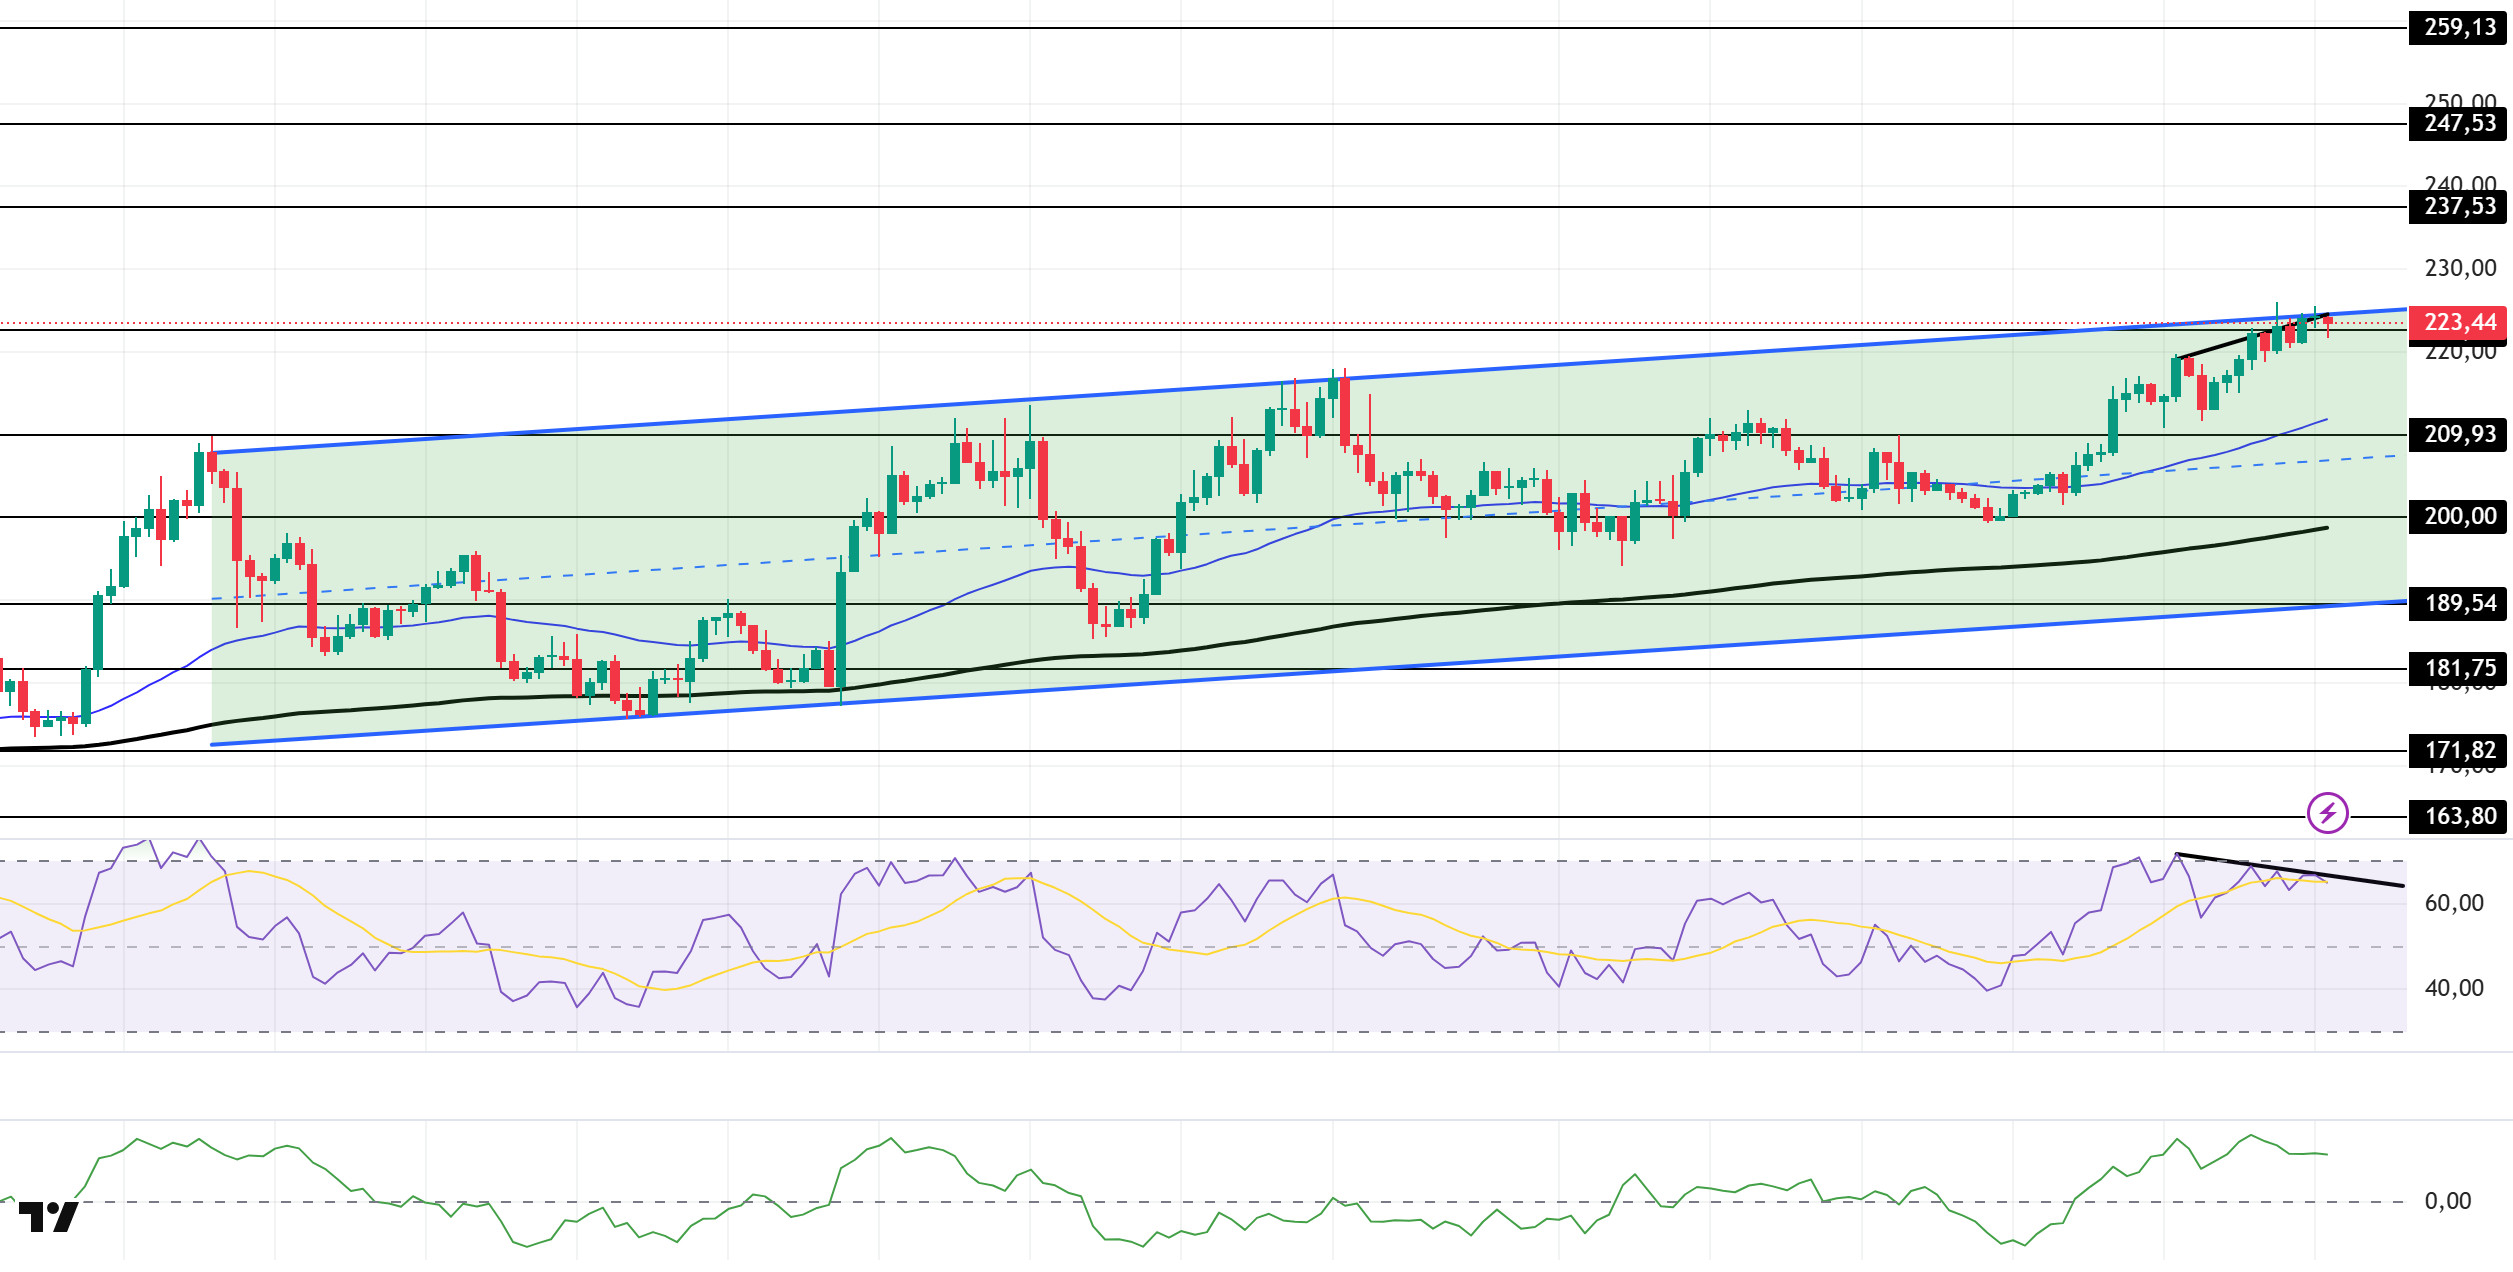
SOL price was flat. The asset continues to appreciate within the uptrend that started on August 14. If the price, which is currently testing the ceiling level of the rising trend pattern, breaks this upward, the $ 237.53 level can be followed. In retracements, the 50 EMA (Exponential Moving Average – Blue Line) moving average can be followed.
On the 4-hour chart, it continued to be above the 50 EMA (Exponential Moving Average – Blue Line) and the 200 EMA (Black Line). This suggests that the uptrend may continue in the medium term. At the same time, the fact that the price is above both moving averages suggests that the market is bullish in the short term. Chaikin Money Flow (CMF-20) continued to be in positive territory. However, an increase in inflows may keep CMF above the positive zone. Relative Strength Index (RSI-14) continued to be in positive territory. However, there is a negative divergence. This could trigger profit selling and a pullback. The $237.53 level stands out as a strong resistance point in case of an uptrend on the back of macroeconomic data or positive news on the Solana ecosystem. If this level is broken upwards, the rise can be expected to continue. If there are pullbacks due to contrary developments or profit realizations, the $ 209.93 level can be tested. In case of a decline to these support levels, the increase in buying momentum may offer a potential bullish opportunity.
Supports 222.61 – 209.93 – 200.00
Resistances 237.53 – 247.53 – 259.13
DOGE/USDT
Rex-Osprey’s DOGE ETF could launch today. 21Shares filed an amended form S-1 for the DOGECOIN ETF.
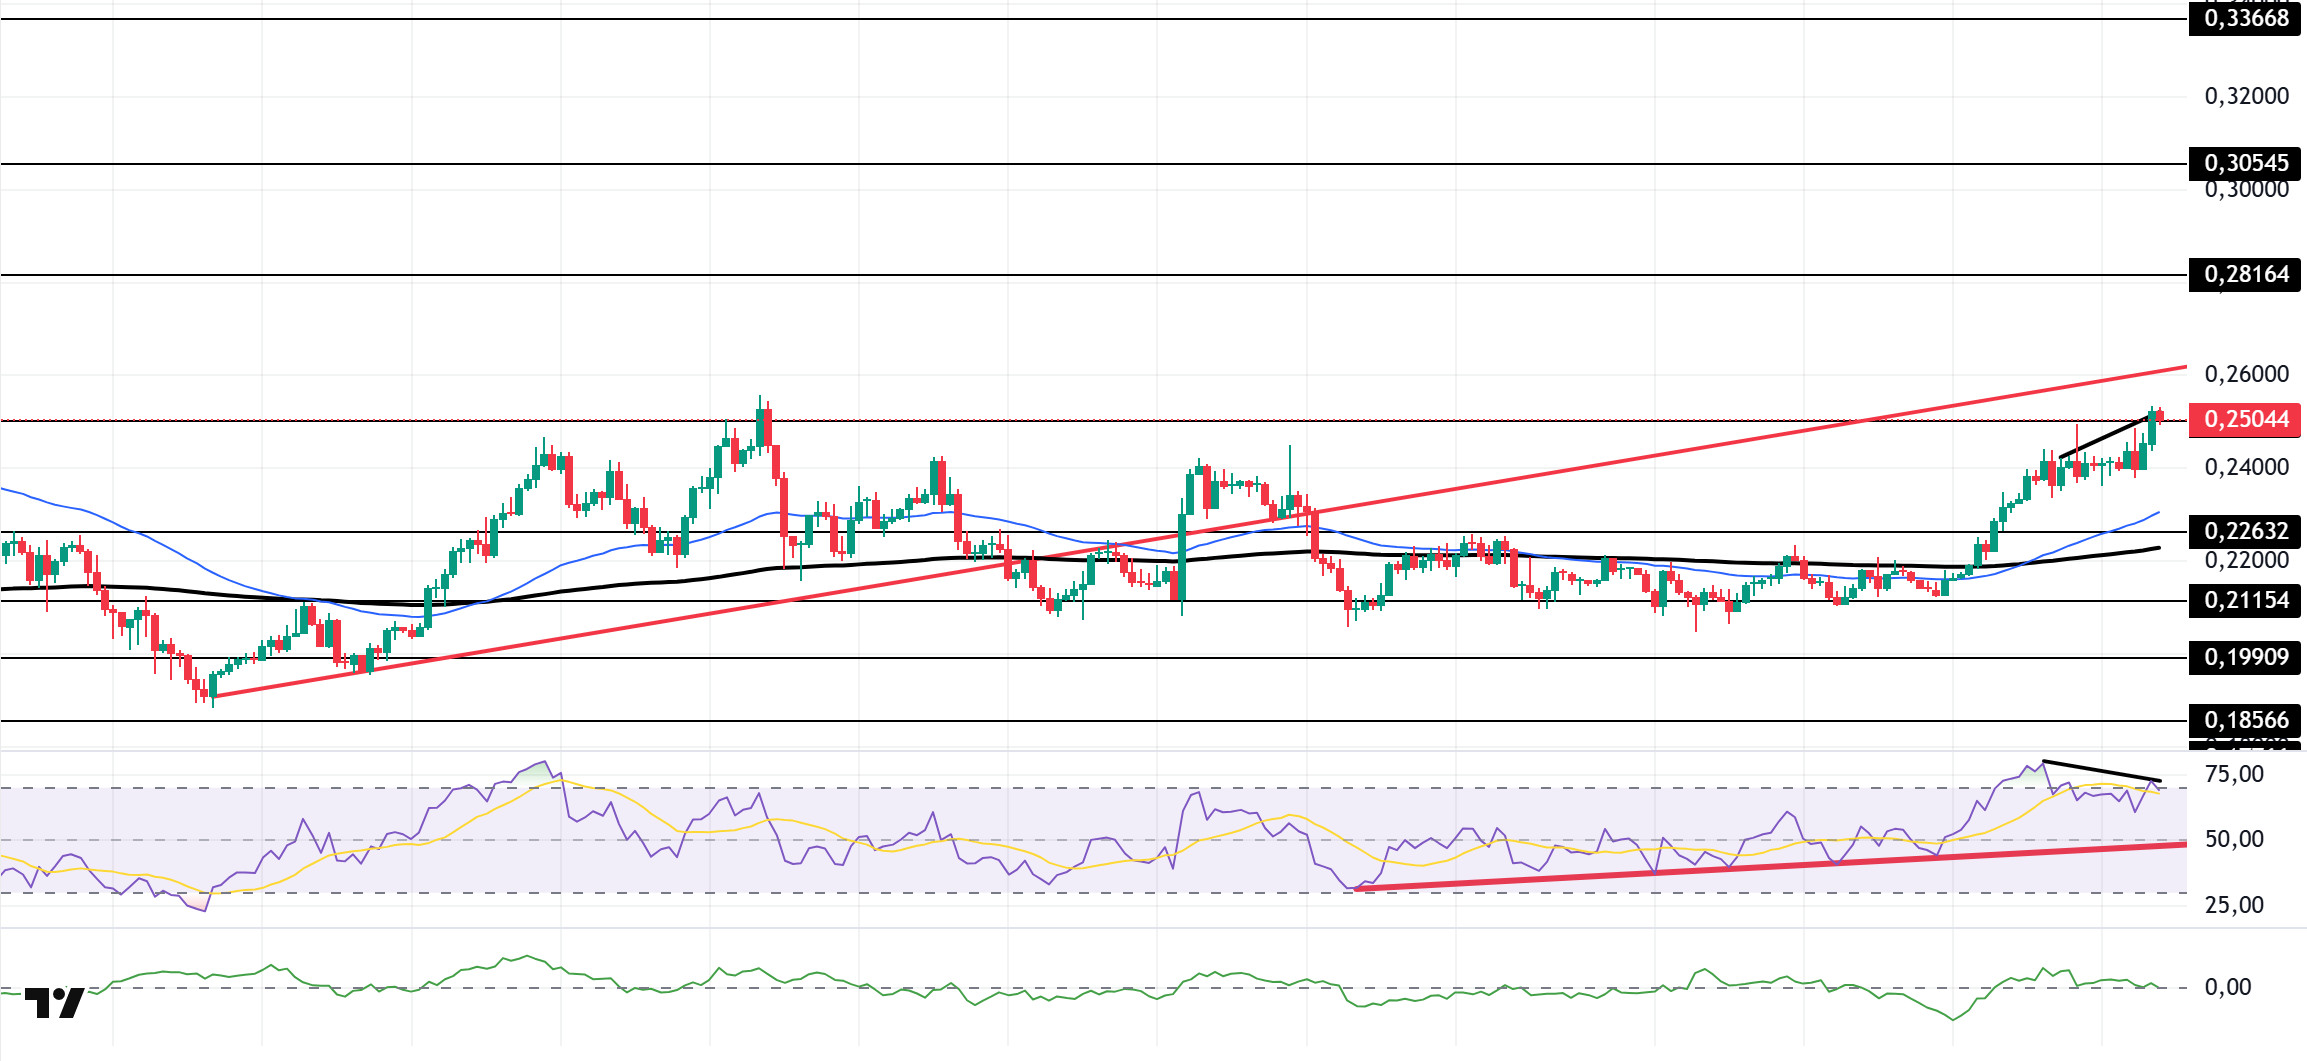
DOGE price continued its uptrend. The asset continued to be in the lower zone of the rising line that started on August 3. Above the 50 EMA (Exponential Moving Average – Blue Line) and 200 EMA (Black Line) moving averages, the price maintained its momentum and continued its uptrend. The price, which is currently testing the $0.25025 level as support, may test the rising line as resistance if it sees support from here. In case of a possible pullback, the $0.22632 level may be triggered.
On the 4-hour chart, the 50 EMA (Blue Line) remained above the 200 EMA (Black Line). This indicates that the uptrend continues in the medium term. The fact that the price is above both moving averages suggests a strong bullish bias in the short term. Chaikin Money Flow (CMF-20) declined to neutral. In addition, an increase in money inflows may move CMF back into positive territory. Relative Strength Index (RSI-14) retreated slightly from the overbought zone. At the same time, it remains in the upper zone of the uptrend that started on August 26. This signaled that momentum may continue. However, negative divergence may cause pullbacks. The $0.28164 level stands out as a strong resistance zone in the case of possible rises in line with political developments, macroeconomic data or positive news flow in the DOGE ecosystem. In the opposite case or possible negative news flow, the $0.22632 level may be triggered. In case of a decline to these levels, the momentum may increase and a new bullish wave may start.
Supports 0.25025 – 0.22632 – 0.21154
Resistances 0.28164 – 0.30545 – 0.33668
BNB/USDT
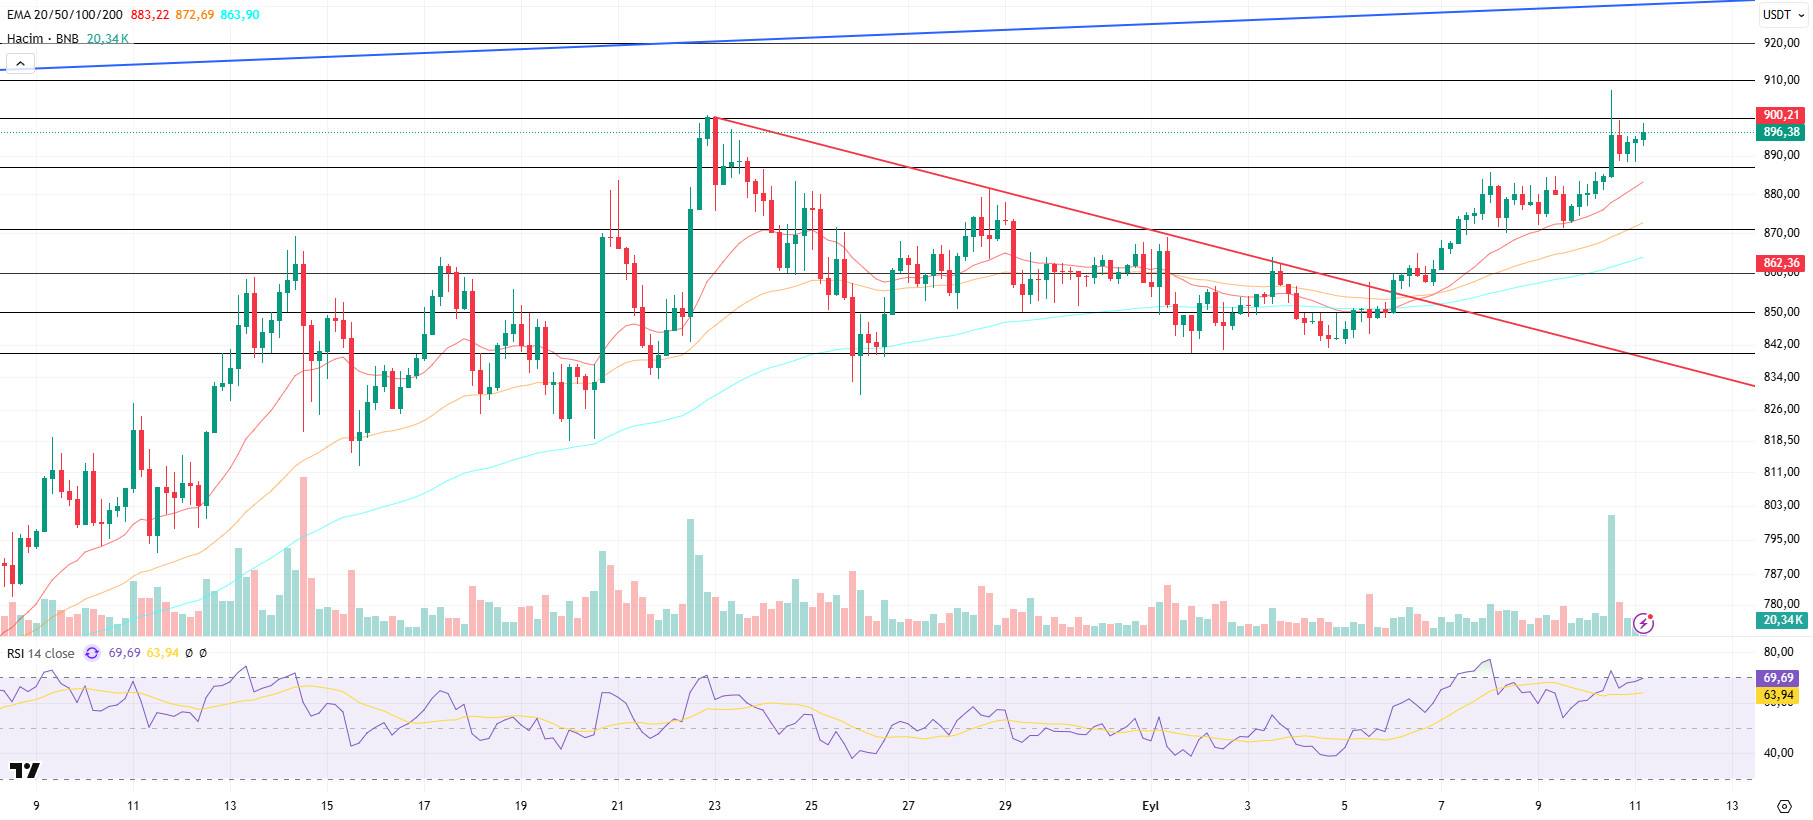
From a technical perspective, BNB/USDT fell as low as $840 on the four-hour chart with the recent pullbacks and regained bullish momentum with the support it received from this level. Yesterday, the markets saw that BNB managed to rise above the $885 level with the effect of news flows on the fundamental side. The persistence above this level indicates that the price has exited the decision phase and continued its upward trend. However, the asset rose above the historical peak level of $ 900 with the positive momentum it gained; however, it fell slightly below this level again due to profit realizations.
Technical indicators for BNB/USDT, which is currently trading in the range of $885-900, reveal that the recent increase in trading volume has strengthened the buying appetite. This picture indicates that the positive outlook stands out in the market.
In addition, the Relative Strength Index (RSI) has risen above the 70 level with the recent rises, and although short-term correction movements are observed, it is still holding at these levels. This technical structure indicates that the positive momentum in BNB is strengthening.
Within the framework of the current outlook, BNB is expected to test the $ 900 resistance level in the first place if the buying appetite is maintained. If this level is exceeded, it seems possible for the price to head towards $ 910 and $ 920 levels, respectively. On the other hand, if selling pressure increases, the price is likely to retreat back to $ 885 support. If this level is broken downwards, the $ 870 and $ 860 levels stand out as critical follow-up zones.
Supports 885 – 870 – 860
Resistances 900 – 910 – 920
ADA/USDT
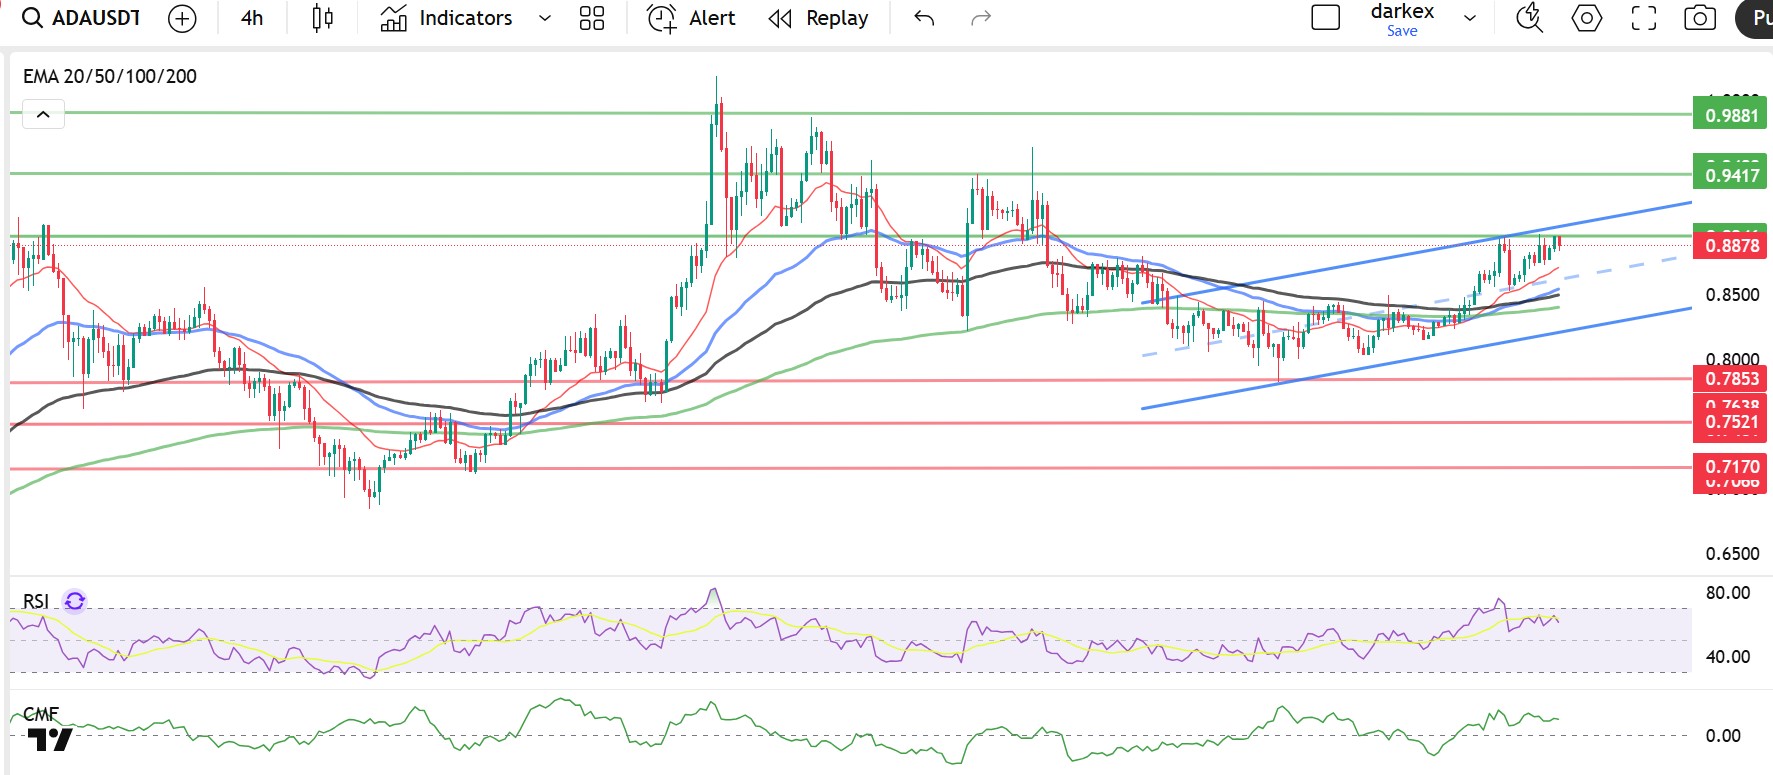
Cardano (ADA) has reached the top of its uptrend ahead of today’s US Unemployment Benefits Claims and the annual Inflation Rate (CPI).
From a technical point of view, ADA price is still moving within the ascending channel band. In this context, it is expected that the long leveraged positions of about 758 thousand dollars at the level of $ 0.9019 will be liquidated. This move may cause the price to head towards the first resistance level tested yesterday at $0.9058 with reaction purchases during the day. If this level is surpassed, it is likely to reach $0.9280, the peak of the ascending channel within the major trend. The fact that the price is already above all moving averages indicates that the uptrend is strengthening. In particular, staying above the 20-day exponential moving average (EMA-20, Red Line) and 50-day exponential moving average (EMA-50, Blue Line) levels is critical for the sustainability of the uptrend. Momentum indicators also generate positive signals. Relative Strength Index (RSI) rose to 63, approaching the buy zone. On the other hand, Chaikin Money Flow (CMF-20) indicator rose to 0.18, indicating that the buying potential in the market continues to be strong. The increase in money inflows supports the CMF to remain in positive territory and forms a bullish correlation with the RSI. This alignment increases the likelihood of a sustained buying bias.
In terms of fundamental factors, possible statements by US President Donald Trump or institutional/strategic purchases in the Cardano ecosystem are among the factors that may support the price to head towards the strong resistance point at $ 0.9280. However, in case of a possible selling pressure in the markets, the 0.7851 dollar level should be followed as a critical support point.
Supports 0.7851 – 0.7566 – 0.7170
Resistances 0.9982 – 0.9636 – 0.9280
Legal Notice
The investment information, comments, and recommendations contained herein do not constitute investment advice. Investment advisory services are provided individually by authorized institutions taking into account the risk and return preferences of individuals. The comments and recommendations contained herein are of a general nature. These recommendations may not be suitable for your financial situation and risk and return preferences. Therefore, making an investment decision based solely on the information contained herein may not produce results in line with your expectations.

