
Technical Analysis
BTC/USDT
The global agenda saw tensions rise with the US military operation against Venezuela, the capture of President Maduro and his wife, and the harsh diplomatic reactions from major powers. While Washington’s moves to prioritize security and energy issues in Latin America were debated, the transition process regarding Venezuela’s governance structure and Maduro’s impending trial in the US took center stage. Meanwhile, in the crypto sphere, allegations that Venezuela is using its BTC and USDT assets to evade sanctions are being closely monitored by financial markets. During the same period, talks between Russia and Ukraine stalled again, while the Fed issued cautious messages about interest rate cuts in 2026.
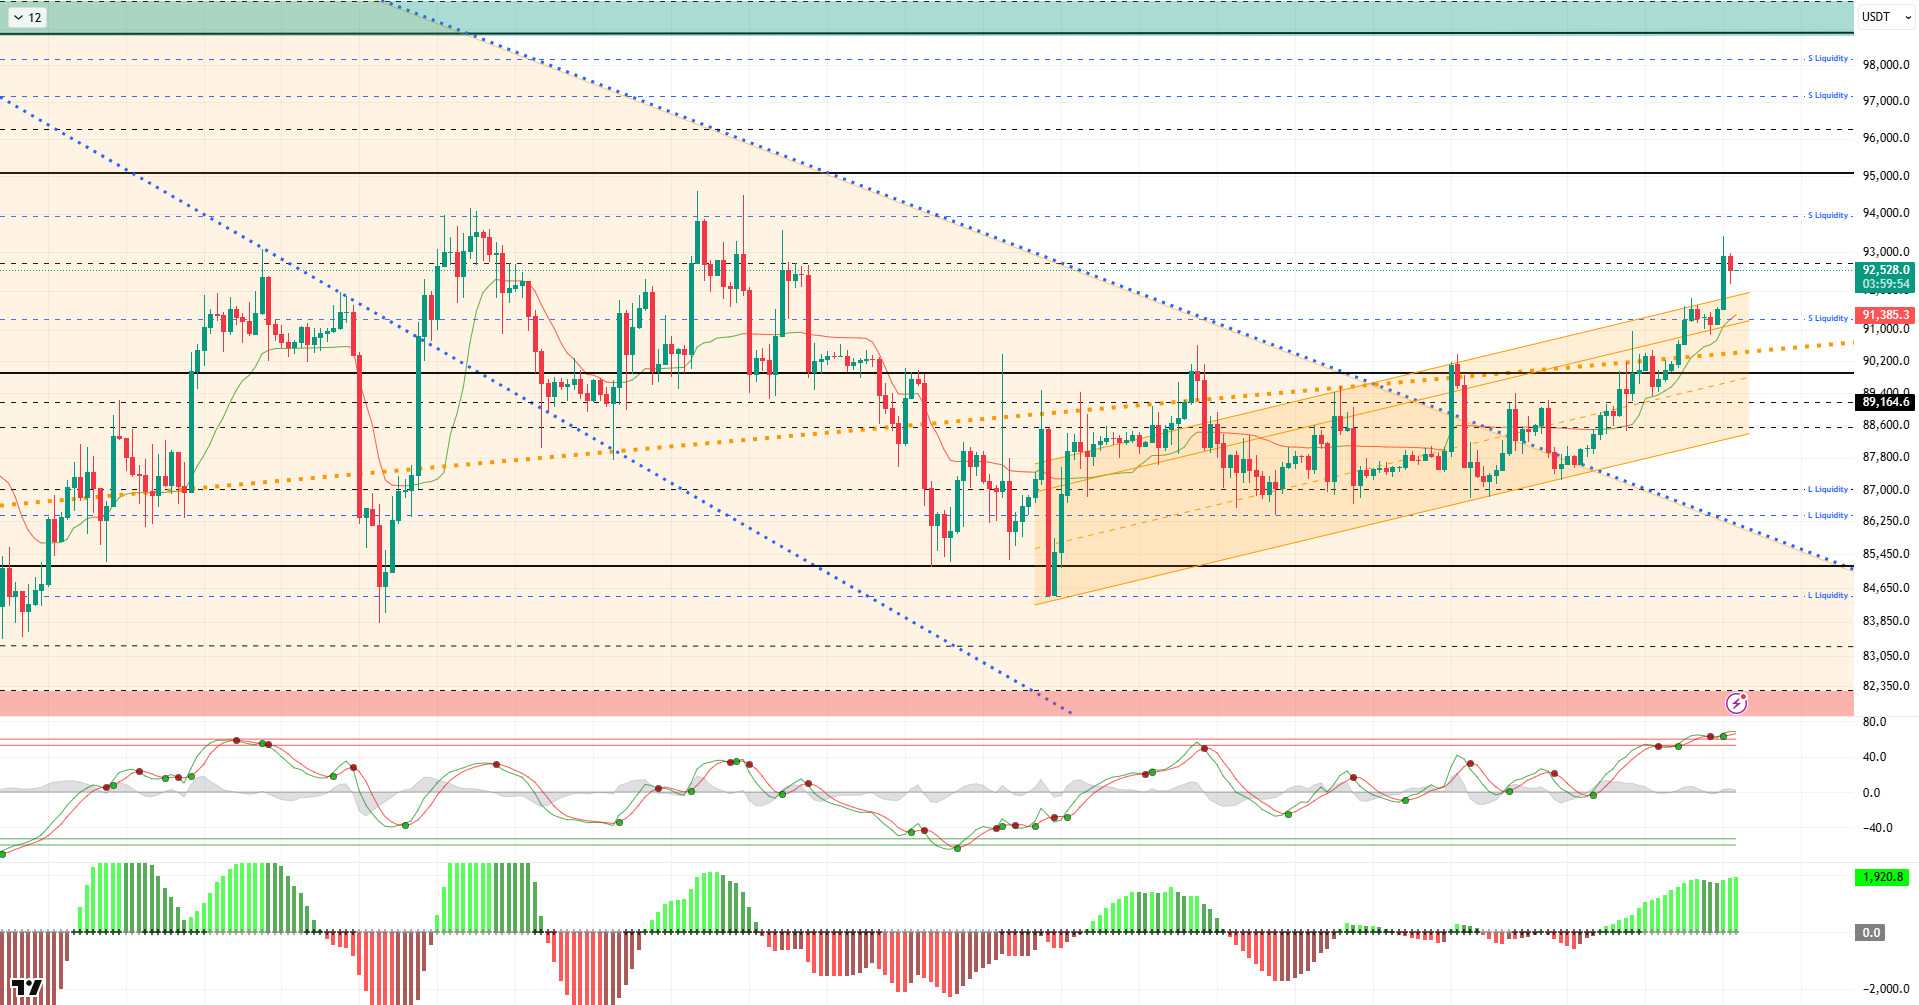
From a technical perspective, BTC finally managed to break through the 90,000 level it had been pushing against, parallel to the upward channel it had formed. The price first broke out of the orange band it had formed since the ATH level, then surpassed the 90,000 level we were tracking as a reference, and finally managed to break through the major upward trend. Maintaining its upward momentum, the price tested the 93,400 level. At the time of writing, the price is trading at the 92,500 level and has also broken through the upward channel. In this context, as a result of the negative closing trend in 2025, BTC started 2026 with a 5.71% increase.
Technical indicators drew attention with the Wave Trend (WT) oscillator’s buy/sell signals in the overbought zone, while the Squeeze Momentum (SM) indicator’s histogram successfully transitioned back into positive territory and gained momentum. The Kaufman Moving Average (KAMA) is currently below the price at the $91,258 level.
When examining liquidation data, buy-side transactions show intense accumulation at the 90,000 level in the short term, while accumulation continues at the 86,000–87,000 level. In contrast, sell-side transactions were liquidated at the 89,000–90,000 level in the short term. In a broader time frame, long-term transactions in the 91,000–93,500 band have been cleared.
In summary, tensions between the US and Venezuela escalated significantly with the capture of President Maduro. Maduro, who is to be tried in the US today, received messages of support from China and Russia on the international stage. Meanwhile, it was claimed that Venezuela was accepting payments in BTC and USDT to avoid sanctions. While negotiations on the Russia-Ukraine front reached an impasse, on the economic front, the BoJ president raised interest rates, while the Fed issued cautious messages. Examining liquidity data, long-term transactions were liquidated following the price breakout after areas of intense short-term trading. In technical terms, BTC started the new year with positive momentum, continuing its parallel movement with the upward channel and rising to the 93,500 level. With limited profit-taking from this point, the price retreated to the 92,600 region. In the next phase, regaining the 92,600 level and hourly closes above this level could support the continuation of the upward trend, paving the way for the price to test the 94,000 resistance. Although technically the upside space is narrowing, the current momentum will continue to be monitored as an important driving force for the price to sustain its rise. In the event of potential selling pressure, the 91,400 support zone will come to the fore in the first stage, and if this level is broken downwards, the 90,000 reference level will be monitored as the next critical support.
Support levels: 91,400 – 90,000 – 89,000
Resistances: 92,600 – 94,000 – 95,000
ETH/USDT
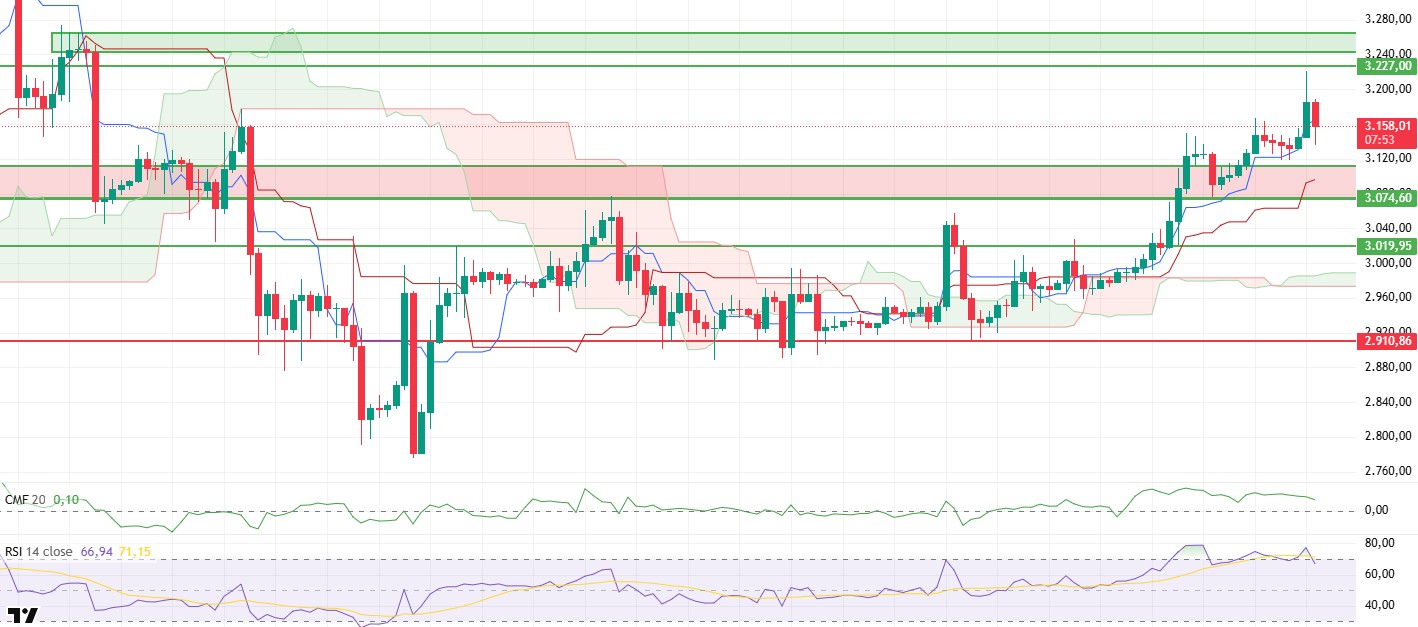
Technical levels worked clearly for ETH on Friday. First, the strong resistance area shown by the red rectangle on the chart was broken, then the price managed to hold on during the pullback to this area. With the buying from this support, the price was carried up to the upper band at the $3,227 level. However, selling kicked in at this level and the price pulled back towards $3,150. The current structure appears to be a natural pause following a strong rally.
Data from the futures market initially appears to be sending mixed signals. The decline in open interest and the drop in the funding rate during the recent rally indicate that some long positions have been closed and short positions have increased. While this picture may seem negative, it can be interpreted differently when evaluated alongside the spot market. The spot Cumulative Volume Delta (CVD) maintains its upward trend, indicating that spot buying remains strong. The unwinding of leveraged positions may also pave the way for the price to move on a healthier footing.
There is no significant deterioration on the liquidity side. Chaikin Money Flow (CMF) is moving sideways in positive territory. This suggests that the money entering the market has not been completely withdrawn and that the recent pullback was shaped by the price’s own internal dynamics rather than a sharp liquidity-driven exit. As long as liquidity flow can be maintained, the likelihood of declines remaining limited increases.
The picture is clearer on the momentum front. The Relative Strength Index (RSI) rose to the overbought zone with the recent uptrend and then began to retreat. This behavior is consistent with the price pullback. From this perspective, it seems more accurate to view the recent movement as a correction.
The overall structure of the Ichimoku indicator remains intact. The price continues to stay above the Kumo cloud, and the Tenkan and Kijun levels also maintain their positive positions. From a technical perspective, there is no signal yet indicating a breakdown in the main trend. As long as pricing remains above the cloud, the medium-term outlook continues to be strong.
The focus for intraday expectations is the $3,111 level. As long as there is no sustained movement below this region, the possibility of continued upward movement remains on the table. A re-entry of the price into the red box could increase short-term pressure. In the current scenario, ETH is showing a structure that is taking a breather after a strong rally but has not yet lost its main direction.
Below the Form
Supports: 3,074 – 3,019 – 2,910
Resistances: 3,227 – 3,368 – 3,478
XRP/USDT
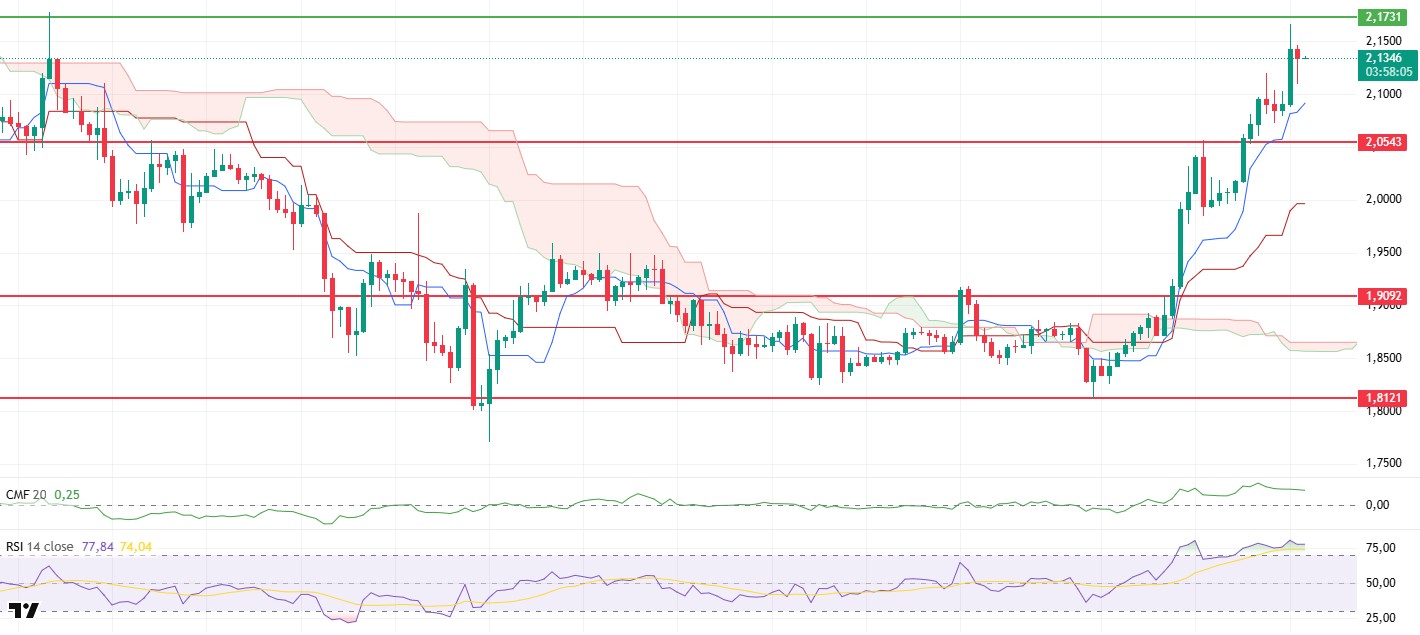
The XRP price broke through the long-awaited resistance level on Friday after a series of attempts, clearly reclaiming the $1.90 zone that had been discussed for quite some time. Once this level was breached, buying accelerated, and the price first surpassed the $2.05 resistance level, then maintained its momentum to climb to the $2.17 level. Although a limited pullback occurred with the selling pressure at this point, the overall structure of the movement remains strong. The fact that the upward momentum has not completely disappeared indicates that buyers are still staying in the market.
The picture on the cash flow side remains intact. Chaikin Money Flow (CMF) is moving sideways in positive territory, indicating that demand remains strong on the spot side. The absence of any significant weakening in liquidity inflows suggests that the recent rise is not merely a short-term move. This structure continues to be an important support factor for the price to hold at high levels.
On the momentum side, we have reached a point where greater caution is warranted. The Relative Strength Index (RSI) is hovering in the overbought zone. This outlook confirms the strength of the uptrend while also keeping the possibility of a short-term correction on the table. The RSI’s continued presence in this zone indicates that the price may remain volatile for some time.
From a technical perspective, the structure is clearly positive. In the Ichimoku indicator, the price remains above the kumo cloud, and the Tenkan and Kijun levels are also left below. This positioning indicates that the current trend is upward and that there has been no technical breakdown yet.
The decisive level for the price during the day continues to be the $2.17 region. If this area is exceeded, the rise is expected to continue towards the upper band. On the other hand, if there is renewed selling from this level, a pullback towards the $2.05 level seems likely due to the inflated structure in the RSI. Although the main direction is upward in the current chart, the possibility of a correction in the short term should not be overlooked.
Supports: 2.0543 – 1.9092 – 1.8121
Resistances: 2.1731 – 2.2729 – 2.3512
SOL/USDT
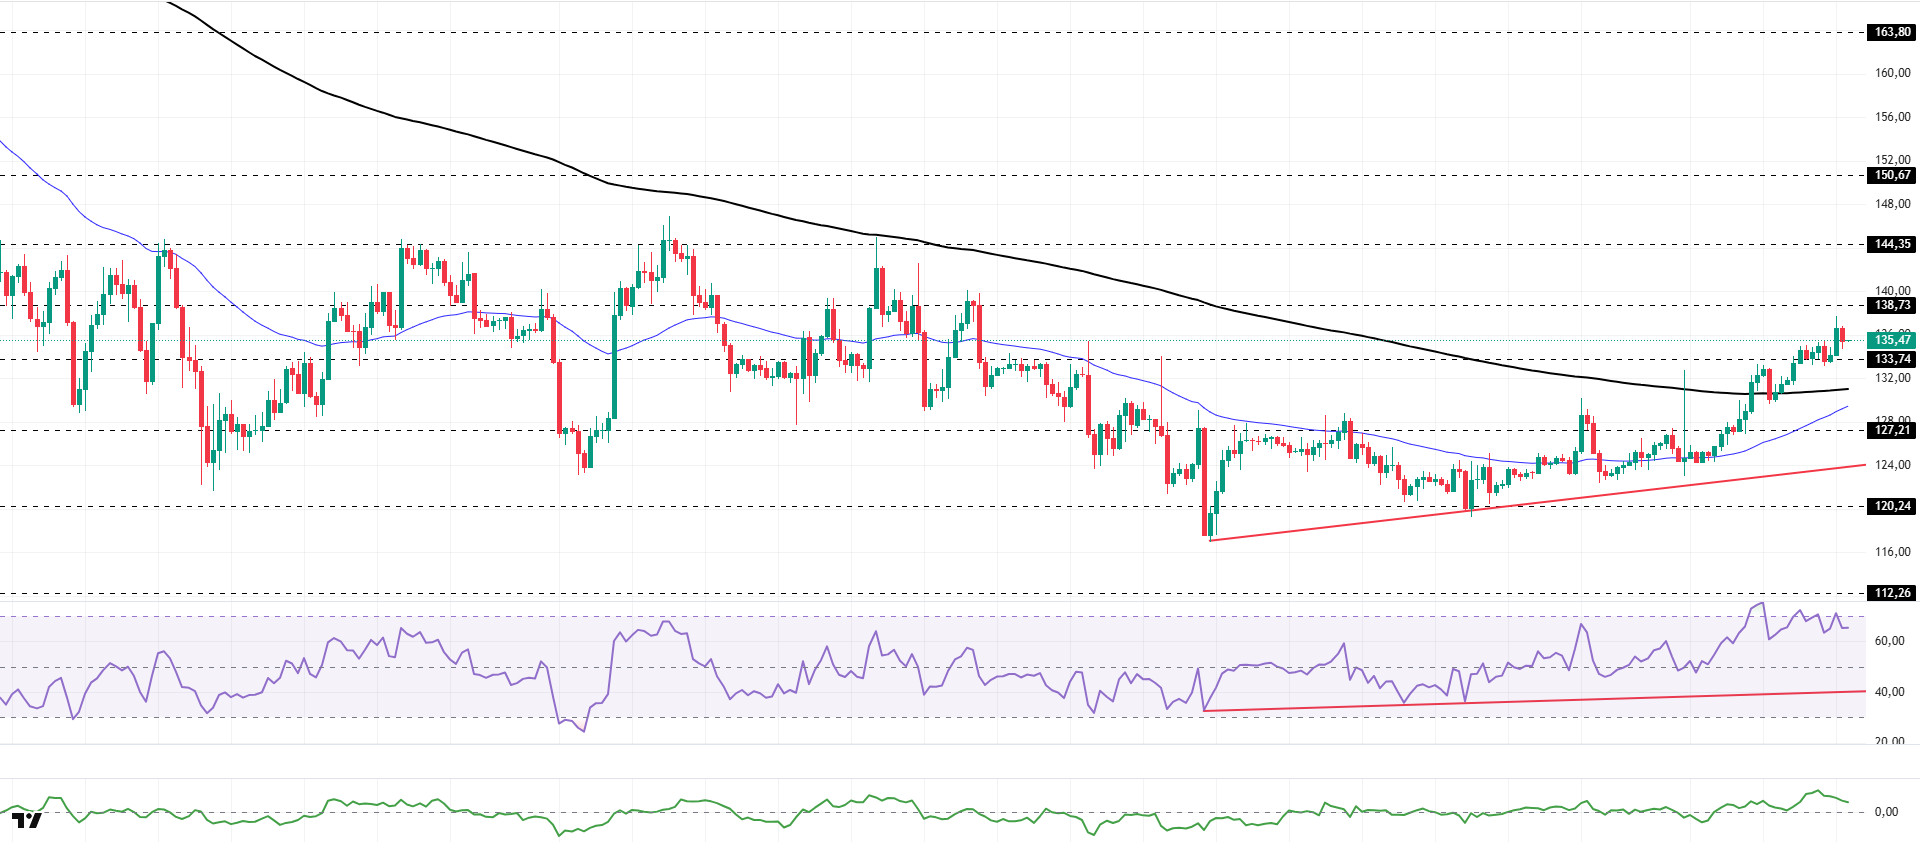
SOL price showed an upward trend. The asset continued to remain in the upper region of the upward trend that began on December 18. The price, which broke through the 200 EMA (Black Line) moving average, a strong resistance level, and continued to rise, reinforced the upward trend. Currently, the price has managed to stay above the strong support level of $133.74 and could test the resistance level of $144.35 if the momentum continues. In case of a pullback, it could test the 200 EMA (Black Line) moving average as support.
On the 4-hour chart, it remained below the 50 EMA (Exponential Moving Average – Blue Line) and 200 EMA (Black Line). This indicates that the medium-term downtrend is continuing. At the same time, the price being above both moving averages indicates that the asset is trending upward in the short term. The Chaikin Money Flow (CMF-20) is in positive territory. However, the balance of money inflows and outflows may keep the CMF in positive territory. The Relative Strength Index (RSI-14) remains at overbought levels. This could trigger profit-taking. At the same time, it continues to trade above the upward trend line that began on December 18. This indicates that buying pressure continues. If an uptrend occurs due to macroeconomic data or positive news related to the Solana ecosystem , the $150.67 level stands out as a strong resistance point. If this level is broken upwards, the uptrend is expected to continue. If pullbacks occur due to developments in the opposite direction or profit-taking, the $127.21 level may be tested. A decline to these support levels could increase buying momentum, presenting a potential opportunity for an uptrend.
Supports: 133.74 – 127.21 – 120.24
Resistances: 138.73 – 144.35 – 150.67
DOGE/USDT
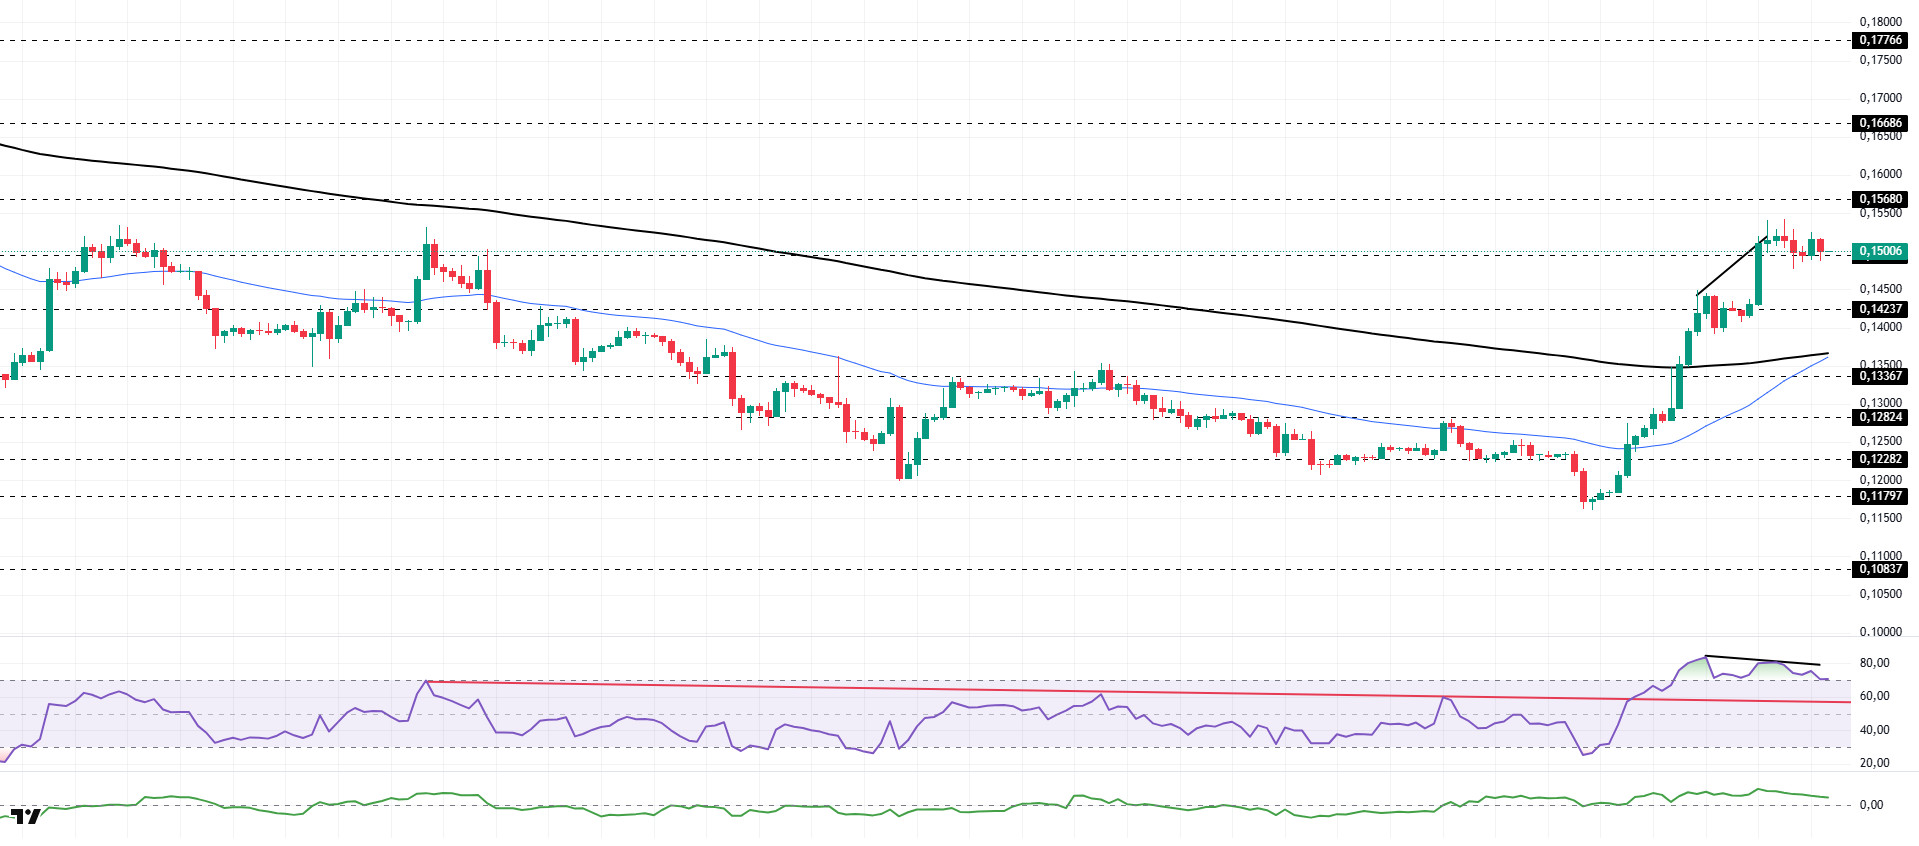
The DOGE price experienced an uptrend. The asset broke through the 200 EMA (Black Line) moving average and the strong resistance level of $0.14952, maintaining its momentum. Currently testing the $0.14952 level as support, the price could test the $0.15680 level as resistance if the uptrend continues. In the event of a pullback, it could test the $0.14237 level as support.
On the 4-hour chart, the 50 EMA (Exponential Moving Average – Blue Line) remained below the 200 EMA (Black Line). This indicates that the downtrend could continue in the medium term. However, the price trading above both moving averages indicates a short-term upward trend. The Chaikin Money Flow (CMF-20) may remain in positive territory. Additionally, increased capital inflows could push the CMF to higher levels within the positive zone. The Relative Strength Index (RSI-14) rose to the overbought level. This could increase profit-taking. At the same time, it continued to remain in the upper region of the downward trend that began on December 9, maintaining its momentum. This indicated an increase in buying pressure. On the other hand, negative divergence should be monitored. In the event of an uptrend driven by political developments, macroeconomic data, or positive news flow in the DOGE ecosystem, the $0.16686 level stands out as a strong resistance zone. Conversely, in the event of negative news flow, the $0.13367 level could be triggered. A decline to these levels could increase momentum and trigger a new wave of growth.
Supports: 0.14952 – 0.14237 – 0.13367
Resistances: 0.15680 – 0.16686 – 0.17766
BNB/USDT
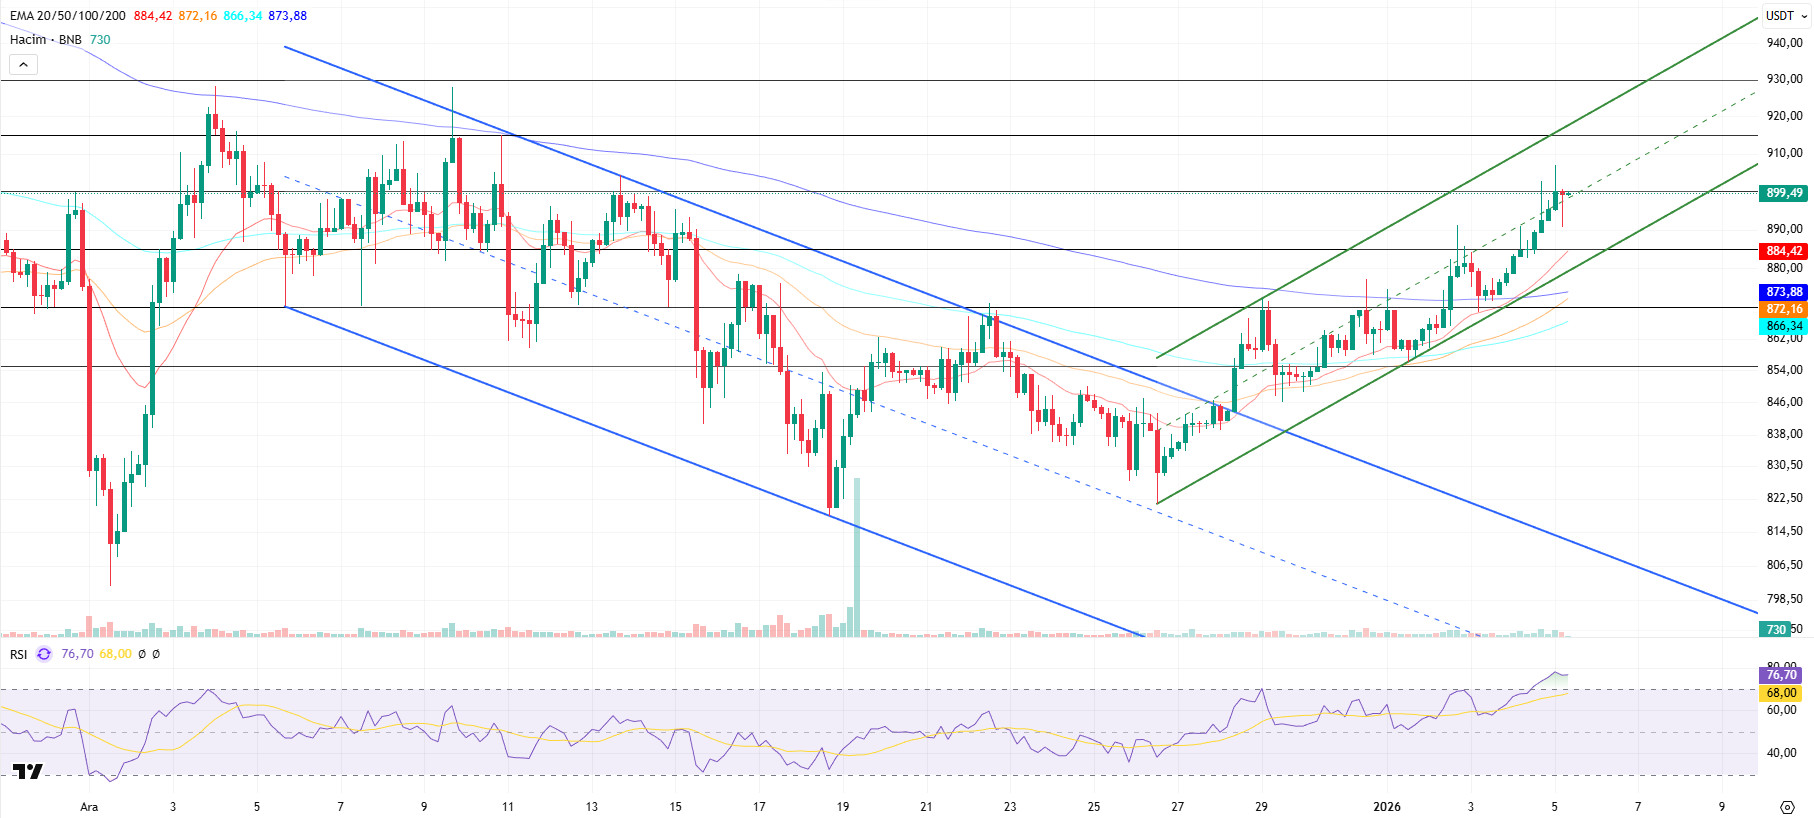
From a technical perspective, BNB/USDT gained positive momentum with the support provided by new candlestick formations and rose to the $930 level; however, intense selling pressure was observed in this region due to general market conditions. Affected by this pressure, the asset has continued to move within a descending channel formation for some time.
However, BNB, which reversed its direction upward again with the support it received from the middle band of the descending channel, strengthened its upward momentum by breaking the upper band of the channel upward. In this direction, the asset exceeded its previously determined target levels and reached the $900 threshold. Although partial pressure is seen at these levels, the asset is considered to have maintained its overall positive structure within the current rising channel.
Currently trading in the $885-$900 range, technical indicators for BNB show that low trading volume is limiting the upward momentum. In addition, the Relative Strength Index (RSI) rising above the 70 level with the recent increases indicates that a limited correction may begin in the short term.
Within the technical outlook, if buying appetite is maintained and market momentum strengthens, BNB is expected to retest the $900 resistance level in the first stage. Breaking above this level could potentially lead to a move above the descending trend line. If the trend breakout is confirmed and the price manages to hold above this level, a rise towards the $915 and $930 levels is technically possible.
On the other hand, if selling pressure increases, the price is expected to retest the $885 support level. If this level is broken downward, a pullback towards the $870 and $855 support zones may come into play.
Supports: 885 – 870 – 855
Resistances: 900 – 915 – 930
Legal Notice
The investment information, comments, and recommendations contained herein do not constitute investment advice. Investment advisory services are provided individually by authorized institutions taking into account the risk and return preferences of individuals. The comments and recommendations contained herein are of a general nature. These recommendations may not be suitable for your financial situation and risk and return preferences. Therefore, making an investment decision based solely on the information contained herein may not produce results in line with your expectations.

