MARKET SUMMARY
Latest Situation in Crypto Assets
| Assets | Last Price | 24h Change | Dominance | Market Cap. |
|---|---|---|---|---|
| BTC | 68,098.00 | 1.12% | 57.87% | 1.35 T |
| ETH | 2,542.00 | 0.63% | 13.15% | 305.97 B |
| SOLANA | 173.82 | -0.46% | 3.51% | 81.64 B |
| XRP | 0.5254 | -0.43% | 1.28% | 29.82 B |
| DOGE | 0.1390 | -0.29% | 0.88% | 20.37 B |
| TRX | 0.1664 | 1.77% | 0.62% | 14.40 B |
| CARDANO | 0.3423 | -0.08% | 0.51% | 11.96 B |
| AVAX | 26.51 | -0.55% | 0.46% | 10.79 B |
| SHIB | 0.00001774 | 0.34% | 0.45% | 10.46 B |
| LINK | 11.83 | 3.63% | 0.32% | 7.42 B |
| DOT | 4.148 | -0.92% | 0.27% | 6.27 B |
*Prepared on 10.25.2024 at 13:30 (UTC)
WHAT’S LEFT BEHIND
The date of the China Standing Committee meeting, which the world is eagerly waiting for, has been announced
The highly anticipated parliamentary meeting of China’s parliament, where important decisions on China’s monetary easing policies may be taken, will be held between November 4-8. Investors were especially curious about the possible monetary easing period, the details of which have not been announced recently.
Microsoft Report
A report by Microsoft, which announced that it would vote on the purchase of Bitcoin, was full of praise for the largest cryptocurrency. Analysts cited MicroStrategy and its earnings as an example, saying, “Although they have a very small proportion of our business, they beat Microsoft stock by 313% thanks to holding Bitcoin.” Bitcoin is also an “excellent” asset for hedging against inflation.
Was the US Cryptocurrency Wallet Hacked?
Allegedly, hackers stole $20 million in various cryptocurrency assets from US government wallets. Moreover, crypto sleuths suggest that the hackers have already started laundering the money.
Ripple Doesn’t Give Up the Fight
Ripple has filed a Form C for cross-appeal in its ongoing case with the SEC. With this move, it wants to clarify that XRP is not a security. The appeals court will examine the existing record without allowing the SEC to submit new evidence.
Cryptocurrency Economy Expands!
Pennsylvania’s “Bitcoin Bill of Rights” gives state residents the right to store cryptocurrencies on their own. The law aims to encourage financial innovation by providing guidelines regulating the use of Bitcoin as a means of payment. Thus, it aims to make cryptocurrencies more widely used across the state.
HIGHLIGHTS OF THE DAY
Important Economic Calender Data
| Time | News | Expectation | Previous |
|---|---|---|---|
| 14:00 | US Michigan Consumer Sentiment (Oct) | 69.2 | 68.9 |
| 15:00 | US FOMC Member Collins Speaks |
INFORMATION
*The calendar is based on UTC (Coordinated Universal Time) time zone.
The economic calendar content on the relevant page is obtained from reliable news and data providers. The news in the economic calendar content, the date and time of the announcement of the news, possible changes in the previous, expectations and announced figures are made by the data provider institutions. Darkex cannot be held responsible for possible changes that may arise from similar situations.
MARKET COMPASS
Preparing for the busy agenda of the next two weeks, global markets watched macro indicators from the US today. In September, durable goods orders, which were expected to decline by 1.1% compared to the previous month, decreased by 0.8%. Core durable goods orders, which are calculated by excluding transportation, increased by 0.4% in the related period and were expected to decline by 0.1%.
Despite these better-than-expected figures, the dollar depreciated after the release of the data, as the perception that the Fed will not change its rate cut course seemed to be strengthening. According to the CME FedWatch Tool, the bank is almost certain to cut rates by 25 basis points in November. It is also seen as more likely that the Fed will cut another 25 basis points in December.
On the other hand, with the perception that Trump is ahead in the presidential election, the rally in cryptocurrencies continues in an environment where the direction changes more frequently. Starting on October 10, we think that there are clues that the Bitcoin rally is gradually losing steam, and in this context, we can say that the short-term pullback is taking up more space on the table than before. For the long-term outlook, we remain positive. We think that we are more likely to see downward movements before and during the weekend. However, this may not be the case with the news flow and the ossification of the “Uptober” perception. For more information on the significance of Sunday’s election in Japan for digital assets, we recommend that you review our weekly bulletin, which will be published today.
TECHNICAL ANALYSIS
BTC/USDT
Bitcoin, which corrected from its peak level of 69,500 last week, retreated to 65,000 levels. During this period, Bitcoin ETFs turned negative and a large amount of long transactions were liquidated with the expectation of new ATH. We can say that volatility will increase as the US elections approach in Bitcoin, which is gathering demand in order to catch a new uptrend.
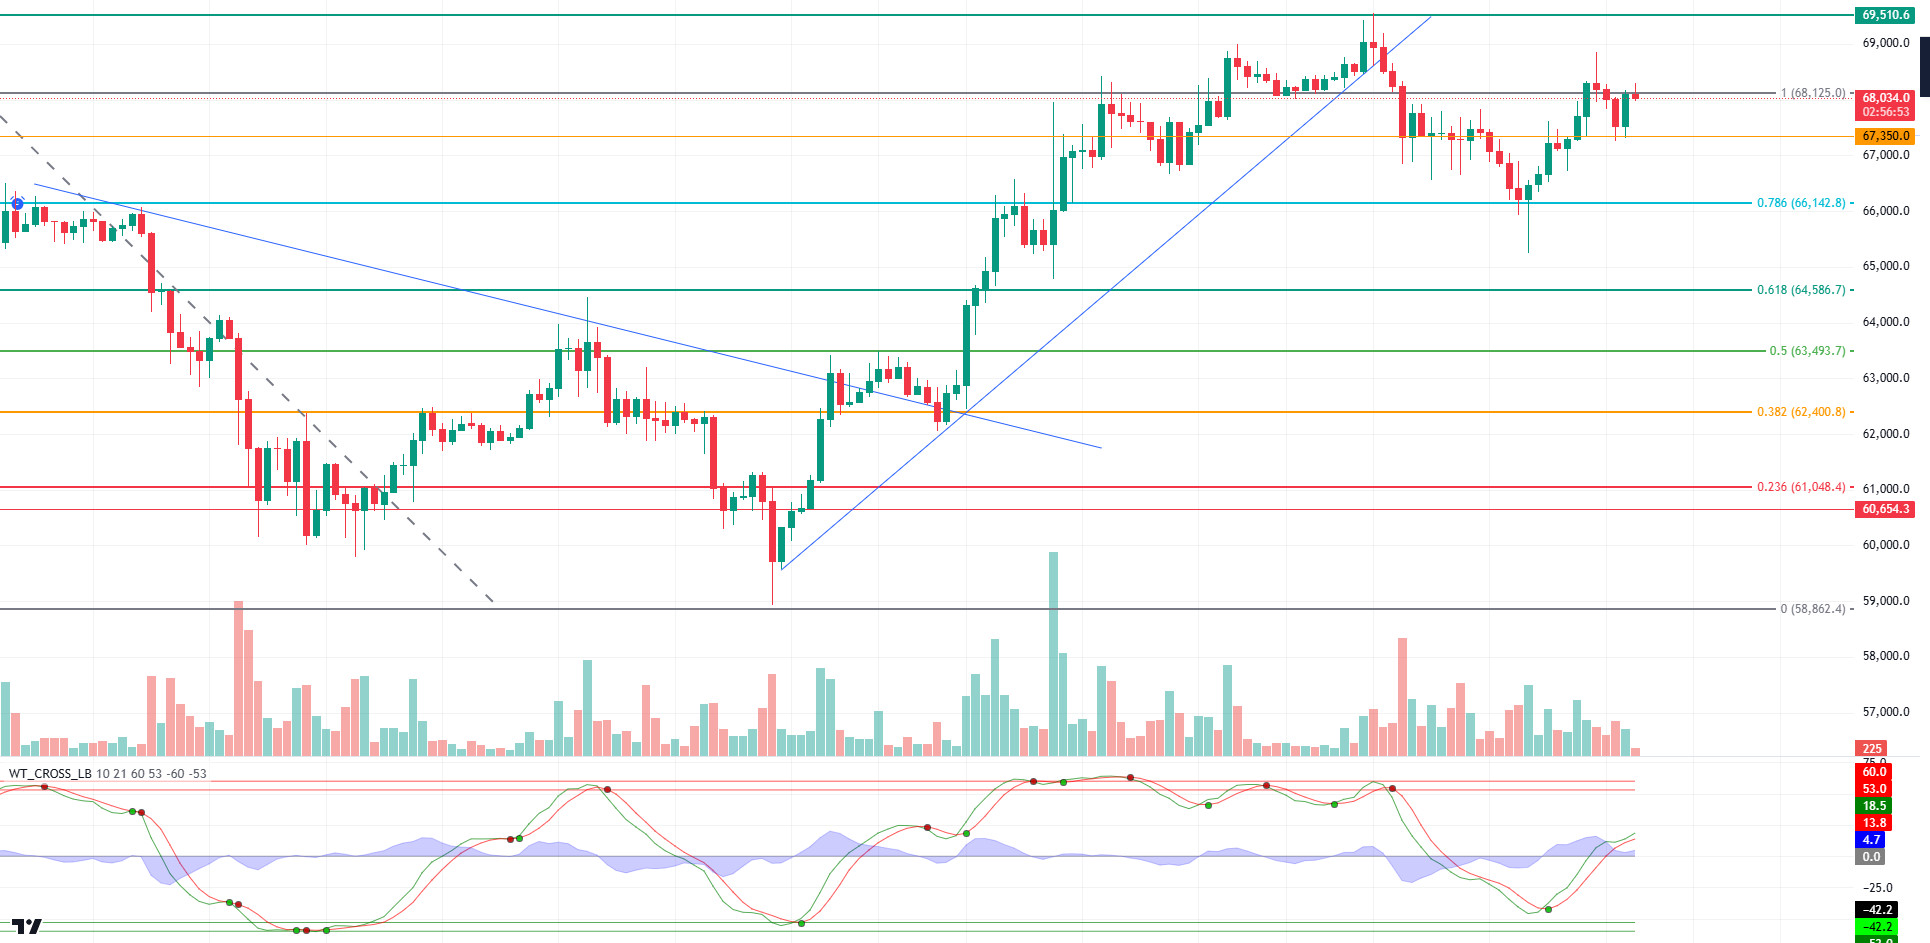
Looking at the BTC technical outlook, the price, which tested the minor support level of 67,350 during the day, turned its direction upwards and reached the 68,000 level as of now. With the crossing of the Fibonacci 1 (68,125) resistance level, the 69,500 level can be retargeted in BTC price. With the positive outlook in global markets, our technical indicators support the uptrend by turning up from the oversold zone. In case of a possible pullback with the drop in volume over the weekend, BTC may test the 0.786 (66.142) point again with closures below the 67.350 point.
Supports 67,350 – 66,142 – 64,586
Resistances 68,125 – 69,510 – 71,458
ETH/USDT
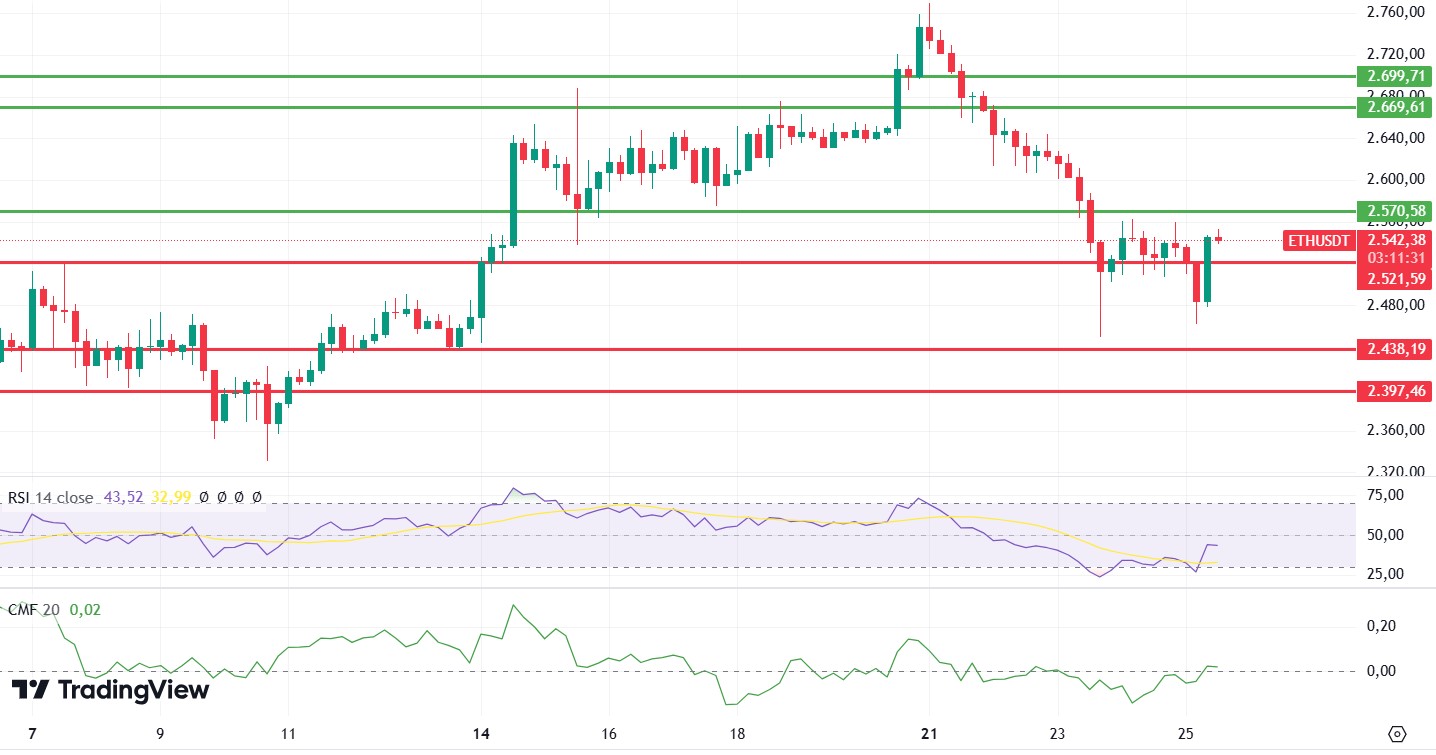
After entering the oversold zone, the Relative Strength Index (RSI) in ETH rose slightly to above 2,521 and rose as high as 2,550. However, the negative divergence on the RSI and the negative momentum suggest that the breakout of the 2.571 key resistance is difficult. Chaikin Money Flow (CMF), on the other hand, is drawing a horizontal outlook despite rising back to positive territory. The fact that the Long/Short Ratio is still too high and Cumulative Volume Delta (CVD) shows that the rise is coming from the futures side, indicating that declines may come again. Exceeding the 2,571 level may start the positive trend again.
Supports 2,521 – 2,438 – 2,397
Resistances 2,571 – 2,669 – 2,699
LINK/USDT
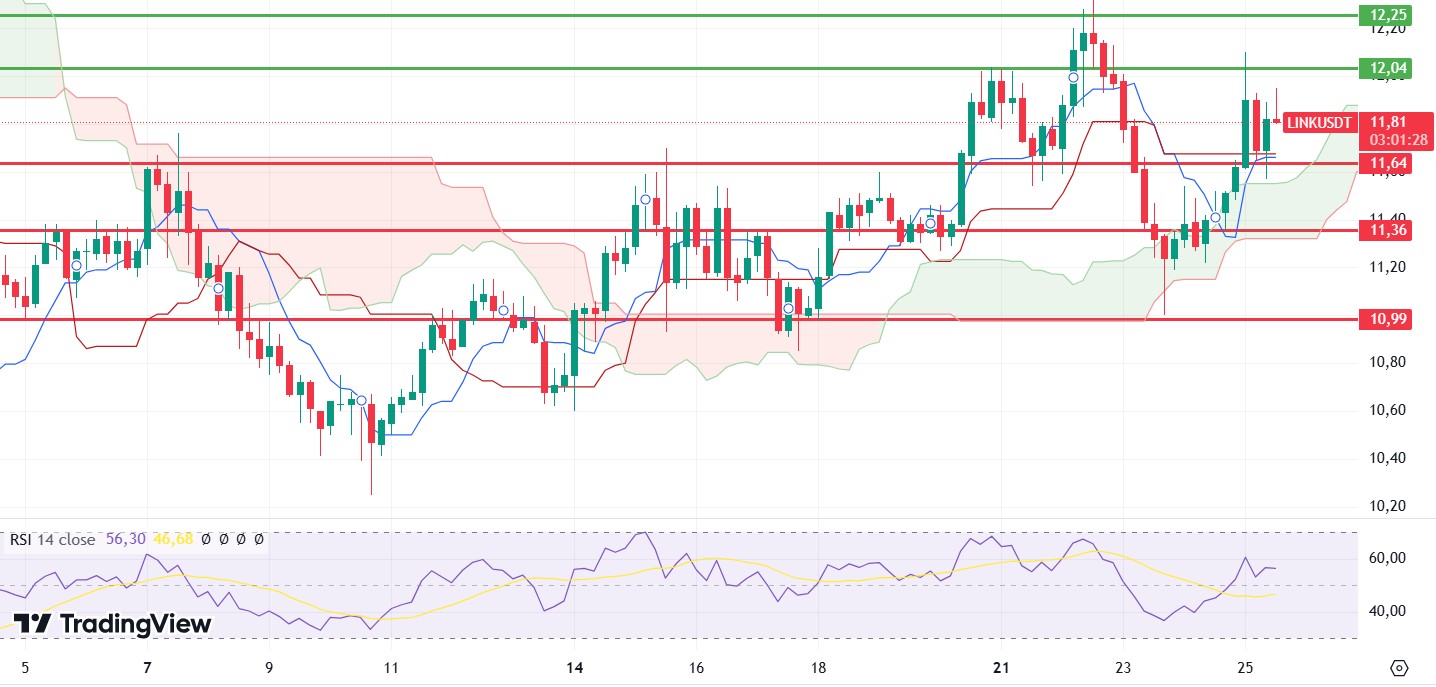
While the Relative Strength Index (RSI) for LINK maintains its positive outlook, the fact that the price closed above the tenkan, kijun and kumo cloud levels indicates that upward movements may be coming. Breaching the 12.04 resistance, hard candles are likely to come. The 11.64 level is the most important support point and if it is broken, declines to 11.36 levels may occur.
Supports 11.64 – 10.36 – 10.99
Resistances 12.04 – 12.25 – 12.71
SOL/USDT
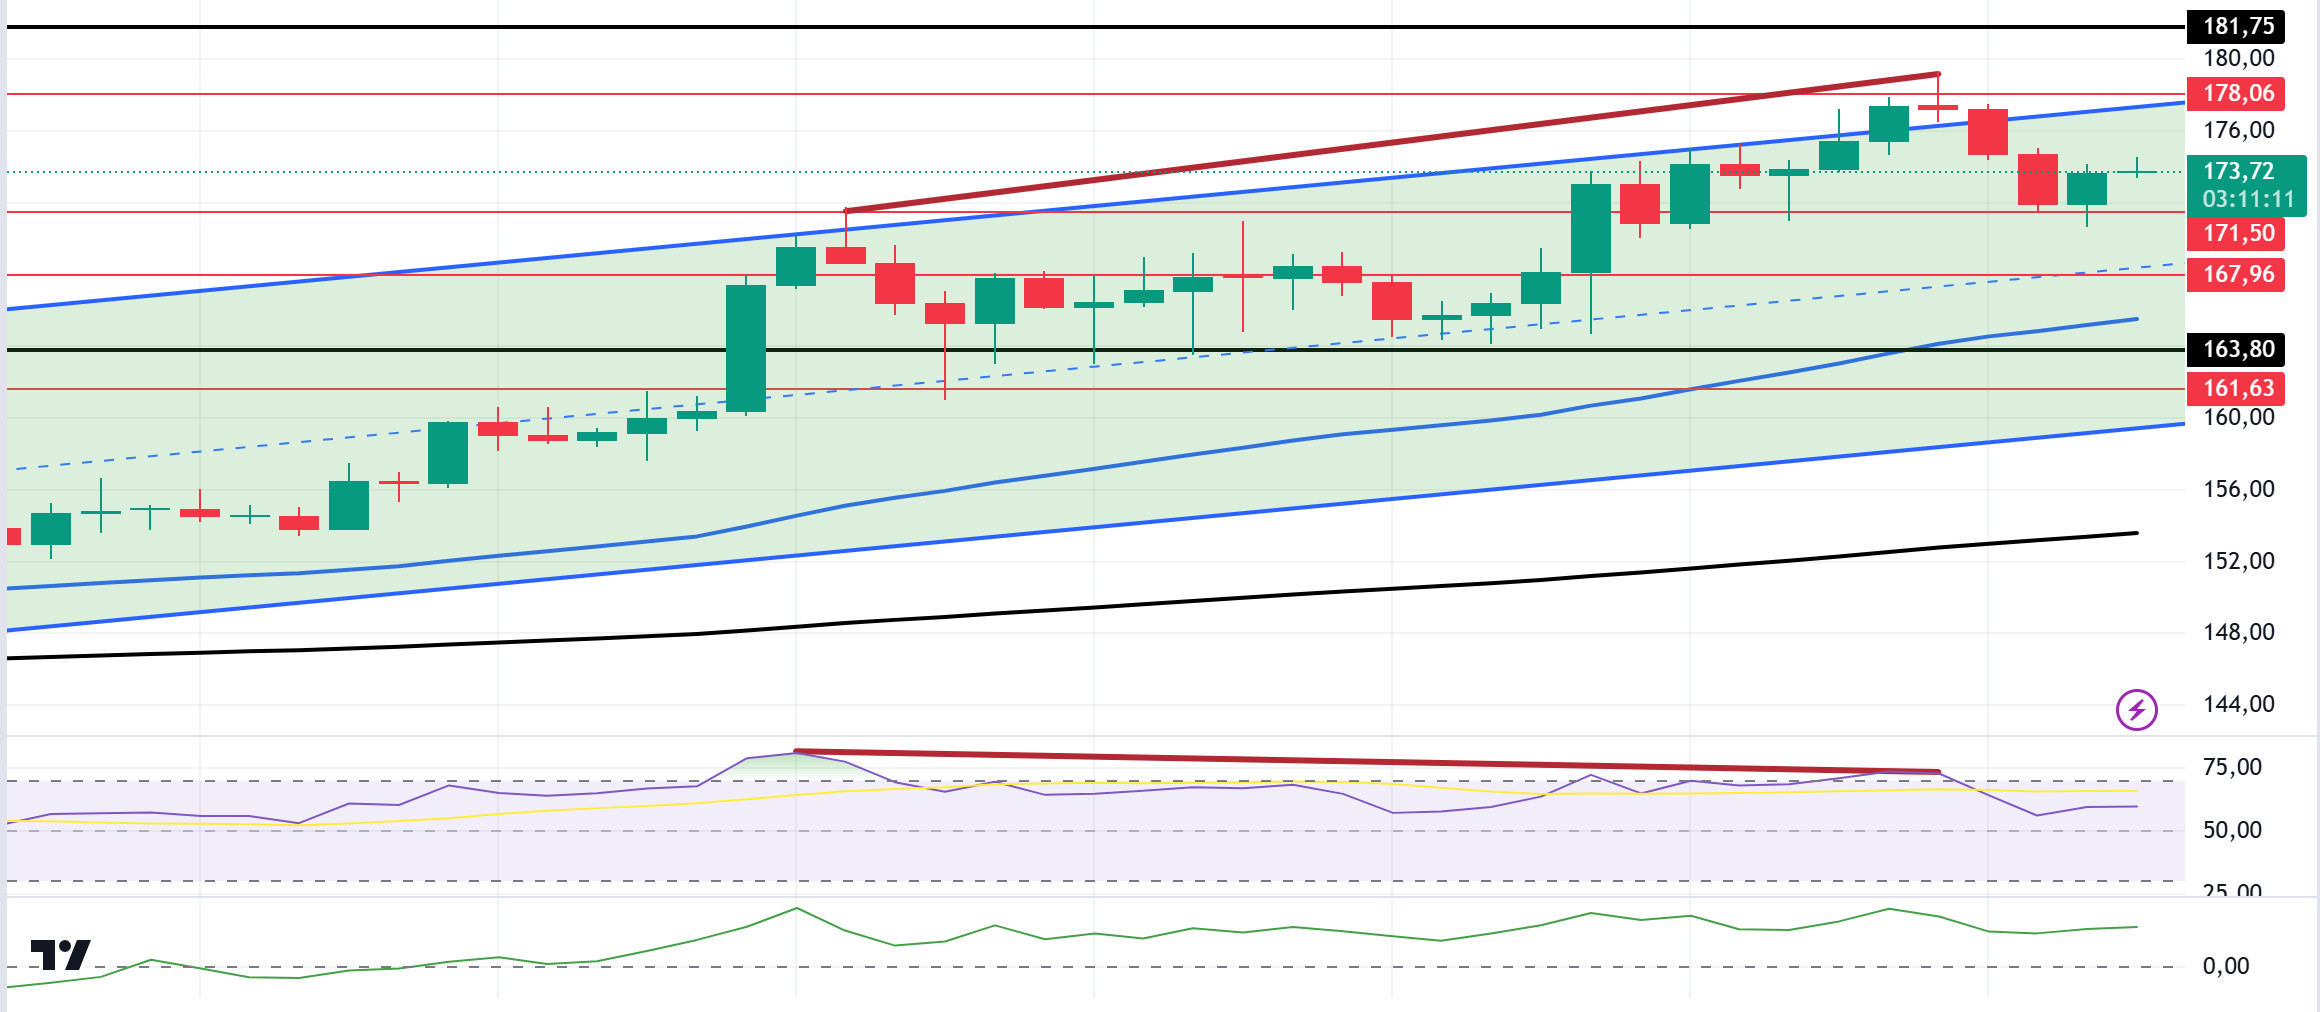
SOL has priced sideways since our morning analysis. On the 4-hour timeframe, the 50 EMA (Blue Line) continues to be above the 200 EMA (Black Line). This could mean that the uptrend will continue. However, the Relative Strength Index (RSI)14 indicator re-entered the overbought levels, creating divergence between the price and the indicator. However, Chaikin Money Flow (CMF)20 is at a very strong level. This indicates a large amount of money inflows. This enabled the price to break the top of the uptrend. However, due to the profit selling, it has re-entered the uptrend. The 181.75 level is a very strong resistance point in the uptrend driven by both macroeconomic conditions and innovations in the Solana ecosystem. If it rises above this level, the rise may continue strongly. In case of possible profit sales, support levels 163.80 – 161.63 can be triggered again. If the price comes to these support levels, a potential bullish opportunity may arise.
Supports 171.50 – 167.96 – 163.80
Resistances 178.06 – 181.75 – 186.75
 ADA/USDT
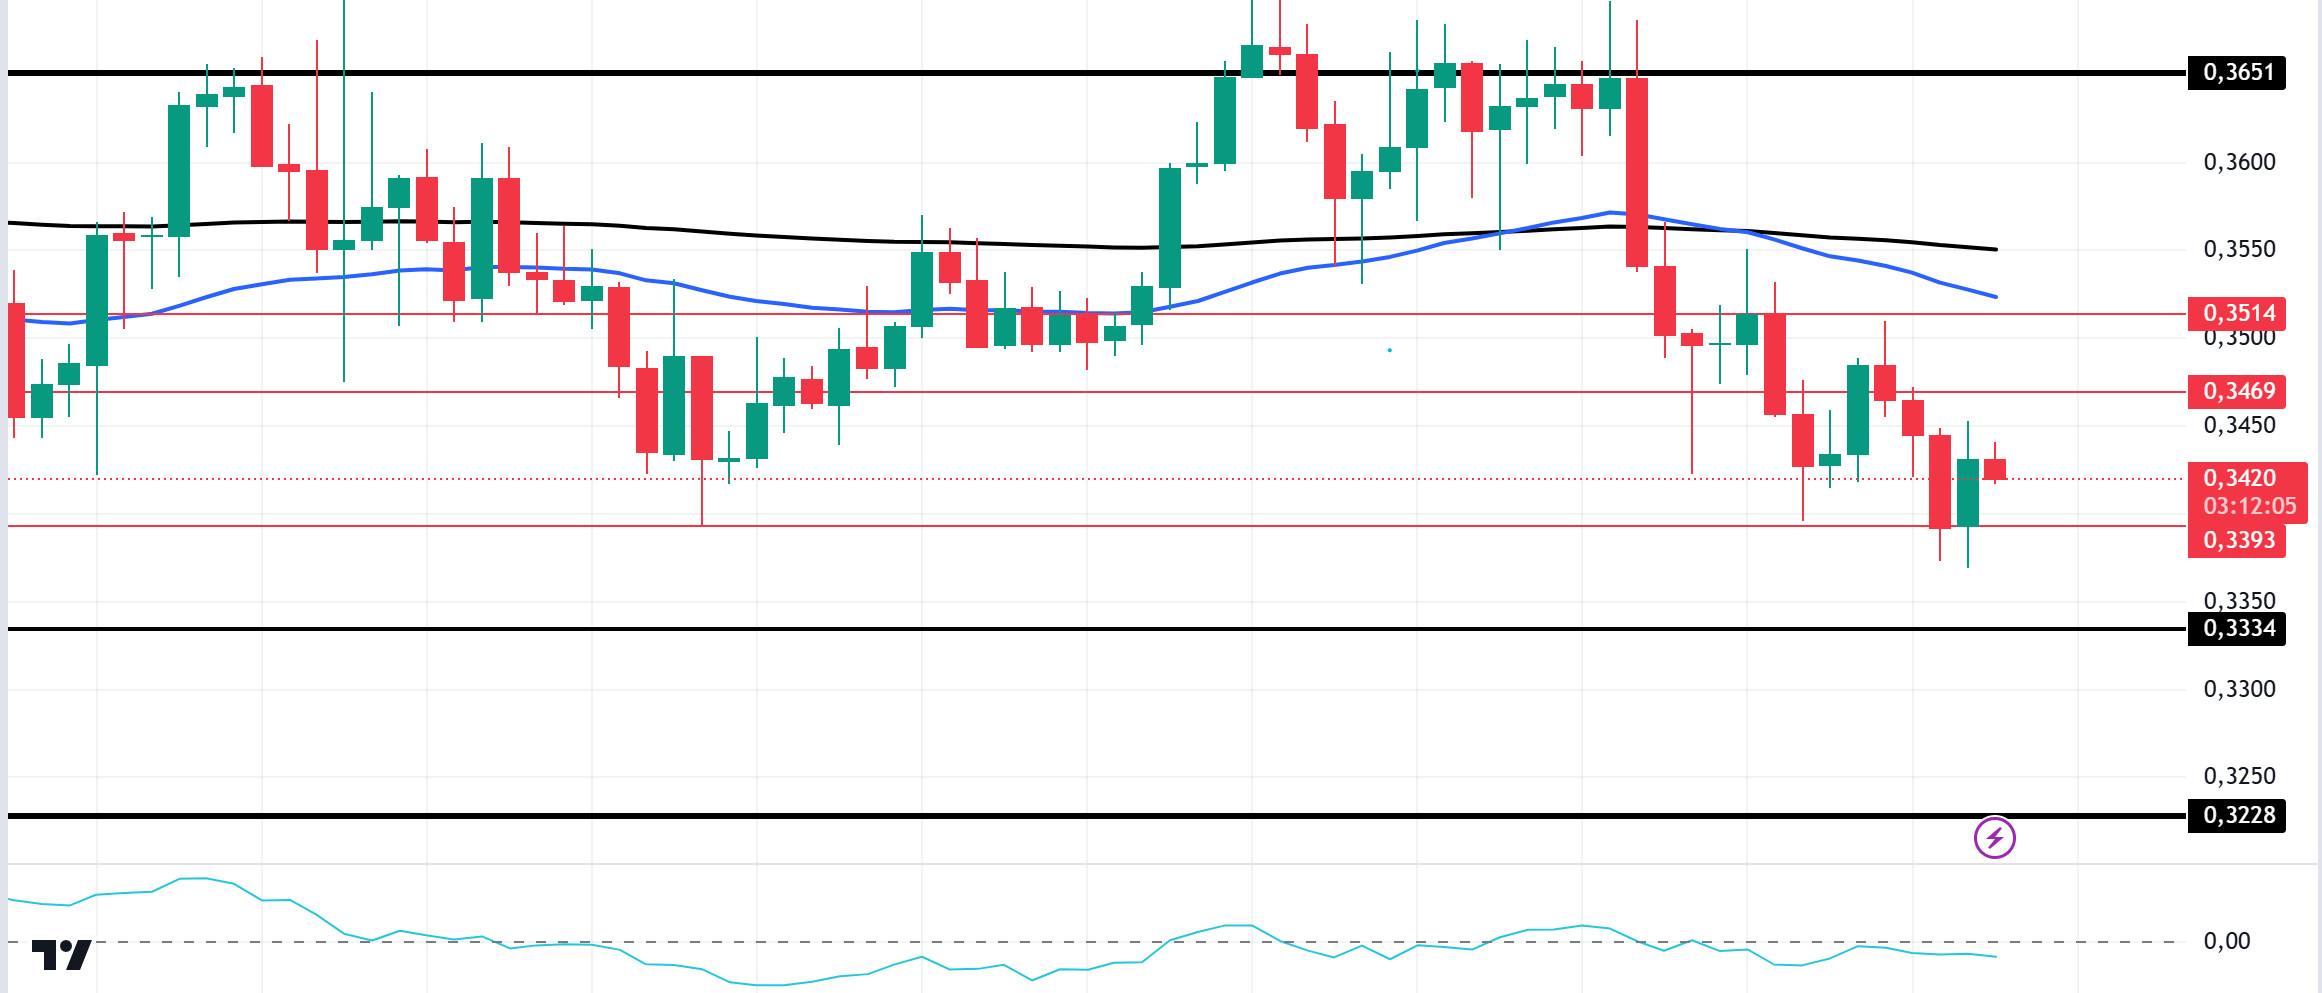
In the Cardano ecosystem, Cardano (ADA) saw a 264% increase in net flows this week, according to IntoTheBlock data. This means that investors are accumulating while ADA consolidates. Another data, Open Interest, fell to a 16-month low, raising fears of a 6.19% price drop. This kept pricing in the area where it has been accumulating since October 1. On the 4-hour chart, the price started pricing below the 50 EMA (Blue Line) and 200 EMA (Black Line). At the same time, the 50 EMA is below the 200 EMA. This suggests that the trend may be bearish. The Chaikin Money Flow (CMF)20 indicator has a negative value. For this reason, we see that there are money outflows. As a matter of fact, ADA, which tested the 0.3651 level for the fourth time, could not break it for this reason. If the decline continues, it may test the support level of 0.3334 once again. It may be appropriate to buy when it reaches this price level.
Supports 0.3393 – 0.3334 – 0.3228
Resistances 0.3469 – 0.3514 – 0.3651
AVAX/USDT
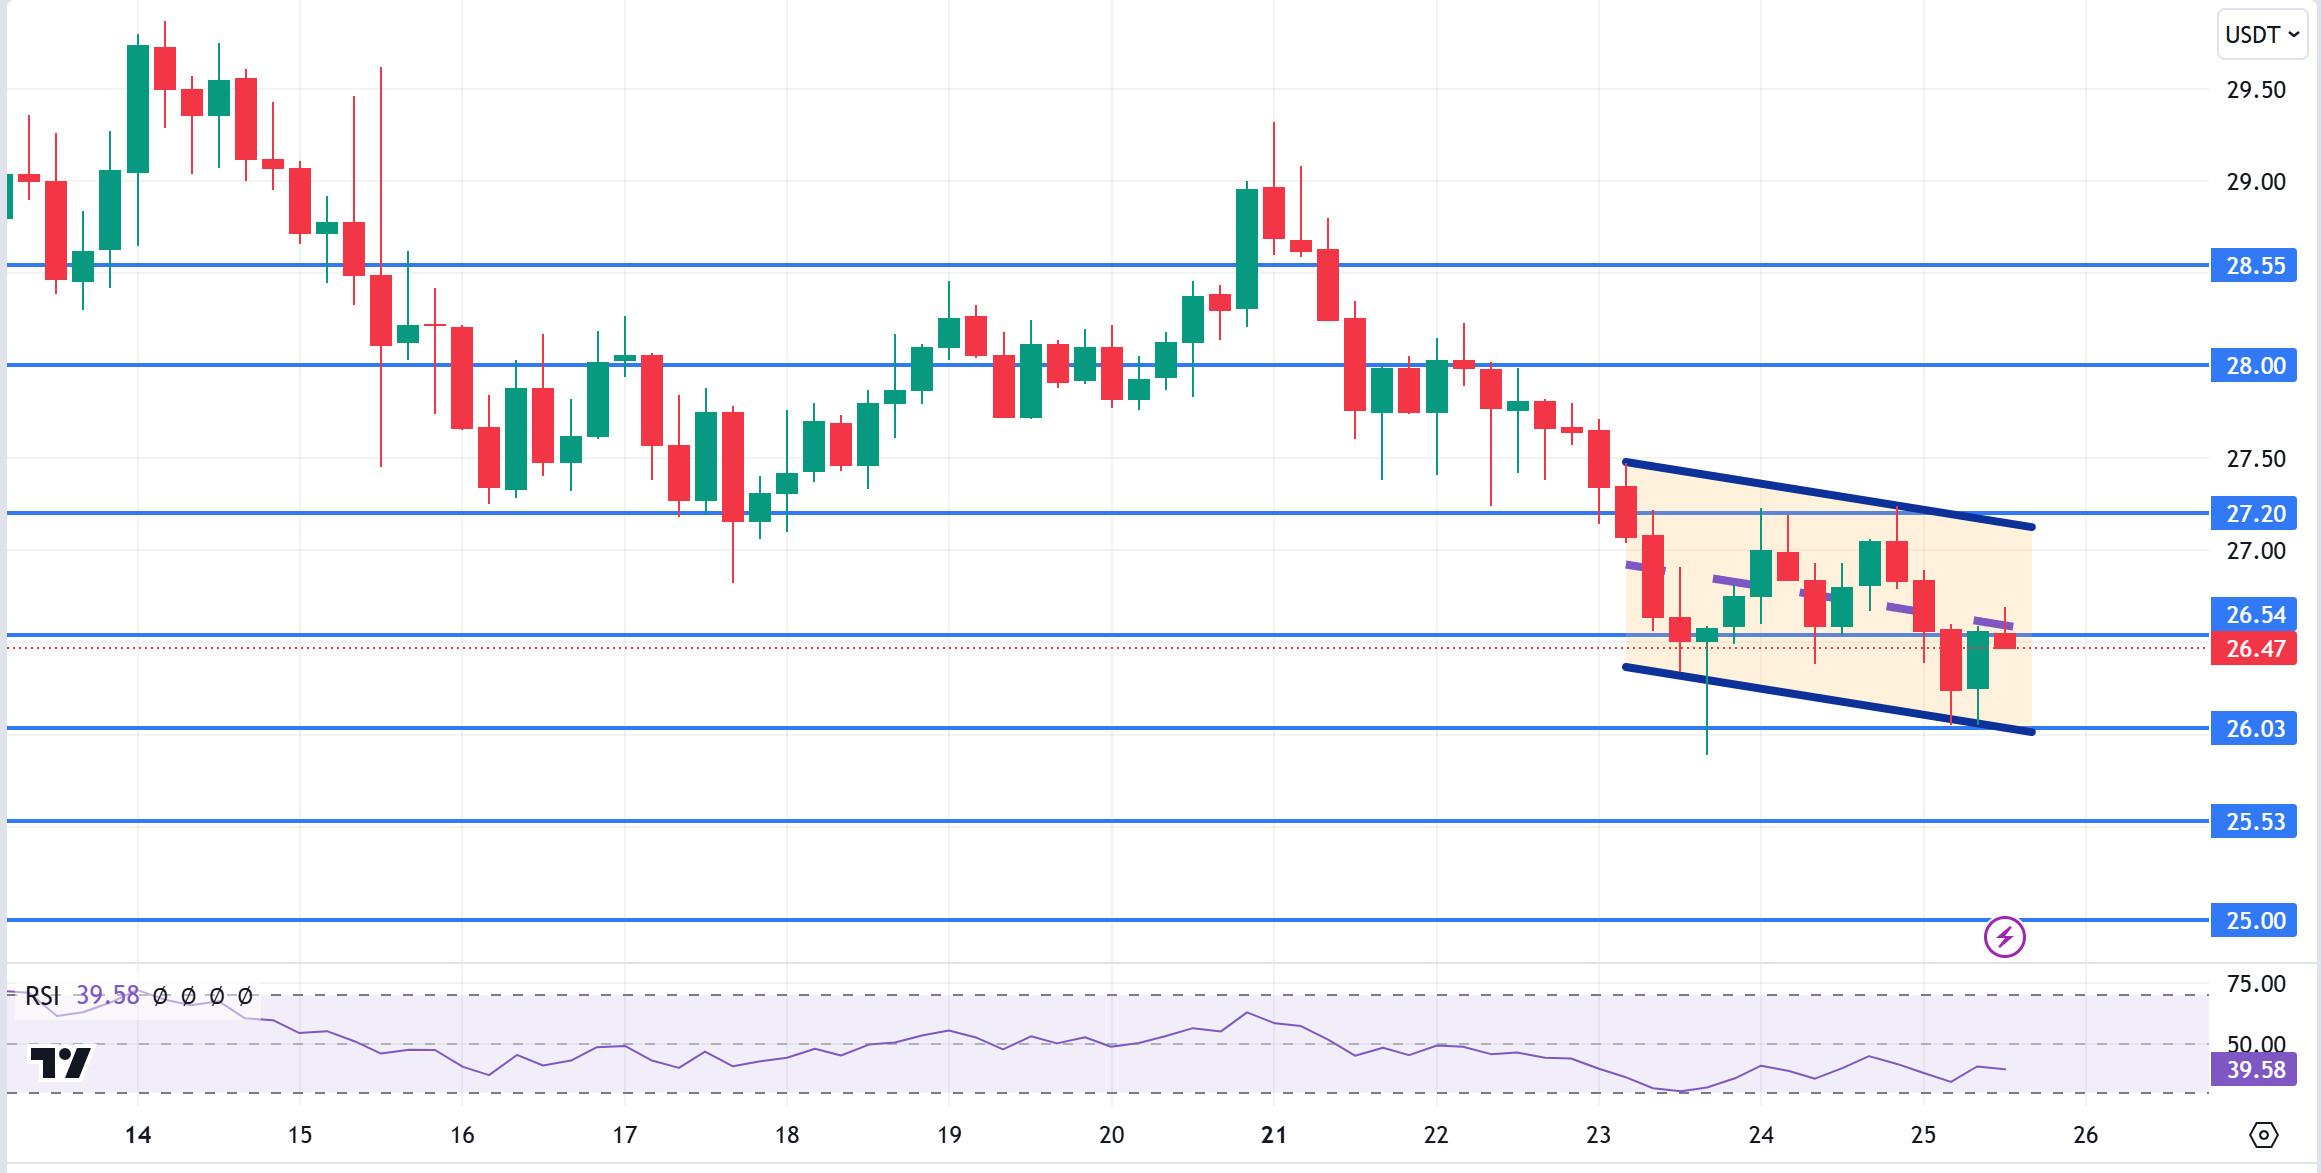
AVAX, which opened today at 26.84, is trading at 26.47, down about 1.5% during the day. Today, there is no planned data to be announced especially by the US and expected to affect the market. For this reason, it may be a low-volume day where we may see limited movements. News flows from the Middle East will be important for the market.
On the 4-hour chart, it is in a bearish channel. The Relative Strength Index value has approached the oversold zone with 39 and can be expected to rise slightly from these levels. In such a case, it may test the 27.20 resistance. On the other hand, sales may increase in case of news of increasing tension in the Middle East. In such a case, it may test 26.03 support. As long as it stays above 25.00 support during the day, the desire to rise may continue. With the break of 25.00 support, sales may increase.
Supports 26.54 – 26.03 – 25.53
Resistances 27.20 – 28.00 – 28.55
TRX/USDT
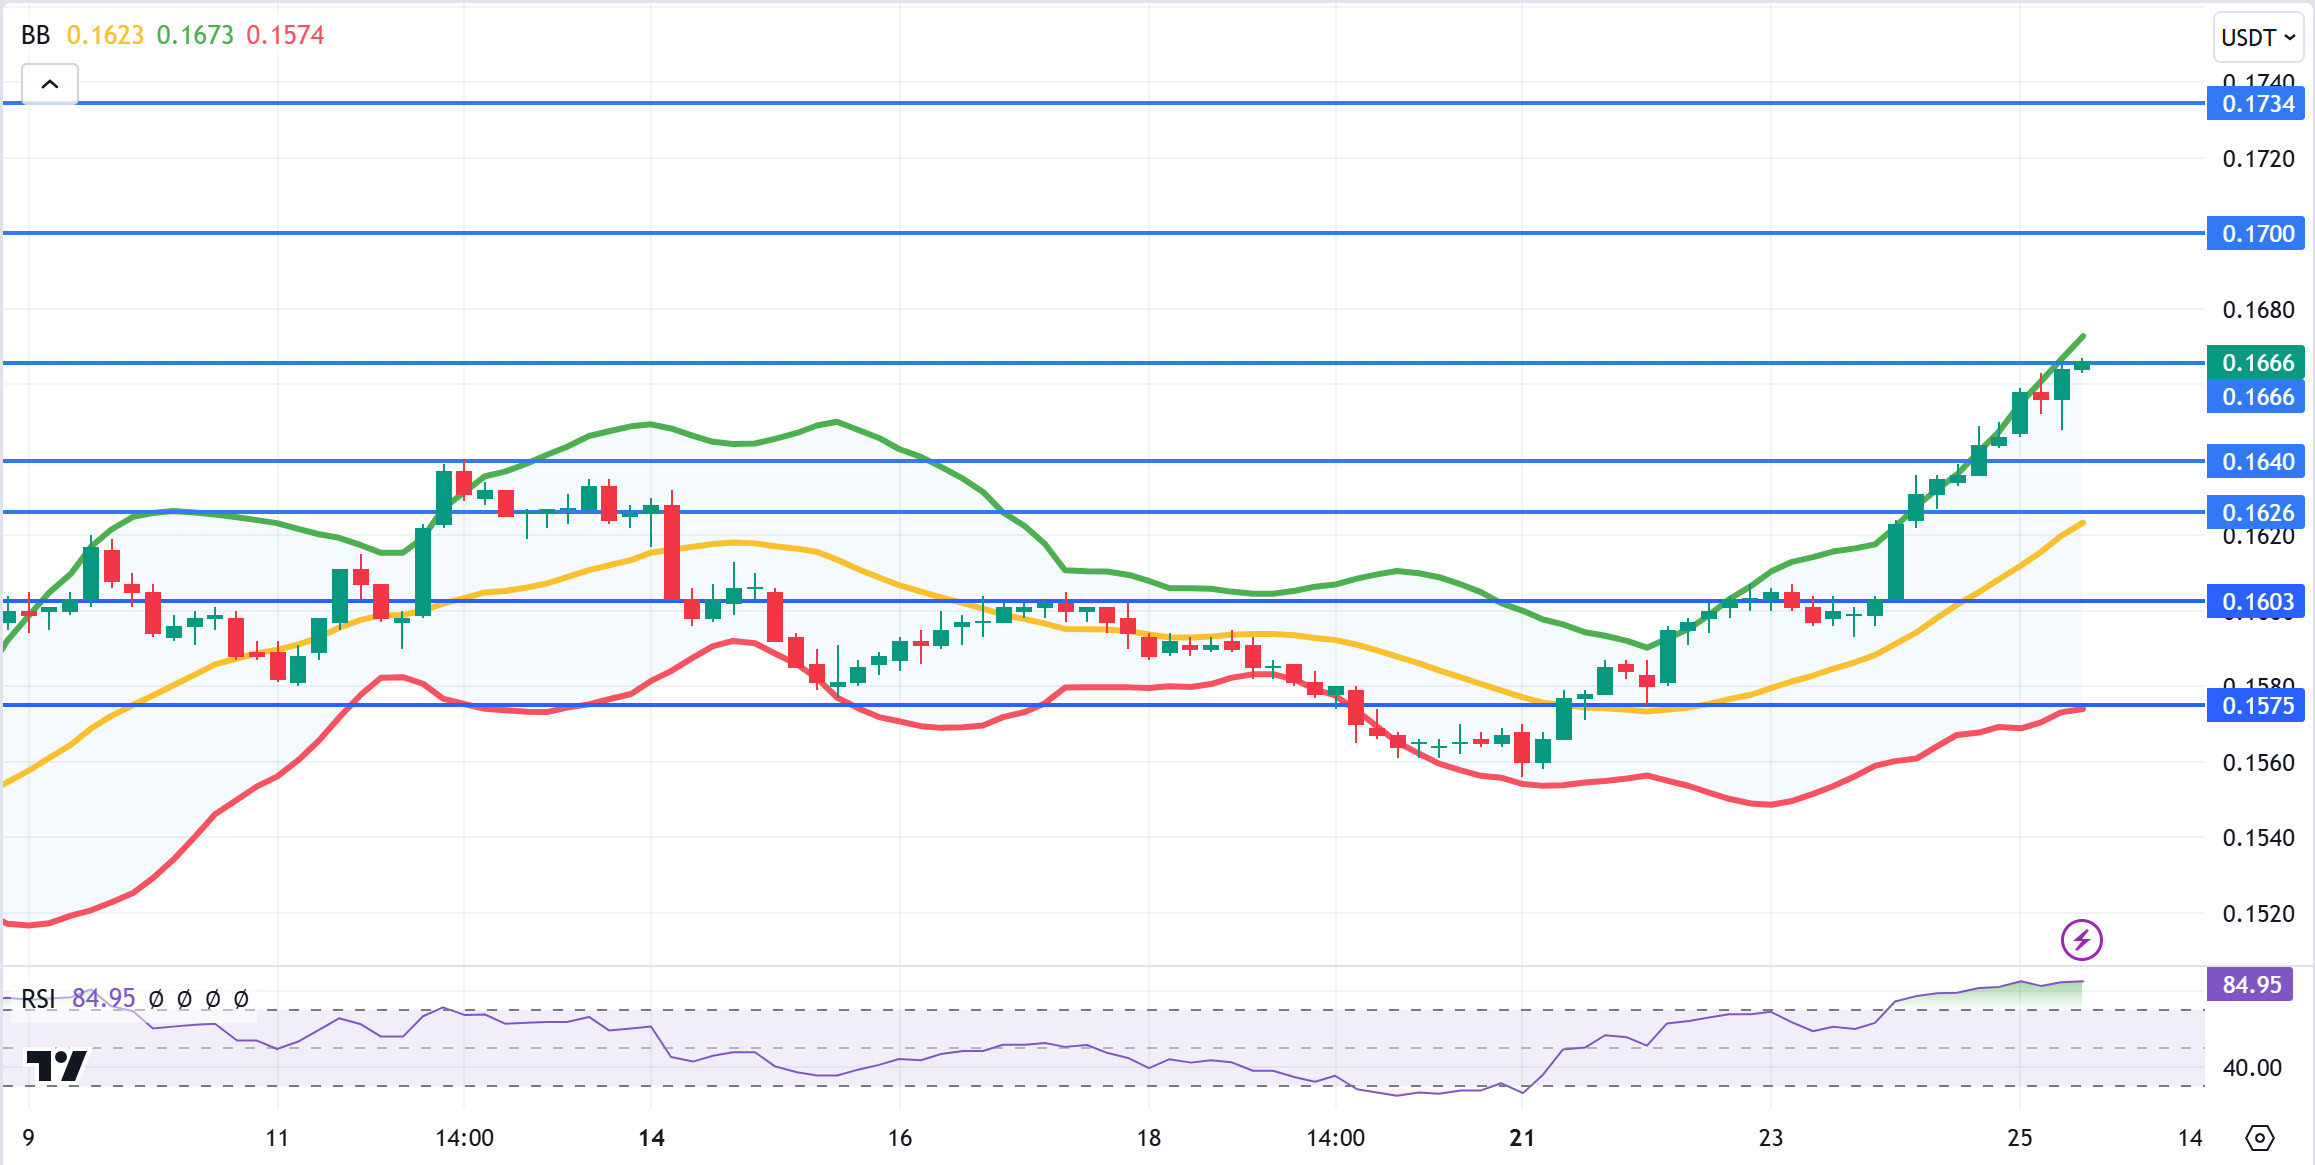
TRX, which started today at 0.1647, is trading at 0.1666, up about 1% during the day. There is no scheduled data for the market today. The market will be closely following the news flows regarding the tension in the Middle East.
On the 4-hour chart, it is located at the Bollinger upper band. The Relative Strength Index value is in the overbought zone with 85 and can be expected to decline slightly from its current level. In such a case, it may move to the Bollinger middle band and test the 0.1640 support. However, it cannot close the candle below 0.1640 support and may test 0.1700 resistance with the buying reaction that will occur if news flow comes that the tension in the Middle East is decreasing. As long as TRX stays above 0.1482 support, the desire to rise may continue. If this support is broken downwards, sales can be expected to increase.
Supports 0.1640 – 0.1626 – 0.1603
Resistances 0.1666 – 0.1700 – 0.1734
DOT/USDT
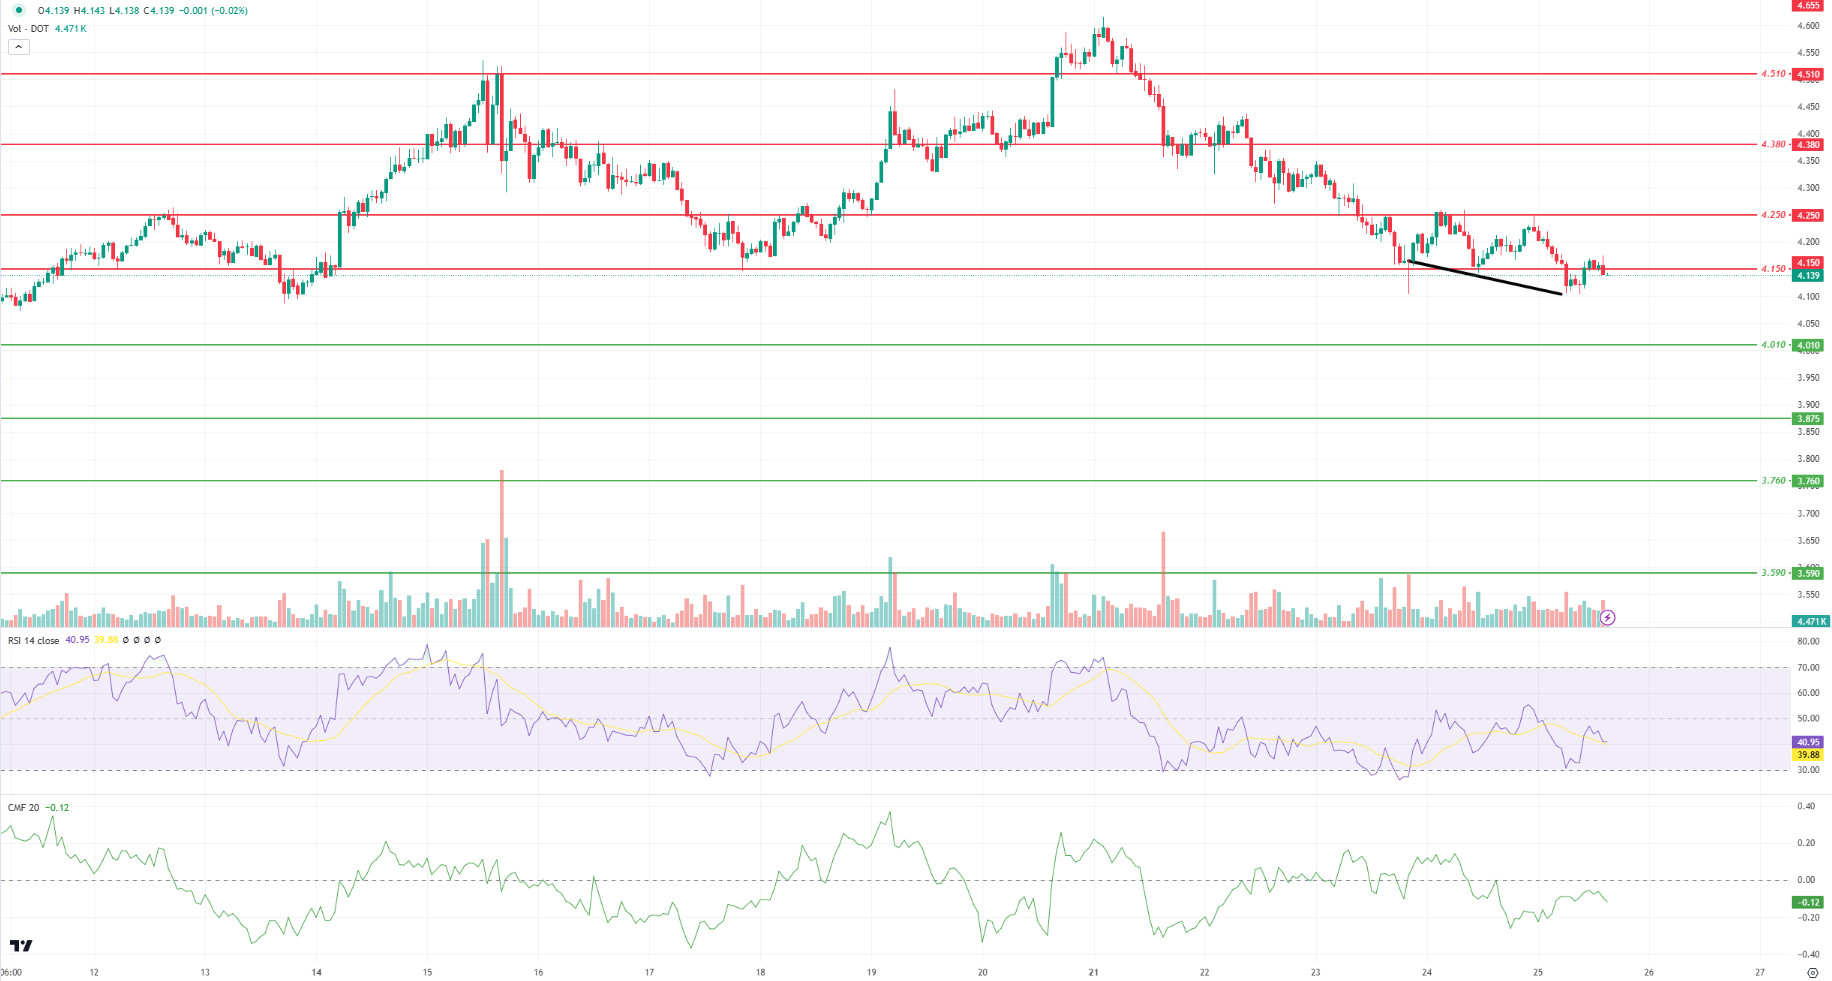
When we examine the Polkadot (DOT) chart, a rise towards the 4.150 level was observed after the positive divergence between the price and the Relative Strenght Index (RSI). When we examine the Chaikin Money Flow (CMF) oscillator, we see that selling pressure continues. If the price cannot hold above the 4.150 level, a retracement towards 4.010 levels may be seen. On the other hand, if the price maintains above the 4.150 level, it may want to break the selling pressure at the 4.250 level.
Supports 4.010 – 3.875 – 3.760
Resistances 4.150 – 4.250 – 4.380
SHIB/USDT
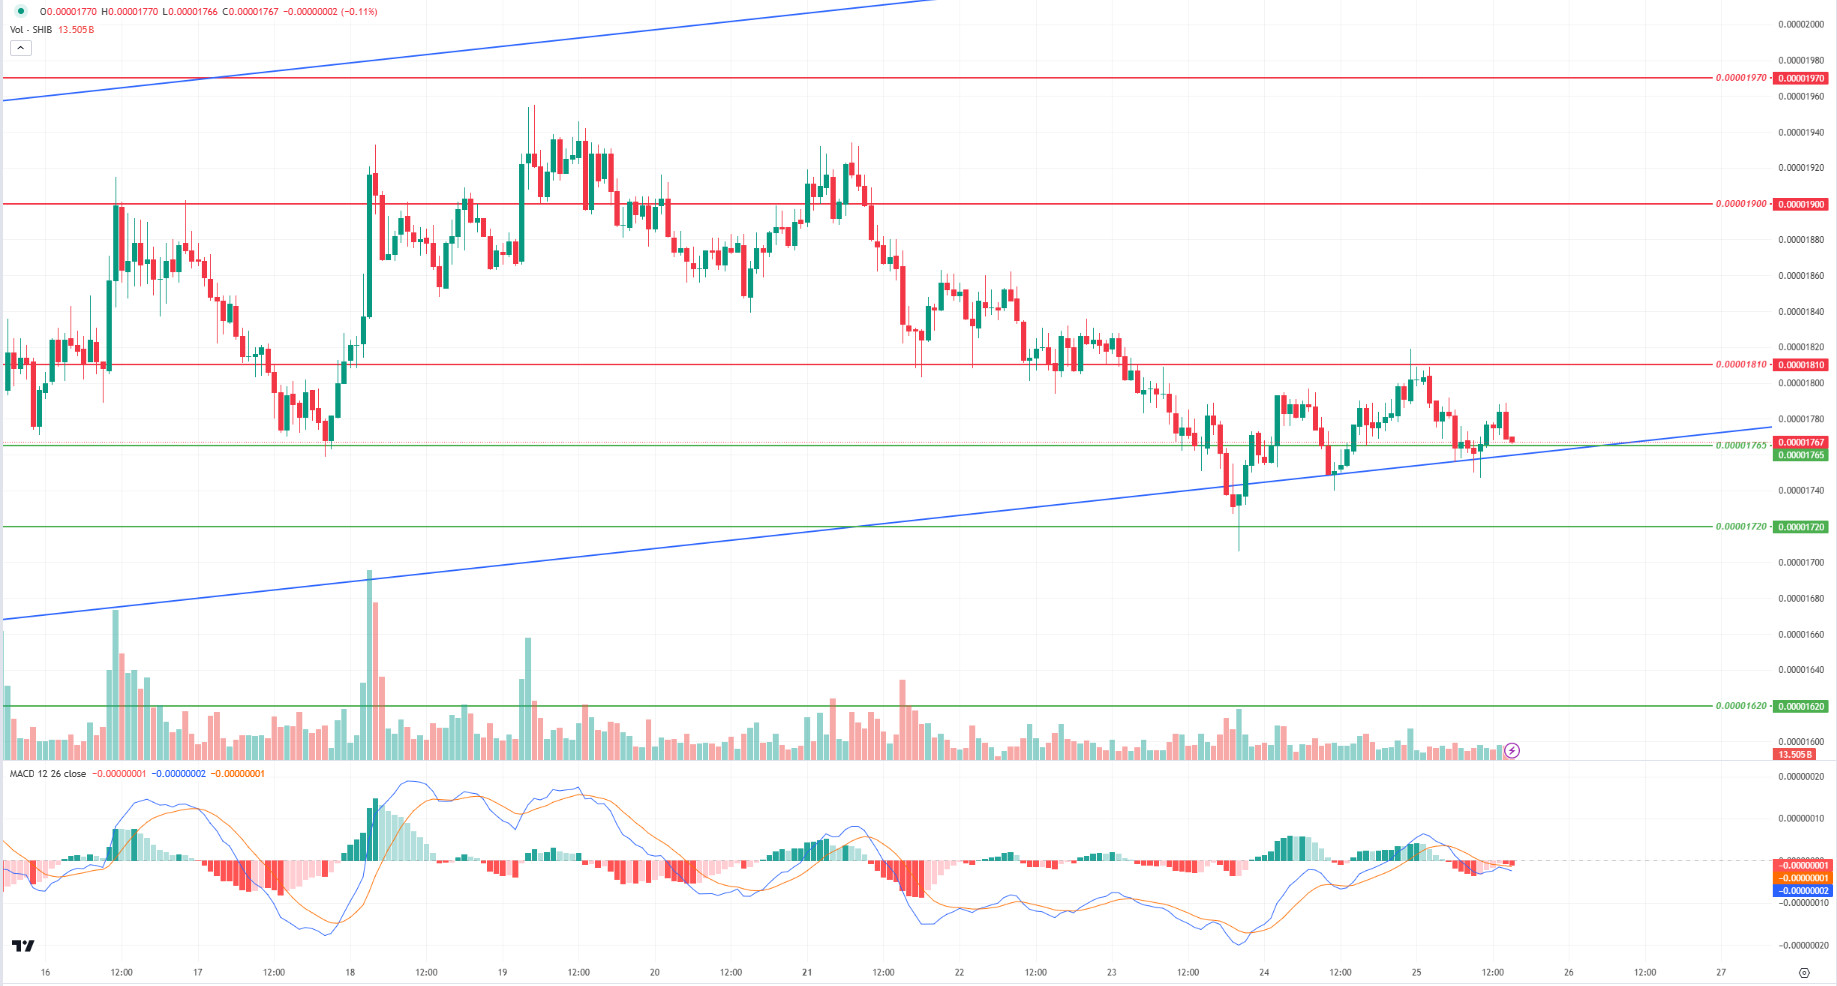
Shiba Inu (SHIB) failed to achieve a price increase despite capturing a trading volume of 3.4 trillion SHIB in the last 7 days. When we examine the SHIB chart, the price seems to have stabilized above the 0.00001765 level. According to the MACD oscillator, we can say that the selling pressure has decreased compared to the previous hour. In this context, the price may make a move towards 0.00001810 levels. On the other hand, if the selling pressure increases, the price may retreat towards 0.00001720 support levels if the price does not get a reaction from the lower band of the rising trend.
Supports 0.00001765 – 0.00001720 – 0.00001620
Resistances 0.00001810 – 0.00001900 – 0.00001970
LEGAL NOTICE
The investment information, comments and recommendations contained herein do not constitute investment advice. Investment advisory services are provided individually by authorized institutions taking into account the risk and return preferences of individuals. The comments and recommendations contained herein are of a general nature. These recommendations may not be suitable for your financial situation and risk and return preferences. Therefore, making an investment decision based solely on the information contained herein may not produce results in line with your expectations.


