
MARKET SUMMARY
Latest Situation in Crypto Assets
| Assets | Last Price | Change % | |||
|---|---|---|---|---|---|
| Weekly | Monthly | Since the beginning of the year | Market Cap. | ||
| BTC | 96,548.36$ | -0.22% | -0.39% | 2.27% | 1,91 T |
| ETH | 3,441.73$ | 0.46% | -7.67% | 2.69% | 414,89 B |
| XRP | 2.418$ | 8.43% | -8.31% | 4.08% | 138,76 B |
| SOLANA | 210.82$ | 8.95% | -10.94% | 8.75% | 101,82 B |
| DOGE | 0.3402$ | 5.26% | -18.92% | 4.94% | 50,19 B |
| CARDANO | 1.0528$ | 15.88% | -14.24% | 14.77% | 37,00 B |
| TRX | 0.2622$ | 1.33% | -32.19% | 2.71% | 22,60 B |
| AVAX | 40.50$ | 4.63% | -25.53% | 7.44% | 16,61 B |
| LINK | 22.17$ | -5.85% | -8.13% | 2.28% | 14,15 B |
| SHIB | 0.00002290$ | 2.66% | -24.43% | 5.82% | 13,50 B |
| DOT | 7.485$ | 3.26% | -27.19% | 6.51% | 11,49 B |
*Table was prepared on 1.3.2025 at 11:30 (UTC). Weekly values are calculated for 7 days based on Freitag.
Fear & Greed Index
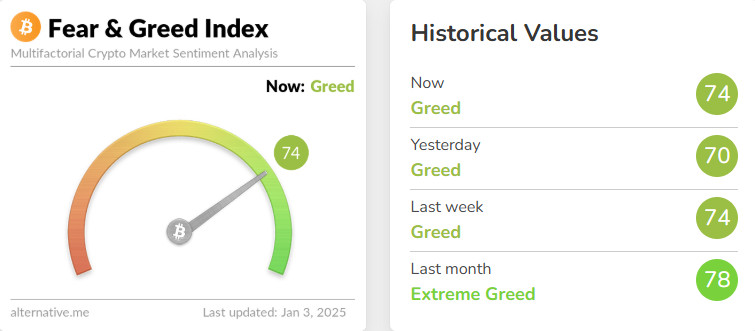
Source: Alternative
Change in Fear and Greed Value: 0
Last Week’s Level: 74
This Week’s Level: 74
This week, the Fear and Greed Index remained stable at 74, and the cautious stance in the markets continues. Tether’s purchase of 7,628 Bitcoins signaled institutional demand, while BlackRock’s BTC ETF (IBIT) -$330.8 million outflow brought possible selling pressure to the agenda. US jobless claims remained below expectations at 211K, indicating that economic data was strong, but the market impact was limited. These developments did not create a significant change in risk appetite.
Total MarketCap
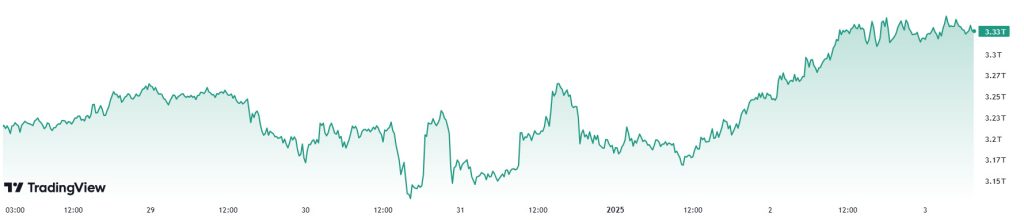
Source: Tradingview
- Last Week Market Capitalization: 3.19 trillion Dollars
- Market Capitalization This Week: 3.33 trillion Dollars
The total market capitalization in the cryptocurrency market is close to ending its 3-week losing streak this week. The total market capitalization, which recorded an increase of 4.23% compared to the previous week, made a positive start to the first week of the year. While there was an increase of approximately $132 billion compared to the beginning of the week, the total market capitalization rose more than $139 billion in just the first 2 days of 2025. Looking at this picture, it is seen that the number of investors who think that the rise will continue in the new year is considerable.
Total 2
When Total 2 is analyzed, it is seen that the previous week closed positive and this week it increased by 5.38% to $ 72.17 billion. Total 2, which shows a higher percentage increase compared to Total, shows that the money flow into altcoins is higher than Bitcoin. It is seen that 54.67% of the total money entering the market from the beginning of the week to today has been directed to altcoins. In this period when Bitcoin dominance is still more than half of the total market capitalization of cryptocurrencies, the flow of money into altcoins more than Bitcoin may be an important leading signal for the altcoins’ bullish season
Total 3
When Total 3 is analyzed, similar to Total 2, it closed positive in the previous week and realized a 6.12% increase this week with a net inflow of $57.35 billion. Approximately 20% of the net inflows to altcoins are invested in Ethereum, while 80% is distributed among other altcoins and the altcoin market average outperforms Ethereum.
Of the net inflows into the crypto market since the beginning of this week, 43.44% of the net inflows were into altcoins other than Ethereum, 11.22% into Ethereum and 45.32% into Bitcoin.
Bitcoin Dominance
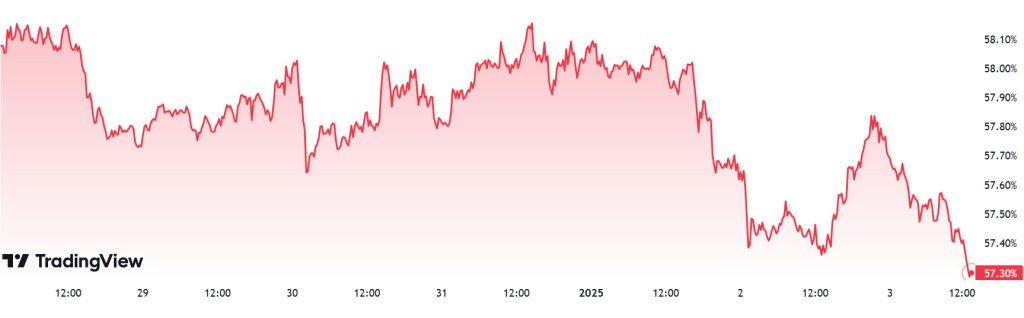
Source: Tradingview
“BTC.D Chart Image to be Added”
Bitcoin dominance reached a monthly high of 59.92% with the positive momentum it gained in early Dezember. However, as of the previous week, it was pressured at these levels and started to show a negative trend. The negative trend in the dominance has continued throughout the current week and the negative outlook has not changed on a weekly basis.
In this context, Bitcoin dominance closed last week at 58.03% and is moving at 57.30% as of this week.
Weekly Change:
- Last Week’s Level: 58.03%
- This Week’s Level: 57.30%
Ethereum Dominance
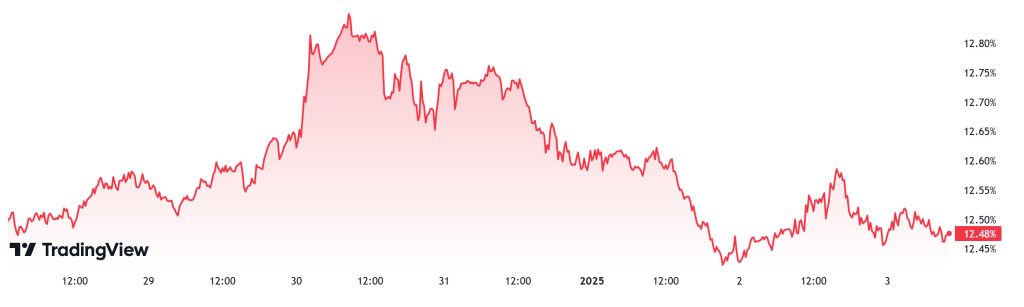
Source: Tradingview
Ethereum Dominance
ETH dominance, which closed last week at 12.64%, rose slightly at the beginning of the new week, but then entered a downtrend. ETH Dominance is currently at 12.48%.
In the coming week, job openings and personnel change rate, applications for unemployment benefits, non-farm employment and unemployment rate will be announced on the US side. With the positive evaluation of these data by the market, there may be an increase in ETH dominance after possible decreases in BTC dominance. As a result of this situation, ETH dominance can be expected to rise to 13% – 13.50% levels for the next week.
Bitcoin Spot ETF
Source: SosoValue
Featured Developments
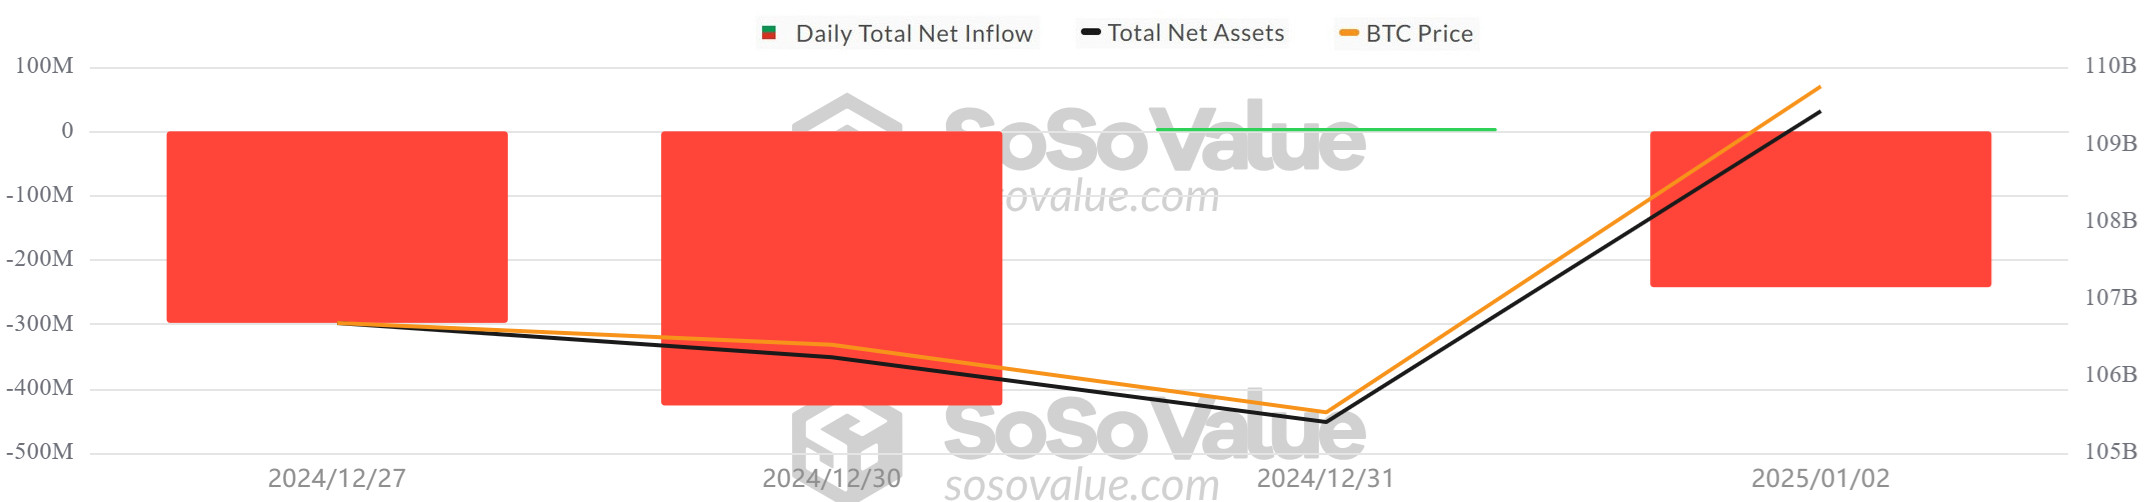
- Net Outflows: Between Dezember 27, 2024 and Januar 02, 2025, net outflows totaled -$945.5 million. Despite a 1.27% increase in the Bitcoin price during this period, there were significant net outflows from ETFs.
- BlackRock IBIT ETF Big Outflow: The net outflow of $332.6 million from the BlackRock IBIT ETF on Januar 02, 2025 was the largest outflow since launch. This stood out as a remarkable development across the market.
- Cumulative Net Inflows: Cumulative net inflows into spot BTC ETFs fell below $35 billion by the end of the 246th trading day.
| DATE | COIN | Price | ETF Flow (mil$) | ||
|---|---|---|---|---|---|
| Open | Close | Change % | |||
| 27-Dec-24 | BTC | 95,750 | 94,258 | -1.56% | -287.9 |
| 30-Dec-24 | 93,699 | 92,759 | -1.00% | -415.1 | |
| 31-Dec-24 | 92,759 | 93,548 | 0.85% | 5.3 | |
| 01-Jan-25 | 93,548 | 94,580 | 1.10% | 0 | |
| 02-Jan-25 | 94,580 | 96,967 | 2.52% | -247.8 | |
| Total for 27 Dec 24 – 02 Jan 25 | 1.27% | -945.5 | |||
Between Dezember 27, 2024 and Januar 02, 2025, a total net outflow of -$945.5 million was observed in Bitcoin ETFs. Large outflows, especially from the BlackRock IBIT ETF, increased negative pressure in the market. However, the 1.27% increase in Bitcoin price during the same period was noteworthy. This suggests that while ETF investors are realizing profit realizations, the Bitcoin market is supported by general investor interest. Future economic developments, policy changes and market-friendly regulations could lead to a positive flow in Spot Bitcoin ETFs again
Ethereum spot ETF
Source: SosoValue
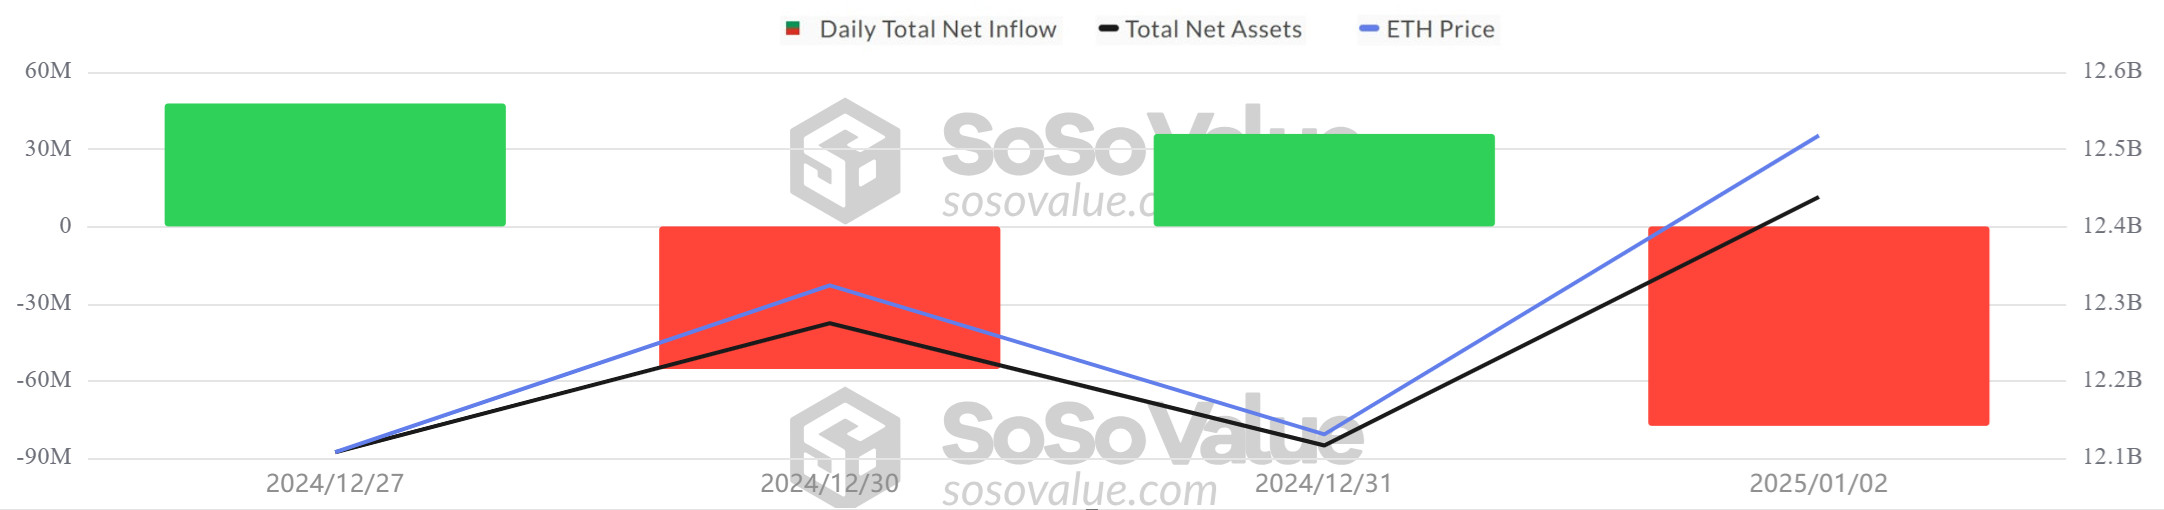
Ethereum price gained a total of 3.63% between Dezember 27, 2024 and Januar 02, 2025. The rise gained momentum in the first days of the new year: Januar 02 in particular saw the strongest daily rise of the week at 2.83%, with Ethereum closing at $3,454. The move showed continued investor interest in Ethereum despite price volatility throughout the period.
During the same period, US Spot ETH ETFs recorded net outflows totaling $49.3 million. Although a net inflow of $47.7 million was seen on Dezember 27, outflows of -$55.5 million on Dezember 30 and -$77.5 million on Januar 02 turned total flows negative. On a spot ETH ETF basis, BlackRock (ETHA) saw inflows of $20.2 million on Dezember 27, while Fidelity (FETH) posted a strong inflow of $31.8 million on Dezember 31. In contrast, Bitwise (ETHW) attracted attention with an outflow of $56.1 million on Januar 02 and Grayscale (ETHE) with an outflow of $21.4 million on the same day.
| DATE | COIN | Price | ETF Flow (mil$) | ||
|---|---|---|---|---|---|
| Open | Close | Change % | |||
| 27-Dec-24 | ETH | 3,333 | 3,332 | -0.03% | 47.7 |
| 30-Dec-24 | 3,355 | 3,360 | 0.15% | -55.5 | |
| 31-Dec-24 | 3,360 | 3,336 | -0.71% | 36 | |
| 01-Jan-25 | 3,336 | 3,359 | 0.69% | 0 | |
| 02-Jan-25 | 3,359 | 3,454 | 2.83% | -77.5 | |
| Total for 27 Dec 24 – 02 Jan 25 | 3.63% | -49.3 | |||
The gradual rise in the price over this period, coupled with a particularly strong close on Januar 02, suggests that investor interest in Ethereum remains intact. Although overall ETF flows have been negative this week, cumulative net inflows in US Spot ETH ETFs after 114 trading days stand at $2.596 billion, indicating that investors are still interested in Ethereum for the long term. Should the Donald Trump administration adopt market-friendly policies in Januar 2025, institutional demand for Spot ETH ETFs can be expected to increase further. However, high volatility and uncertain economic conditions may cause risks to persist in the short term.
Bitcoin Options Breakdown
Source: Laevitas
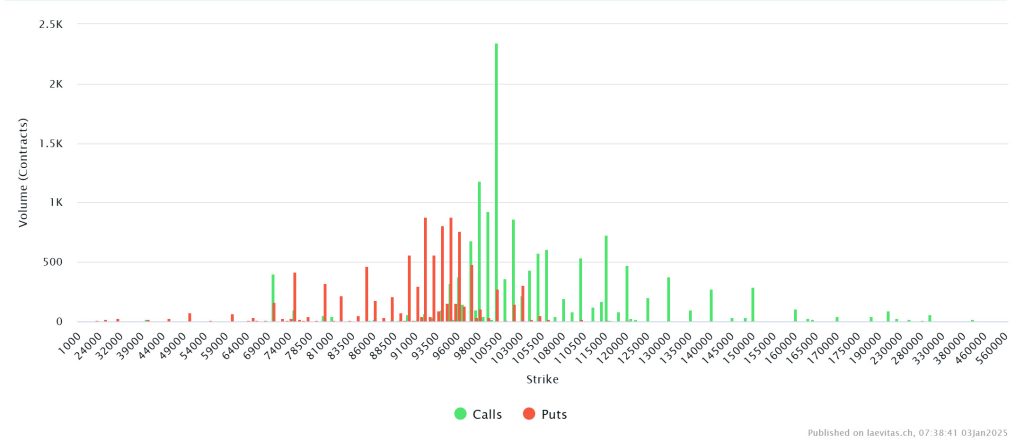
Deribit Data: Nearly 20,000 Bitcoin options contracts expire today. With a notional value of $1.93 billion, these contracts are a fraction of last week’s massive year-end expiration event. So the impact on spot markets is likely to be minimal . According to other data on Deribit, 400 BTC options expiring on Januar 10 were purchased, with bullish options worth $96,000 each.
Laevitas Data: When we analyze the chart, if we look at it from a broad perspective, it is seen that approximately put options are concentrated in the 85,000 – 95,000 level band. Call options are concentrated at the level of 95,000 – 105,000. In general, when we look at it, resistance has formed at around $ 95,000. On the other hand, it is seen that call options peaked at $ 100,000 and there is a general decline in volume after this level.
Option Expiration
Put/Call Ratio and Maximum Pain Point: If we look at the options in the last 7 days data from Deribit, the number of call options was 41.21K. In contrast, the number of put options amounted to 28.31K. The put/call ratio for options was set at 0.52. The put/call ratio of 0.52 indicates that there is a strong preference for call options over put options among investors and a possible rise in the markets. Bitcoin’s maximum pain point is set at $97,000.
Ethereum Options Distribution
Source: Laevitas
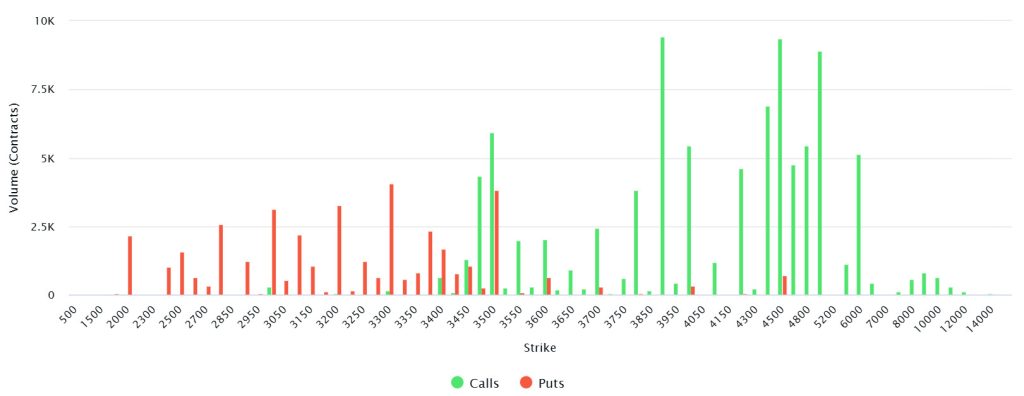
When we analyze the chart, we see that there is a significant volume increase in the call options between $3500 and $5000. We can say that this indicates that the participants in the market have a strong expectation for the price to rise. Especially at the $4500 level, a heavy call option volume is observed, which strengthens the possibility that the price may approach this level. On the other hand, put options between $2000 and $3500 suggest that investors tend to hedge their positions in line with their risk management strategies against possible price declines.
Maximum Pain Point: $3,800.
Put/Call Ratio: 0.43, indicating that the majority of investors in the market have a strong expectation for a price rise. However, it is important to keep in mind that such an intense bullish expectation carries the risk that the market has become overly optimistic and carries the risk of a possible correction.
WHAT’S LEFT BEHIND
Strive Files for Bitcoin Bond ETF
Strive has filed with the SEC for an ETF that will invest in bonds of MicroStrategy and other Bitcoin-focused companies.
Bitwise Files for Bitcoin Standard ETF
Bitwise has filed with the SEC for an ETF that will invest in shares of companies holding more than 1,000 BTC in their portfolio.
BlackRock Doubles IBIT Spot ETFs
It was announced that BlackRock’s IBIT Bitcoin Spot ETF reached 430,770 shares and its total value exceeded $17 million.
MicroStrategy Buys Another 2138 BTC
MicroStrategy bought 2138 BTC towards the end of the year.
Marathon Digital Increases Bitcoin Holdings
Marathon Digital increased its Bitcoin holdings to 44,394 and increased its computing power to 50 EH/s.
KULR Buys $21 Million Bitcoin
US-based KULR boosted its digital asset investments by buying 217 Bitcoins.
MiCA Regulations Come into Force
The EU’s crypto regulation MiCA came into force on Dezember 30, 2024.
EU Exchanges Abolish USDT
For MiCA compliance, some EU exchanges are delisting USDT due to lack of e-money license.
FTX Restructuring Plan Begins
FTX’s restructuring plan took effect as of Januar 3, 2025.
German FDP Calls for Bitcoin Reserve
FDP leader Lindner suggested that the ECB and the German Central Bank add Bitcoin to their reserves.
BTC.Fun Launches Breast Incentive Plan
BTC.Fun has launched a million-dollar incentive plan for Bitcoin-based memes.
Grayscale Becomes Largest Ethereum Holder
Grayscale is the largest institutional Ethereum holder with $6.62 billion worth of ETH.
China Draws Attention to Crypto Developments
China’s financial report states that it is closely monitoring crypto regulations in Hong Kong.
BlackRock Bitcoin ETF Breaks Record
BlackRock’s IBIT Bitcoin ETF reached $50 billion in 11 months.
Tether Increases Bitcoin Holdings
Tether holds a total of $7.7 billion worth of Bitcoin, with assets totaling 83,759 BTC.
USDC Treasury Prints 400 Million USDCs
The USDC Treasury minted a total of 400 million USDC on the Ethereum and Algorand networks.
HIGHLIGHTS OF THE WEEK
As global markets prepare to leave behind two trading weeks shortened by the Christmas and New Year holidays, next week will start with important news. For digital assets, 2024 has been an exciting year. Former President Trump’s return to the White House and the promises he brought with him was a positive dynamic for the crypto industry. However, the President-elect’s approach to tariffs and tariffs is a factor that could directly threaten global trade and therefore the markets’ appetite for risk. In addition, the US Federal Reserve’s (FED) decision to taper its interest rate cuts may be considered as another risk factor. We expect trading volumes to return to normal this week after the holidays and healthier pricing to take place.
The new year has started with both the hopes brought by these positive variables and the potential risks. Next week, macro indicators that will provide information about the health of the US economy will be closely monitored as they may give clues about the FED’s interest rate cut course. The price of traditional investment instruments and digital assets may be in search of a new direction with these data releases. Therefore, we can say that the most critical development of the new week will be the US labor market statistics.
Non-Farm Payrolls Change and FED
There is one point that the FED insists on, which is that they do not want to cause a deterioration in the labor market while trying to control inflation. Accordingly, labor market figures for the last month of 2024 will be closely monitored, particularly the non-farm payroll change (NFP) data to be released on Januar 10.
In Oktober, due to the storms and strikes in the country, the US economy was able to record an employment increase of only 12 thousand people, well below the expectations (106 thousand). With the new report announced for November, this data was revised to 36 thousand and the employment increase for November was published as 227 thousand (Expectation: 218 thousand). It remains to be seen whether the NFP will again point to a strong increase in employment in Dezember.
We believe that the pricing model of “good data bad market, bad data good market” will continue. This is because markets are more focused on the pace at which the Fed will ease financial conditions than on the health of the US economy. In this context, a lower-than-expected NFP data may contribute to the rise in digital assets by strengthening expectations that the FED will cut interest rates faster than previously thought. A higher-than-expected NFP should be read as a dynamic that may create pressure.
*Note: The results of labor market data such as NFP and unemployment rate should be evaluated together. You can follow the expectation figures formed by the surveys in our daily analysis reports.
DARKEX RESEARCH ABTEILUNG AKTUELLE STUDIEN
Darkex Monthly Strategy Report – Januar
Weekly Onchain Analysis – Januar 1
The Altcoins That Gained the Most Value in Bitcoin’s Rise
El Salvador and Bitcoin Strategy
Negative Divergence in the Bitcoin Market: Buyer Interest Declines Despite Price Increases
Donald Trump’s Digital Cabinet
What awaits the Crypto Sector after the European Union MiCA Regulations come into full force?
What Do Changes in Ethereum TVL and Stake Amount Mean for ETH Price?
Where Are Digital Assets in the Bull Season?
WICHTIGE DATEN AUS DEM WIRTSCHAFTSKALENDER
Klicken Sie hier um den wöchentlichen Darkex Krypto- und Wirtschaftskalender zu sehen.
INFORMATIONEN:
*Der Kalender basiert auf der Zeitzone UTC (Coordinated Universal Time).
Der Kalenderinhalt auf der entsprechenden Seite wird von zuverlässigen Datenanbietern bezogen. Die Nachrichten in den Kalenderinhalten, das Datum und die Uhrzeit der Bekanntgabe der Nachrichten, mögliche Änderungen der bisherigen, erwarteten und angekündigten Zahlen werden von den Datenanbietern Institutionen gemacht.
Darkex kann nicht für mögliche Änderungen, die sich aus ähnlichen Situationen ergeben, verantwortlich gemacht werden. Sie können auch die Darkex-Kalender-Seite oder den Wirtschaftskalender in den Tagesberichten auf mögliche Änderungen von Inhalt und Zeitpunkt der Datenveröffentlichungen überprüfen.
RECHTLICHER HINWEIS
Die in diesem Dokument enthaltenen Anlageinformationen, Kommentare und Empfehlungen stellen keine Anlageberatungsdienste dar. Die Anlageberatung wird von zugelassenen Instituten auf persönlicher Basis unter Berücksichtigung der Risiko- und Ertragspräferenzen des Einzelnen durchgeführt. Die in diesem Dokument enthaltenen Kommentare und Empfehlungen sind allgemeiner Art. Diese Empfehlungen sind möglicherweise nicht für Ihre finanzielle Situation und Ihre Risiko- und Renditepräferenzen geeignet. Eine Anlageentscheidung, die ausschließlich auf der Grundlage der in diesem Dokument enthaltenen Informationen getroffen wird, kann daher möglicherweise nicht zu Ergebnissen führen, die mit Ihren Erwartungen übereinstimmen.