
Aktive Adressen
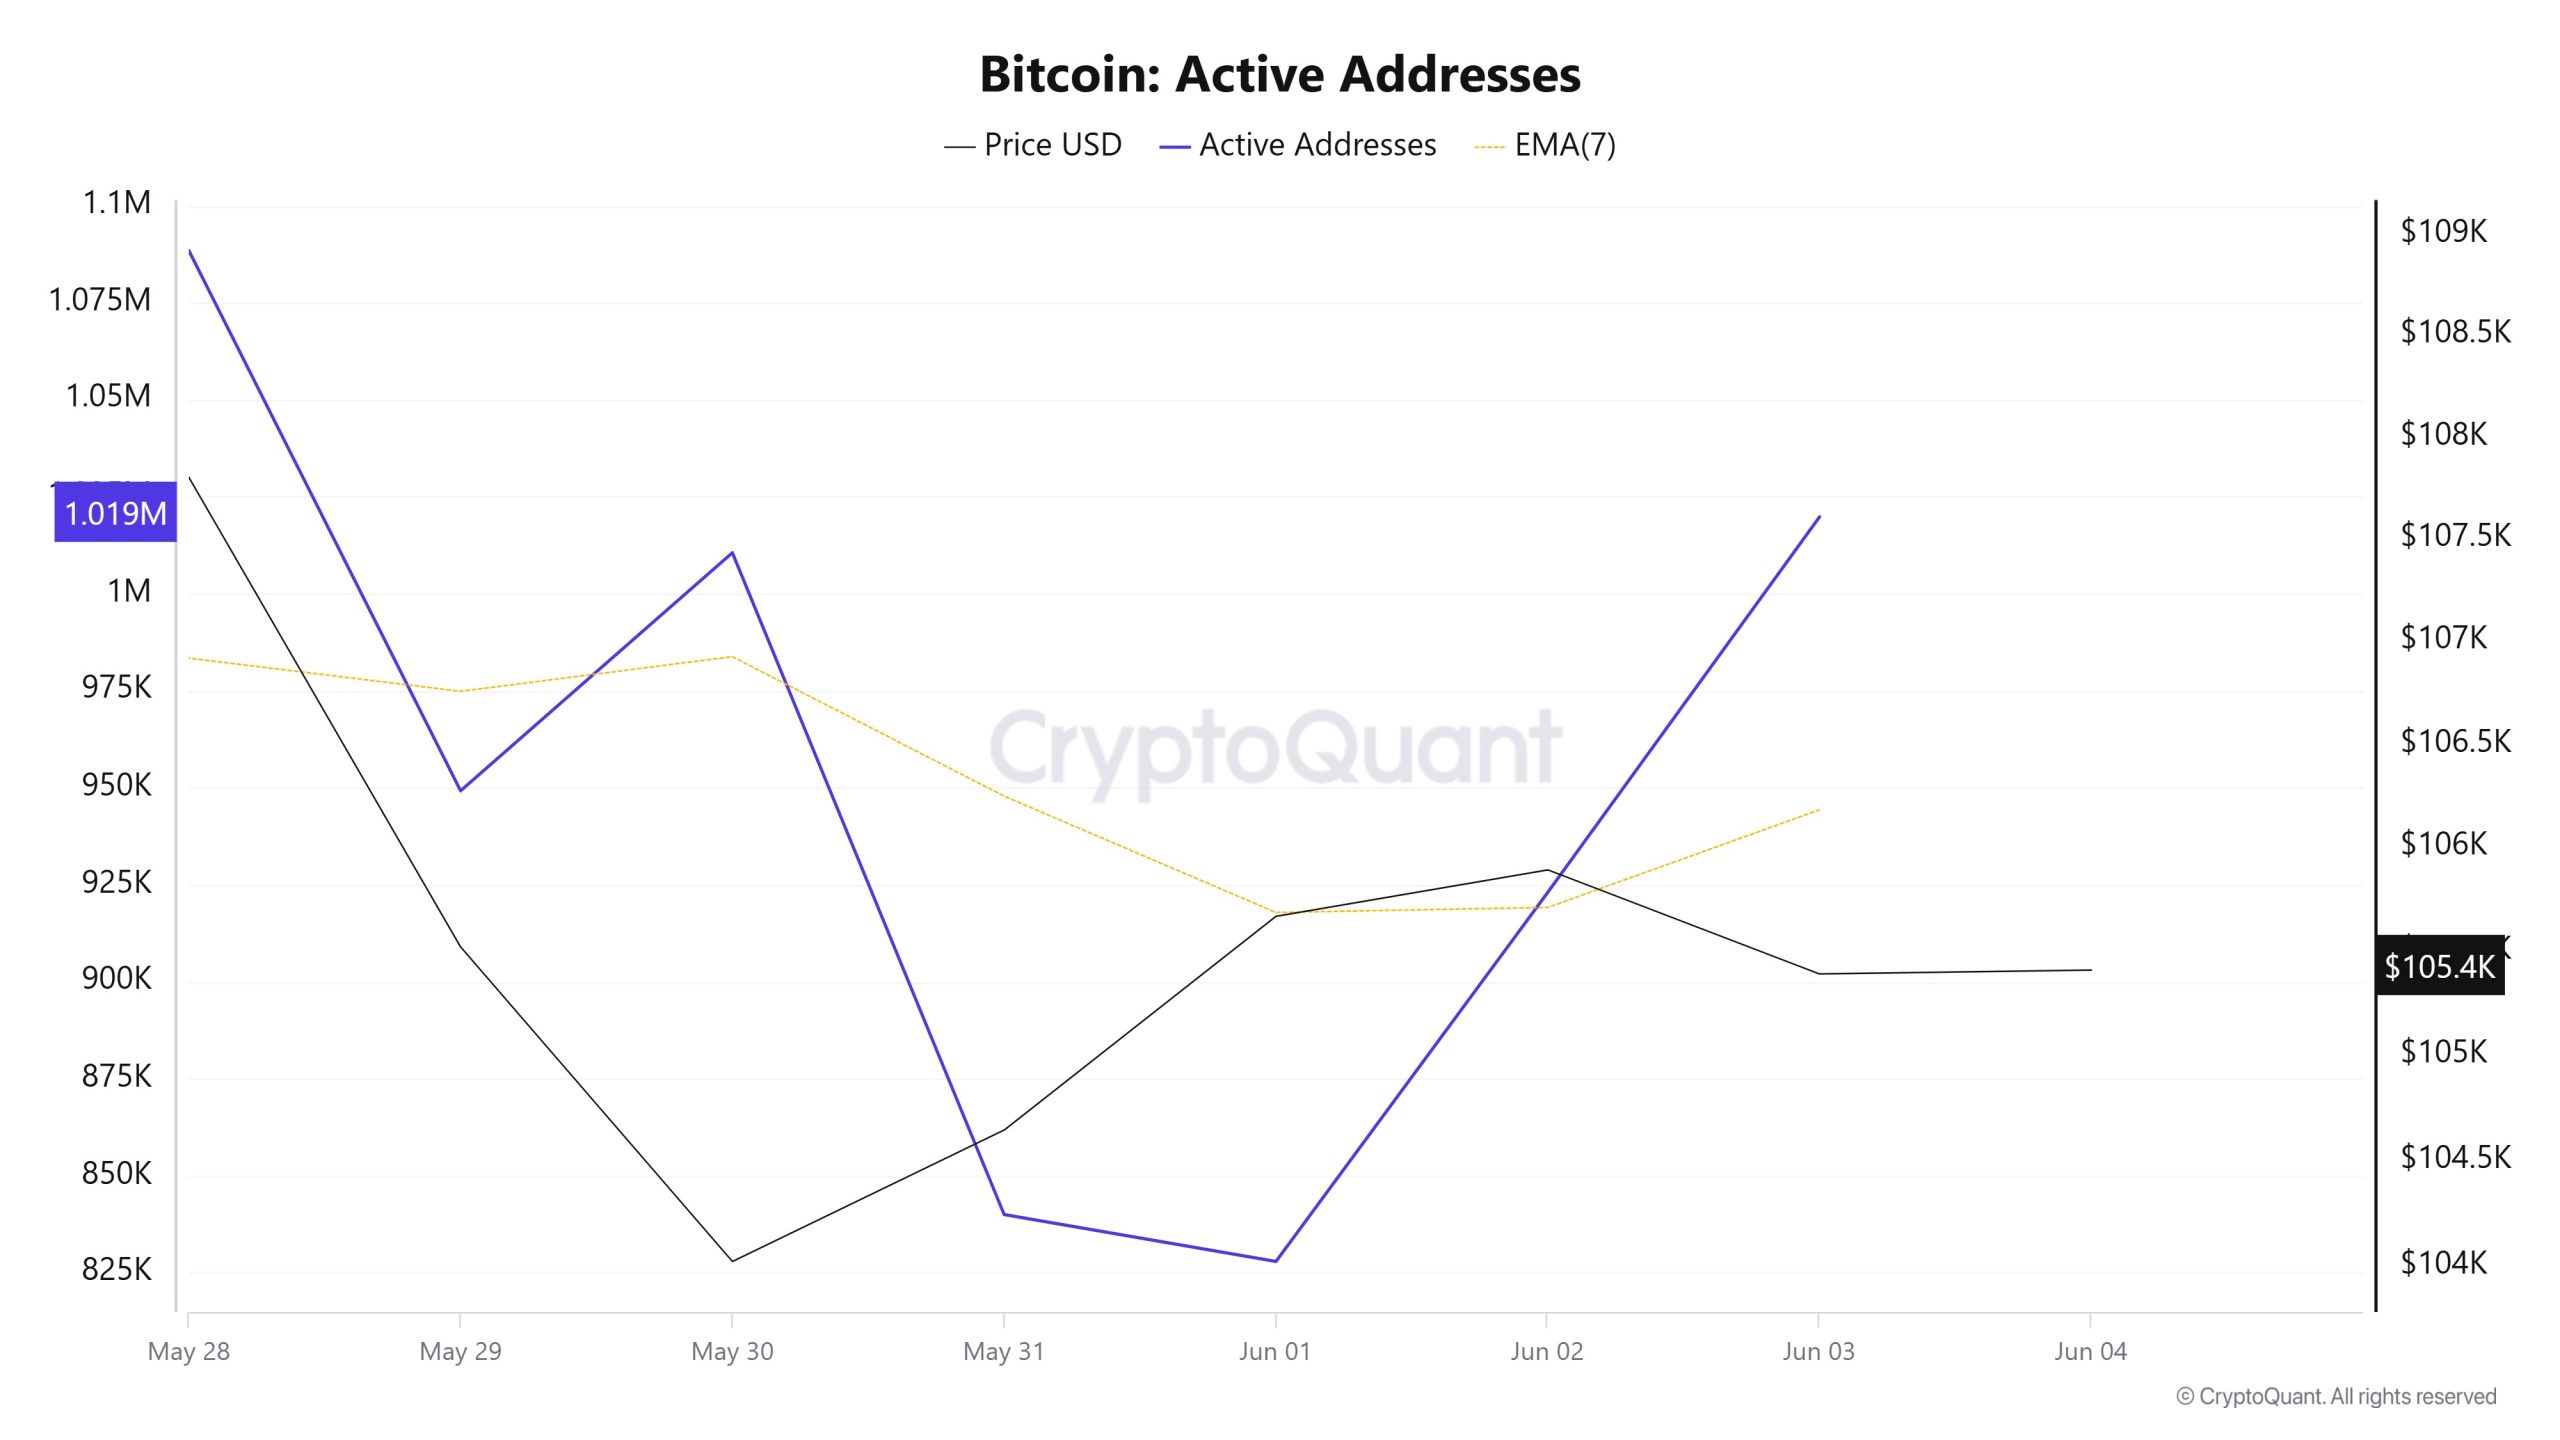
In terms of active addresses, there were 1,022,033 active entries on the BTC network between Juni 18 and Juni 25 this week. During this date range, Bitcoin rose to the $106,000 level. On Juni 22, at the intersection of price and the number of active addresses, there was an uptrend. When we follow the 7-day simple moving average, it is observed that the price followed an upward trend on the dates when this average also crossed the price. This situation indicates that purchases have been experienced since the $101,000 levels.
Aktive Absenderadressen
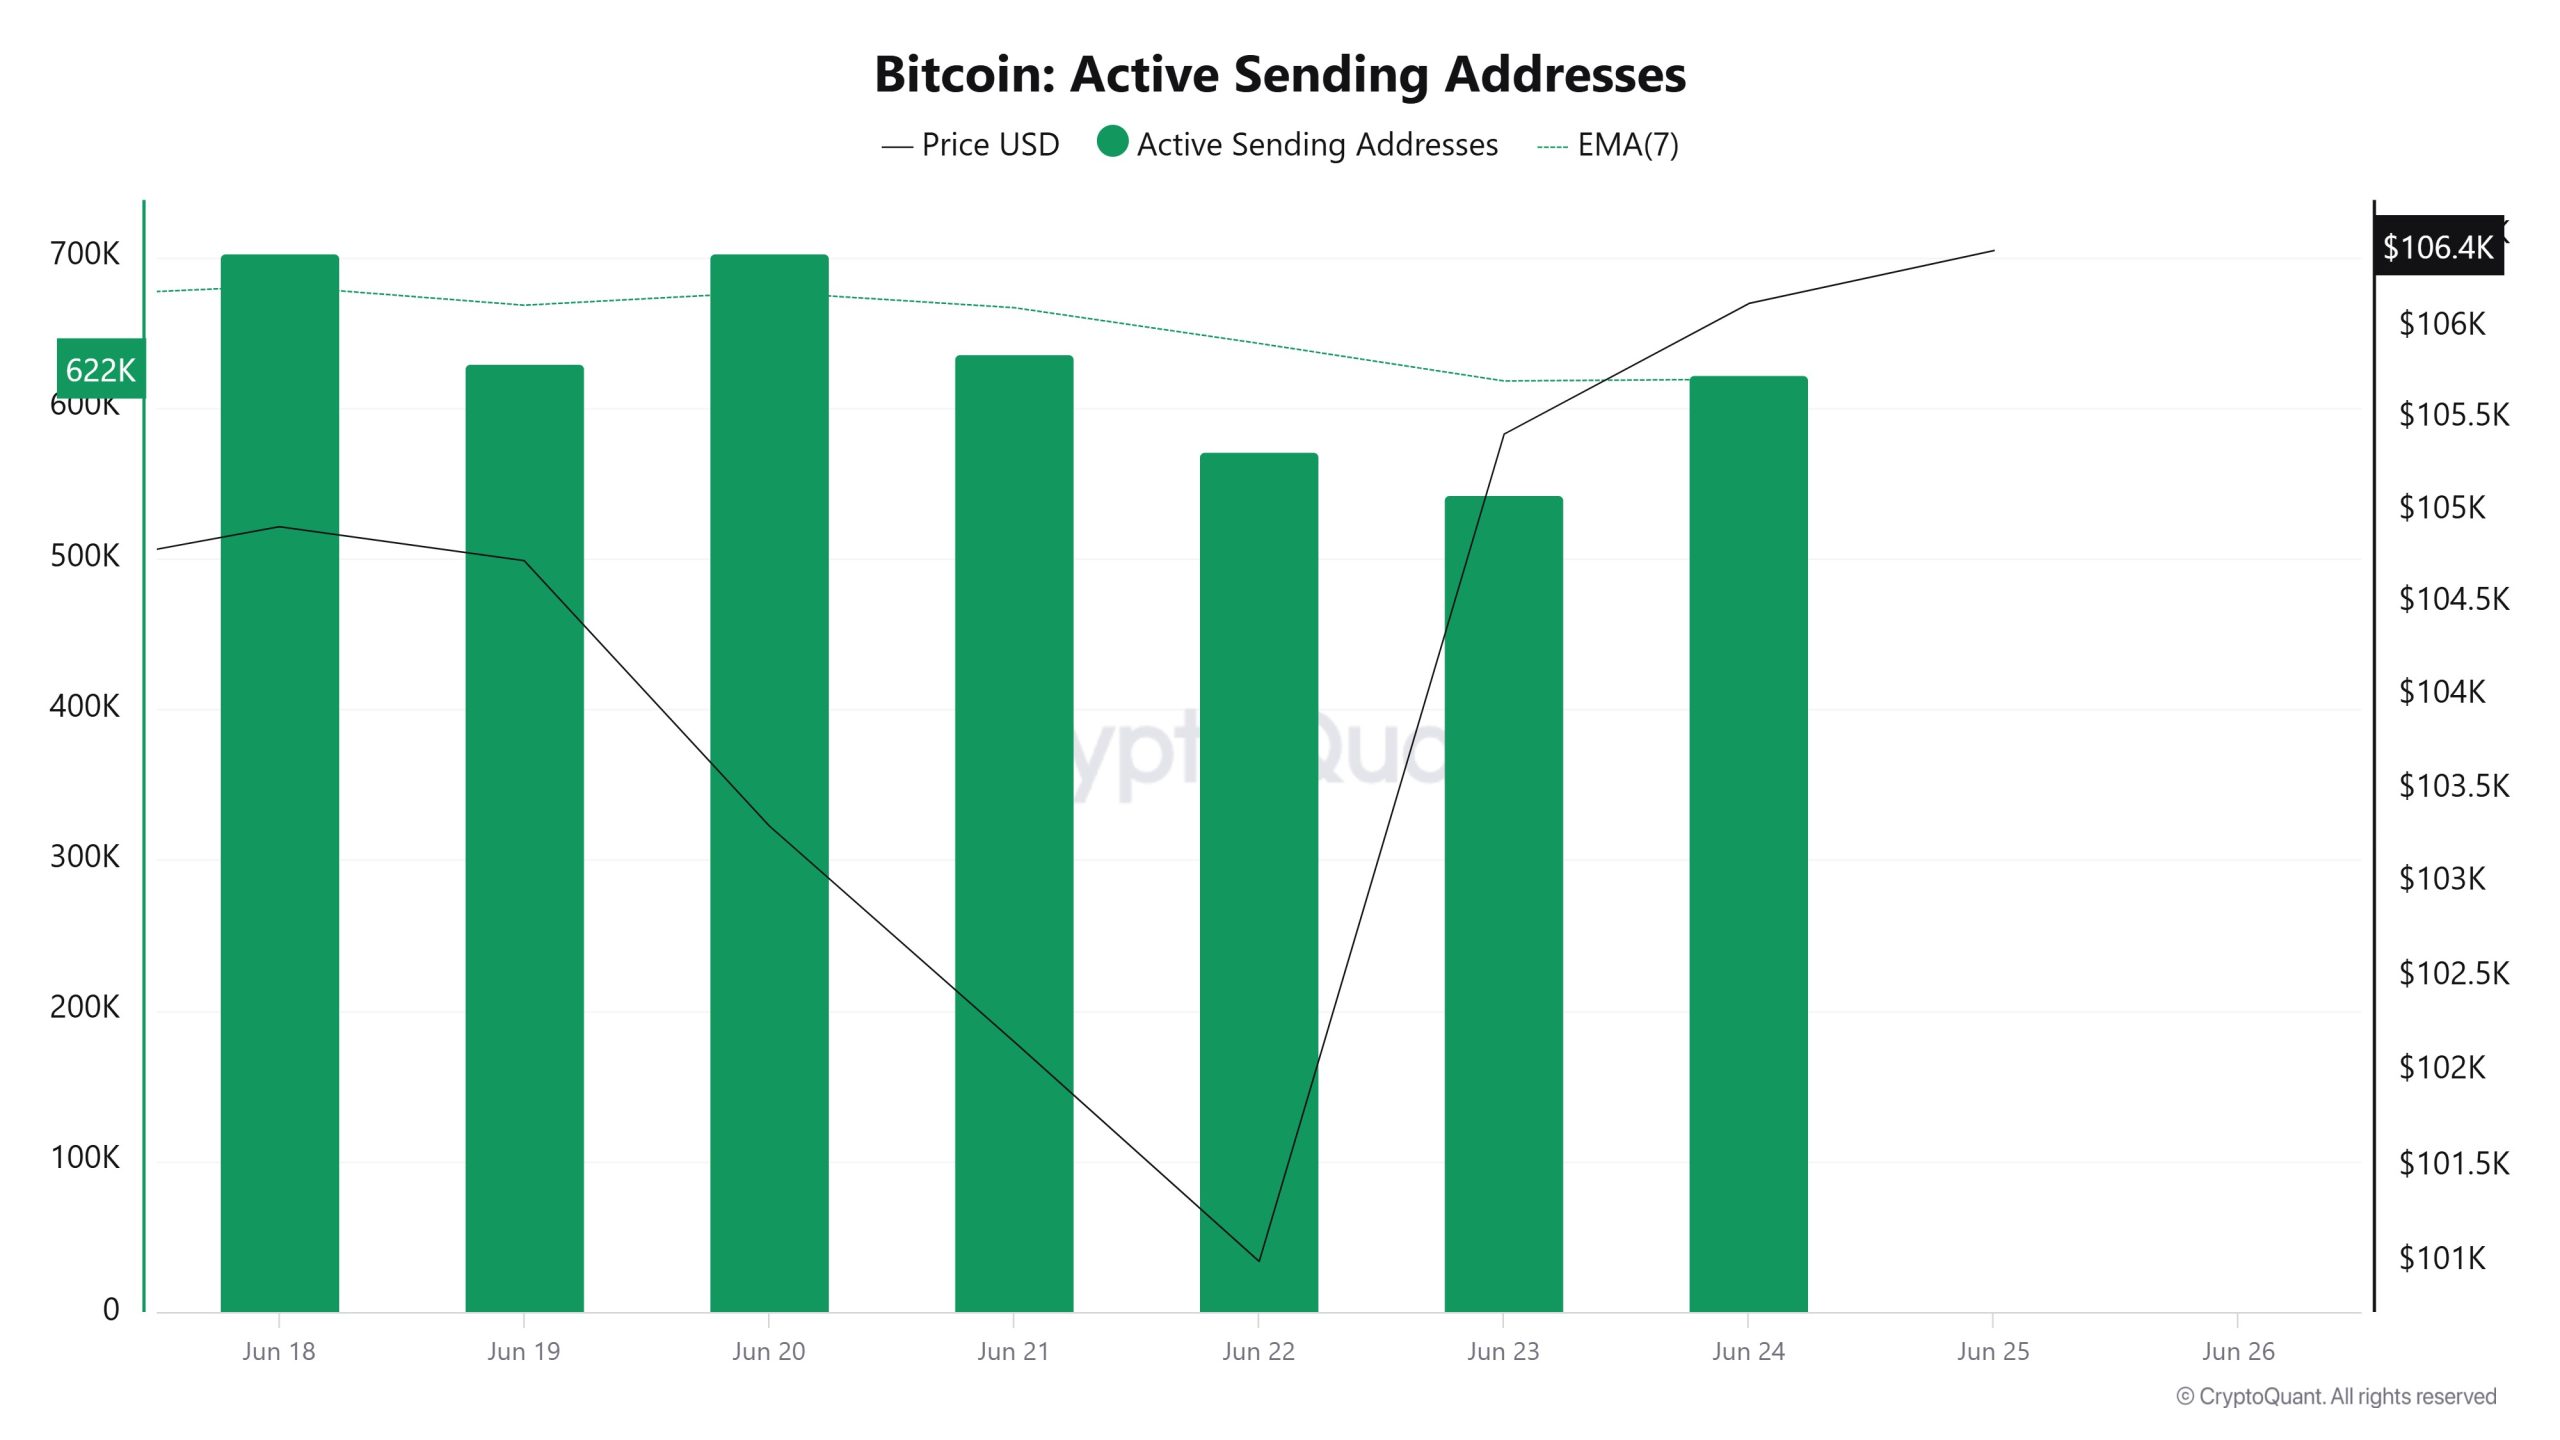
There was an increase in active shipping addresses on Juni 18-25. On the day when the price reached its highest level, active sending addresses rose to 622,422 levels; Bitcoin active address entries show that active address entries take into account the $106,000 levels. As a result, there is an increase in Active Sending Addresses levels.
Aktive Empfangsadressen
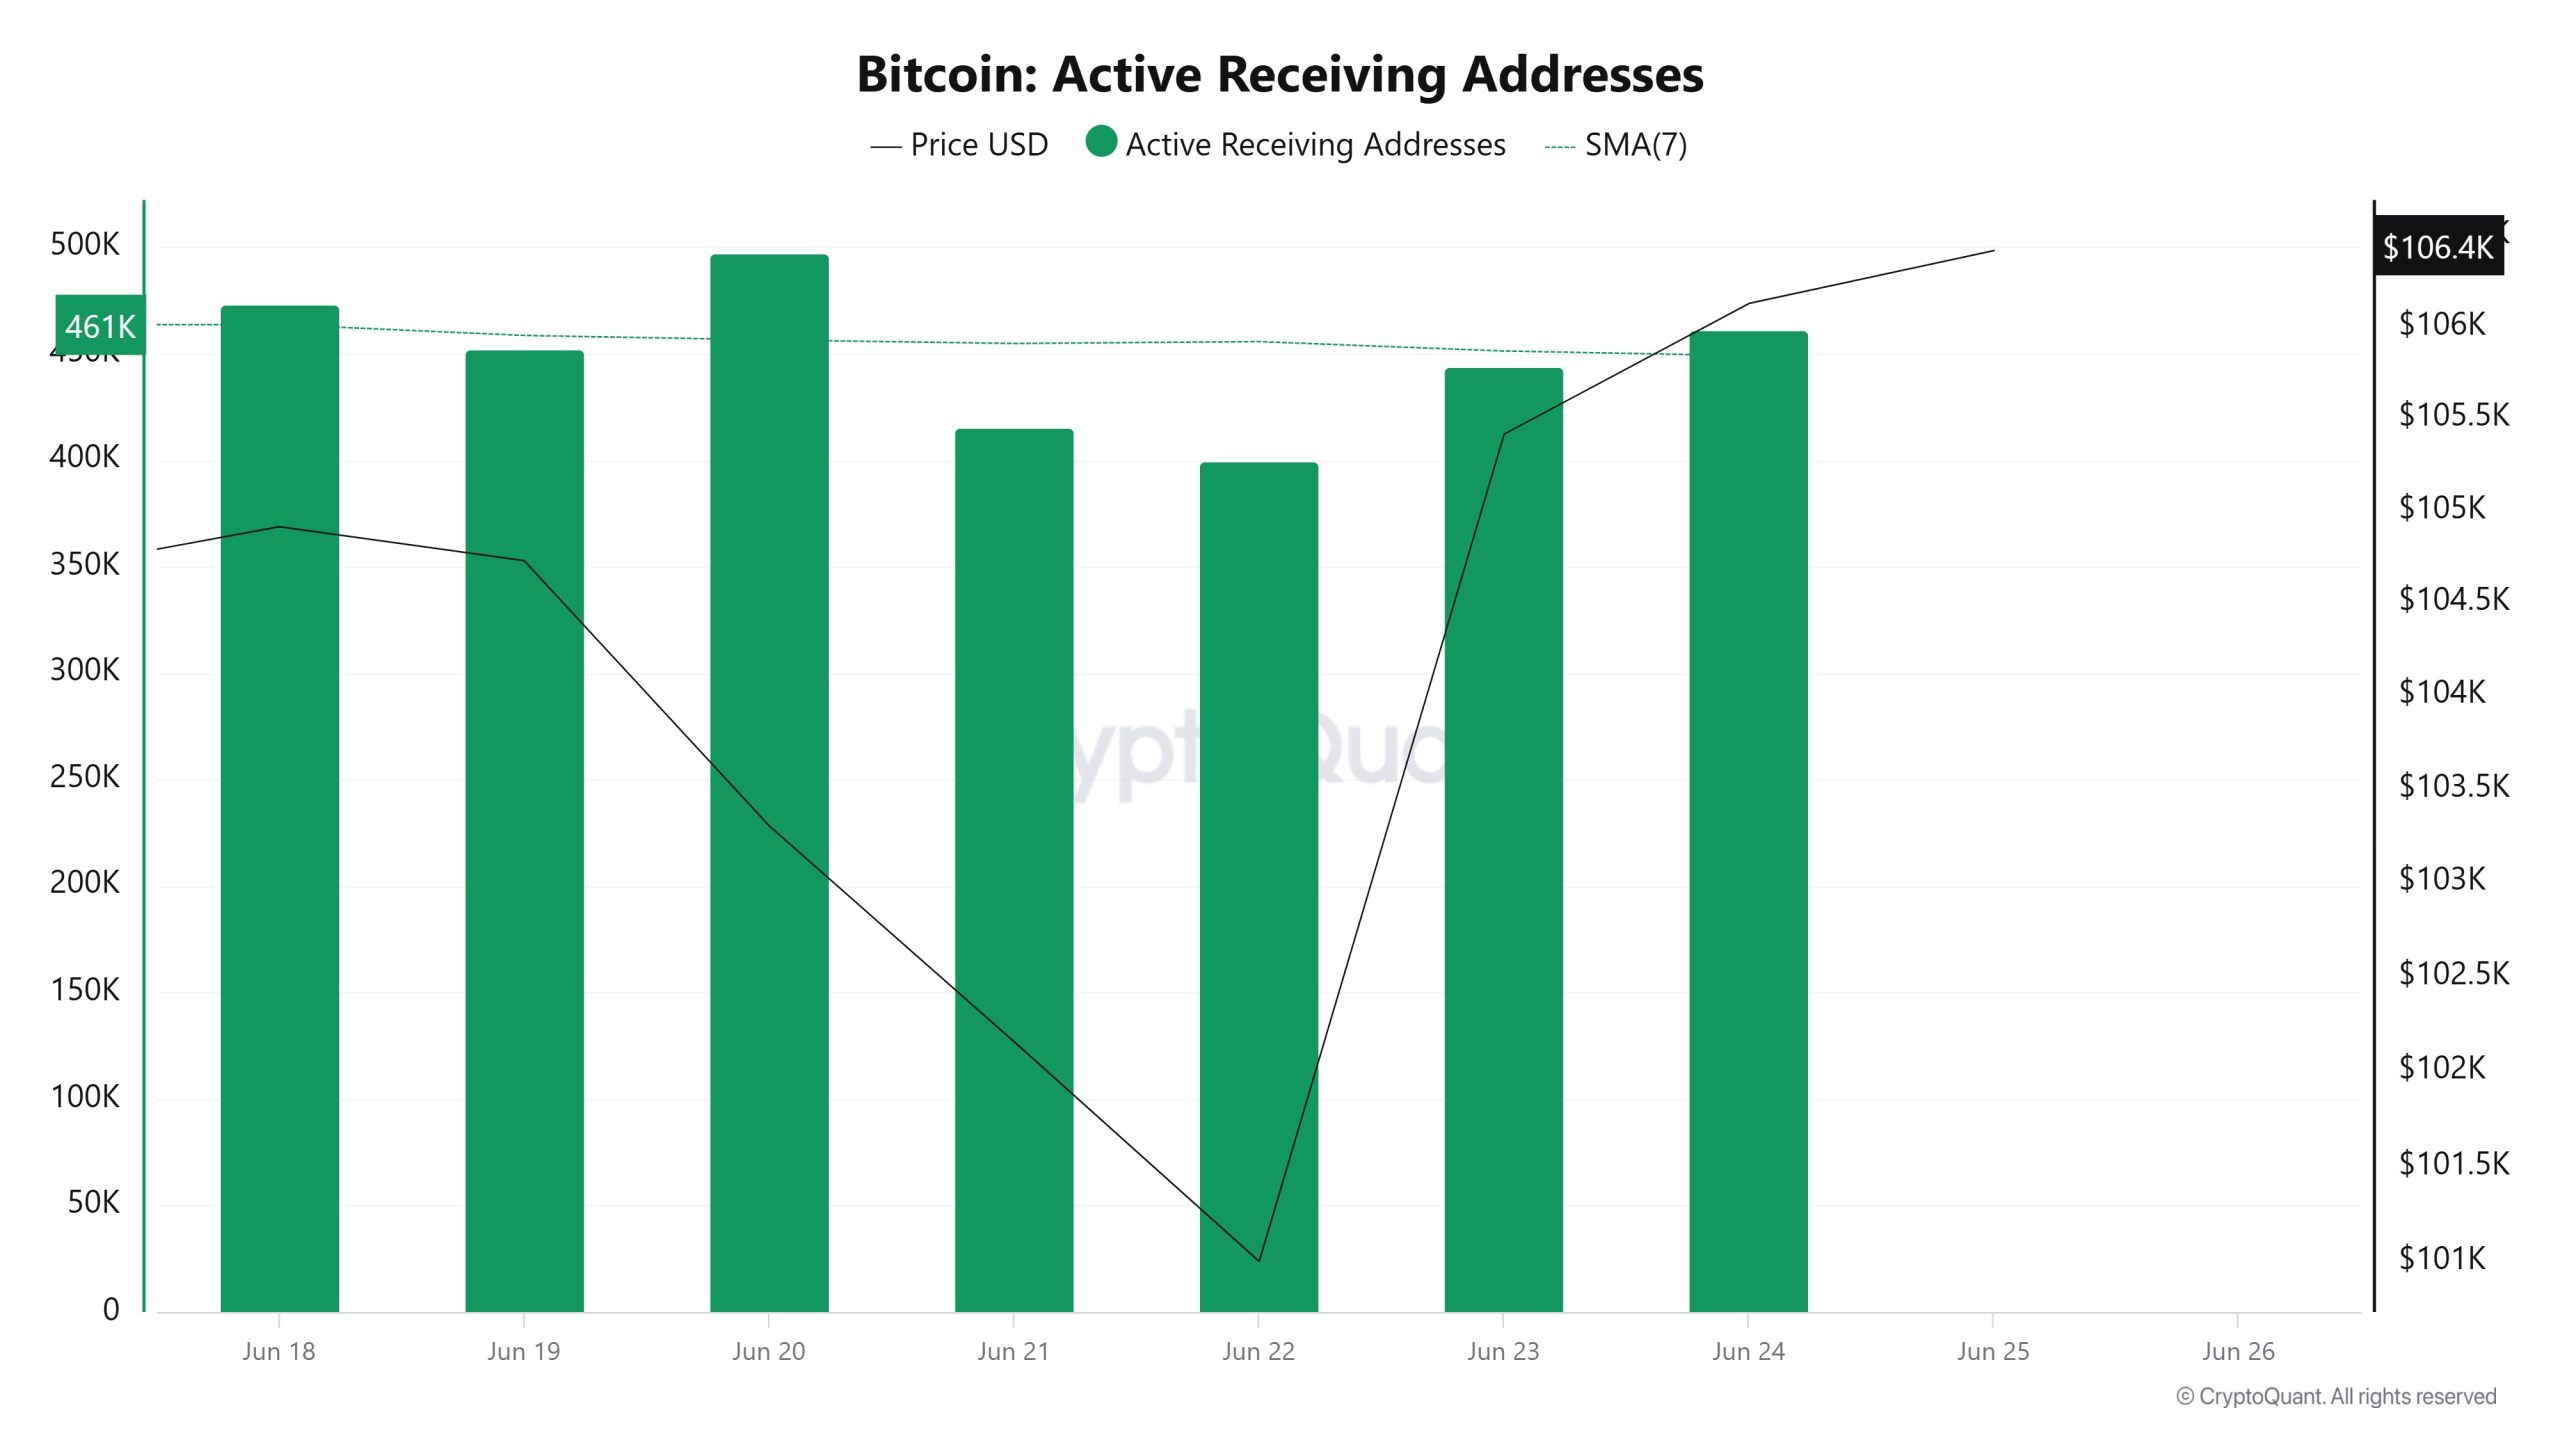
Active buying addresses, along with the Black Line (price line), saw a significant rise on Juni 18-25. On the day when the price reached a high level, the active receiving addresses rose to 461,021 levels; It shows that buyers bought Bitcoin at the level of 106,000 dollars.
Pannen
MRVR
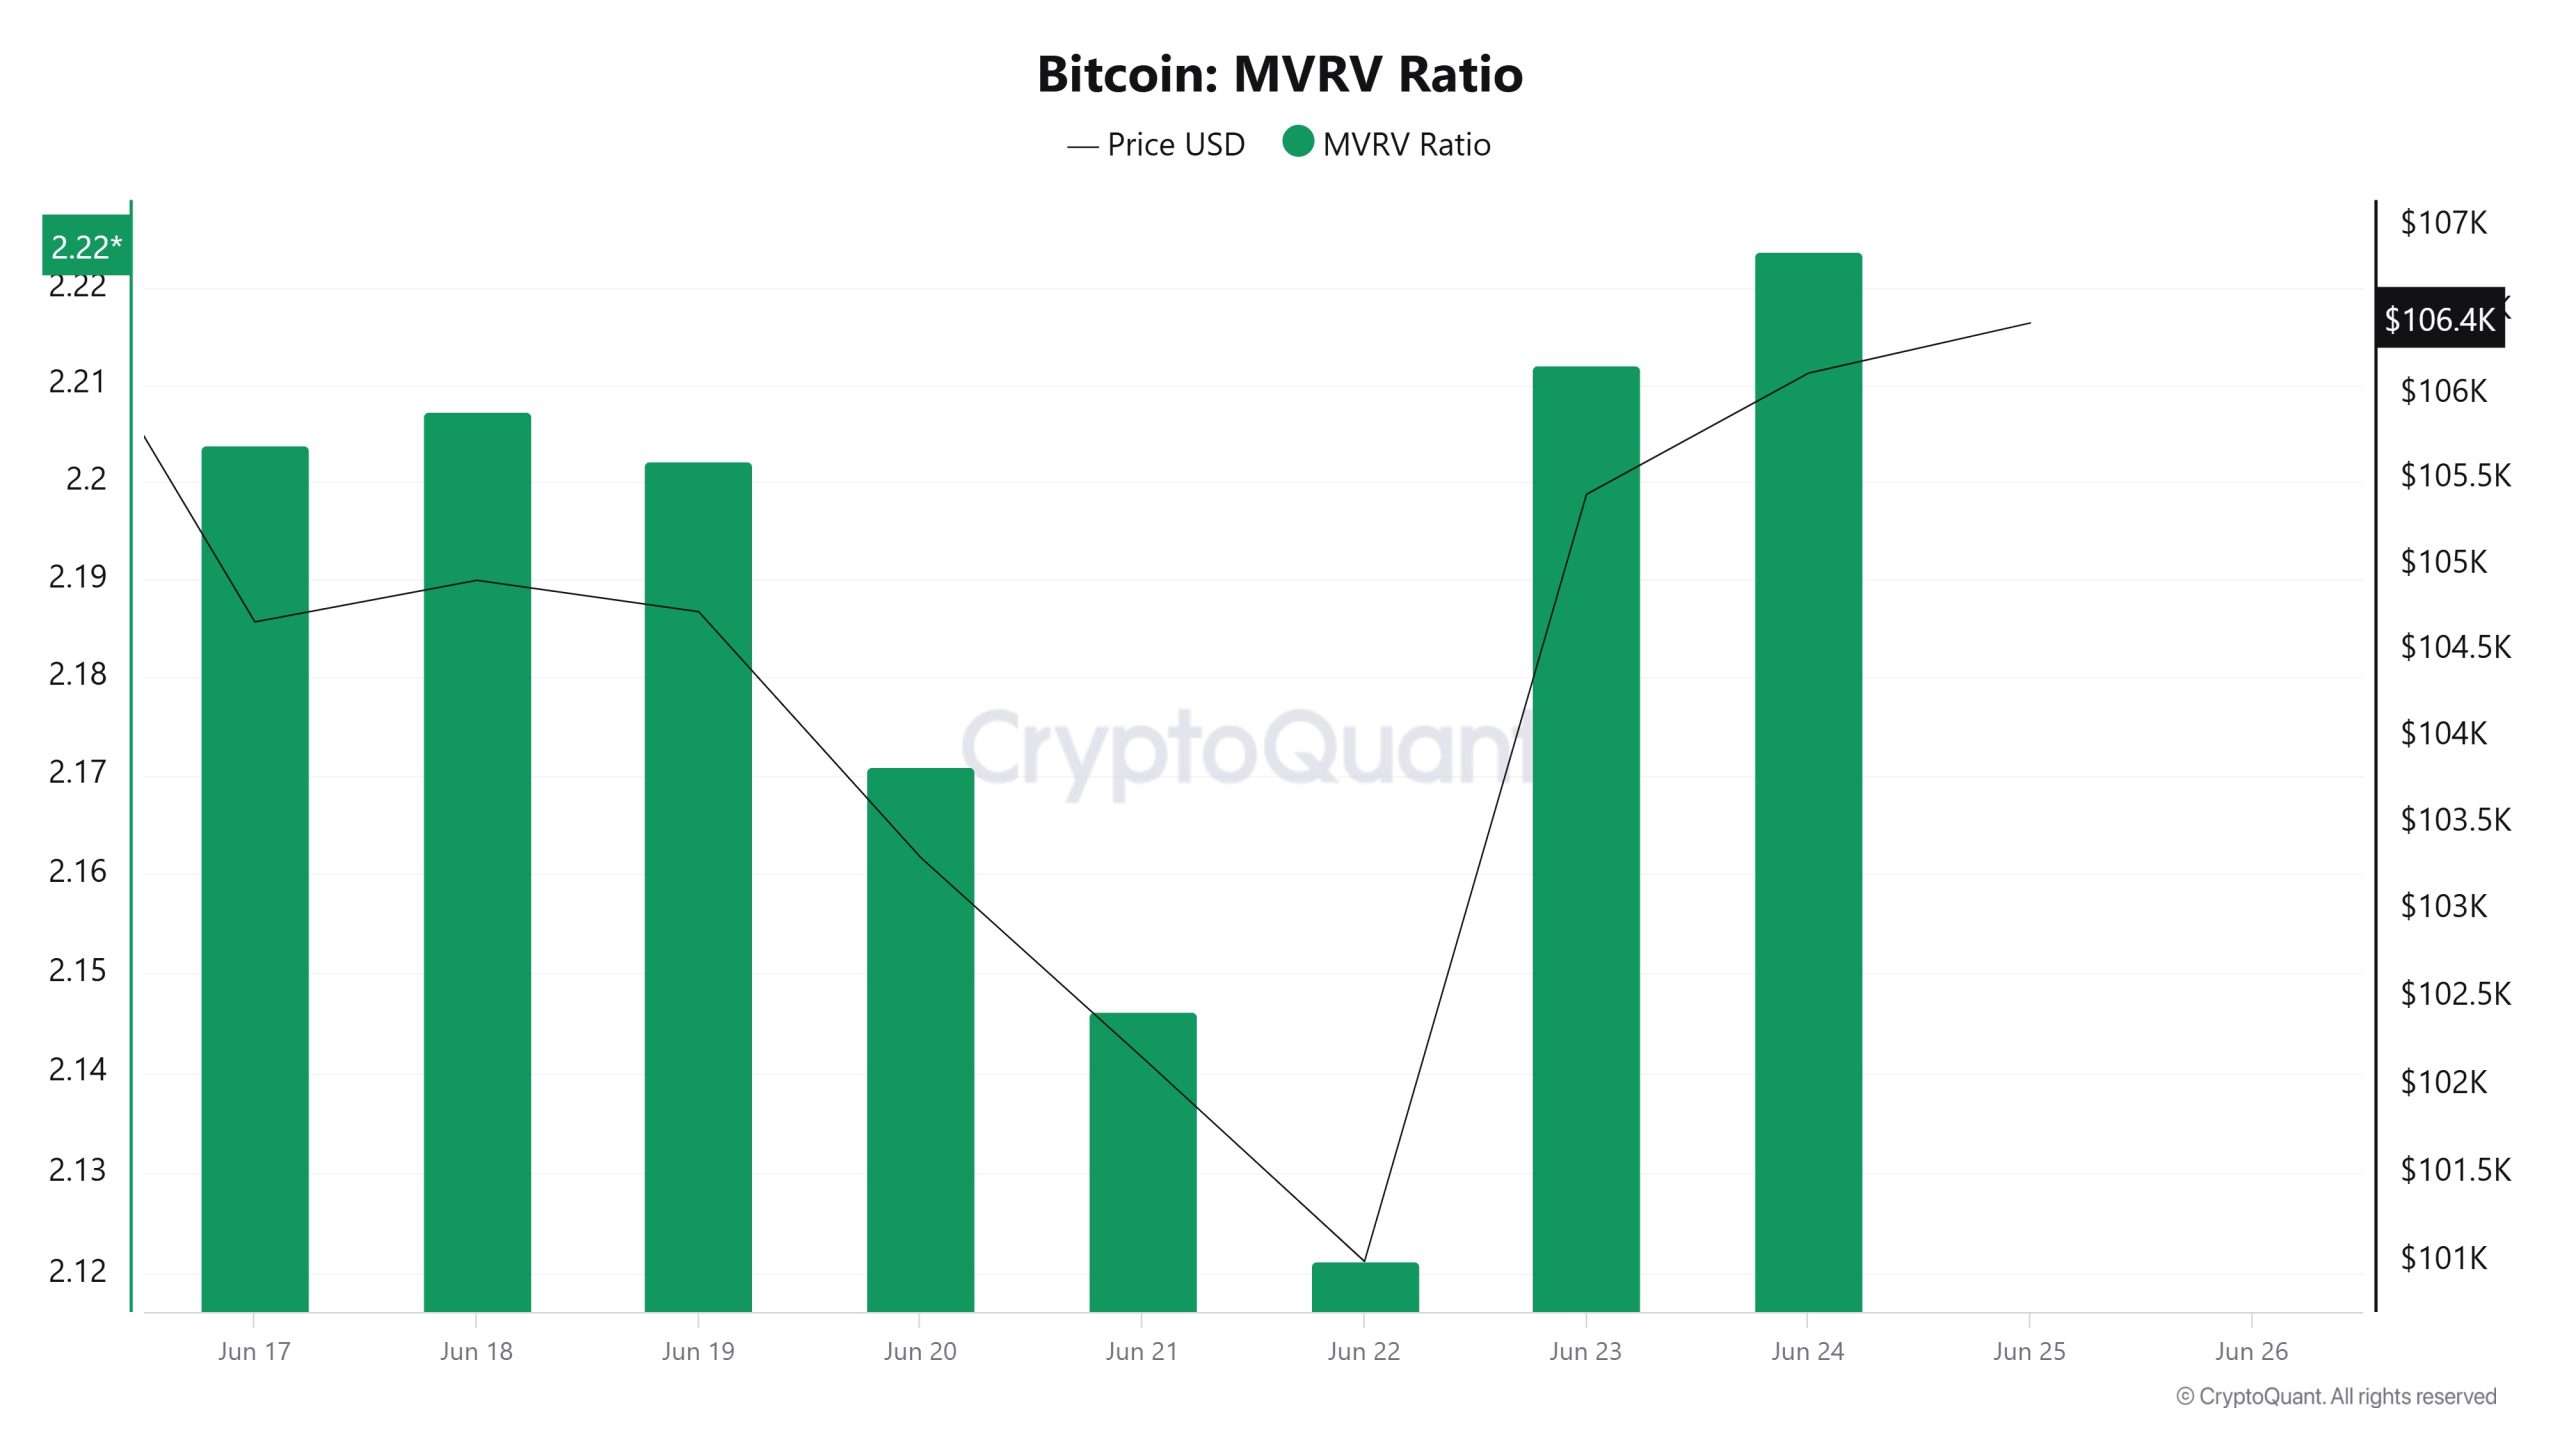
On Juni 18th, the Bitcoin price was 104,911 while the MVRV Ratio was 2.207. As of Juni 24, the Bitcoin price rose to 106,129, an increase of 1.16%, while the MVRV Ratio rose to 2,223, an increase of 0.73%.
Realisierter Preis
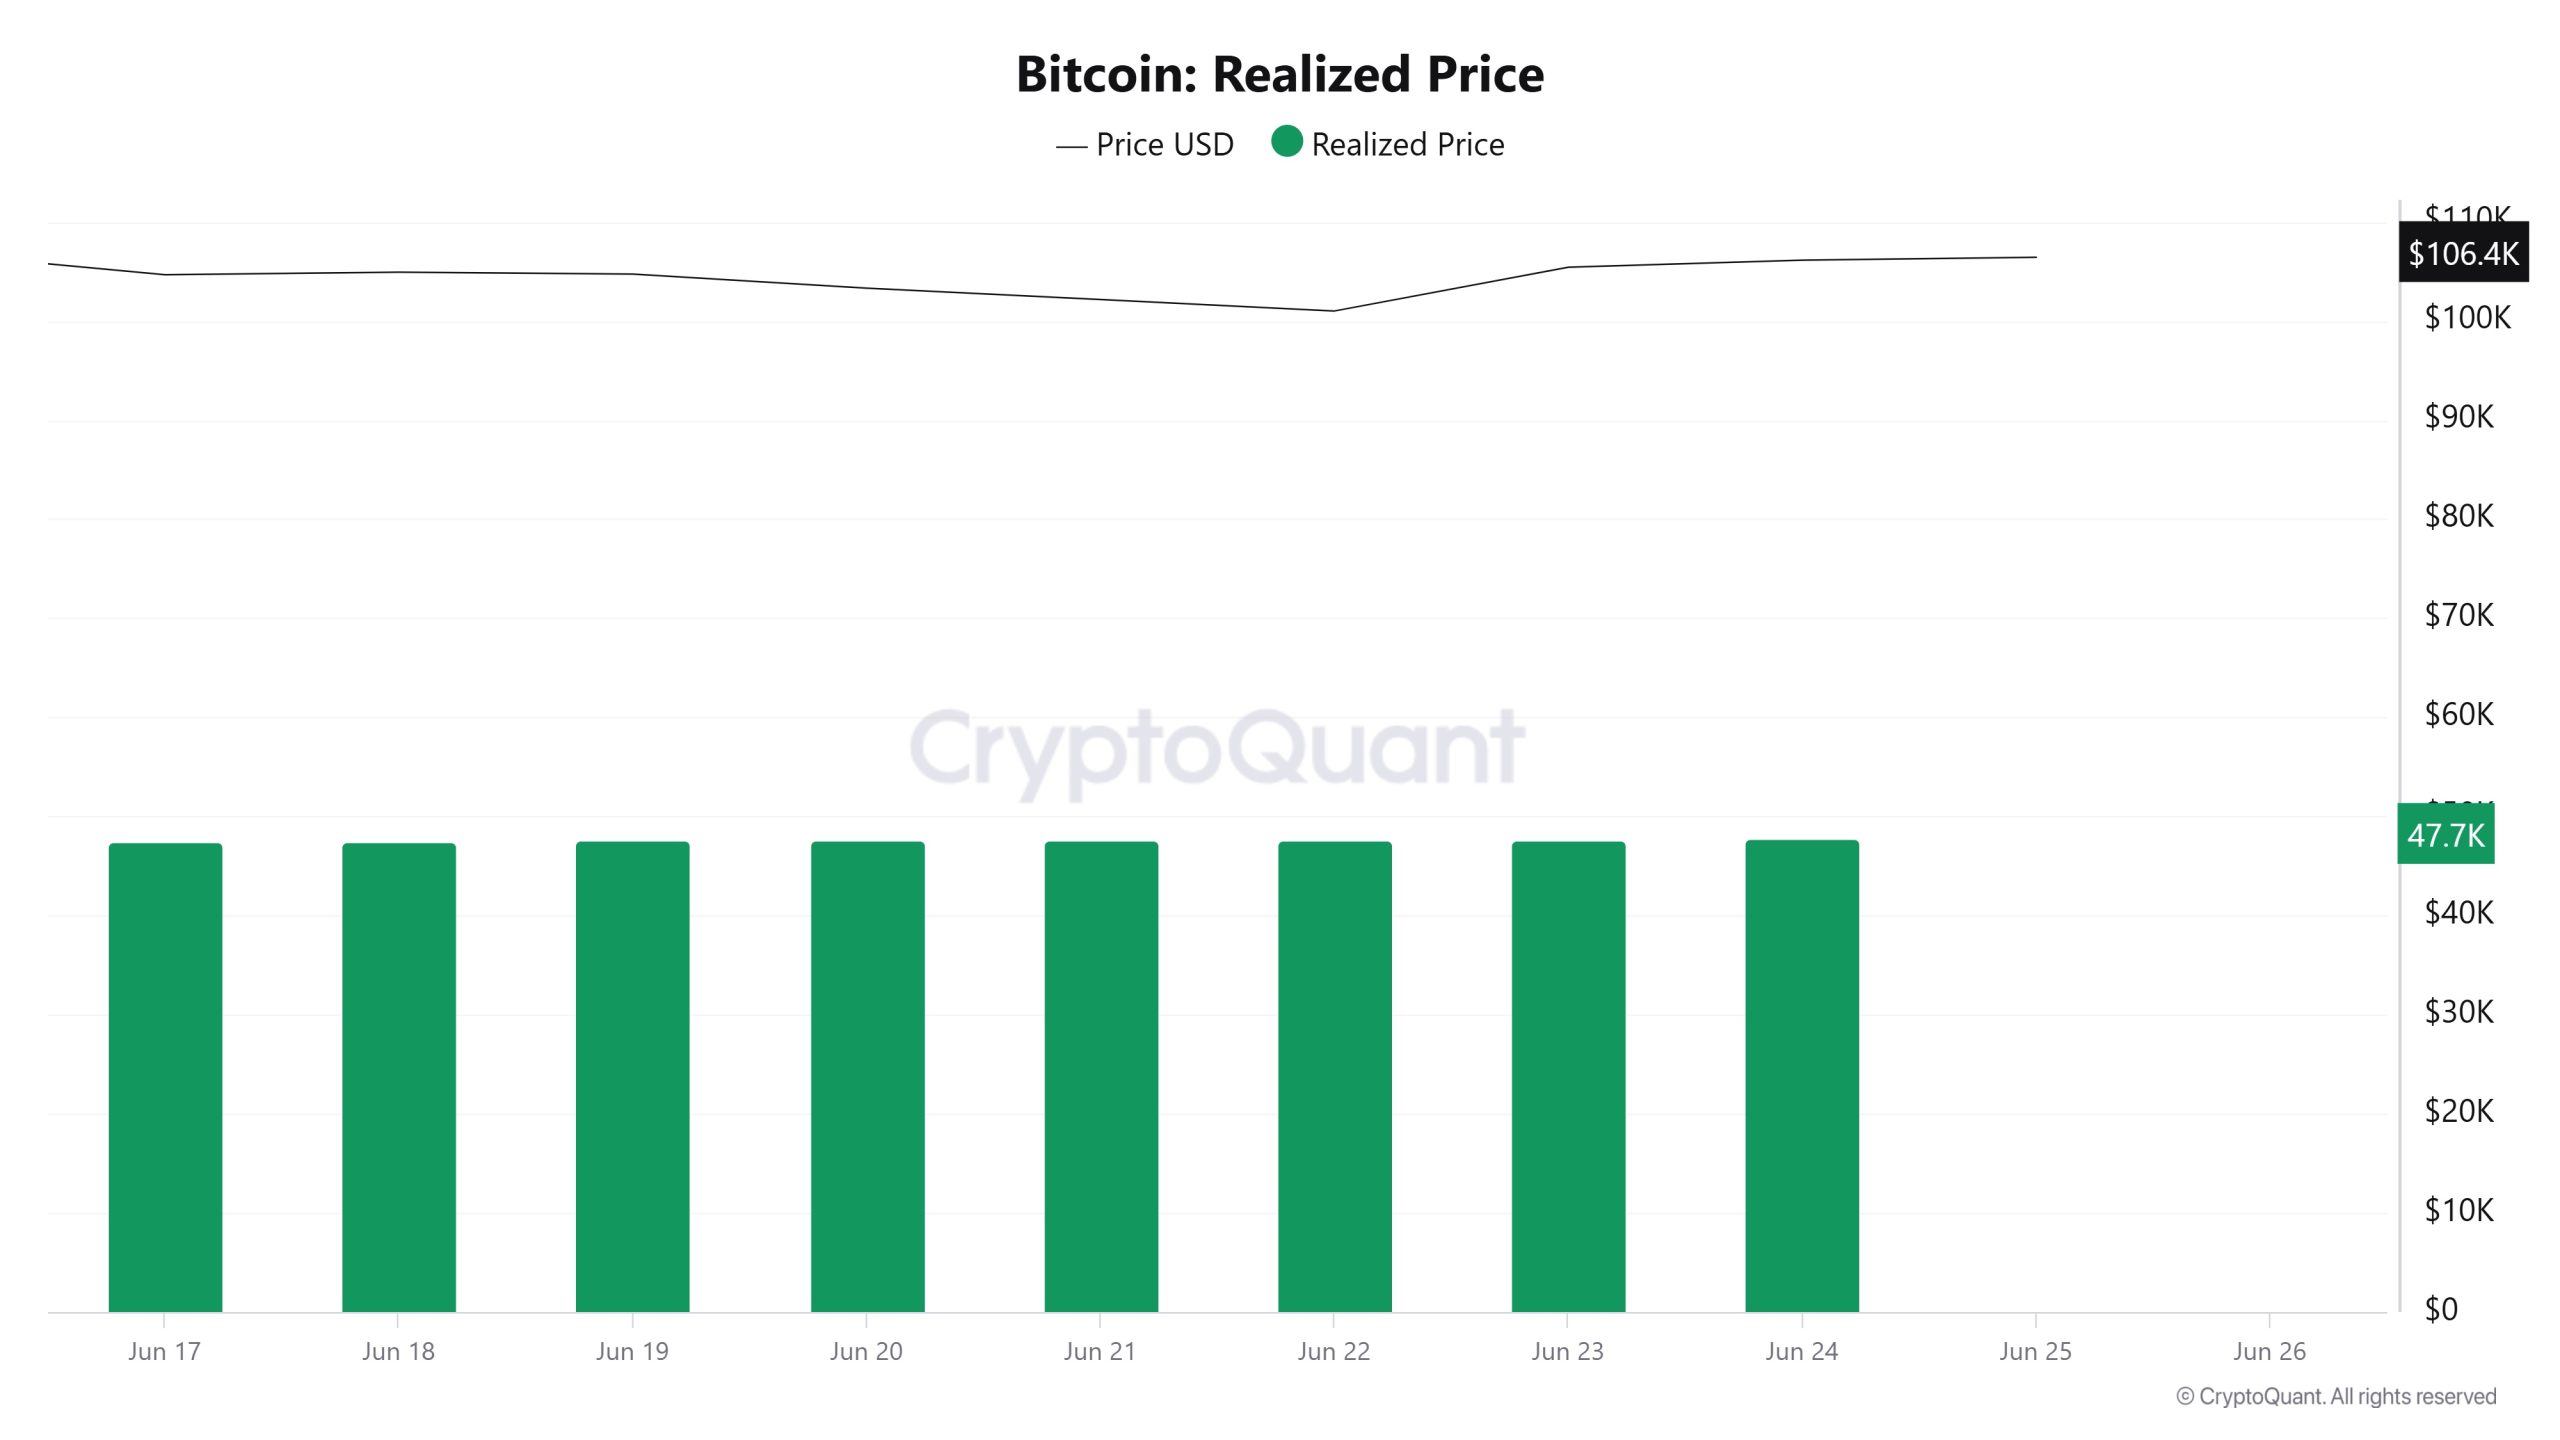
On Juni 18th, Bitcoin price was 104,911 while Realized Price was 47,528. As of Juni 24, the Bitcoin price was up 1.16% to 106,129, while the Realized Price was up 0.40% to 47,720.
Spent Output Profit Ratio (SOPR)
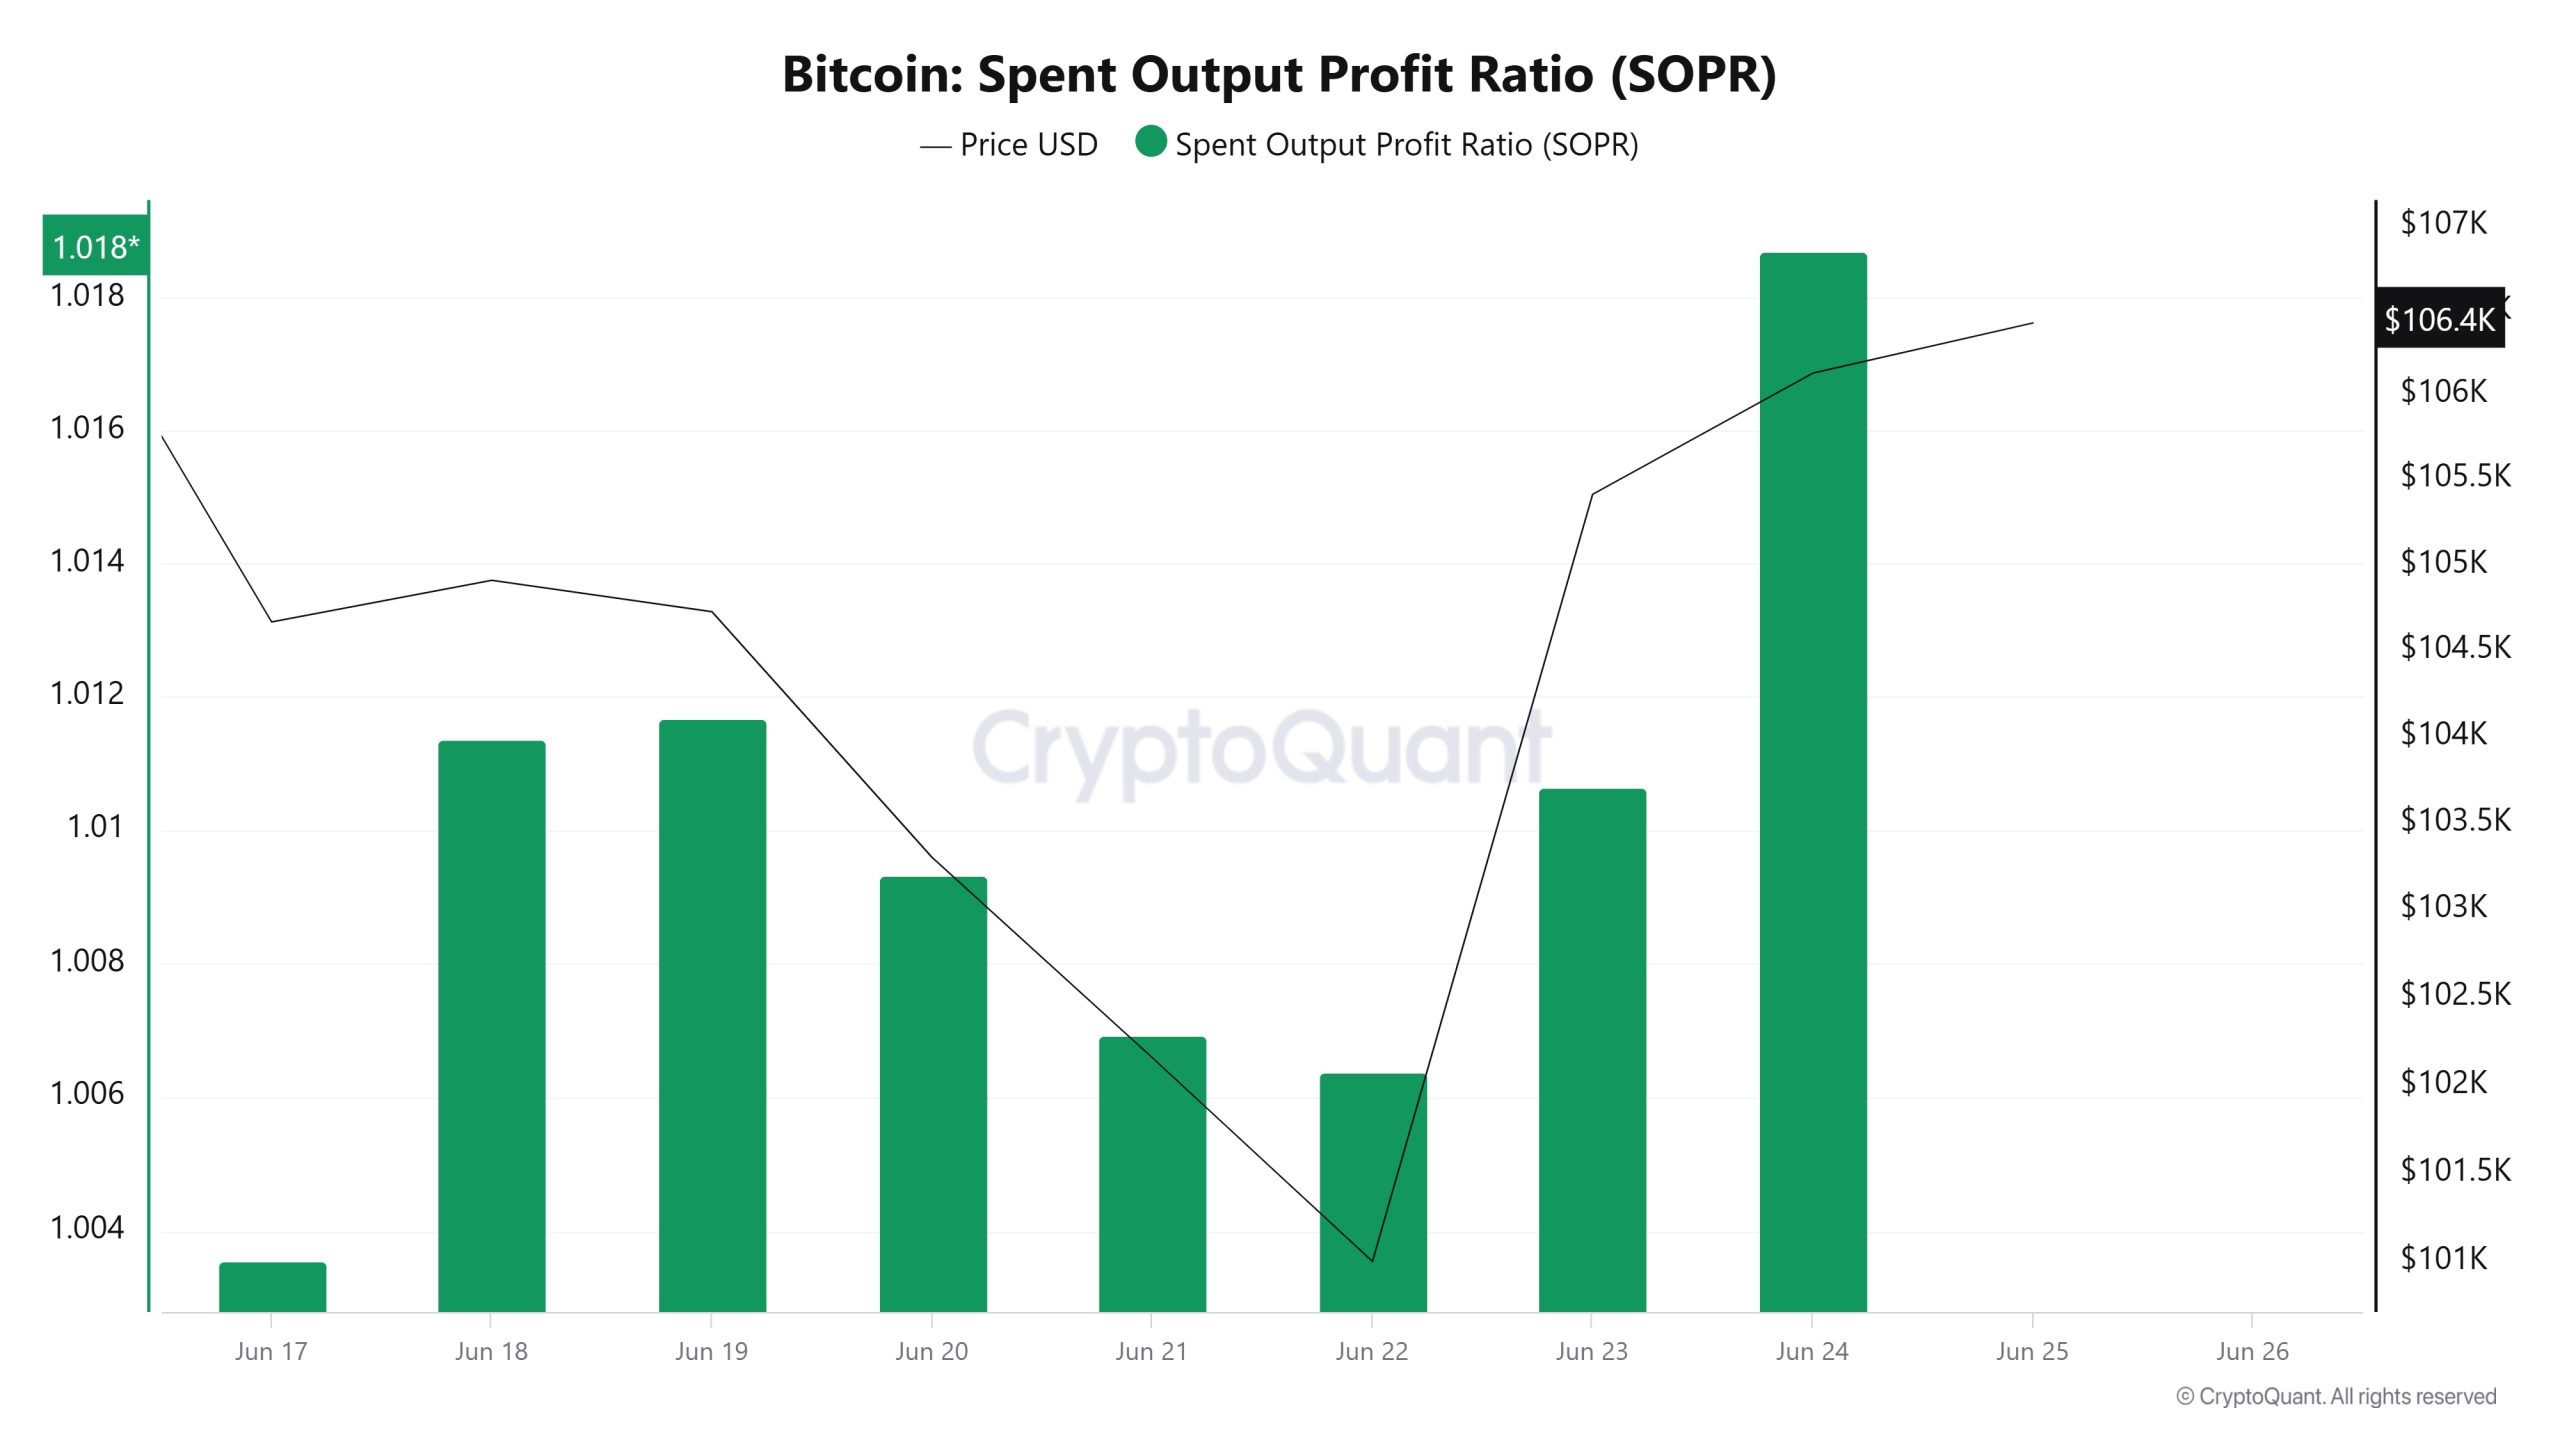
On Juni 18, the Bitcoin price was at 104,911 while the SOPR metric was at 1,011. As of Juni 24, the Bitcoin price rose 1.16% to 106,129, while the SOPR metric rose 0.69% to 1,018.
Derivate
Offenes Interesse
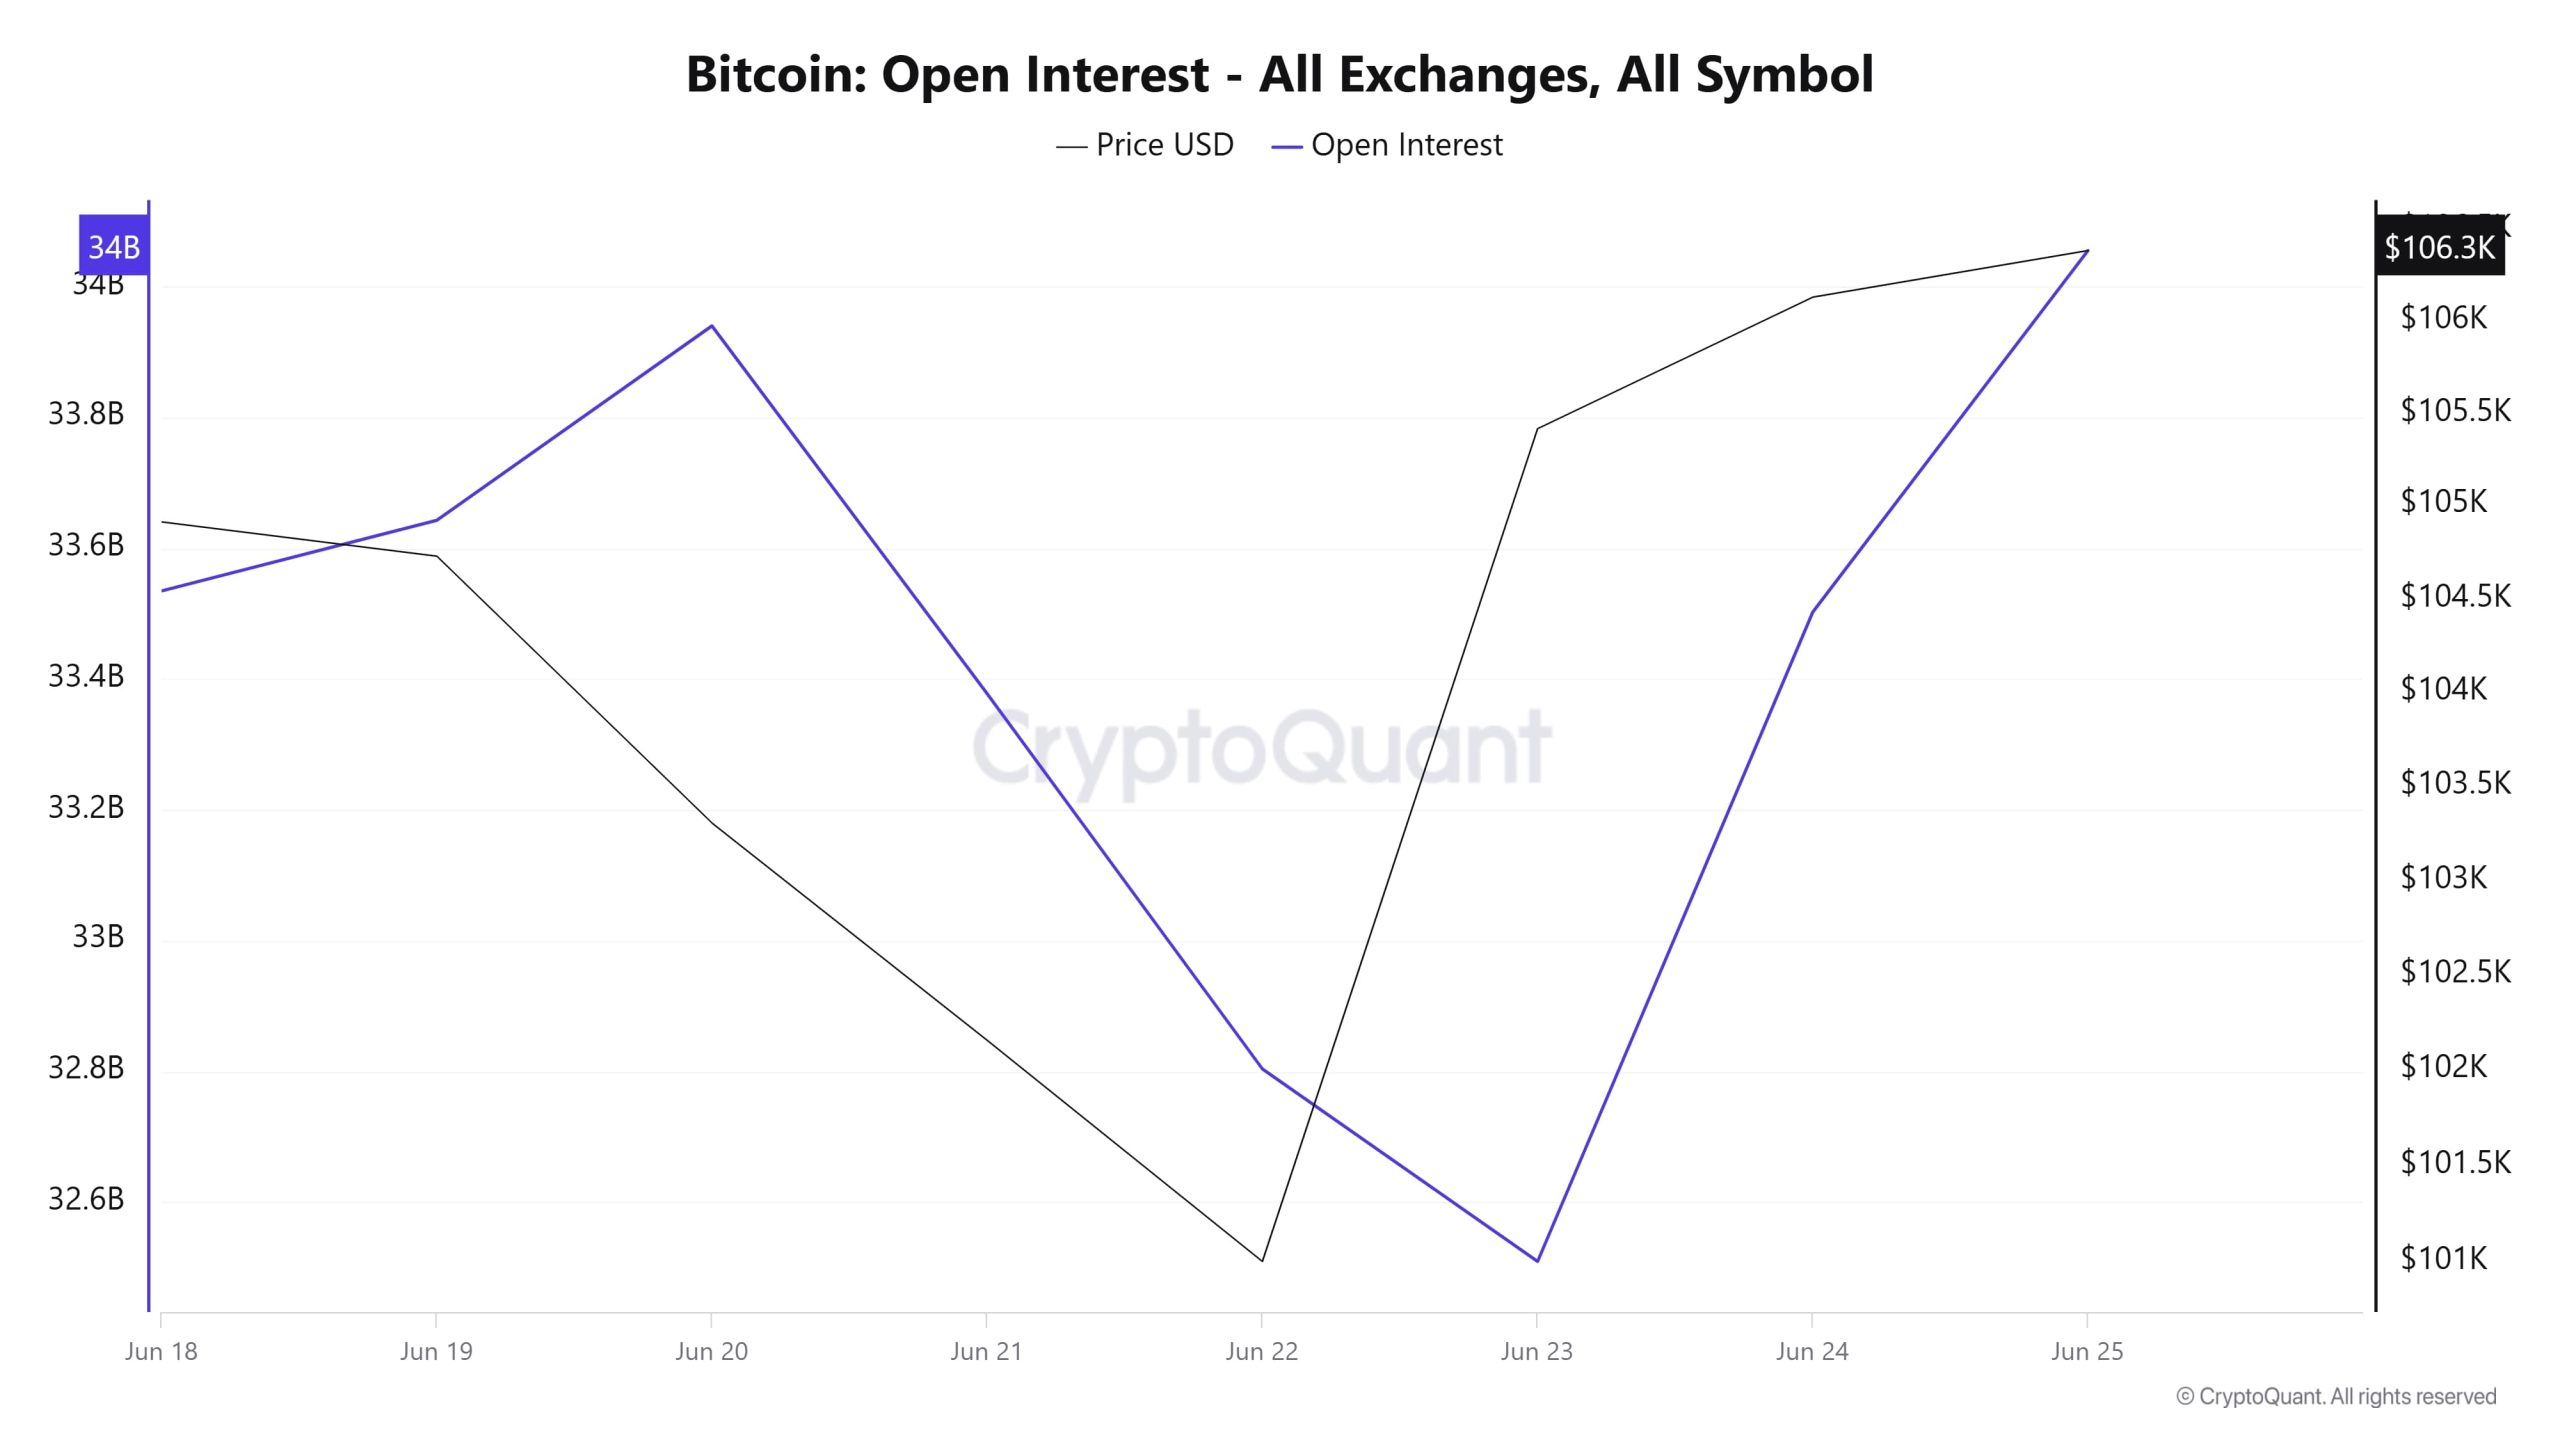
When the Bitcoin price and open interest data are considered together in the chart covering Juni 18-25, a rather characteristic transformation in the market can be observed. Initially, the slight increase in open interest as the price fell suggests that the positions opened despite the decline were probably short-weighted. However, after Juni 20, with the escalation of tensions between Israel and Iran, both the price and open interest declined rapidly. The real breakthrough comes after Juni 22. As the price reverses sharply from the bottom, open interest climbs up at almost the same pace. This simultaneous rise indicates that the market is repositioning and the rise is strongly supported by buying in the futures market. Especially on Juni 24-25, this synchronization becomes clear. Not only price but also risk appetite has returned to the field. The upside structure in Bitcoin has strengthened. But the rapid inflation of open interest also suggests that caution should be exercised in case of a possible liquidation scenario.
Förderquote
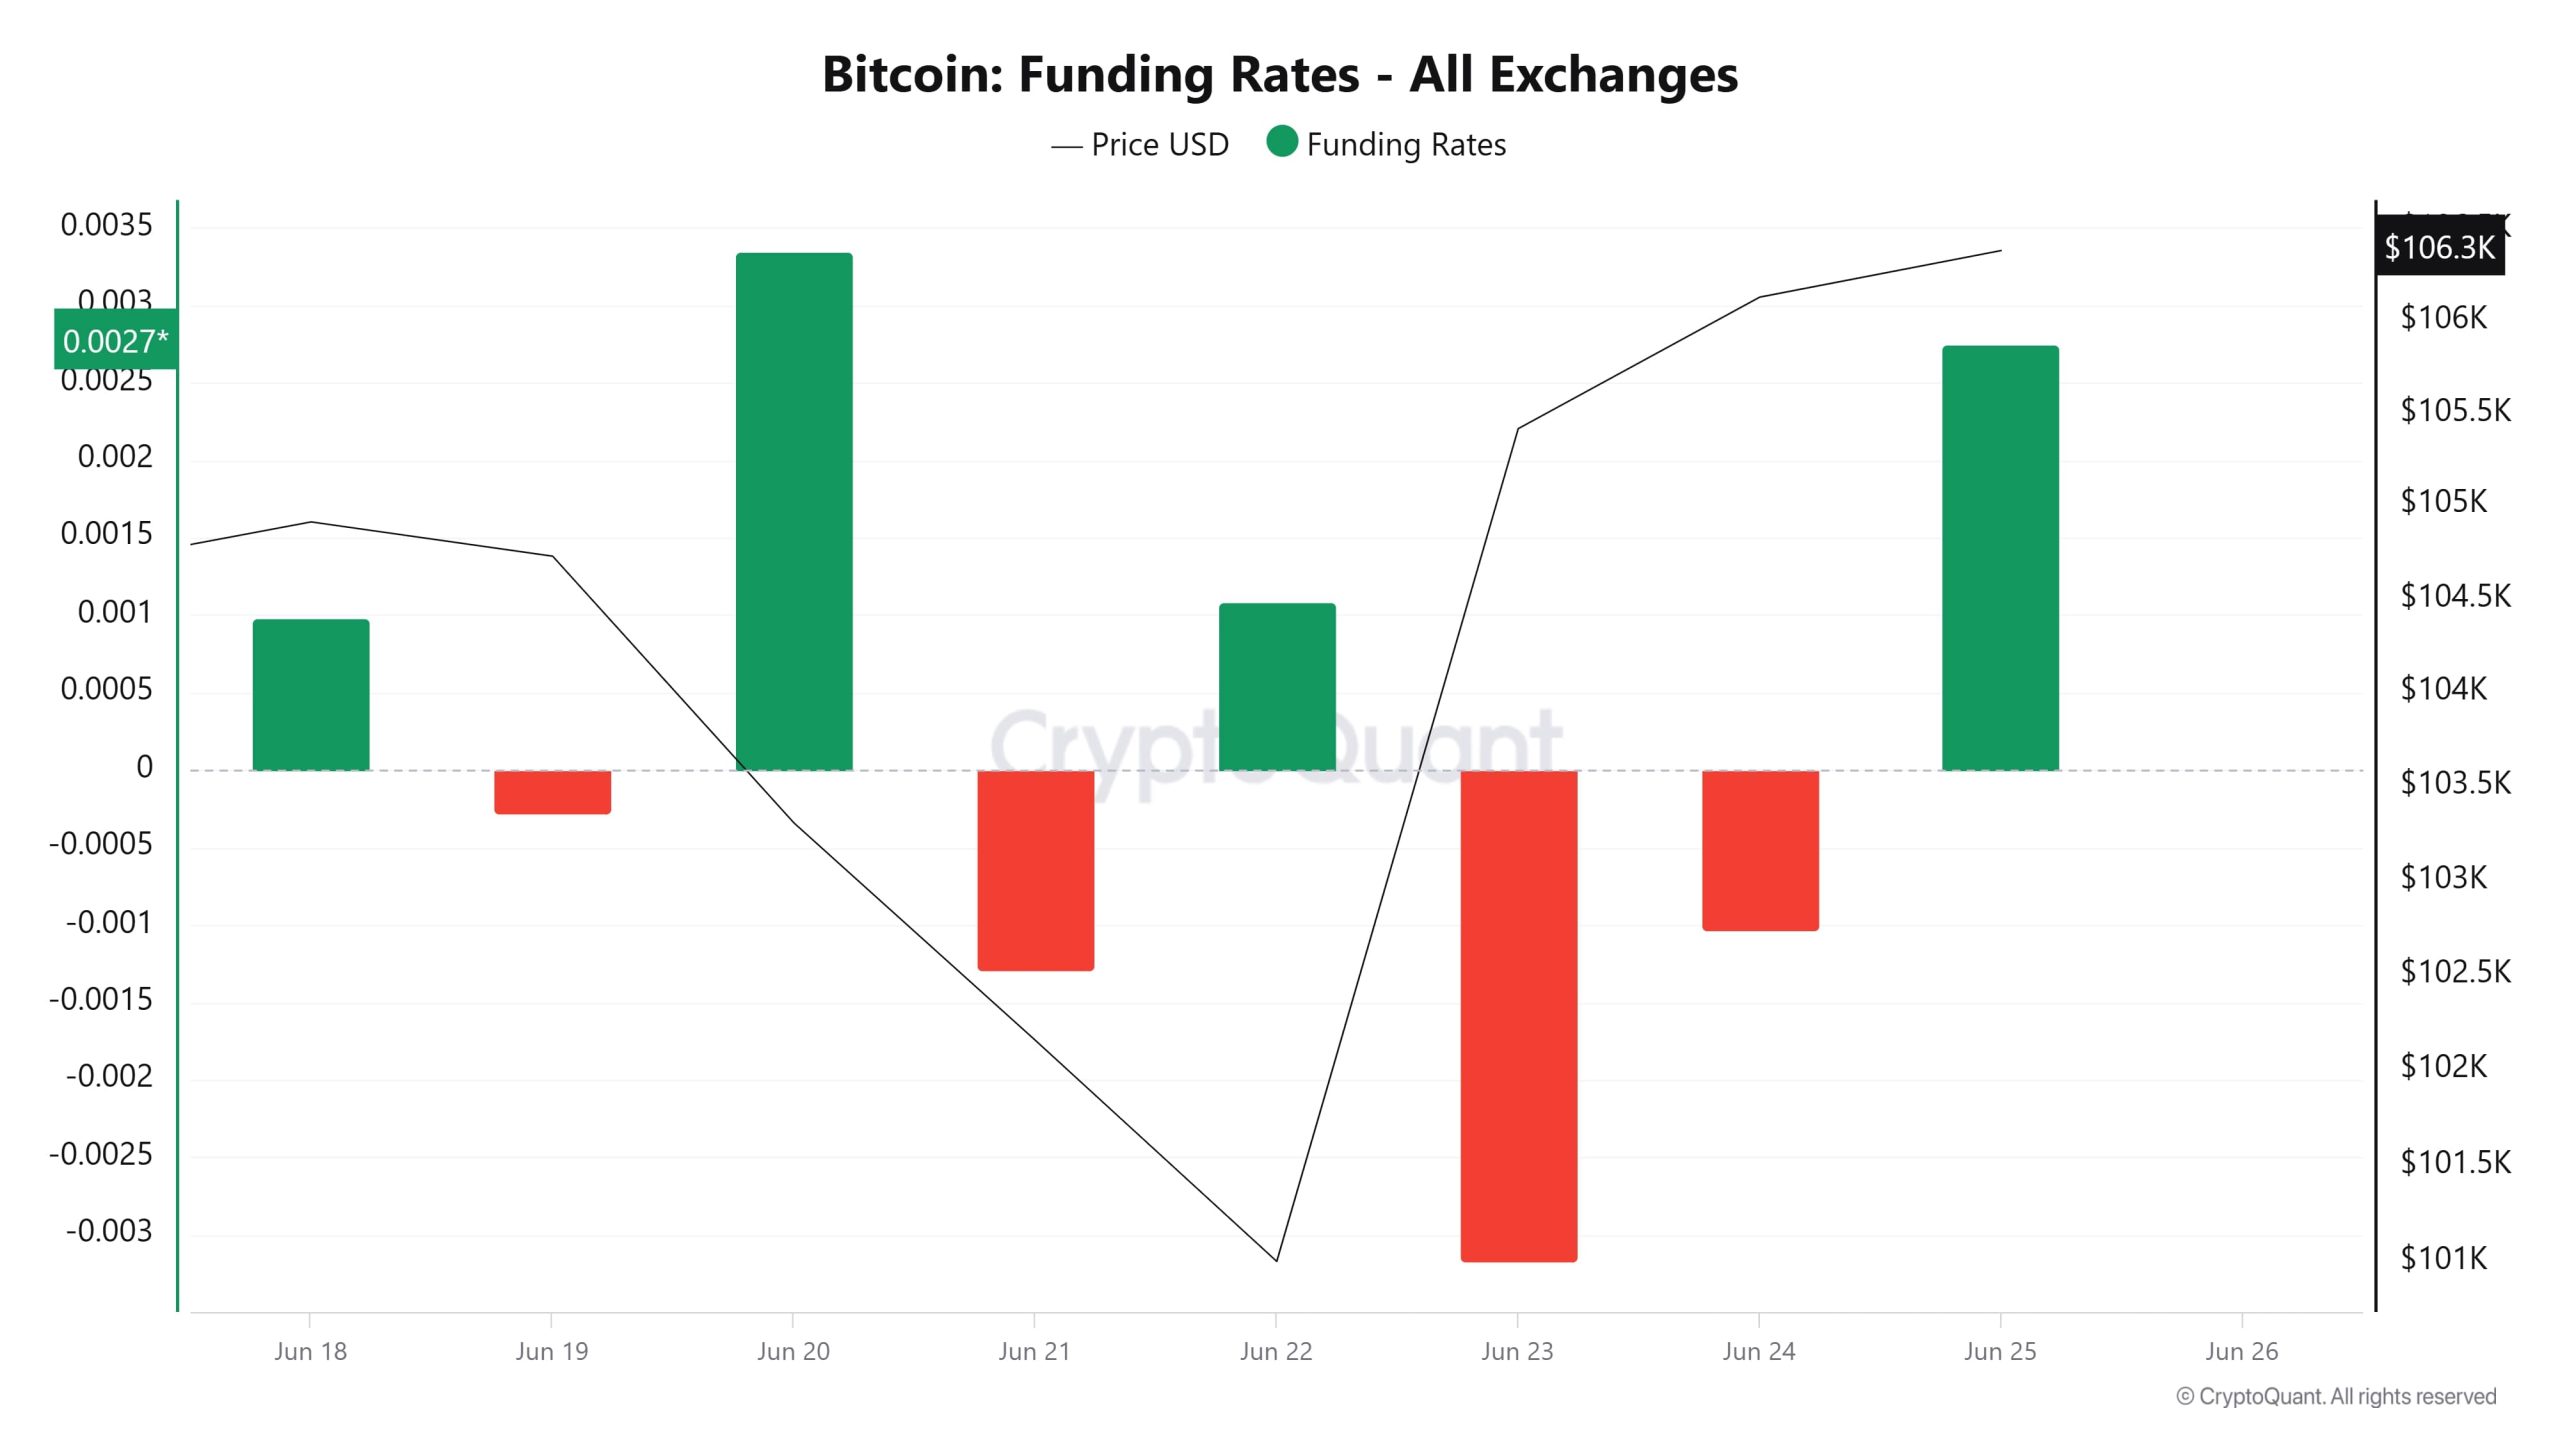
The funding rate, which started positive on Juni 18, peaks on Juni 20. This indicates that long positions were concentrated and the market was expecting upside. However, when the price did not follow suit and started to decline, the funding rate turned negative between Juni 21 and 23. Especially on Juni 23, the rates turned sharply negative, suggesting that short positions gained weight and investors started to avoid risk.
Immediately after this downward pressure, the price started to recover on Juni 24 and the funding ratio turned positive again on Juni 25. This transition suggests that the buying incentive has returned and the market has started to push higher again. In short, the sharp reversals in both funding rates and prices over a period of a few days suggest that the direction of the market is not clear, but that short-term players are aggressively shifting positions. This clearly demonstrates the impact of highly leveraged transactions in the market and how quickly trader psychology can change.
Long & Short Liquidationen
| Datum | Langer Betrag (Millionen $) | Kurzer Betrag (Millionen $) |
|---|---|---|
| Juni 18 | 44.59 | 18.21 |
| Juni 19 | 8.14 | 4.11 |
| Juni 20 | 227.81 | 22.66 |
| Juni 21 | 196.69 | 15.00 |
| Juni 22 | 264.19 | 121.51 |
| 23. Juni | 30.56 | 146.85 |
| Juni 24 | 10.42 | 18.03 |
| Insgesamt | 782.40 | 346.37 |
After the start of the war between Israel and Iran and the sharp decline in BTC price after the US struck Iran’s nuclear facilities, the ceasefire agreement started a new uptrend. With this activity, 782 million dollars worth of long and 346 million dollars worth of short transactions were liquidated.
| Datum | Langer Betrag (Millionen $) | Kurzer Betrag (Millionen $) |
|---|---|---|
| Juni 18 | 44.59 | 18.21 |
| Juni 19 | 8.14 | 4.11 |
| Juni 20 | 227.81 | 22.66 |
| Juni 21 | 196.69 | 15.00 |
| Juni 22 | 264.19 | 121.51 |
| 23. Juni | 30.56 | 146.85 |
| Juni 24 | 10.42 | 18.03 |
| Insgesamt | 782.40 | 346.37 |
Versorgung Verteilung
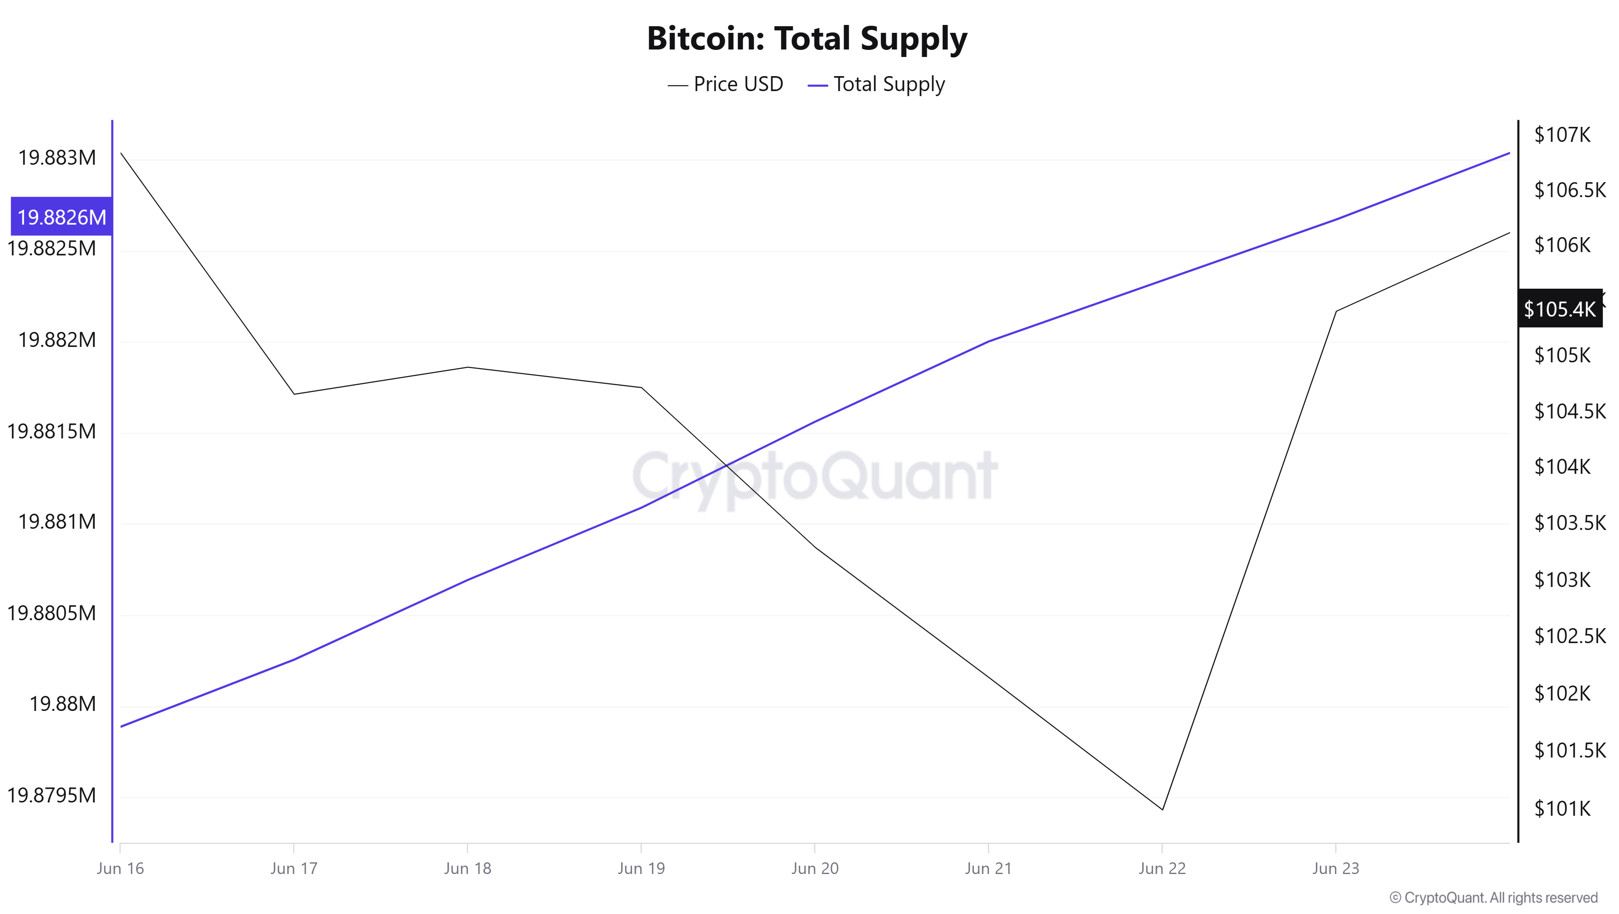
Total Supply: 19,882,671 units, up about 0.014% from last week.
New Supply: The amount of BTC produced this week was 2,785.
Velocity: Velocity, which was 12.87 last week, was 12.85 as of Juni 23.
| Kategorie Brieftasche | 16.06.2025 | 23.06.2025 | Veränderung (%) |
|---|---|---|---|
| < 1 BTC | 8.4847% | 8.4795% | -0.06% |
| 1 - 10 BTC | 11.4706% | 11.4552% | -0.13% |
| 10 - 100 BTC | 24.5713% | 24.6075% | 0.14% |
| 100 - 1k BTC | 28.8714% | 28.9068% | 0.12% |
| 1k - 10k BTC | 18.3746% | 18.3613% | -0.07% |
| 10k+ BTC | 8.2271% | 8.1891% | -0.46% |
According to the latest weekly data, there was a limited decrease of -0.06% in <1 BTC wallets, while a decrease of -0.13% was observed in the 1-10 BTC range. There were slight increases of +0.14% in the 10-100 BTC segment and +0.12% in 100-1k BTC. The 1k-10k BTC range saw a limited decline of -0.07%, while the 10k+ BTC category saw a more significant decline of -0.46%.
Währungsreserve
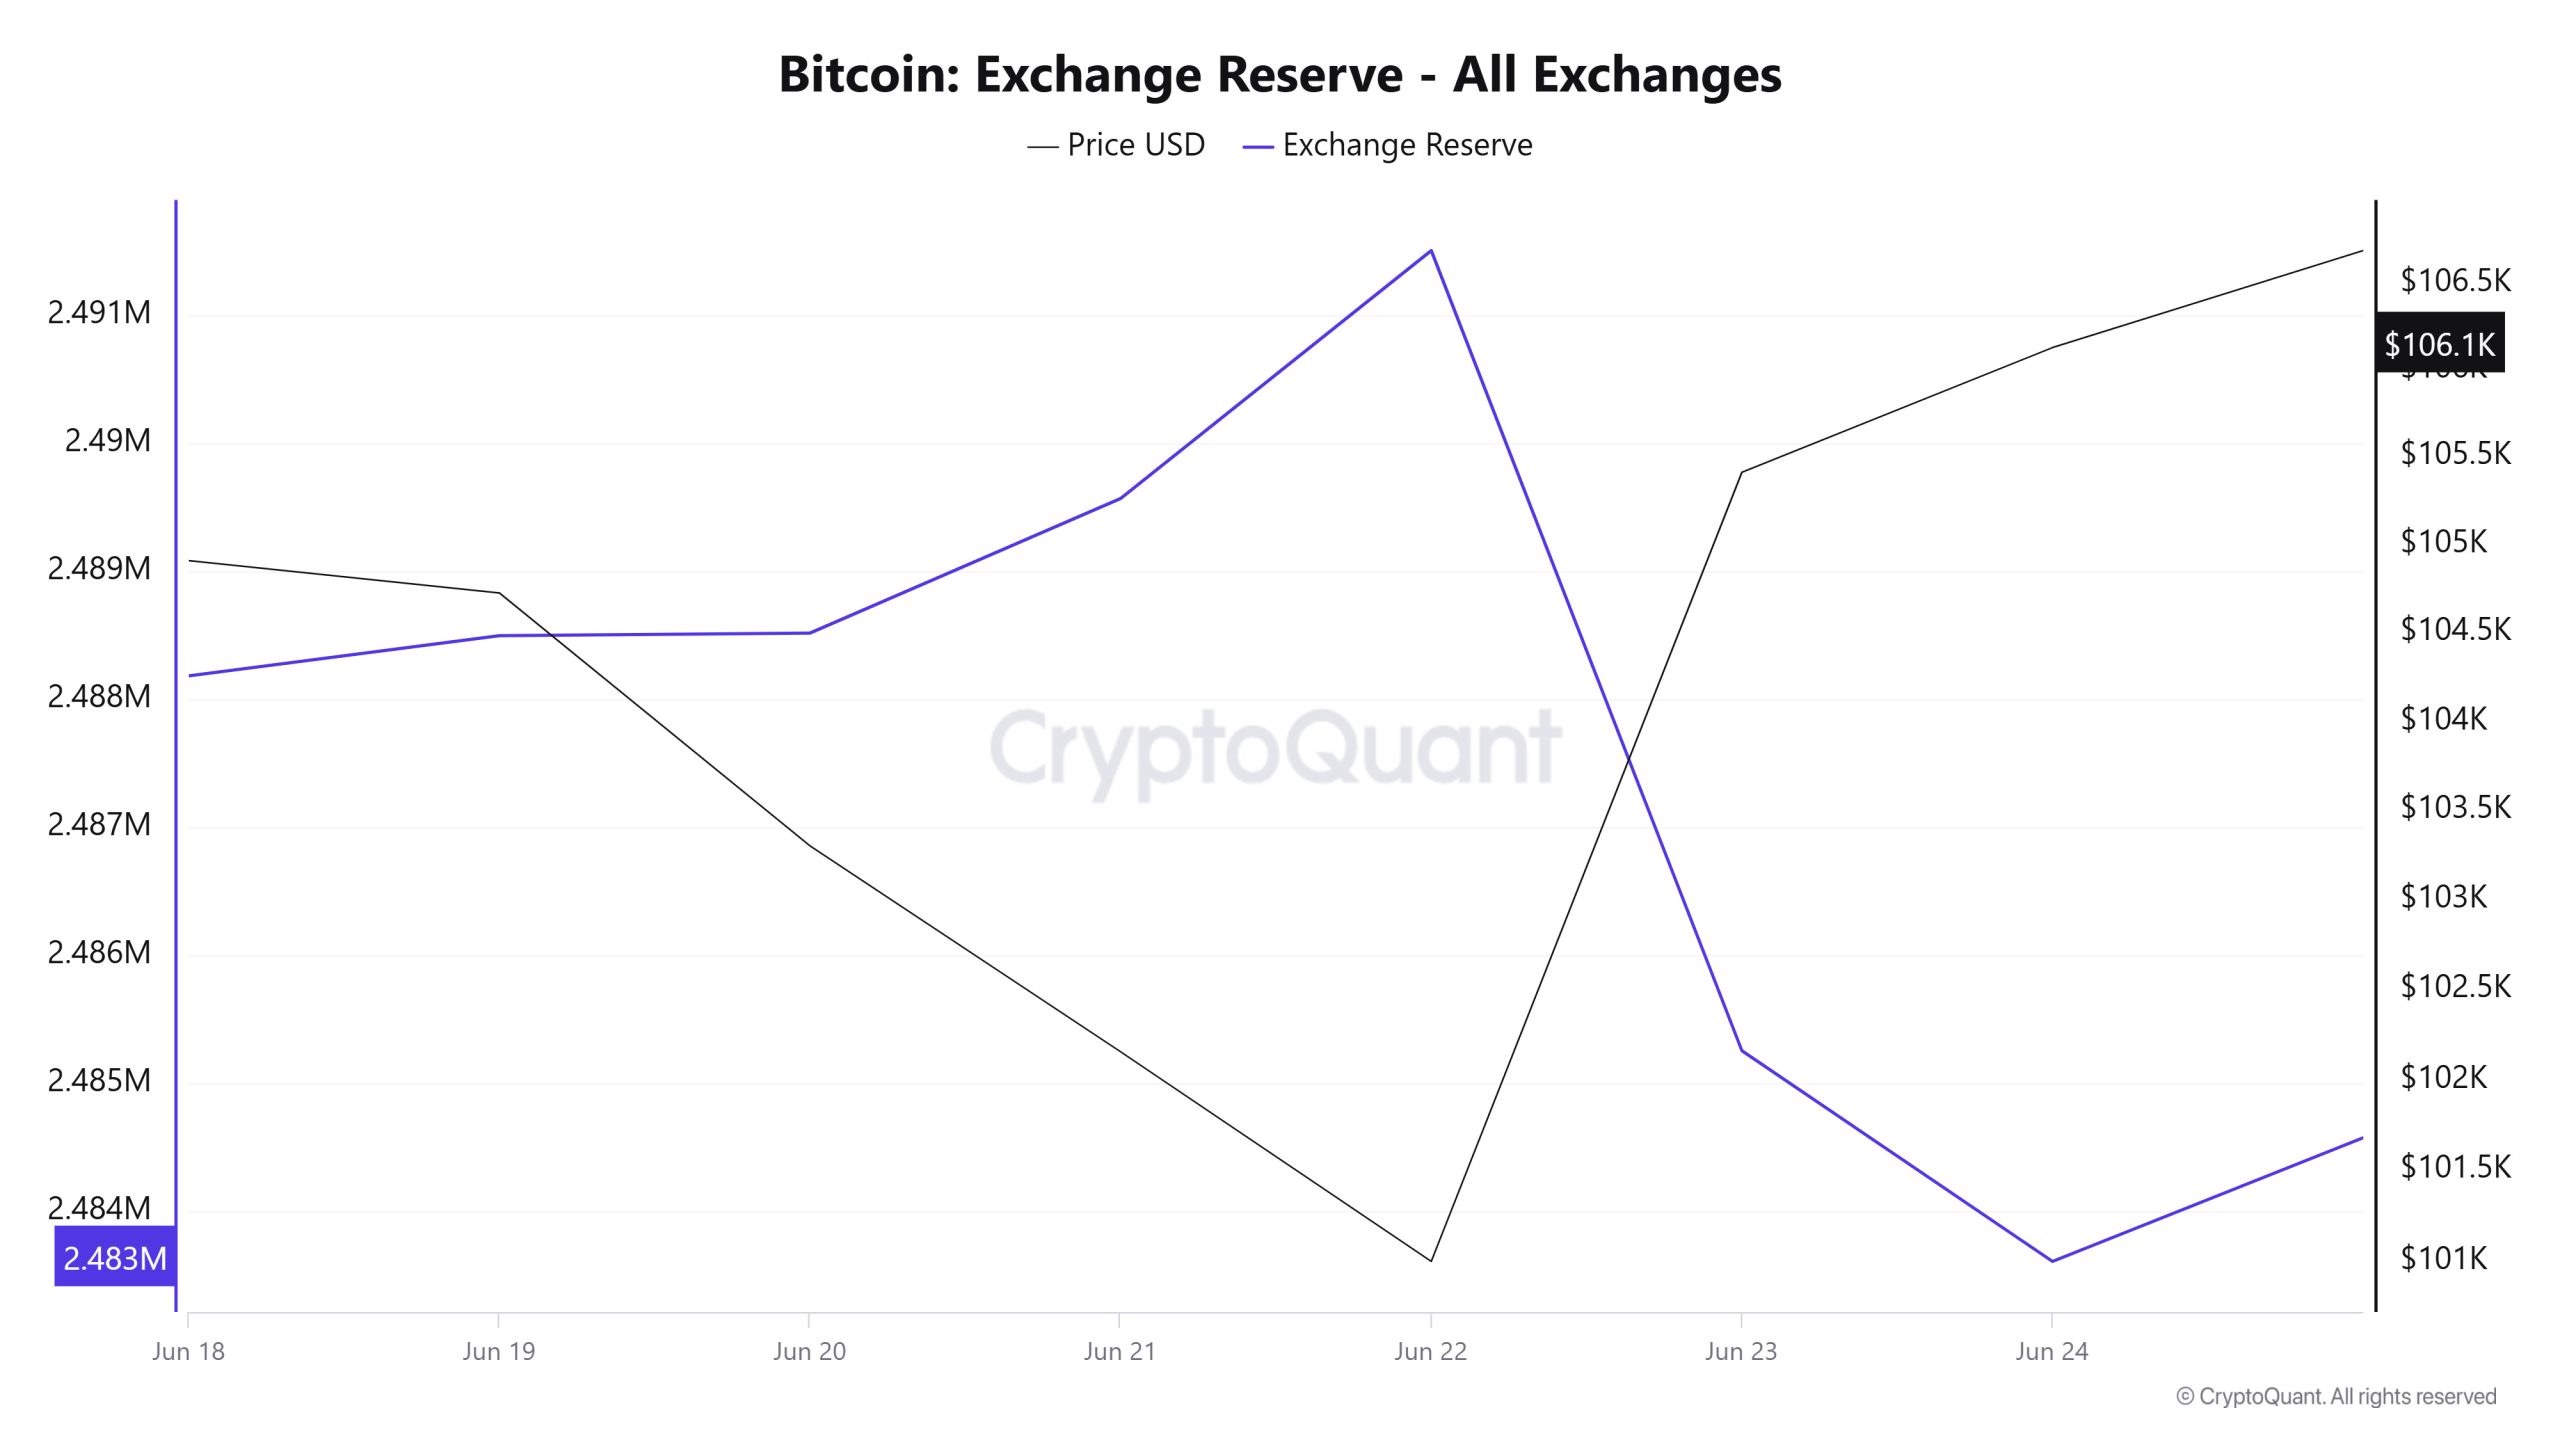
Between Juni 18-24, 2025, Bitcoin reserves on exchanges decreased from 2,488,184 BTC to 2,483,608 BTC. In total, there was a net outflow of 4,576 BTC during this period and the Bitcoin reserves of exchanges decreased by approximately 0.18%. The Bitcoin price, on the other hand, rose by 1.16% during the same period, from $104,911 to $106,129. The decline in exchange reserves suggests that investors remain inclined to hold their assets off-exchange, while the rise in prices indicates that market interest remains. A horizontal outlook may prevail in the short term, while the positive trend may continue in the long term.
| Datum | Austausch Zufluss | Austausch Abfluss | Netflow austauschen | Währungsreserve | BTC-Preis |
|---|---|---|---|---|---|
| 18-Jun | 27,459 | 28,489 | -1,030 | 2,488,184 | 104,911 |
| 19-Jun | 10,888 | 10,574 | 314 | 2,488,499 | 104,727 |
| 20-Jun | 21,537 | 21,517 | 20 | 2,488,519 | 103,302 |
| 21-Jun | 8,008 | 6,956 | 1,052 | 2,489,571 | 102,156 |
| 22-Jun | 19,370 | 17,433 | 1,937 | 2,491,508 | 101,003 |
| 23-Jun | 22,233 | 28,487 | -6,253 | 2,485,255 | 105,415 |
| 24-Jun | 26,755 | 28,401 | -1,646 | 2,483,608 | 106,129 |
Gebühren und Einnahmen

When Bitcoin Fees per Transaction (Mean) data between Juni 18 and Juni 24 are analyzed, it is seen that this indicator was realized at 0.00001576 on Juni 18, the first day of the week.
As of Juni 19, a downward trend was observed due to the volatile movements in the Bitcoin price; as of Juni 22, it fell to 0.00001048, reaching the lowest level of the week.
In the following days, Bitcoin Fees per Transaction (Mean) started to rise again and closed at 0.00002208 on Juni 24, the last day of the week.
Bitcoin: Gebühren (Gesamt)
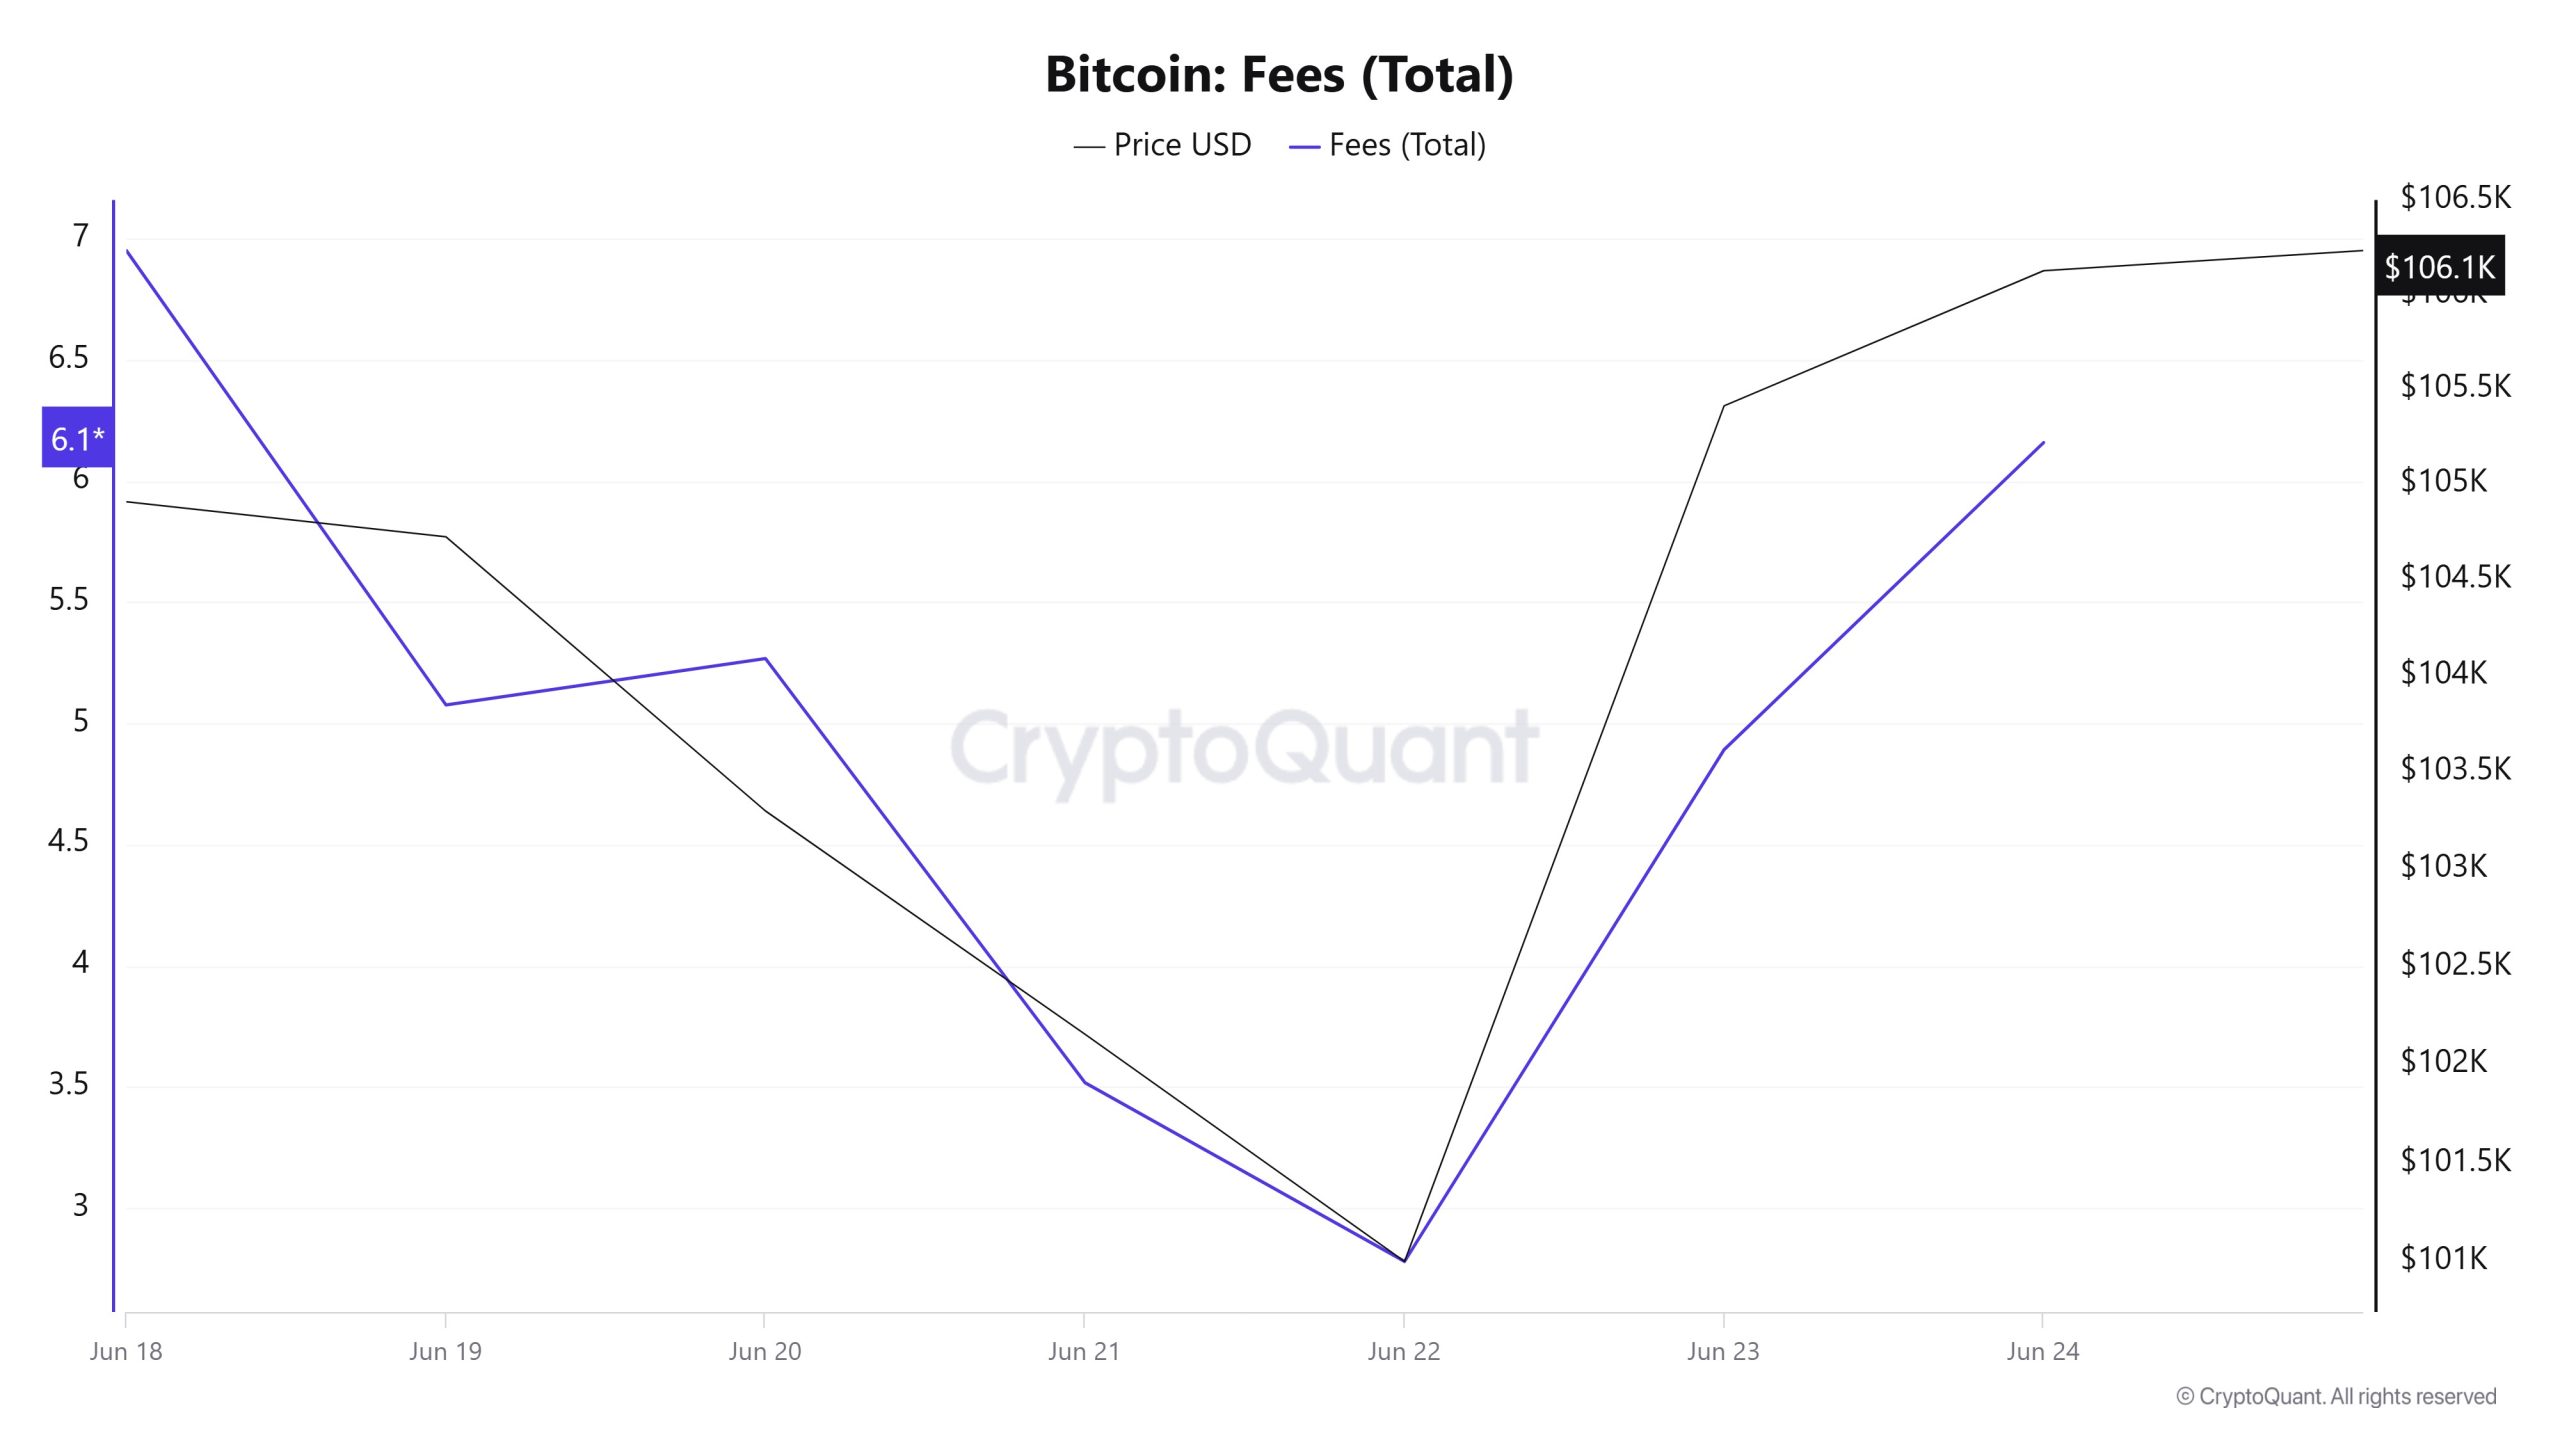
Similarly, when Bitcoin Fees (Total) data between Juni 18 and Juni 24 are analyzed, it is seen that this indicator was realized at 6.95175944 on Juni 18, the first day of the week.
As of Juni 18, a downward trend was observed due to the volatile movements in the Bitcoin price; as of Juni 22, it fell to 2.78059806, reaching the lowest level of the week.
In the following days, Bitcoin Fees (Total) started to rise again and closed at 6.15937865 on Juni 24, the last day of the week.
Bergarbeiterströme
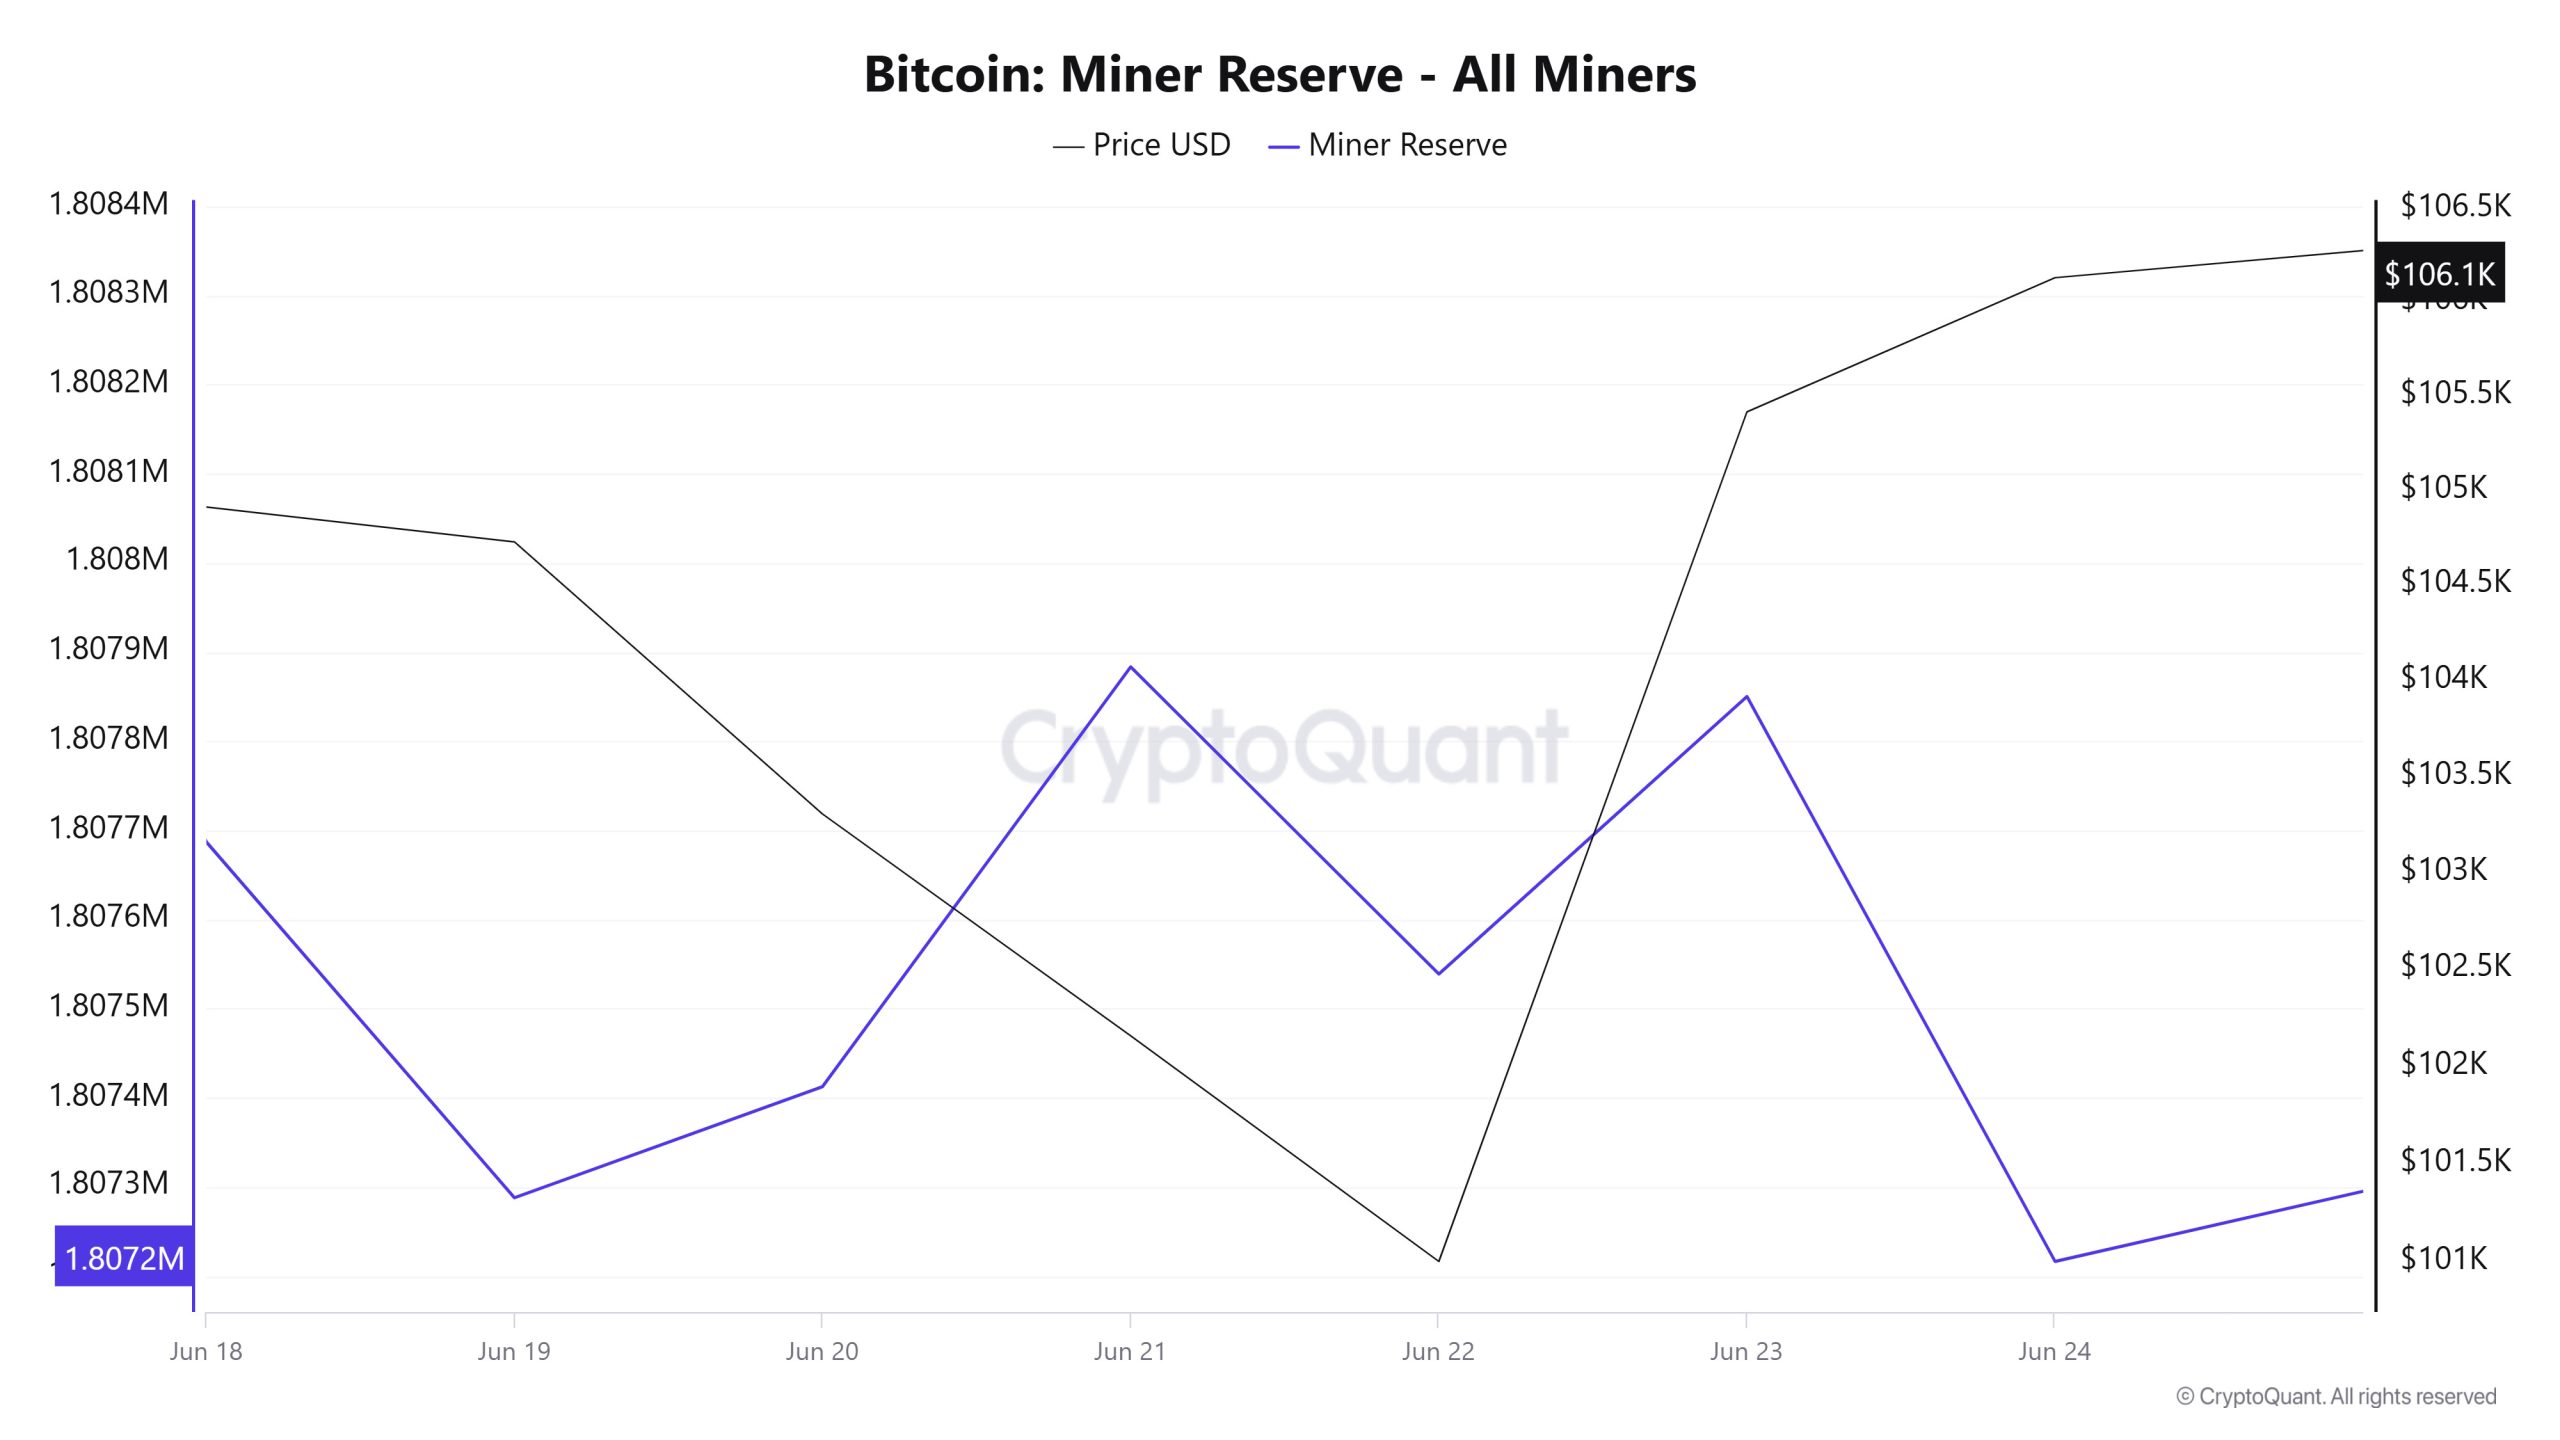
According to the data obtained from the Miner Reserve table, there was a decrease in Bitcoin reserves held in miners’ wallets this week. During the week, the correlation between Bitcoin price and Miner Reserve followed a dynamic course. The relationship, which was positive in the first days of the week, evolved into a negative correlation towards the middle of the week, then returned to a positive structure for a short period of time and shifted back to the negative correlation zone by the end of the week.
Miner-Zufluss, -Abfluss und NetFlow
Between Juni 18th and Juni 24th, 33,187 Bitcoins exited miners’ wallets, and 32,053 Bitcoins entered miners’ wallets between the same dates. This week’s Miner Netflow was -1,134 Bitcoin. Meanwhile, the Bitcoin price was $104,911 on Juni 18 and $106,129 on Juni 24.
For the week, the net flow (Miner NetFlow) was negative as Bitcoin inflow into miner wallets (Miner Inflow) was less than Bitcoin outflow from miner wallets (Miner Outflow).
| Metrisch | Juni 18 | Juni 19 | Juni 20 | Juni 21 | Juni 22 | 23. Juni | Juni 24 |
|---|---|---|---|---|---|---|---|
| Zufluss von Bergleuten | 3,516.52 | 2,547.57 | 5,111.38 | 3,653.65 | 5,960.88 | 5,635.45 | 5,627.64 |
| Abfluss von Bergleuten | 4,180.09 | 2,946.60 | 4,986.65 | 3,182.81 | 6,305.46 | 5,324.11 | 6,261.39 |
| Bergarbeiter Netflow | -663.57 | -399.04 | 124.73 | 470.84 | -344.59 | 311.34 | -633.75 |
Transaktion
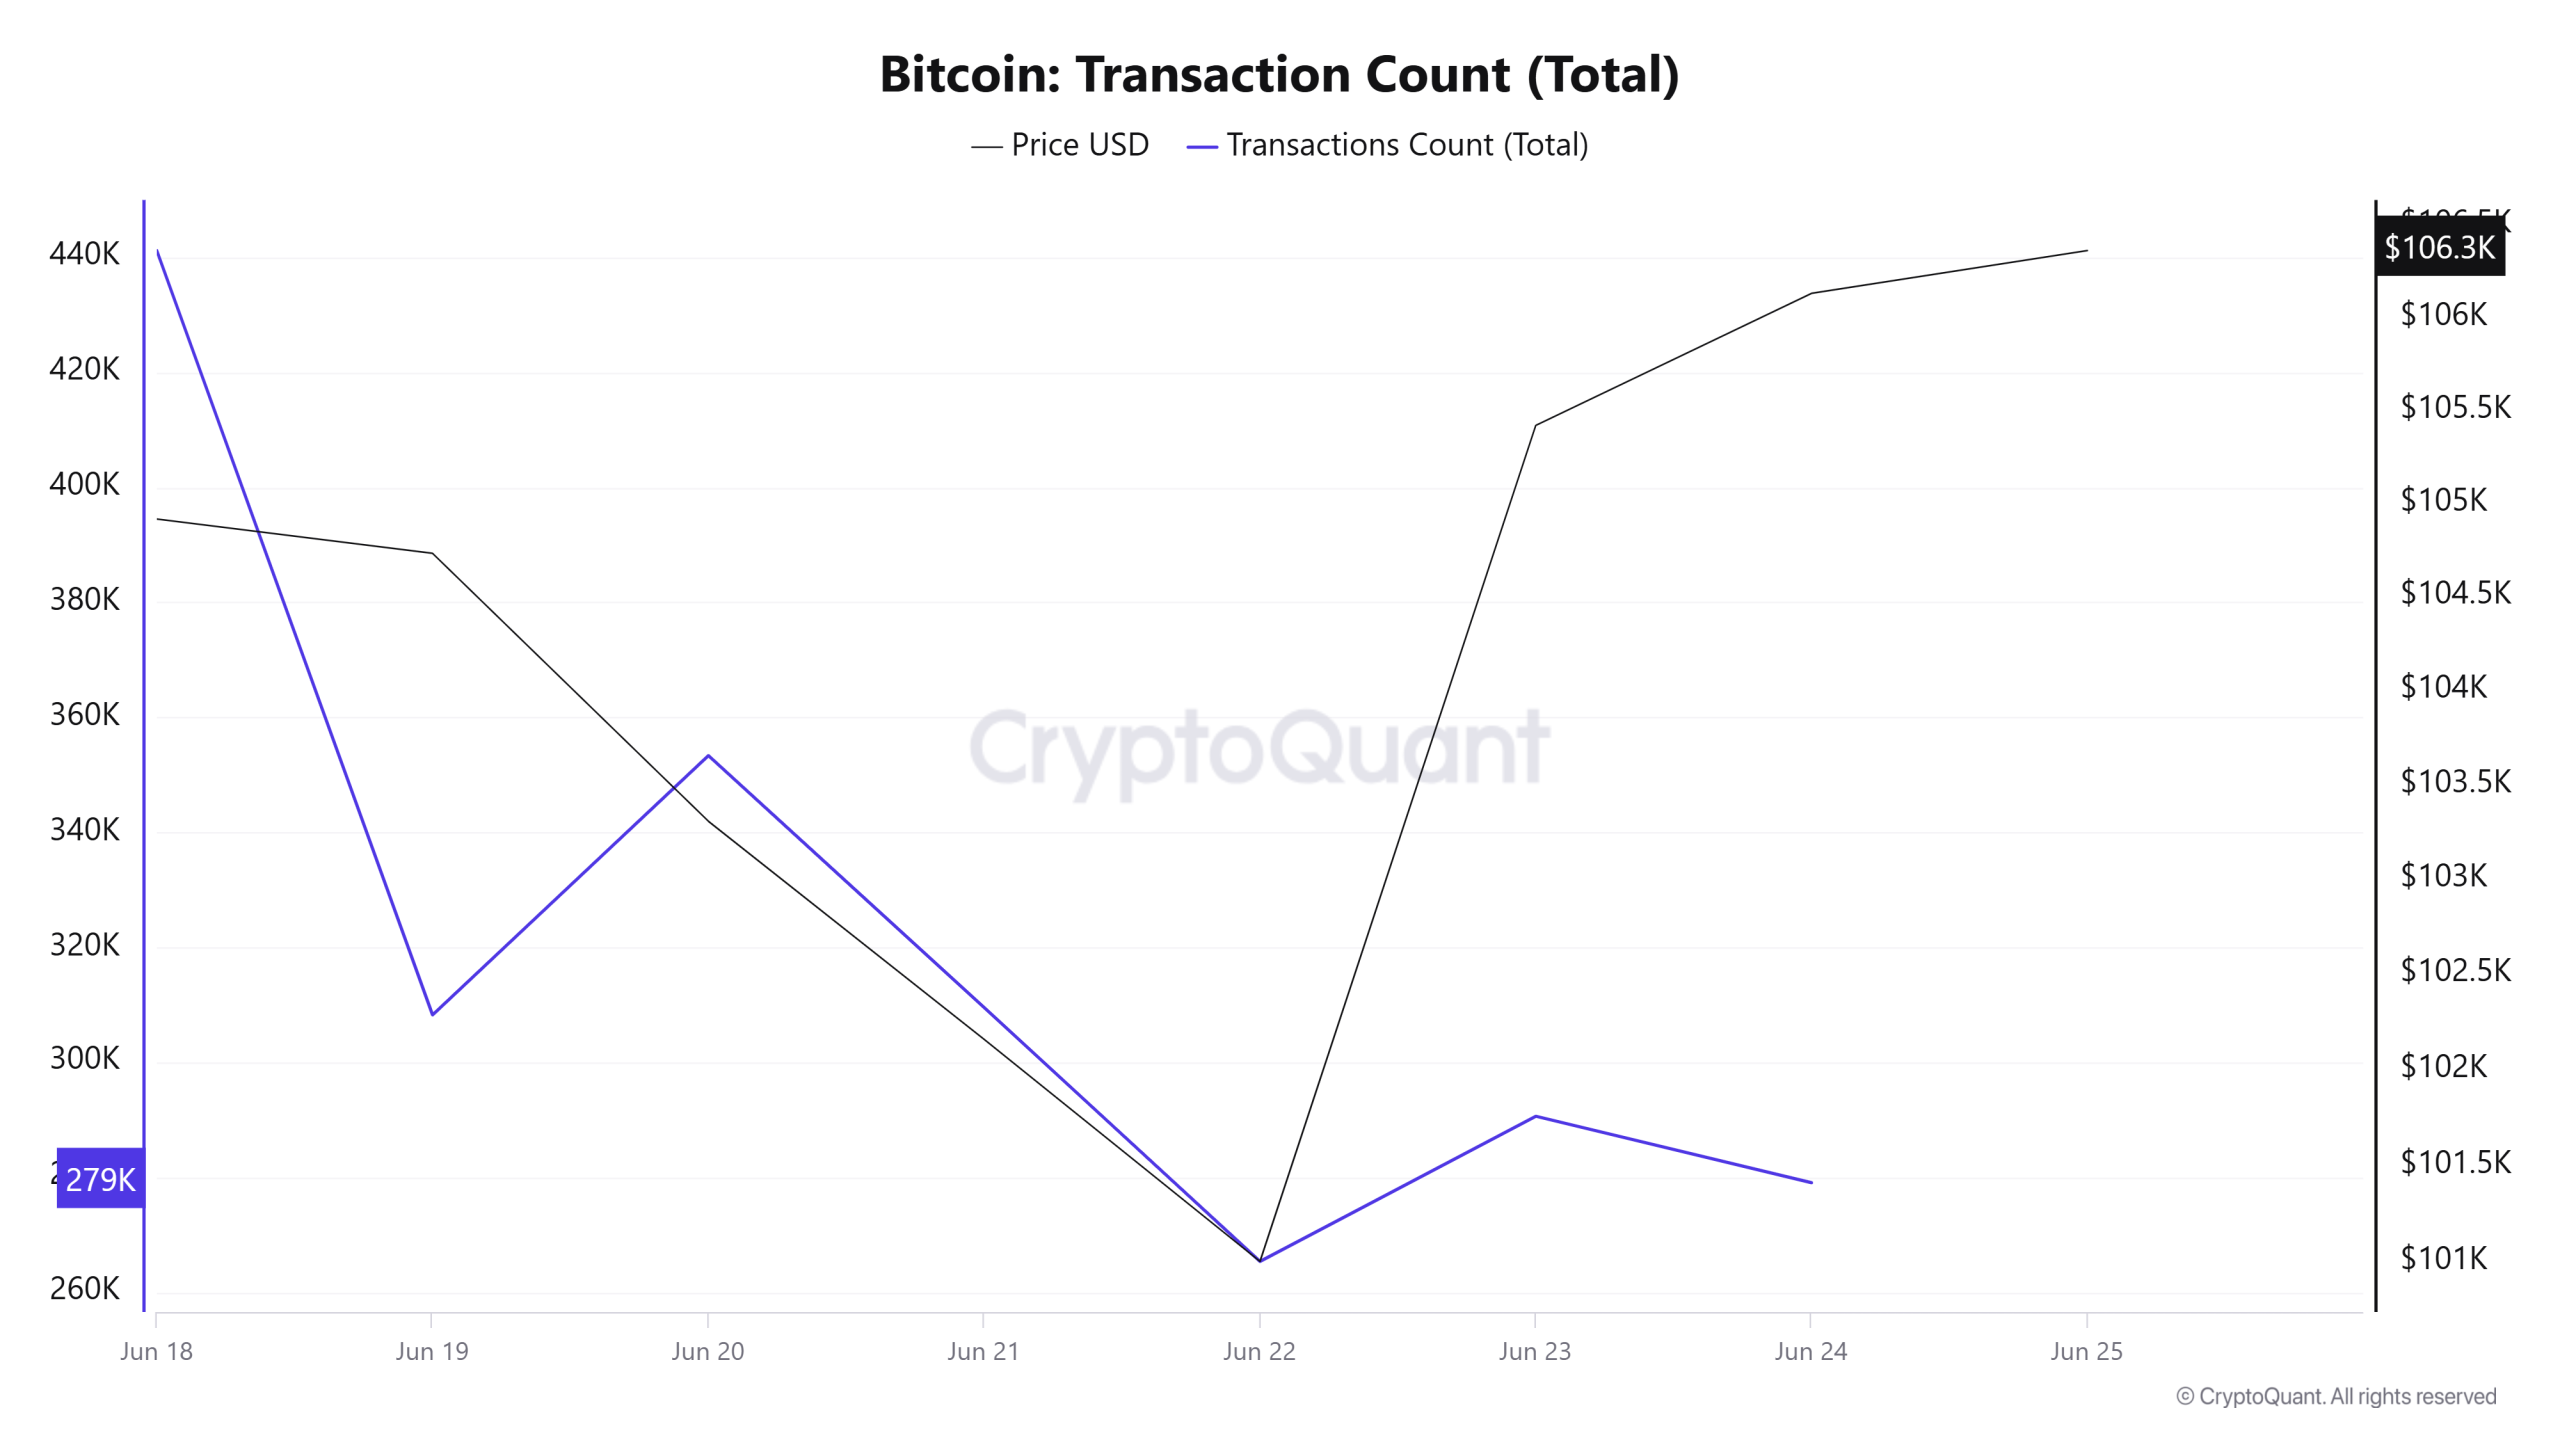
Last week, there were 2,394,602 transactions on the Bitcoin network, while this week it decreased by about 6.16% to 2,247,054. The 265,314 transactions recorded on Juni 22 were the lowest for the week, while the highest number of transactions was 441,177 on Juni 18.
Correlations between price and number of trades were mixed during the week, with positive correlations predominating throughout the week, but the decrease in network activity compared to the previous week suggests that a strong indicator is not yet in place.
Übertragene Wertmarken
While 3,715,566 BTC was transferred last week, this week it increased by approximately 1.53% to 3,772,565 BTC . On Juni 24, the highest token transfer volume of the week was 695,393 BTC, while the lowest token transfer volume was recorded on Juni 21 with 323,165 BTC. The positive correlation between the amount of BTC transferred on the network and the price this week is lower than last week, but a complete decoupling has not yet been realized.
Wale Aktivitäten
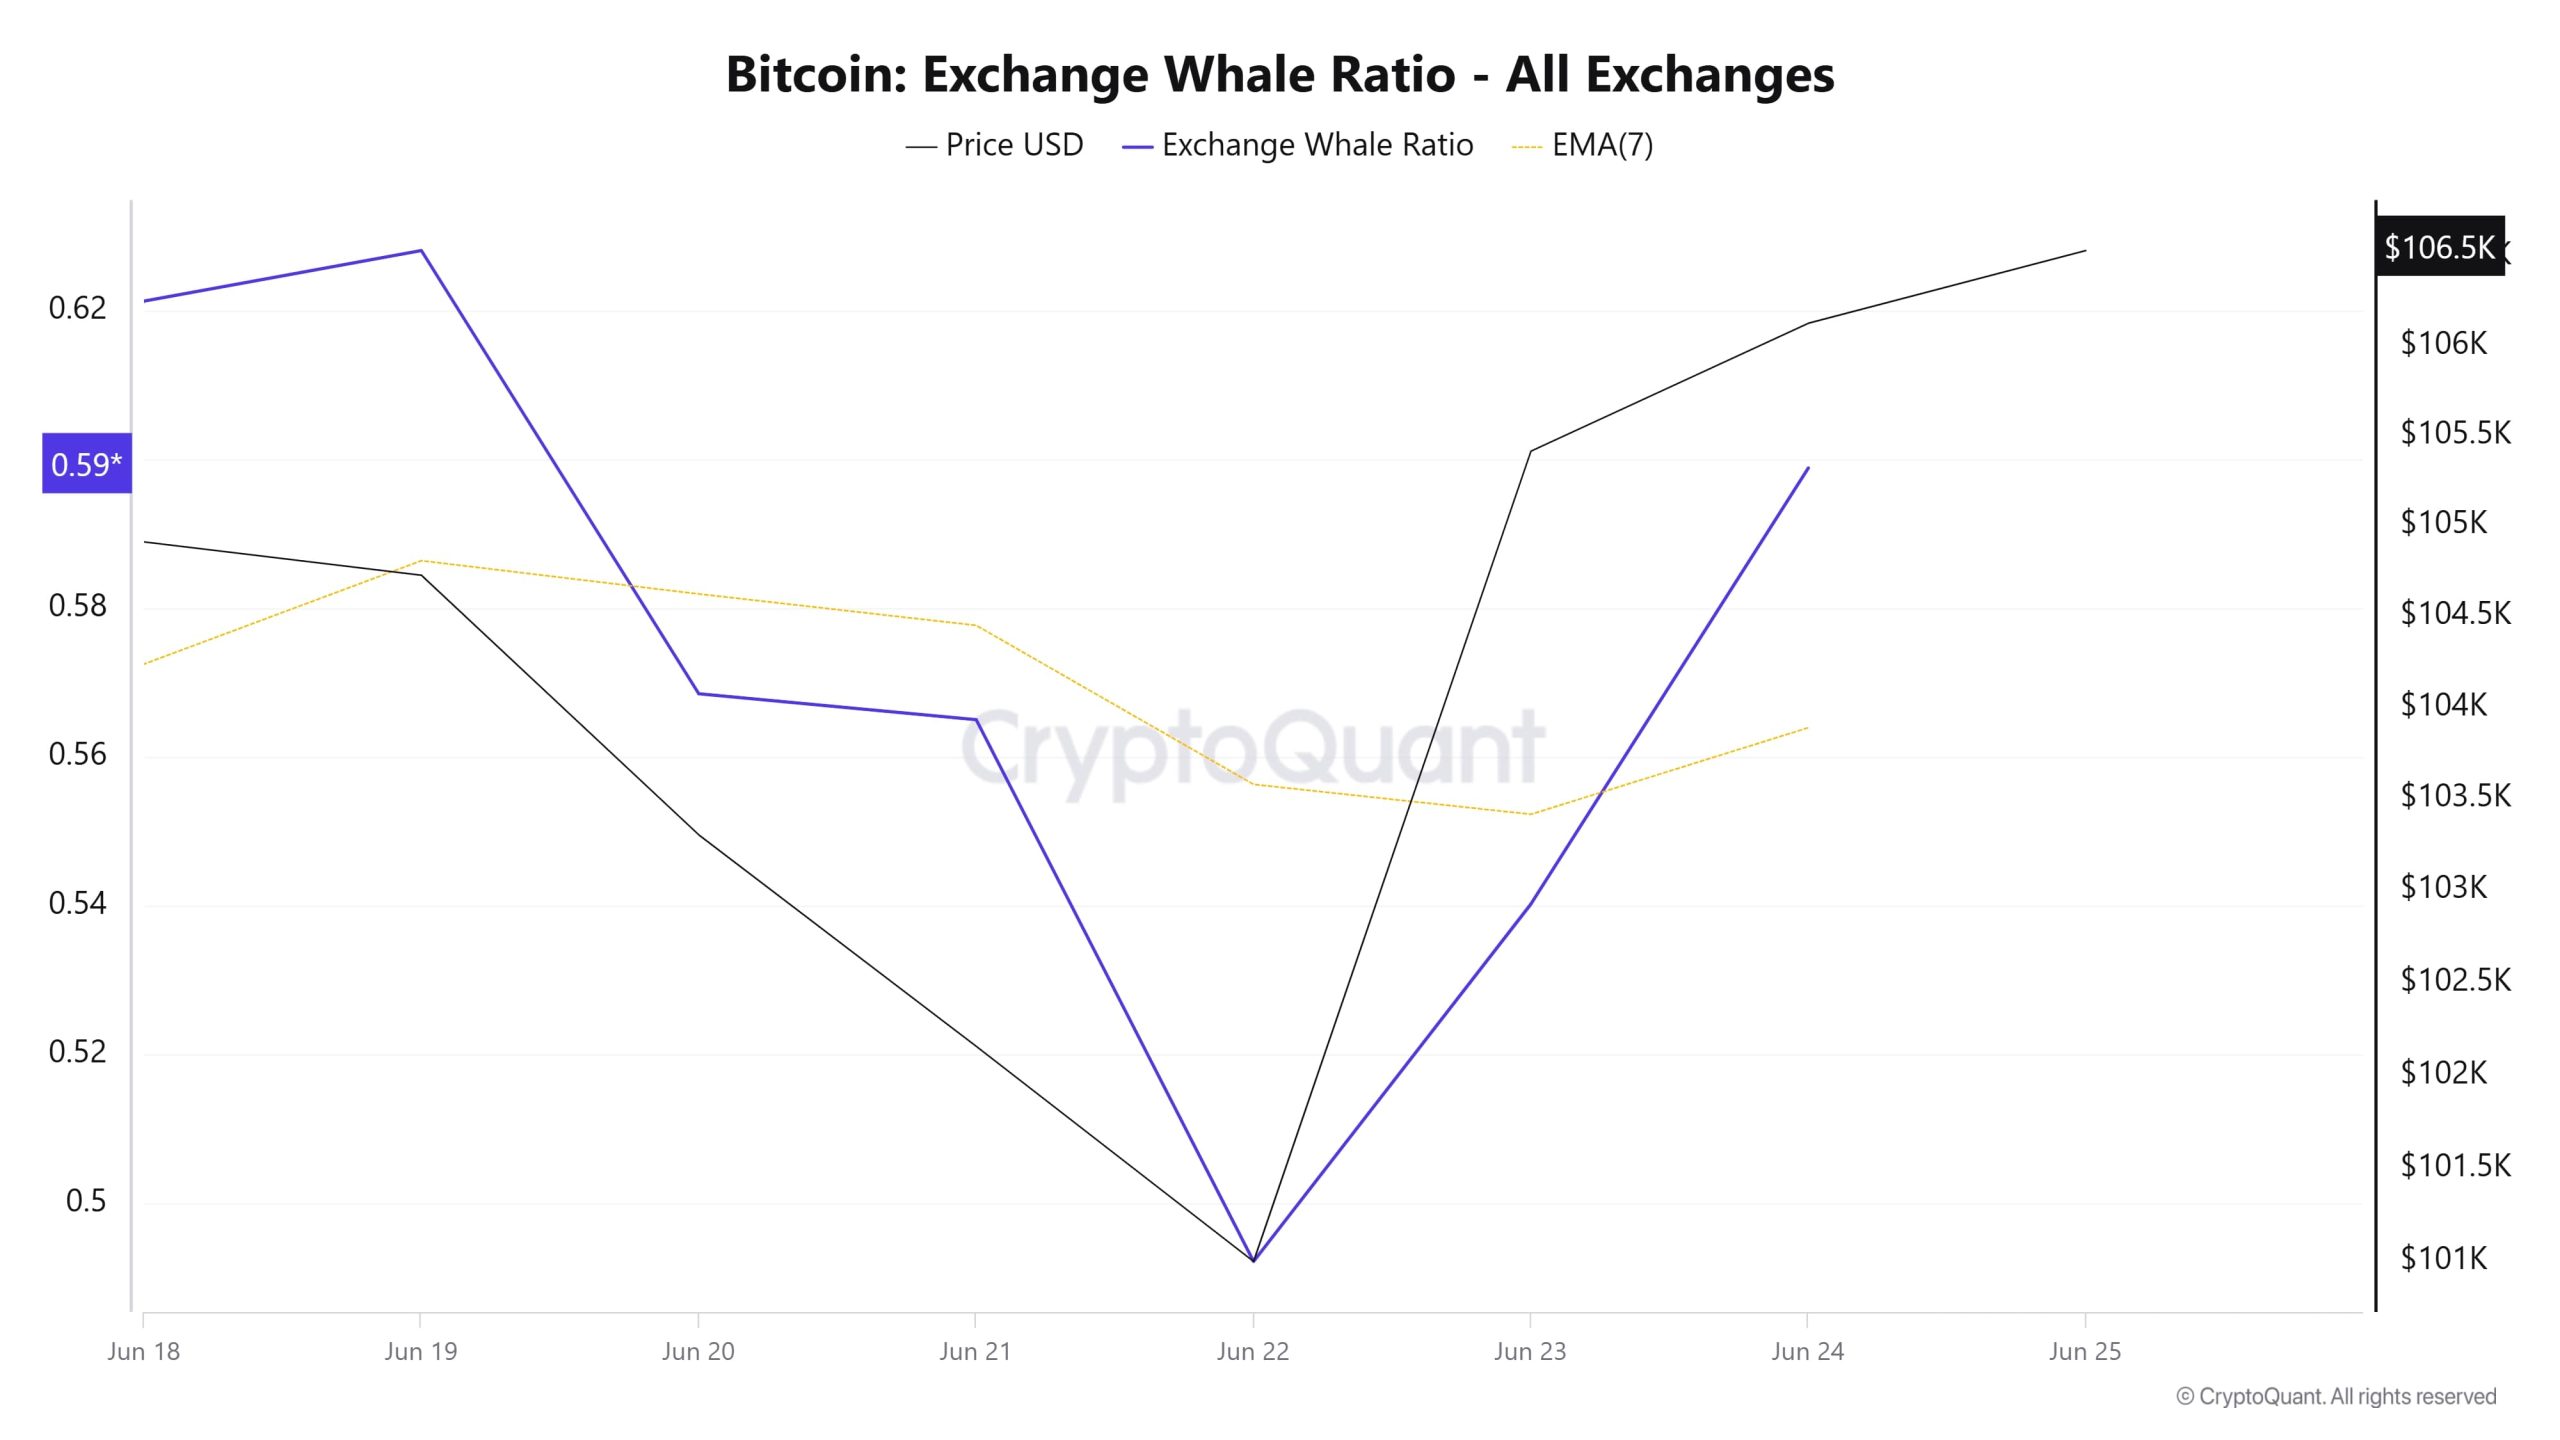
Daten über Wale:
Over the last 7 days, data from the cryptocurrency market showed that whale activity on centralized exchanges was high at the beginning of the process. Towards the middle of the process, these activities declined. When we look at the Exchange Whale Ratio metric, Juni 18, the first day of the 7-day period, measured the rate of whales using central exchanges as 0.621. The peak of the process took place on Juni 19 and the value was 0.628. When this ratio is above 0.35, it usually means that whales use centralized exchanges frequently. This measurement decreased towards the middle of the process, dropping to 0.492 on Juni 22, marking the low point of the process. It currently stands at 0.598 and centralized exchanges continue to be used frequently. BTC’s value was $104,000 at the beginning of this process and fell to $98,000 in the middle of the process. It is currently priced at $106,500. This suggests that whales used centralized exchanges to buy at the beginning of the process. In the middle of the process, they used them to sell. At the moment, the accumulating whales are in the circuit. At the same time, 3,772,565 BTC moved in total BTC transfers, in line with last week. The data shows that four separate transactions totaling more than 5,690 BTC, each worth between $107 million and $207 million, were sent from unknown wallets to newly created addresses. These transfers attracted attention as they coincided with a period of increased market volatility and risk aversion. As a result, when we focus on the movements, the fact that whales often use centralized exchanges for buying may continue to have a positive impact on the price.
BTC Onchain Insgesamt
| Metrisch | Aufstehen 📈. | Niedergang 📉 | Neutral ➖ |
|---|---|---|---|
| Aktive Adressen | ✓ | ||
| Pannen | ✓ | ||
| Derivate | ✓ | ||
| Versorgung Verteilung | ✓ | ||
| Währungsreserve | ✓ | ||
| Gebühren und Einnahmen | ✓ | ||
| Bergarbeiterströme | ✓ | ||
| Transaktion | ✓ | ||
| Wale Aktivitäten | ✓ |
*The metrics and guidance in the table do not, by themselves, describe or imply an expectation of future price changes for any asset. The prices of digital assets may vary depending on many different variables. The onchain analysis and related guidance is intended to assist investors in their decision-making process, and making financial investments based solely on the results of this analysis may result in harmful transactions. Even if all metrics produce a bullish, bearish or neutral result at the same time, the expected results may not be seen depending on market conditions. Investors reviewing the report would be well advised to heed these caveats.
Rechtlicher Hinweis
Die in diesem Dokument enthaltenen Anlageinformationen, Kommentare und Empfehlungen stellen keine Anlageberatungsdienste dar. Die Anlageberatung wird von zugelassenen Instituten auf persönlicher Basis unter Berücksichtigung der Risiko- und Ertragspräferenzen des Einzelnen durchgeführt. Die in diesem Dokument enthaltenen Kommentare und Empfehlungen sind allgemeiner Art. Diese Empfehlungen sind möglicherweise nicht für Ihre finanzielle Situation und Ihre Risiko- und Renditepräferenzen geeignet. Eine Anlageentscheidung, die ausschließlich auf der Grundlage der in diesem Dokument enthaltenen Informationen getroffen wird, kann daher möglicherweise nicht zu Ergebnissen führen, die mit Ihren Erwartungen übereinstimmen.
HINWEIS: Alle Daten, die in der Bitcoin-Onchain-Analyse verwendet werden, basieren auf Cryptoqaunt.