
Aktive Adressen
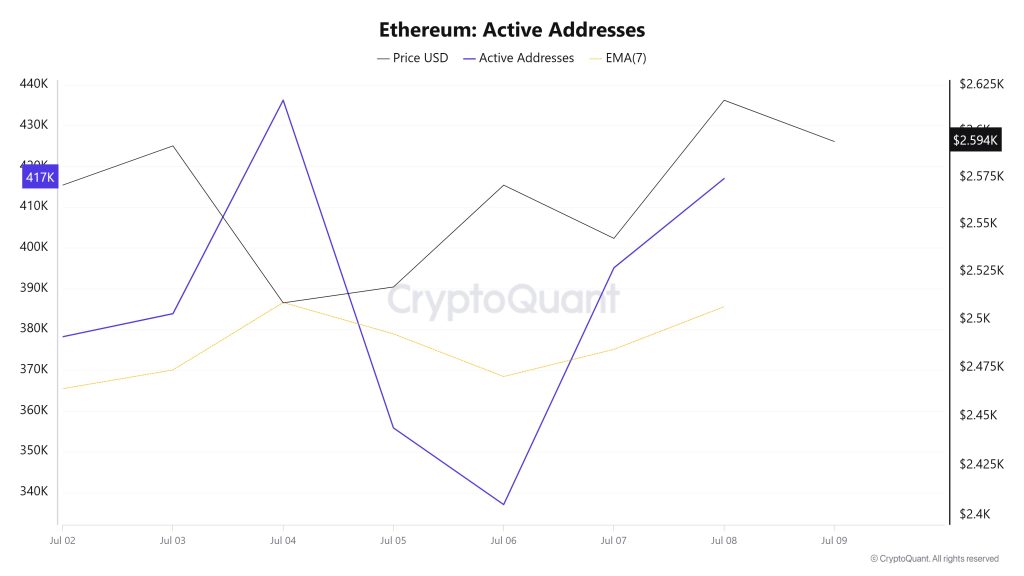
Between Juli 2 and Juli 9, there were a total of 436,226 active logins to the Ethereum network. During this time, the price of Ethereum rose from $2,508 to $2,616. On Juli 3, at the intersection of the price and the number of active addresses, a significant decrease in the number of active addresses was observed until Juli 6 despite the purchases. When the 7-day simple moving average (SMA) is analyzed, a horizontal trend is observed in the Ethereum price.
Aktive Absenderadressen
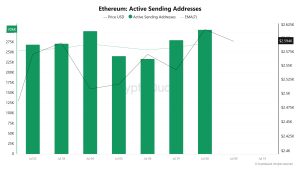
Between Juli 2 and Juli 9, there was a downward movement in active shipping addresses with the Black Line (price line). On the day when the price reached its weekly high, active shipping addresses were 238,730, while on Juli 1, the day Ethereum hit its weekly low, this number dropped to 229,897. This caused the Ethereum price to fall to $ 2,407.
Aktive Empfangsadressen
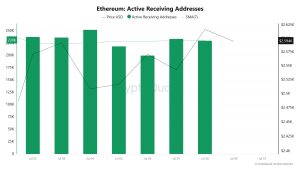
Between Juni 25 and Juli 2, the price consolidated horizontally as active buy addresses increased. On the day when the price reached its highest level, active receiving addresses rose to 306,151, indicating that purchases are accelerating.
Eingesetzter Gesamtwert
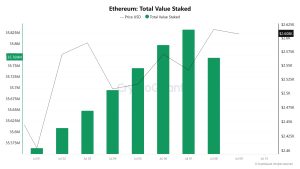
On Juli 2, ETH price was at 2,570 while Total Value Staked was at 35,610,071. As of Juli 8, ETH price increased by 1.78% to 2,616, while Total Value Staked increased by 0.45% to 35,769,595.
Absteckung der Zuflüsse
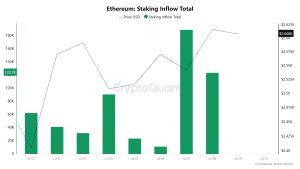
On Juli 2, ETH price was at 2,570 while Staking Inflow was at 41,527. As of Juli 8, ETH price rose to 2,616, an increase of 1.78%, while Staking Inflow rose to 123,749, an increase of 198.01%.
Derivate
Offenes Interesse
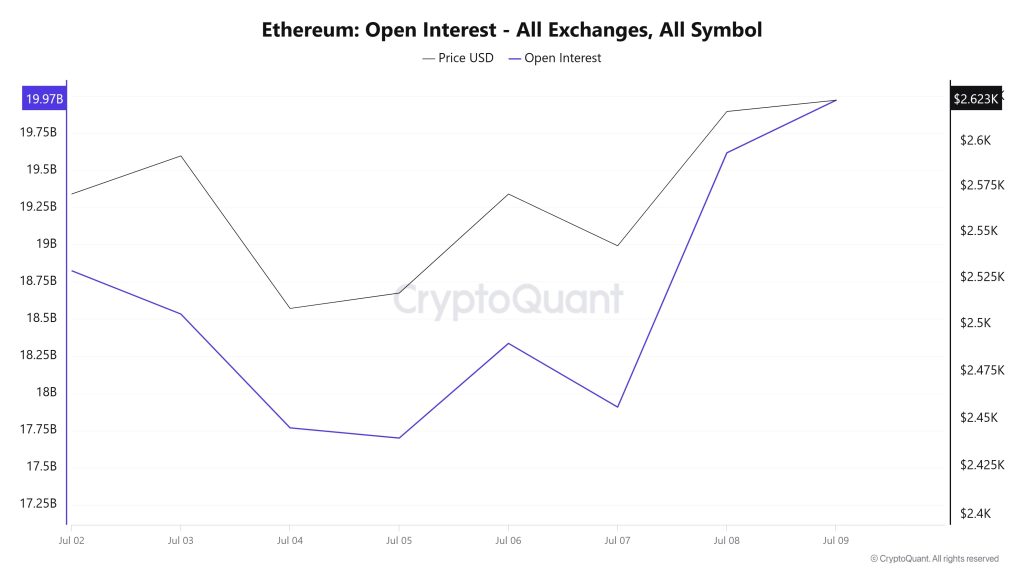
Although the open interest data in Ethereum futures transactions has been quite volatile since the first days of Juli, it has shown a significant recovery in the last few days. Open interest, which was at $18.75 billion on the second day of the month, fell to $17.7 billion with a steady decline that lasted until Juli 4. This pullback suggests that investors are closing their positions and waiting on the sidelines or prefer to act cautiously in the face of possible uncertainty. The fact that the price also moved downwards in the same period shows that these position closures were concentrated especially on the long side. However, the picture started to change as of Juli 5. While there was a limited upward trend in open positions, the price’s recovery effort also supported this movement. This process shows that confidence is returning to the market and investors are returning step by step. The real breakthrough occurred on Juli 8-9. The sharp rise in open interest, reaching $19.97 billion, signaled a strong re-entry in the Ethereum market. The price climbed as high as $2,623 in the process, providing not only technical but also volumetric support.
This suggests that market participants are not just looking for short-term opportunities, but for a more permanent upside structure. However, such a rapid increase in open positions also brings with it a certain vulnerability. There is a risk that these positions could be quickly unwound in the event of sudden changes in direction. For now, although the overall structure continues to strengthen on the Ethereum front, it will be critical to observe the sustainability of this voluminous rise.
Förderquote
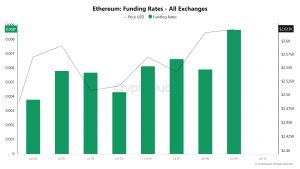
From Juli 2nd to Juli 9th, Ethereum’s funding rates generally showed an upward trend. The rates, which started at a very low level on the 2nd of the month, started to rise with the gradual increase in the price. Especially on Juli 3 and Juli 6, there were significant jumps in the funding rate levels, while the price also supported the upward movements on these dates. On Juli 4, while the funding rate remained flat, the price retreated slightly, but this decline was not permanent and as of Juli 6, both prices and rates regained upward momentum. On Juli 7, the funding rate maintained its high level, while the price took a short-lived pause. As of today, it was the day when peaks were seen in both metrics. Funding rate hit a multi-day high today, while the Ethereum price hit a chart high of $2,633.
This outlook suggests that the market’s interest in long positions is growing and investors’ bullish expectations are strengthening. However, such high funding rates may also signal overcrowded long positions, indicating that a period that needs to be carefully monitored has entered.
Long & Short Liquidationen
With the ETH price moving in the band between $ 2,375 and $ 2,640, a long transaction of $ 183 million and a short transaction of $ 262 million was liquidated this week.
Versorgung Verteilung
Total Supply: It reached 120,895,175 units, an increase of about 0.0166% compared to last week.
New Supply: The amount of ETH produced this week was 20,077.
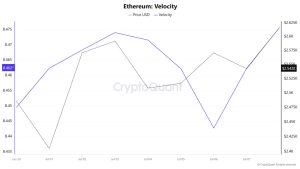
Velocity: Velocity was 8.46 as of Juli 7, down from 8.44 last week.
| Datum | Langer Betrag (Millionen $) | Kurzer Betrag (Millionen $) |
|---|---|---|
| Juli 02 | 29.05 | 101.28 |
| Juli 03 | 25.17 | 36.71 |
| Juli 04 | 64.37 | 18.54 |
| Juli 05 | 9.39 | 5.03 |
| Juli 06 | 14.08 | 54.62 |
| Juli 07 | 33.64 | 11.66 |
| Juli 08 | 7.43 | 34.68 |
| Insgesamt | 183.13 | 262.52 |
According to the latest weekly data, 100 – 1k ETH wallets experienced a limited increase of 1.78%, while wallets in the 1k – 10k ETH range saw a gradual increase of 2.97%. The 10k – 100k ETH segment showed a stronger growth of 4.38%, while 100k+ ETH wallets saw a remarkable 6.32% increase. These increases indicate that accumulation is accelerating, especially in large-scale wallets.
Währungsreserve
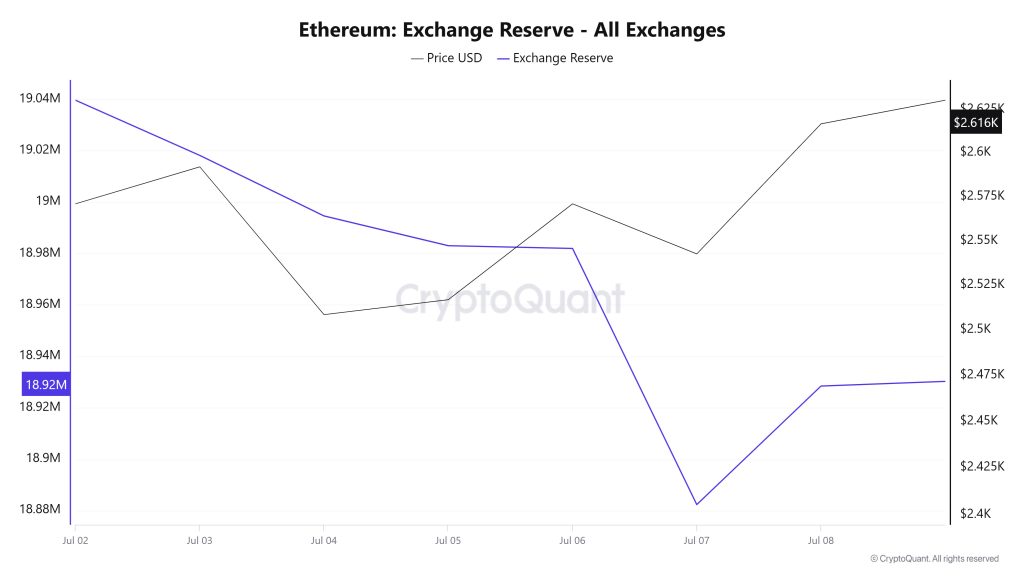
Between Juli 2-8, 2025, Ethereum reserves on exchanges decreased from 19,039,634 ETH to 18,928,457 ETH. During this period, there was a total net outflow of 111,177 ETH and a decrease in reserves of approximately 0.58%. The Ethereum price, on the other hand, rose from $2,571 to $2,617 during the same period, gaining about 1.78%. The outflows from the exchanges show that investors tend to protect their assets for the long term. At the same time, the upward movement of prices indicates a continued improvement in market sentiment. Increasing demand for Ethereum and investors’ shift to off-exchange trading may continue in the coming days, which could have a positive impact on the price.
| Datum | 2-Jul | 3-Jul | 4-Jul | 5-Jul | 6-Jul | 7-Jul | 8-Jul |
| Austausch Zufluss | 828,627 | 685,952 | 477,270 | 240,350 | 217,514 | 715,976 | 790,968 |
| Austausch Abfluss | 816,372 | 707,413 | 500,821 | 251,921 | 218,594 | 815,598 | 744,861 |
| Netflow austauschen | 12,255 | -21,461 | -23,551 | -11,571 | -1,079 | -99,622 | 46,107 |
| Währungsreserve | 19,039,634 | 19,018,174 | 18,994,623 | 18,983,052 | 18,981,973 | 18,882,351 | 18,928,457 |
| ETH-Kurs | 2,571 | 2,592 | 2,509 | 2,517 | 2,571 | 2,543 | 2,617 |
Gebühren und Einnahmen
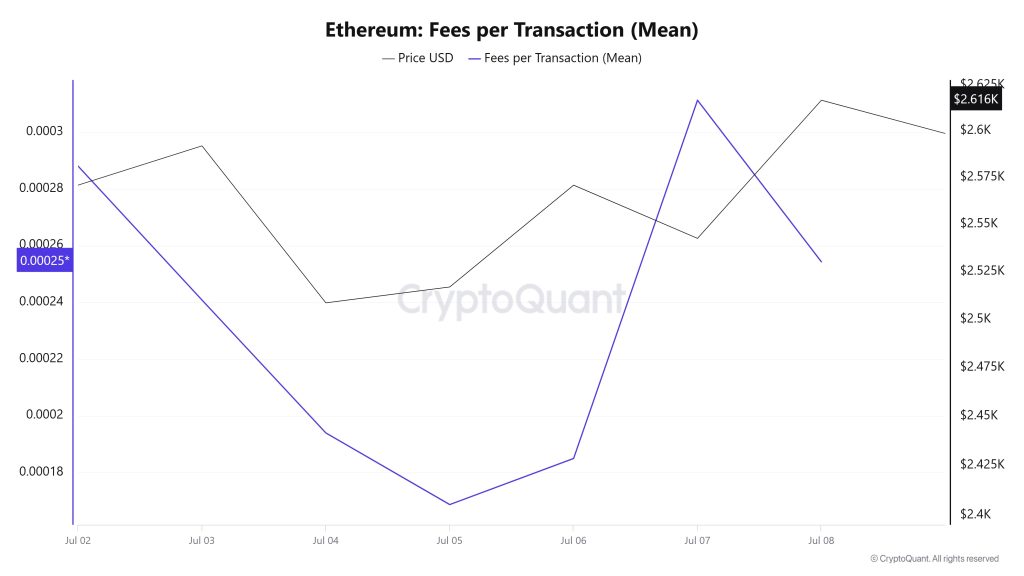
Between Juli 2 and Juli 8, Ethereum Fees per Transaction (Mean) data shows that this indicator was at 0.000288033960765961 on Juli 2, the first day of the week.
As of this date, a downward trend was observed due to the volatile movements in the Ethereum price; As of Juli 5, it fell to 0.000168678070278222, reaching the lowest level of the week.
In the following days, Ethereum Fees per Transaction (Mean) started to rise again and closed at 0.000254287106254686 on Juli 8, the last day of the week.
Ethereum: Fees (Total)
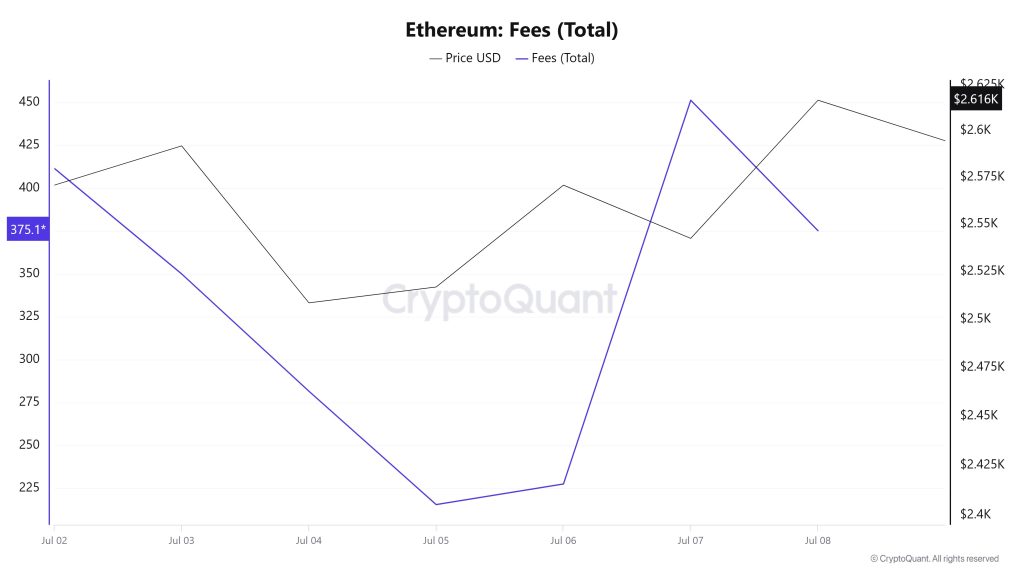
Similarly, an analysis of Ethereum Fees (Total) data from Juli 2 to Juli 8 shows that on Juli 2, the first day of the week, this indicator was 411.4516163768421.
As of this date, a downward trend was observed due to the volatile movements in the Ethereum price; as of Juli 5, it fell to 215.55319997432878, reaching the lowest level of the week.
In the following days, Ethereum Fees (Total) started to rise again and closed at 375.1655336581261 on Juli 8, the last day of the week.
Blocks Mined
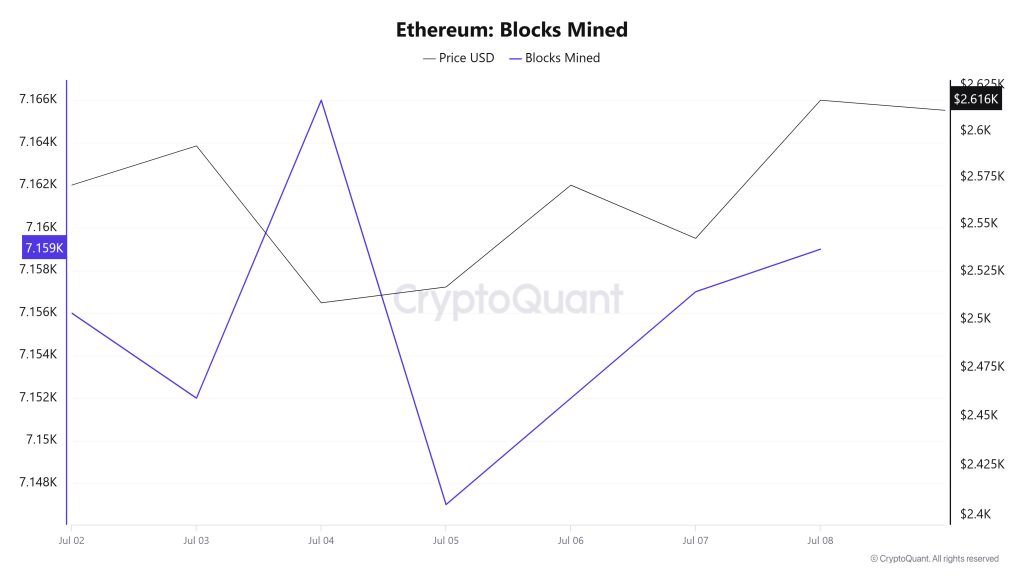
Between Juli 2 and Juli 8, Ethereum block production data showed a slight increase throughout the week. While 7,156 blocks were produced on Juli 2, this number increased to 7,159 as of Juli 8. There was a negative correlation between the Ethereum price and the number of block production throughout the week.
Blockgröße
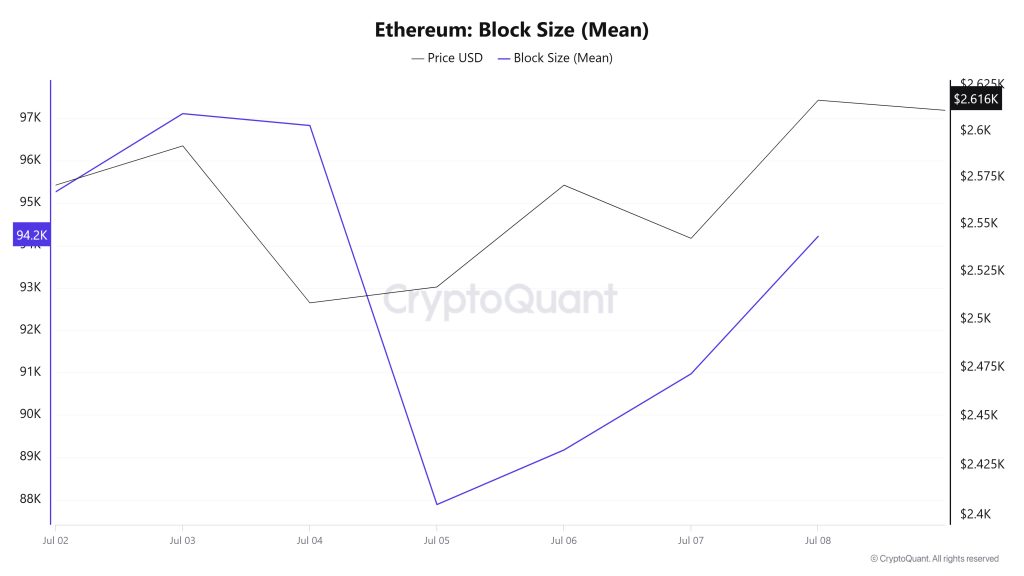
Between Juli 2 and Juli 8, Ethereum block size data showed a decline throughout the week. While on Juli 2, the average block size was measured at 95,265 bytes, this value decreased to 94,215 bytes as of Juli 8. This decrease indicates that the transaction density or block occupancy rates on the network decreased on a weekly basis.
In dieser Woche gab es eine positive Korrelation zwischen der Blockgröße und dem Ethereum-Preis.
Block Intervall
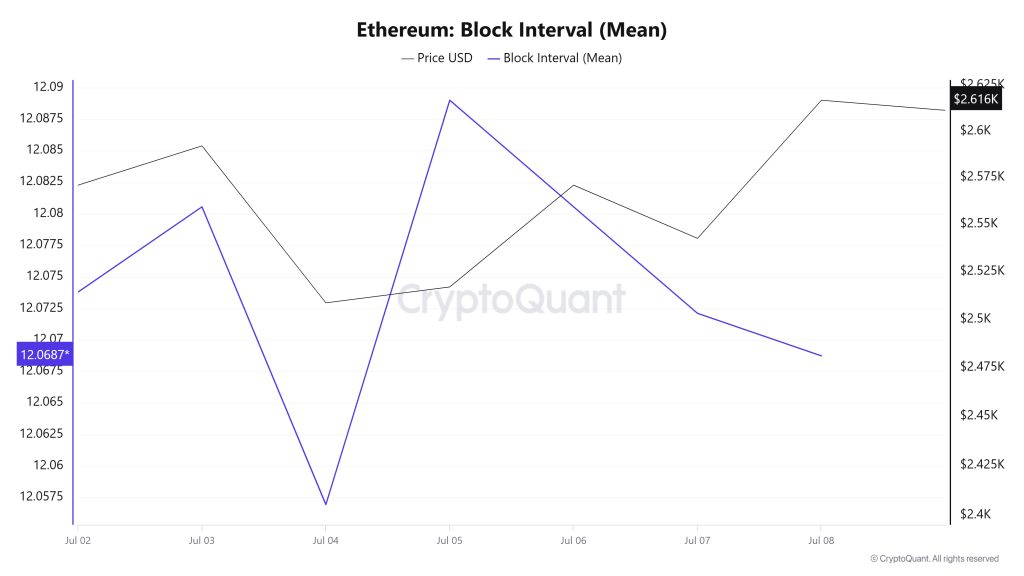
Between Juli 2 and Juli 8, Ethereum block data showed a slight decrease throughout the week. On Juli 2, the average block duration was recorded as 12.07 seconds, while it decreased to 12.06 seconds as of Juli 8.
During the period in question, Ethereum block duration and price movement were positively correlated throughout the week.
Transaktion
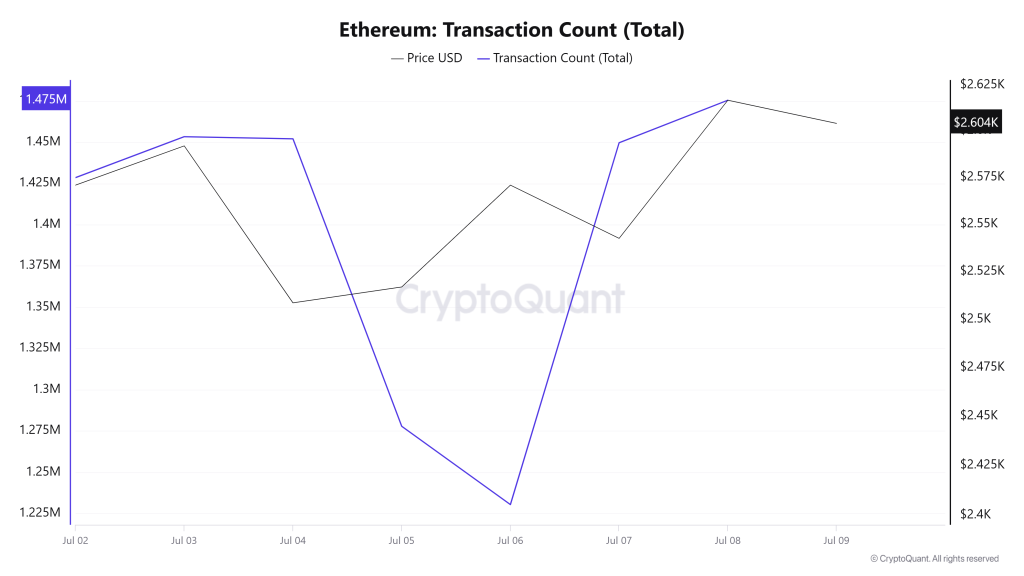
Last week, a total of 10,025,292 transactions were executed on the Ethereum network, while this week it decreased by about 2.58% to 9,767,021. The highest weekly transaction count was 1,475,362 on Juli 8, while the lowest was 1,230,437 on Juli 6.
The change in the number of transactions indicates that the utilization on the network has decreased compared to last week, and accordingly, Ethereum burns have also decreased compared to last week. The correlation between price and number of transactions was generally stable throughout the week.
Übertragene Wertmarken
While the total amount of ETH transferred on the Ethereum network last week was 10,201,279, it decreased by 8.48% to 9,335,529 this week. The 1,815,600 ETH transfer on Juli 3 was the highest daily token transfer amount of the week, while the lowest value of the week was recorded on Juli 6 with only 543,247 ETH transferred. Throughout the week, the relationship between price and tokens transferred showed a negative correlation.
The increase in the amount of transfers in the use of the network, as well as the decrease in the amount of tokens transferred, indicates that small-scale transaction amounts are on the rise. Avoiding large value transfers while increasing the number of transactions may imply market uncertainty or low risk appetite.
Geschätzter Verschuldungsgrad
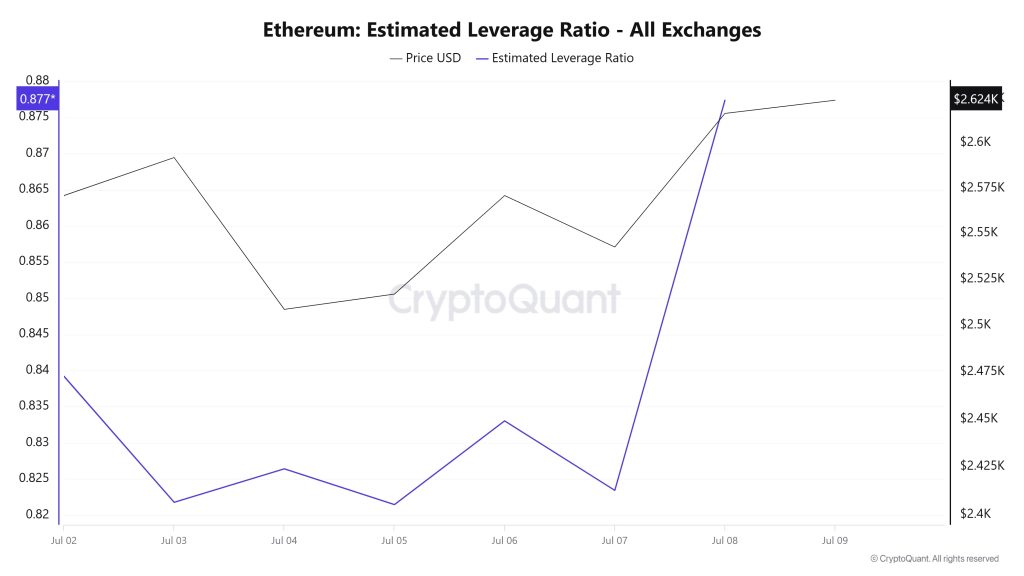
During the 7-day period, the metric generally declined during the first part of the process. ELR (Estimated Leverage Ratio), which had a value of 0.839 at the beginning of the process, reached 0.821 on Juli 5. This was also the low point of the process. The metric trended upwards after the rest of the process, reaching 0.877 at the time of writing, which is the peak of the process. A higher ELR means that participants are willing to take on more risk and generally indicates bullish conditions or expectations. It should be noted that these rises can also be caused by a decrease in reserves. When we look at Ethereum reserves, while there were 19.03 million reserves at the beginning of the process, this figure decreased during the rest of the process and is currently seen as 18.92 million. At the same time, Ethereum’s Open Interest is seen as 32.18 billion dollars at the beginning of the process. As of now, the volume has increased in the process and the open interest value stands out as 35.57 billion dollars. With all this data, the ELR metric has followed an upward trend since the middle of the process. The price of the asset, with all this data, was valued at $ 2,647 at the top of the process, while the lowest point was realized at $ 2,426. At the time of writing, the increase in the risk appetite of investors and traders continues. The fact that the ELR ratio has increased along with the decline in reserves throughout the process indicates that the open interest has increased. As a result, as a result of the decrease in reserves and the increase in open interest, it shows that the market is currently in an appetitive approach.
ETH Onchain Insgesamt
| Metrisch | Aufstehen 📈. | Niedergang 📉 | Neutral ➖ |
|---|---|---|---|
| Aktive Adressen | ✓ | ||
| Eingesetzter Gesamtwert | ✓ | ||
| Derivate | ✓ | ||
| Versorgung Verteilung | ✓ | ||
| Währungsreserve | ✓ | ||
| Gebühren und Einnahmen | ✓ | ||
| Blöcke abgebaut | ✓ | ||
| Transaktion | ✓ | ||
| Geschätzter Verschuldungsgrad | ✓ |
*The metrics and guidance in the table do not, by themselves, describe or imply an expectation of future price changes for any asset. The prices of digital assets may vary depending on many different variables. The onchain analysis and related guidance are intended to assist investors in their decision-making process, and making financial investments based solely on the results of this analysis may result in harmful transactions. Even if all metrics produce a bullish, bearish or neutral result at the same time, the expected results may not be seen depending on market conditions. Investors reviewing the report would be well advised to heed these caveats.
Rechtlicher Hinweis
Die in diesem Dokument enthaltenen Anlageinformationen, Kommentare und Empfehlungen stellen keine Anlageberatungsdienste dar. Die Anlageberatung wird von zugelassenen Instituten auf persönlicher Basis unter Berücksichtigung der Risiko- und Ertragspräferenzen des Einzelnen durchgeführt. Die in diesem Dokument enthaltenen Kommentare und Empfehlungen sind allgemeiner Art. Diese Empfehlungen sind möglicherweise nicht für Ihre finanzielle Situation und Ihre Risiko- und Renditepräferenzen geeignet. Eine Anlageentscheidung, die ausschließlich auf der Grundlage der in diesem Dokument enthaltenen Informationen getroffen wird, kann daher möglicherweise nicht zu Ergebnissen führen, die mit Ihren Erwartungen übereinstimmen.
NOTE: All data used in Ethereum onchain analysis is based on Cryptoqaunt.

