
Technische Analyse
BTC/USDT
It’s the start of an eventful week in US politics and the crypto market. As the Senate prepares to vote on the “great and beautiful” bill supported by Trump on Juni 30, the outcome of this critical step may be announced on the same day or on the morning of Juli 1. President Trump also took a clear stance on tariffs, stating that they will not extend the 90-day exemption period and announced that high tariffs will be imposed on countries that cannot reach an agreement. Trump also stated that he is looking for more compatible names for the Fed chairmanship and that his interest in Kevin Warsh has diminished.
On the crypto front, Michael Saylor brought BTC purchases back to the agenda, while Metaplanet bought another 1,005 BTC, increasing its reserve to 13,350. From Europe, The Blockchain Group and Vaultz Capital also strengthened their treasury strategies by increasing their BTC holdings.
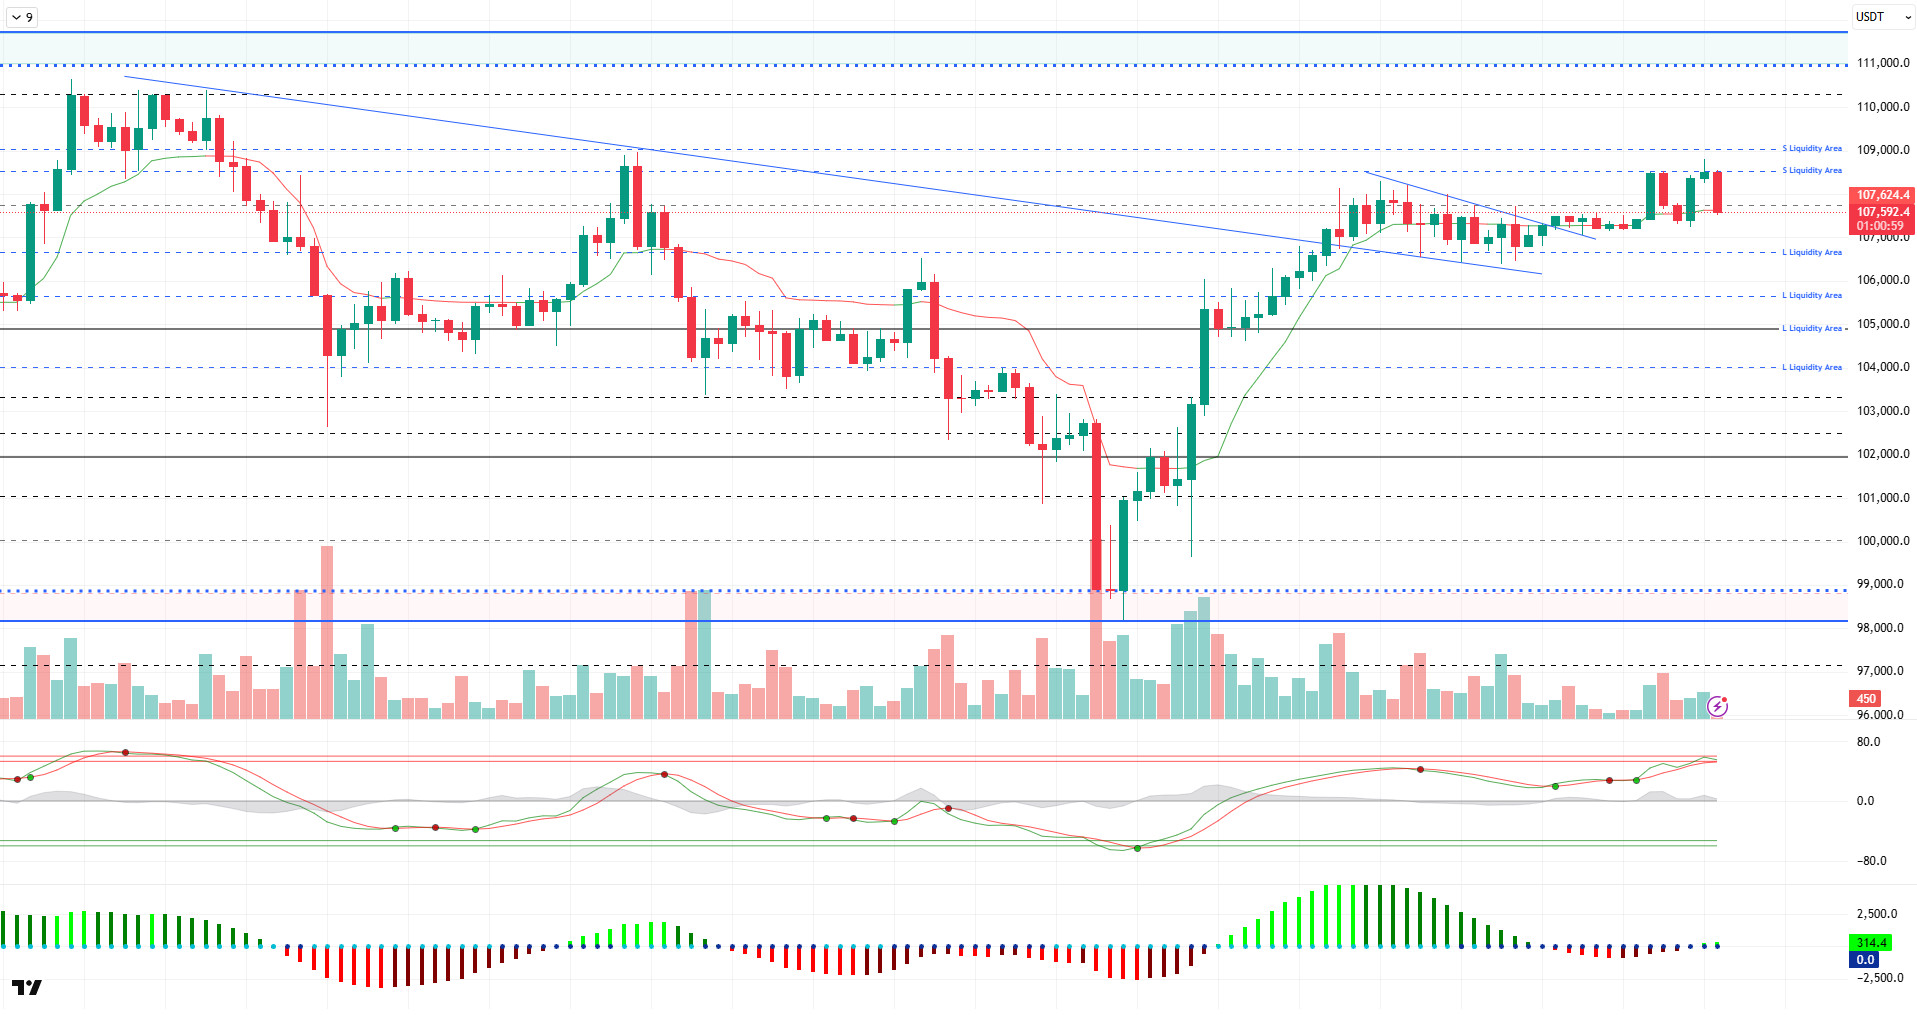
Looking at the technical outlook after the weekend, BTC held on to the 109,000 level as it continued to build on its gains. At the time of writing, BTC continues to trade at 107,800.
On the technical indicators front, the Wave Trend (WT) oscillator was indecisive near the overbuy zone, while the histogram on the Squeeze Momentum (SM) indicator moved back to the positive zone after a brief transition to the negative zone. On the other hand, there was no significant risk appetite and volatility declined with low volume. Kaufman moving average is at 107,700 in line with the price.
When the liquidity data is analyzed, short-term buy and sell trades have started to reappear, while the selling level has been somewhat liquidated at 109,000, while the buying levels are in a wide band range between 103,000 and 107,000.
All in all, the positive scenario created by fundamental developments stood out as a positive factor in terms of pricing, followed by a weakening of momentum and BTC’s consolidation phase. In addition to the weakening in technicals, the weight of buy trades in liquidity data is noteworthy. In the event that the price buys liquidity in a negative scenario, 105,500 – 105,000 will be followed as a support band. On the other hand, if the price exceeds the 109,000 level, it will continue to be followed as a critical point for new ATH levels.
Unterstützt 106.000 - 105.000 - 103.300
Resistenzen 107.300 - 109.000 - 110.000
ETH/USDT
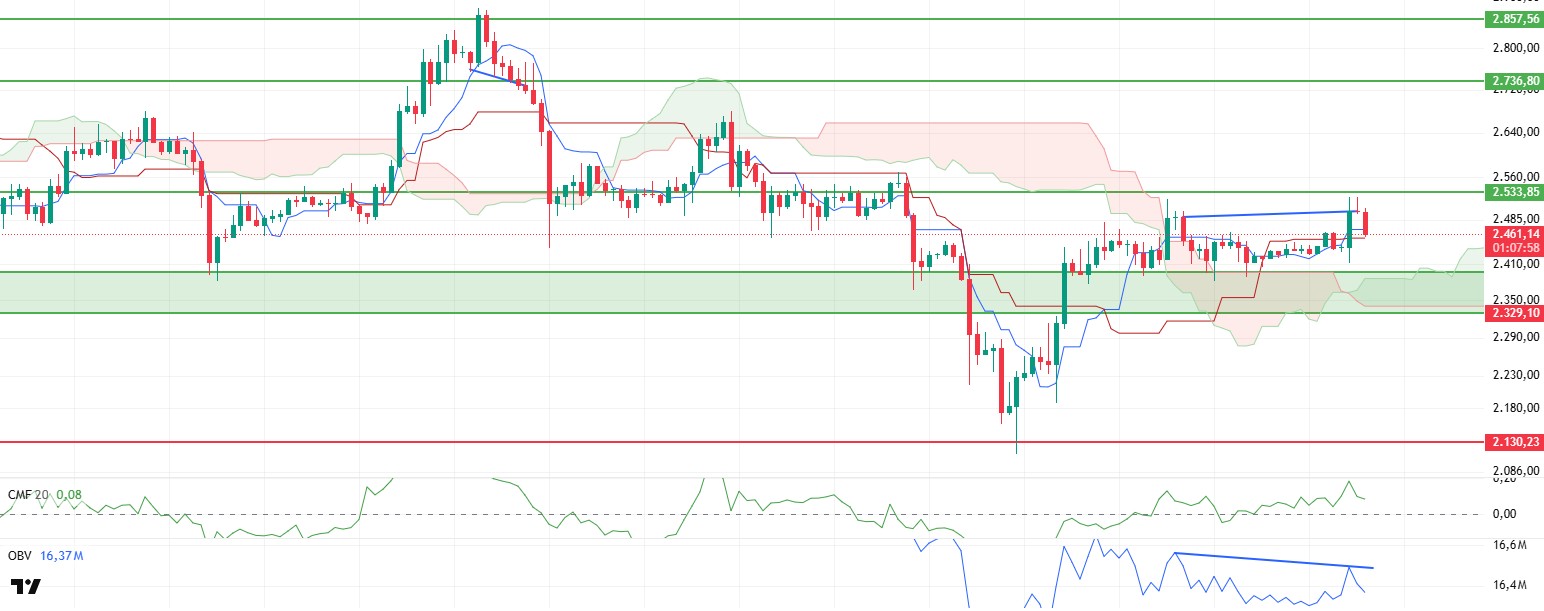
ETH managed to rise above the $2,500 level yesterday evening with increased purchases. After the rise, the price experienced a slight retracement with selling pressure from the critical resistance zone at $2,533, but the overall technical and on-chain indicators seem to maintain their positive trend.
Analyzing spot market data, Cumulative Volume Delta (CVD) shows that buyers remain strong despite the pullbacks. This data indicates that demand in the spot market continues despite the price decline. On the futures side, the decline in open interest data is noteworthy. On the other hand, the funding rate remained high, suggesting that this pullback was mostly due to the closure of long positions rather than aggressive short positioning.
From the perspective of the Ichimoku indicator, the fact that the price remains above both the kumo cloud and the tenkan and kijun levels indicates that the current positive trend continues. In addition, the fact that the tenkan level crosses the kijun level upwards can be considered as a signal that the upward momentum may continue in the short term. This intersection is a technical confirmation that the trend is gaining strength.
Chaikin Money Flow (CMF) has retreated slightly, accompanied by profit selling after crossing into positive territory with the recent rise. However, the fact that it still remains in positive territory continues to show that net money inflows to the market continue and buyers are generally dominant.
On the other hand, the negative divergence in On Balance Volume (OBV) data draws attention. Despite the upward movement of the price, the fact that OBV does not accompany this movement indicates an uptrend that is not supported by volume. This kind of negative divergence is an important warning that the uptrend may be unhealthy and there is a risk of a correction in the short term. In this context, the possibility of a pullback to the kijun level in the short term should be considered.
As a result, both technical and on-chain indicators are currently generating positive signals. As long as the kijun level of $2,455 remains above the $2,455 level, upside movements in the ETH price can be expected to continue. However, the weakness in OBV should not be ignored; if the price remains under pressure and the kijun level is breached to the downside, this could trigger a deeper correction that could last as low as $2,400.
Anfang des Formulars
Unterhalb des Formulars
Unterstützt 2,329 - 2,130 - 2,029
Resistenzen 2,533 - 2,736 - 2,857
XRP/USDT
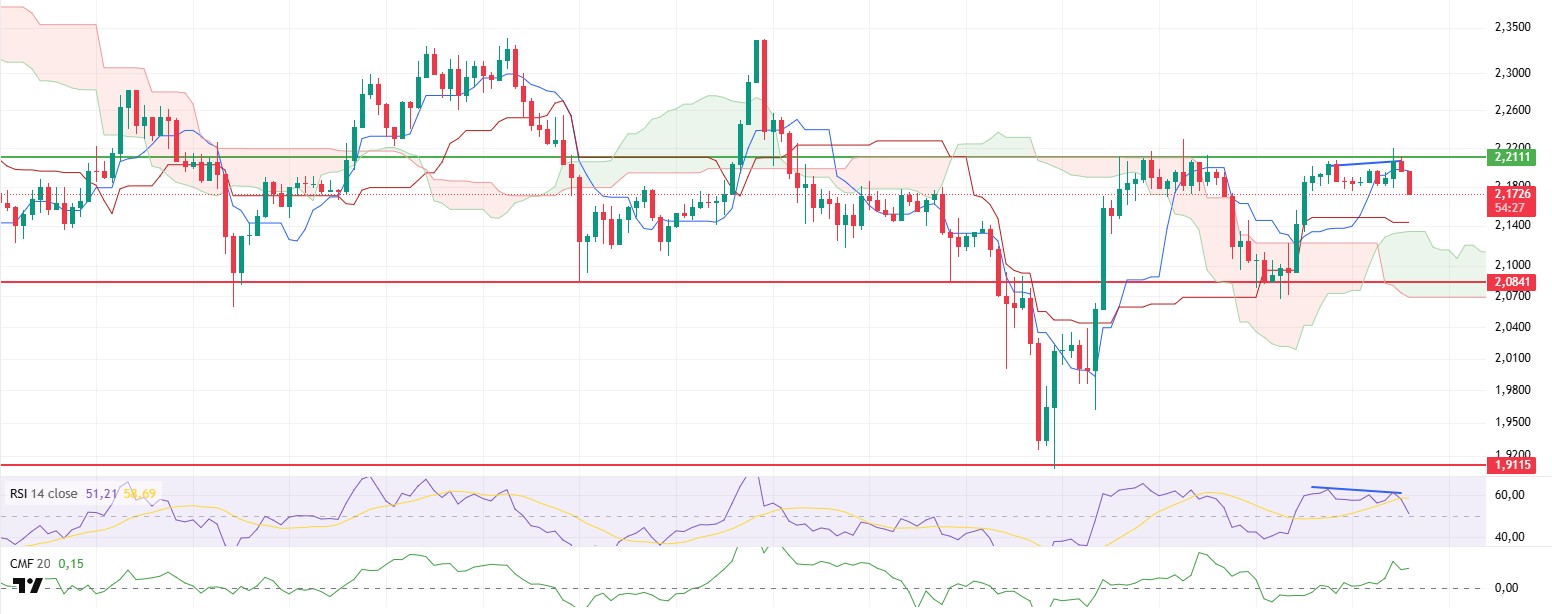
XRP price, after managing to maintain the critical support zone at $2.08 as of Freitag, entered a recovery trend and rose to the resistance point at $2.21. However, with the lack of buyers in this region, the price, which came under selling pressure again, is currently balanced at $2.18.
Analyzing the technical indicators, it is seen that the Chaikin Money Flow (CMF) indicator remains in positive territory and continues its upward trend. This outlook suggests that liquidity inflows to the market are still strong and the buy side remains in control. CMF’s stabilization in the positive zone is considered as an important signal that the uptrend is technically supported.
In terms of the Ichimoku indicator, a positive technical structure is also evident. The fact that the price remains above the kumo cloud confirms that the market is still moving in an uptrend. In addition, the tenkan level crosses the kijun level upwards, indicating that momentum continues to favor buyers in the short term. This technical intersection is an important support for the continuation of the positive trend.
On the other hand, the Relative Strength Index (RSI) indicator displays a structure that is incompatible with the price. On the RSI side, a structure that does not accompany the recent upward movement is observed. This increases the risk that the price will remain under pressure in the short term and raises questions about the sustainability of the upward movement.
Overall, the technical indicators present a largely positive picture, but given the negative divergence in the RSI and the slowdown in current price behavior, the risk of a new pullback in the short term remains on the agenda. In this scenario, the upper band of the sand cloud at $2.13 is the first important support. If this level is broken downwards, the possibility of the price retreating back to the main support point at the $2.08 level may increase.
Unterstützt 2,0841 - 1,9115 - 1,7226
Widerstände 2,2111 - 2,3928 - 2,5900
SOL/USDT
Firedancer starts transferring shares to Solana validators. The Solana-based memecoin launchpad is rolling out mobile compatibility for iOS and Android devices ahead of the token launch.
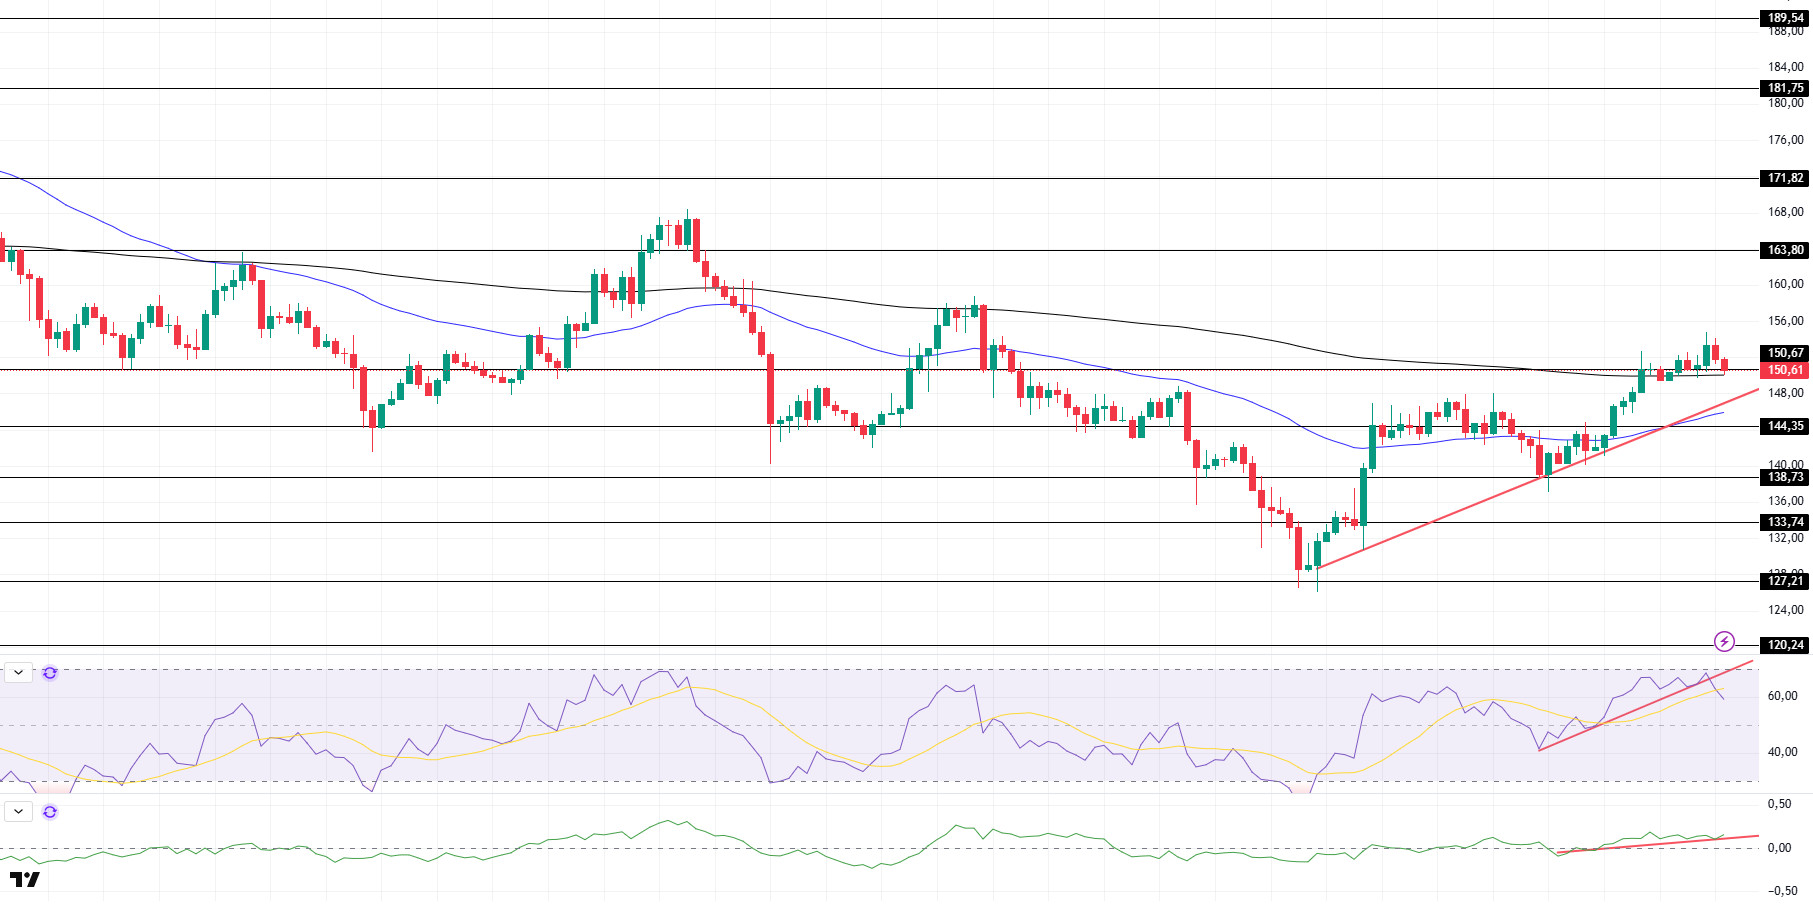
SOL price continues to be bullish. The asset has managed to break above the 200 EMA (Black Line) moving average to the upside, which is a place of strong resistance. It is currently testing this moving average as support. If it continues to stay above the moving average, the $ 163.80 level should be followed. On candle closes below the 200 EMA moving average, the support level of the uptrend that started on Juni 22 should be followed.
On the 4-hour chart, the 50 EMA continued to be below the 200 EMA. This suggests that the bearish trend may continue in the medium term. At the same time, the fact that the price is above both moving averages suggests that the market is currently bullish in the short term. Chaikin Money Flow (CMF-20) has crossed into positive territory; in addition, the decline in inflows may move CMF back into negative territory. At the same time, it remains above the uptrend that started on Juni 27. Relative Strength Index (RSI-14) is at positive levels. On the other hand, it has broken the uptrend that started on Juni 26 to the downside. This may bring a decline. In case of an uptrend due to macroeconomic data or positive news on the Solana ecosystem, the $163.80 level stands out as a strong resistance point. If this level is broken upwards, the rise can be expected to continue. If there are pullbacks due to contrary developments or profit realizations , the $ 144.35 level can be tested. In case of a decline to these support levels, the increase in buying momentum may offer a potential bullish opportunity.
Unterstützt 150,67 - 144,35 - 138,73
Resistenzen 163.80 - 171.82 - 181.75
DOGE/USDT
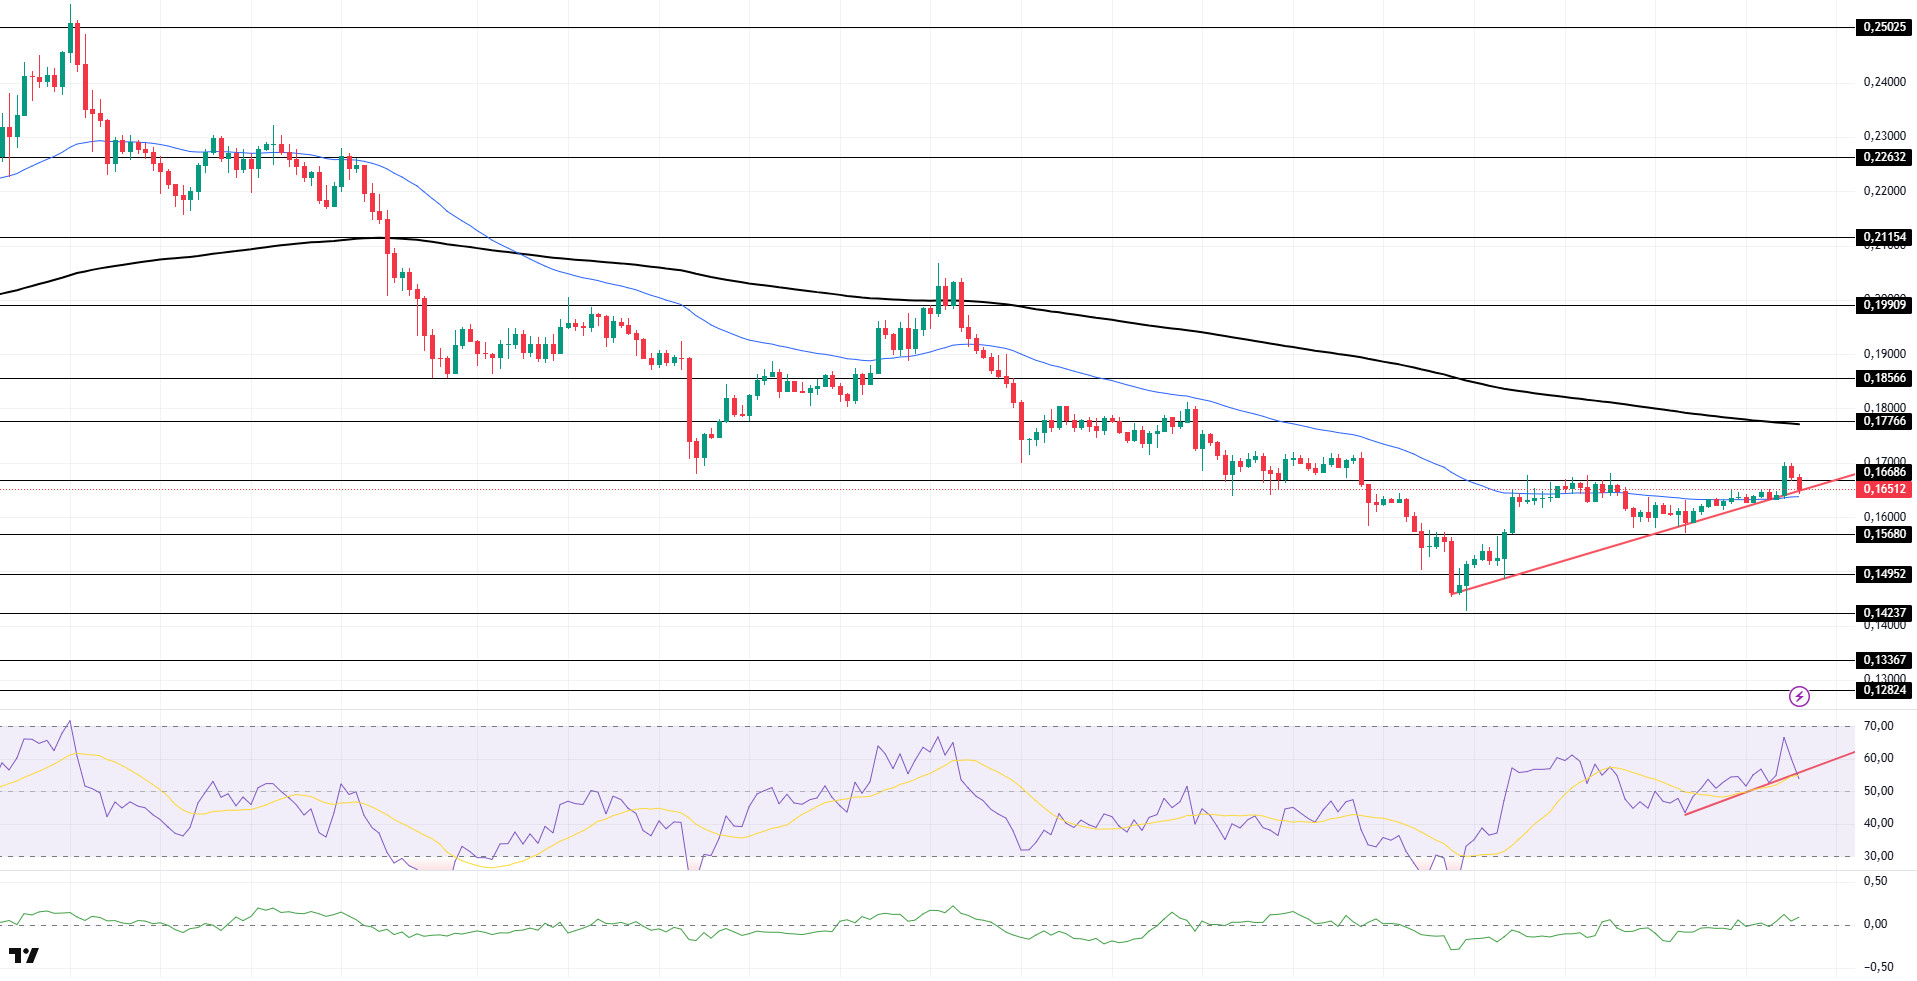
The DOGE price has been on the rise. Supported by the uptrend that started on Juni 22 and the 50 EMA moving average, the asset broke the strong resistance at $0.16686 and managed to stay above it. It is currently testing the uptrend as support. It may test the $0.15680 level on candle closes below this support level. If the price continues to rise, the $0.17766 level should be followed as a strong resistance place.
On the 4-hour chart, the 50 EMA (Blue Line) continues to be below the 200 EMA (Black Line). This suggests that the asset is bearish in the medium term. The fact that the price is between two moving averages indicates that the asset is in the decision phase in the short term. On the other hand, a large gap between the two moving averages may cause the price to move sideways or bullish. Chaikin Money Flow (CMF-20) crossed into positive territory. In addition, negative money inflows may move CMF into negative territory. Relative Strength Index (RSI-14) moved into positive territory. However, it remains above the uptrend that started on Juni 27. This may ensure a continuation of the uptrend. The $0.17766 level stands out as a strong resistance zone in the uptrend in line with political developments, macroeconomic data or positive news flow in the DOGE ecosystem. In the opposite case or possible negative news flow, the $0.15680 level may be triggered. In case of a decline to these levels, the momentum may increase and a new bullish wave may start.
Unterstützt 0,16686 - 0,15680 - 0,14952
Resistenzen 0,17766 - 0,18566 - 0,19909
Rechtlicher Hinweis
Die hier enthaltenen Anlageinformationen, Kommentare und Empfehlungen stellen keine Anlageberatung dar. Die Anlageberatung erfolgt individuell durch autorisierte Institutionen unter Berücksichtigung der Risiko- und Ertragspräferenzen des Einzelnen. Die hierin enthaltenen Kommentare und Empfehlungen sind allgemeiner Natur. Diese Empfehlungen sind möglicherweise nicht für Ihre finanzielle Situation und Ihre Risiko- und Renditepräferenzen geeignet. Daher kann es sein, dass eine Anlageentscheidung, die ausschließlich auf den hierin enthaltenen Informationen beruht, nicht zu Ergebnissen führt, die Ihren Erwartungen entsprechen.