
Active Addresses
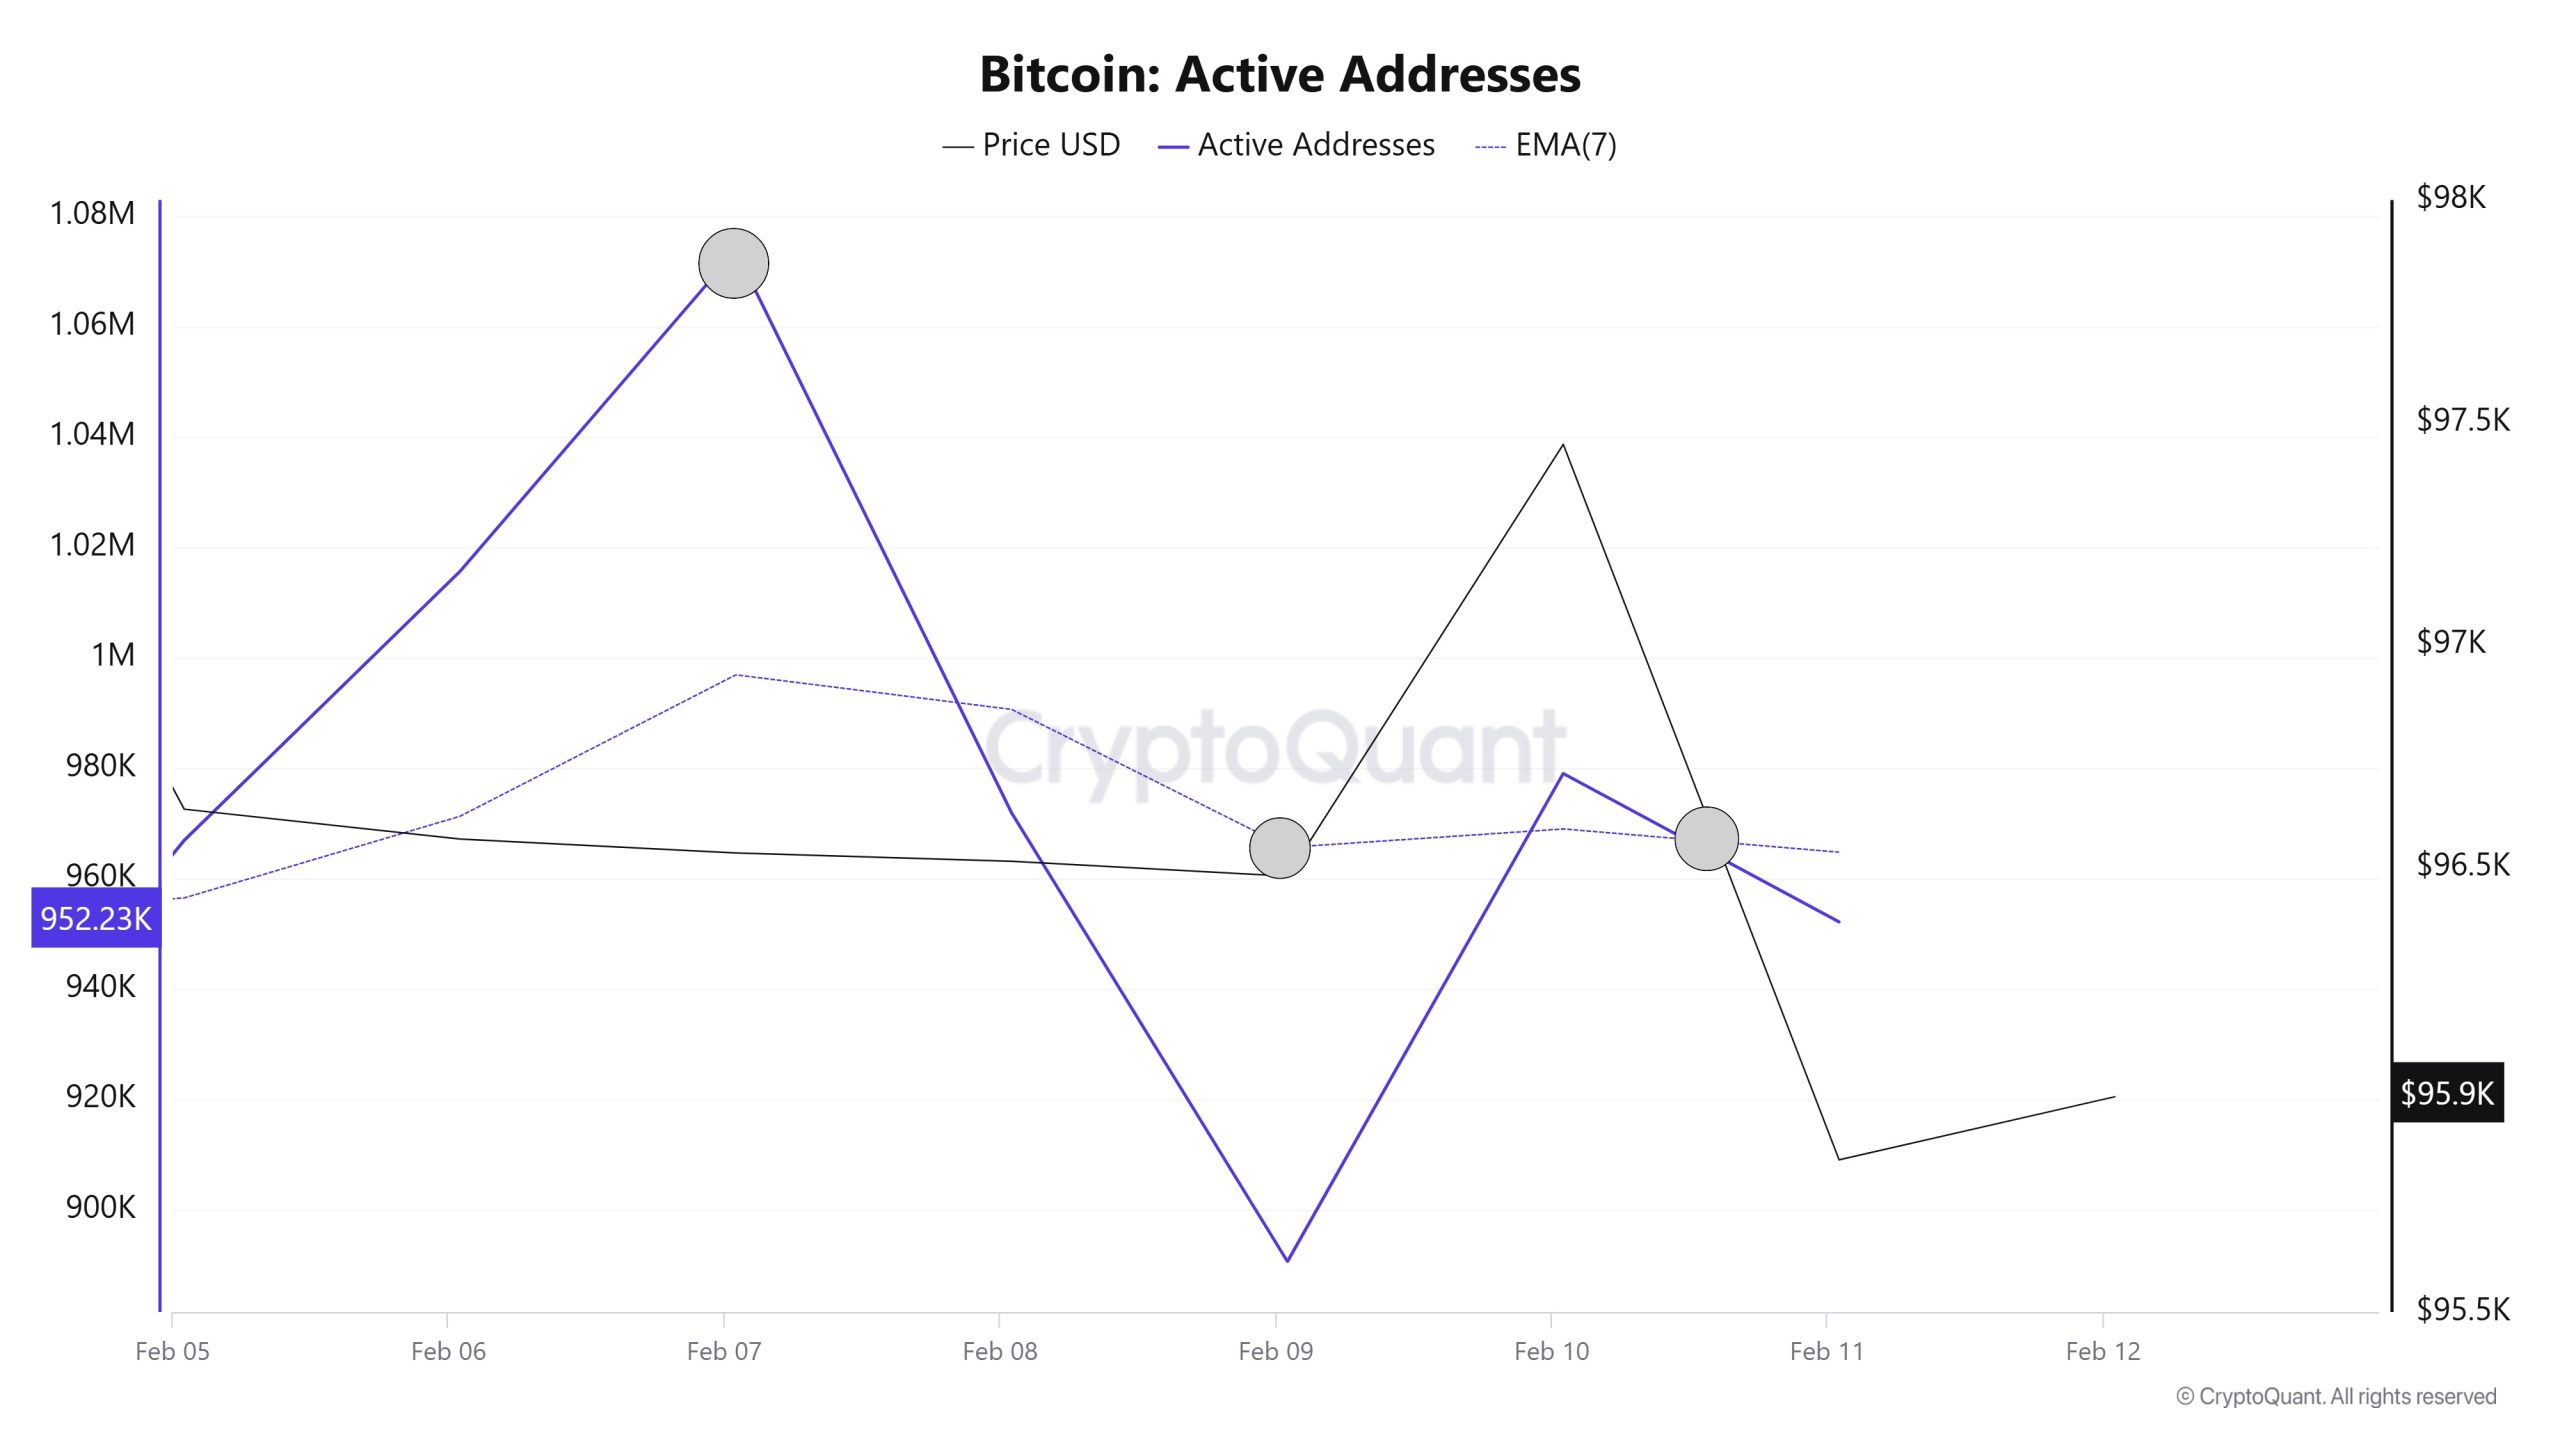
In the number of active addresses, 1,073,850 entries were made to the exchanges between 3 Februar and 12 Februar 2025 this week. In the said date range, Bitcoin rose from 94,000 to 101,000. We see that Bitcoin purchases are accelerating in the region where the number of active addresses, which is the highest number of active addresses since the first days of Februar, and where the addresses ready to trade intersect the price and the number of active addresses in the region marked on the chart. When we follow the 7-day simple moving average, it is observed that the price follows a downward trend on the dates when this average cut the price. Bitcoin reached 964,867 in correlation with the active address EMA (7). This situation indicates that the Bitcoin price experienced entries at $ 97,000 levels and exited at $ 95,000 levels.
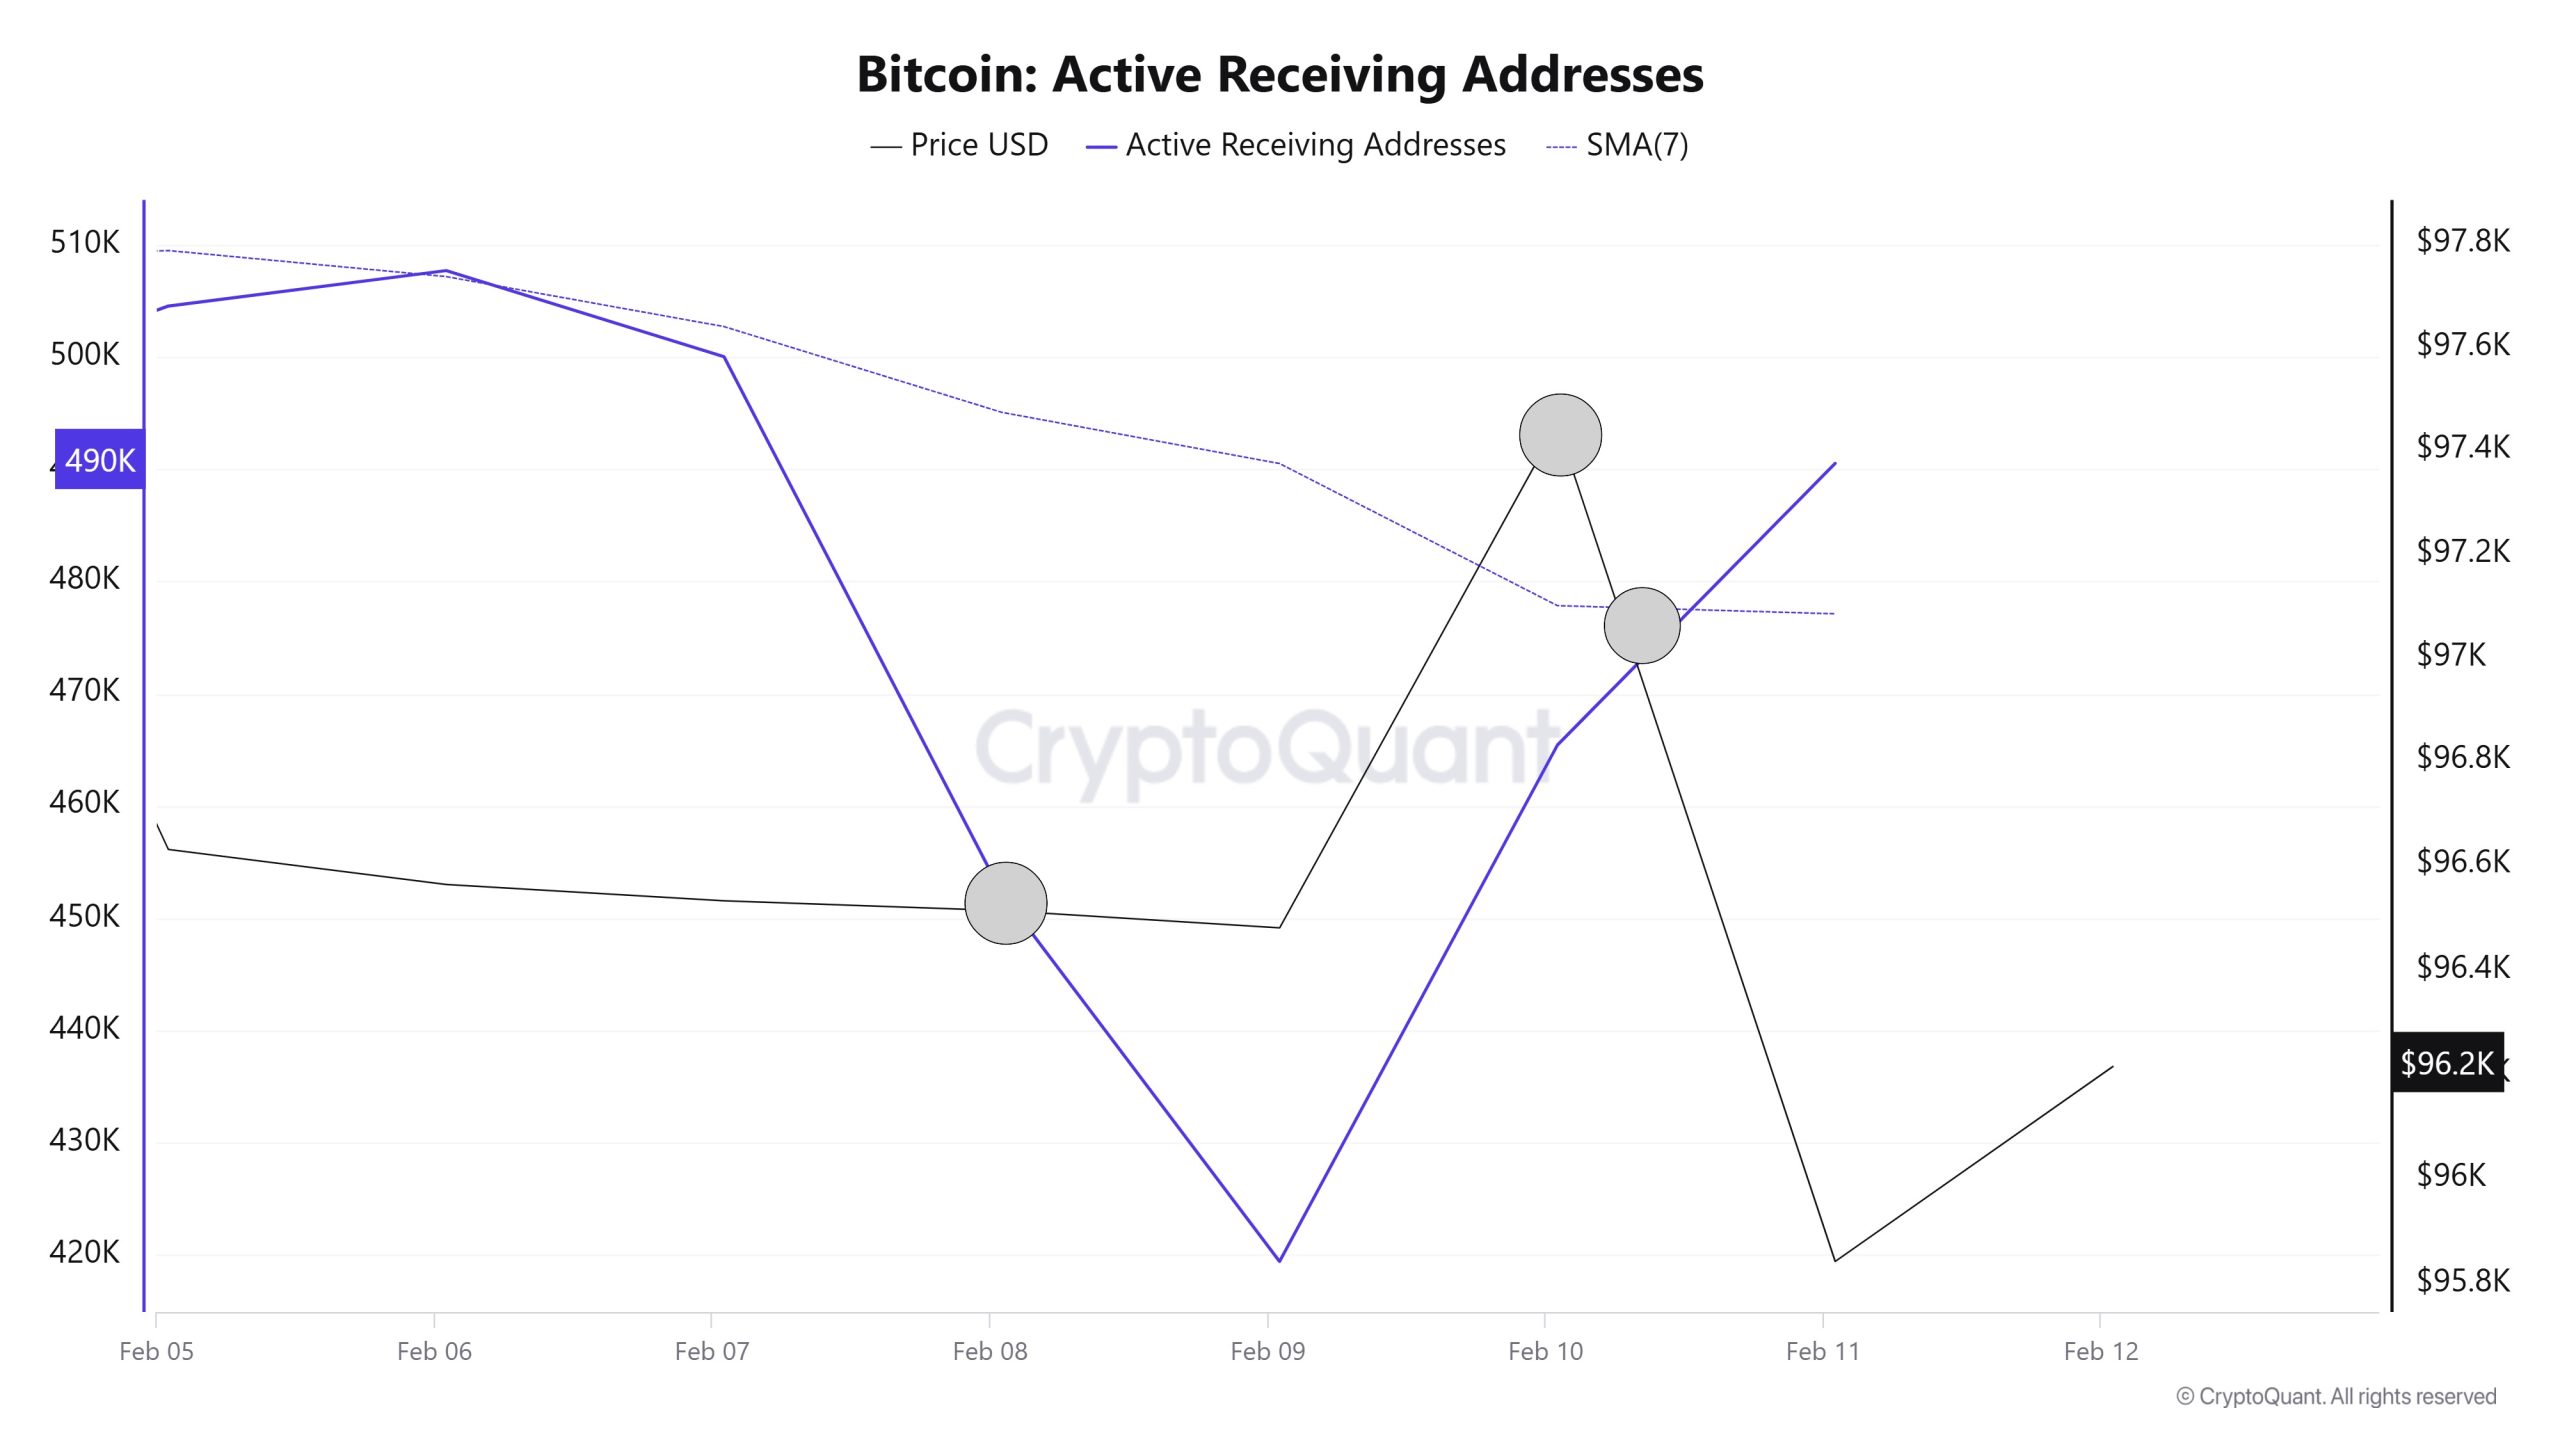
On the Active Receiving Addresses, it is seen that on Februar 10, when the price was 97,000, the number of buyers approached the highest levels of 465,414 and the longest buying was at the level where investors went to increase their Bitcoin positions. However, it is noteworthy that the SMA (7-Day) is close to changing the trend direction (entering the bullish zone) at the intersection with the price at 465.414.
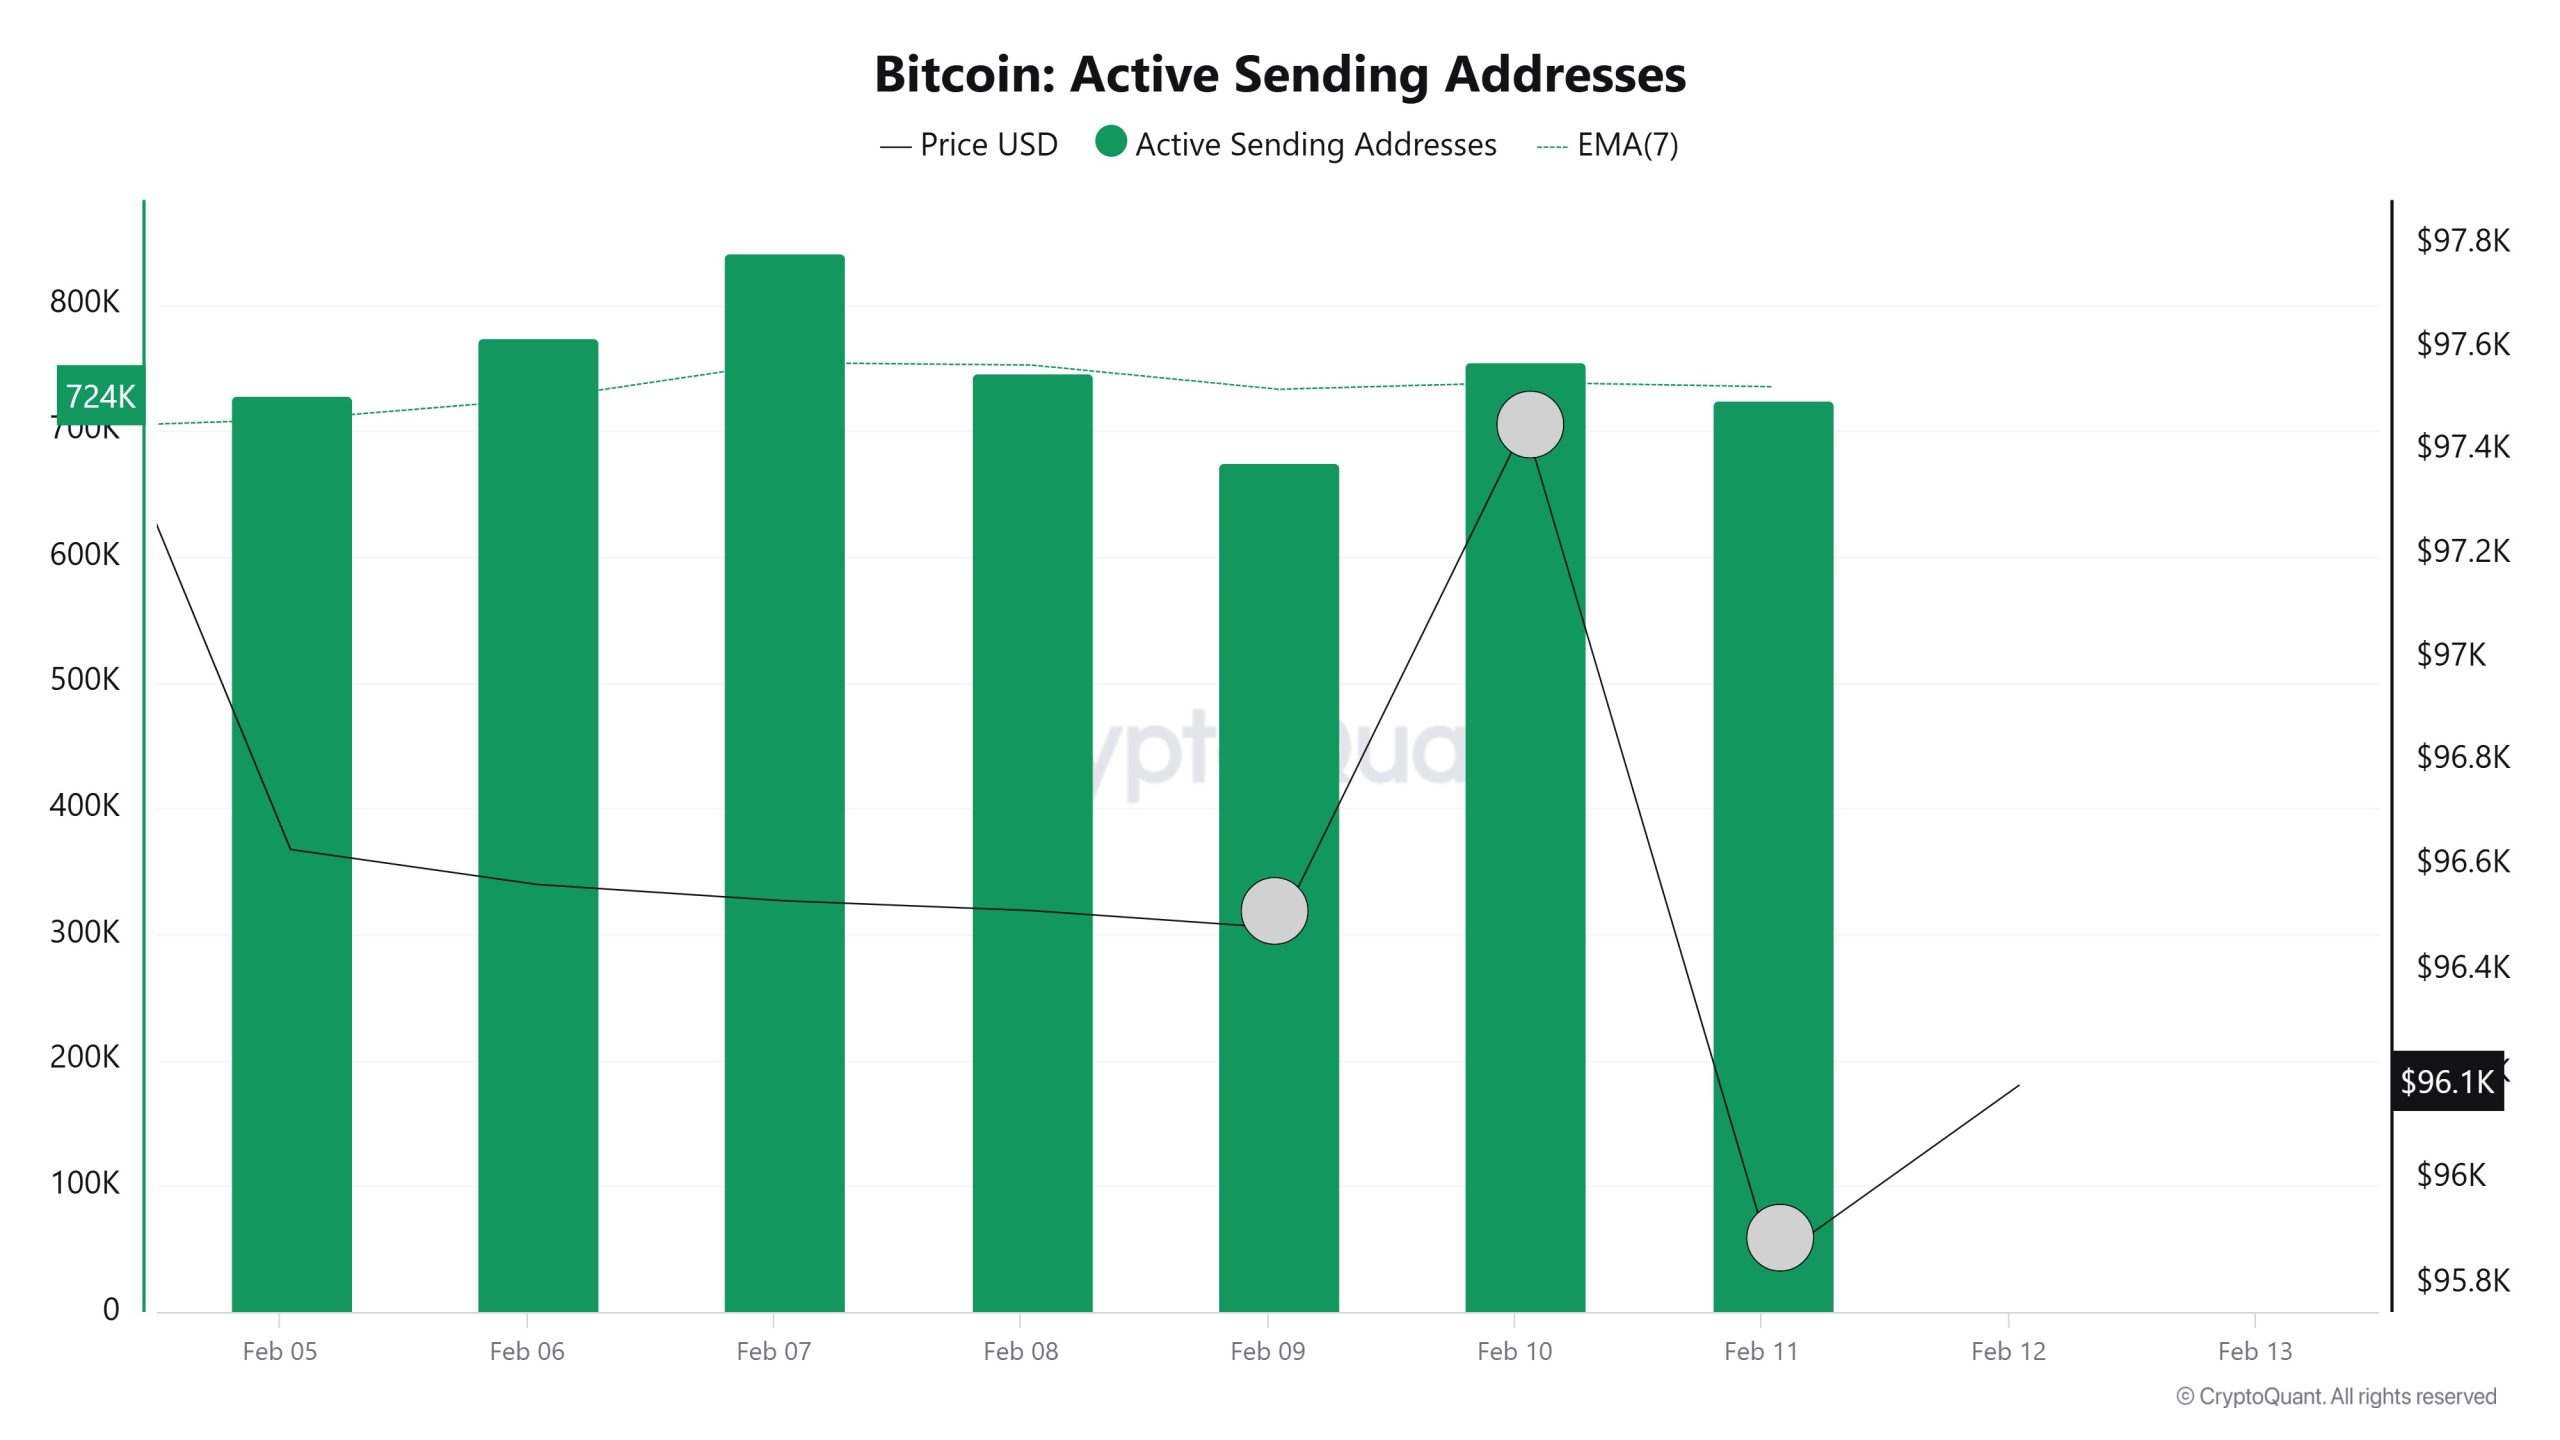
On the exits, there was a significant increase in active shipping addresses towards Februar 11, along with the Black Line (price line). On the day of the price peak, active shipping addresses rose as high as 754,825, indicating that buyers sold their positions as Bitcoin stayed around the 95,000 level for a while. The average of 738,471 active addresses may indicate that the market is falling and investors are selling out of fear.
Breakdowns
MRVR
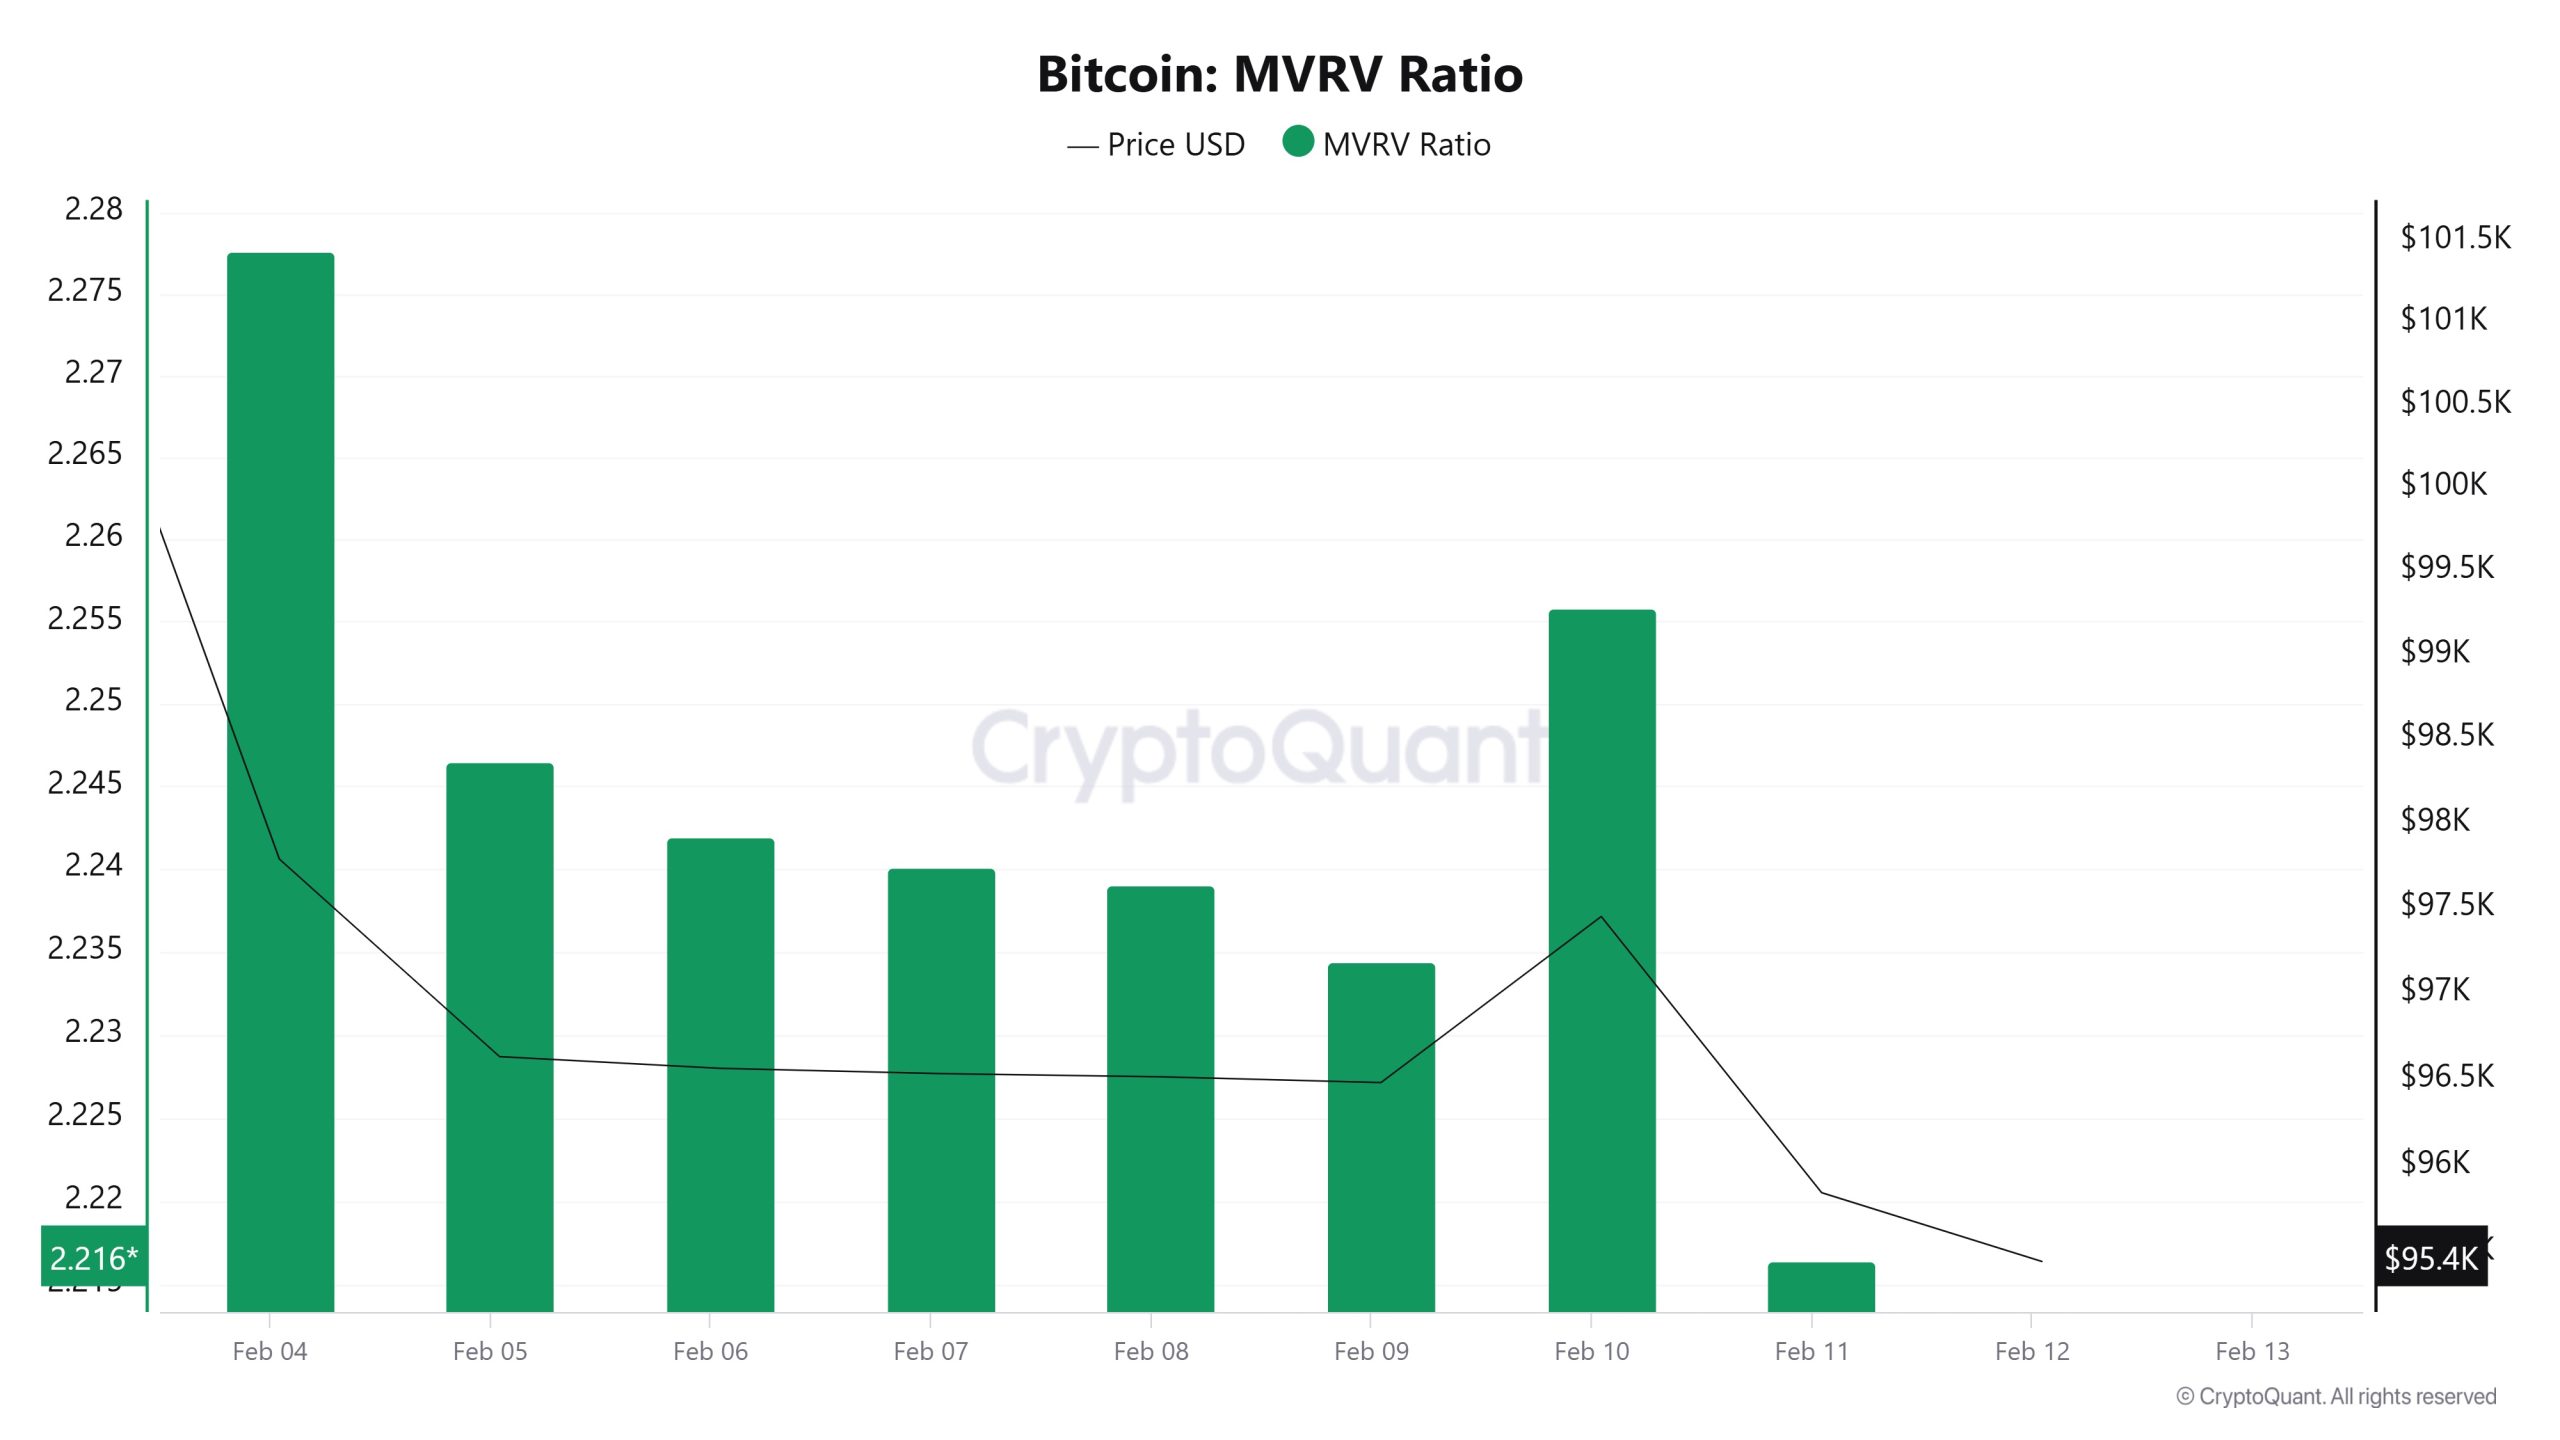
On 5 Februar, Bitcoin price was 96,630 while MVRV Ratio was 2.24. As of 11 Februar, Bitcoin price decreased to 95,842 while MVRV Ratio decreased to 2.21. Compared to last week, Bitcoin price decreased by 0.82% and MVRV Ratio decreased by 1.34%.
Realized Price
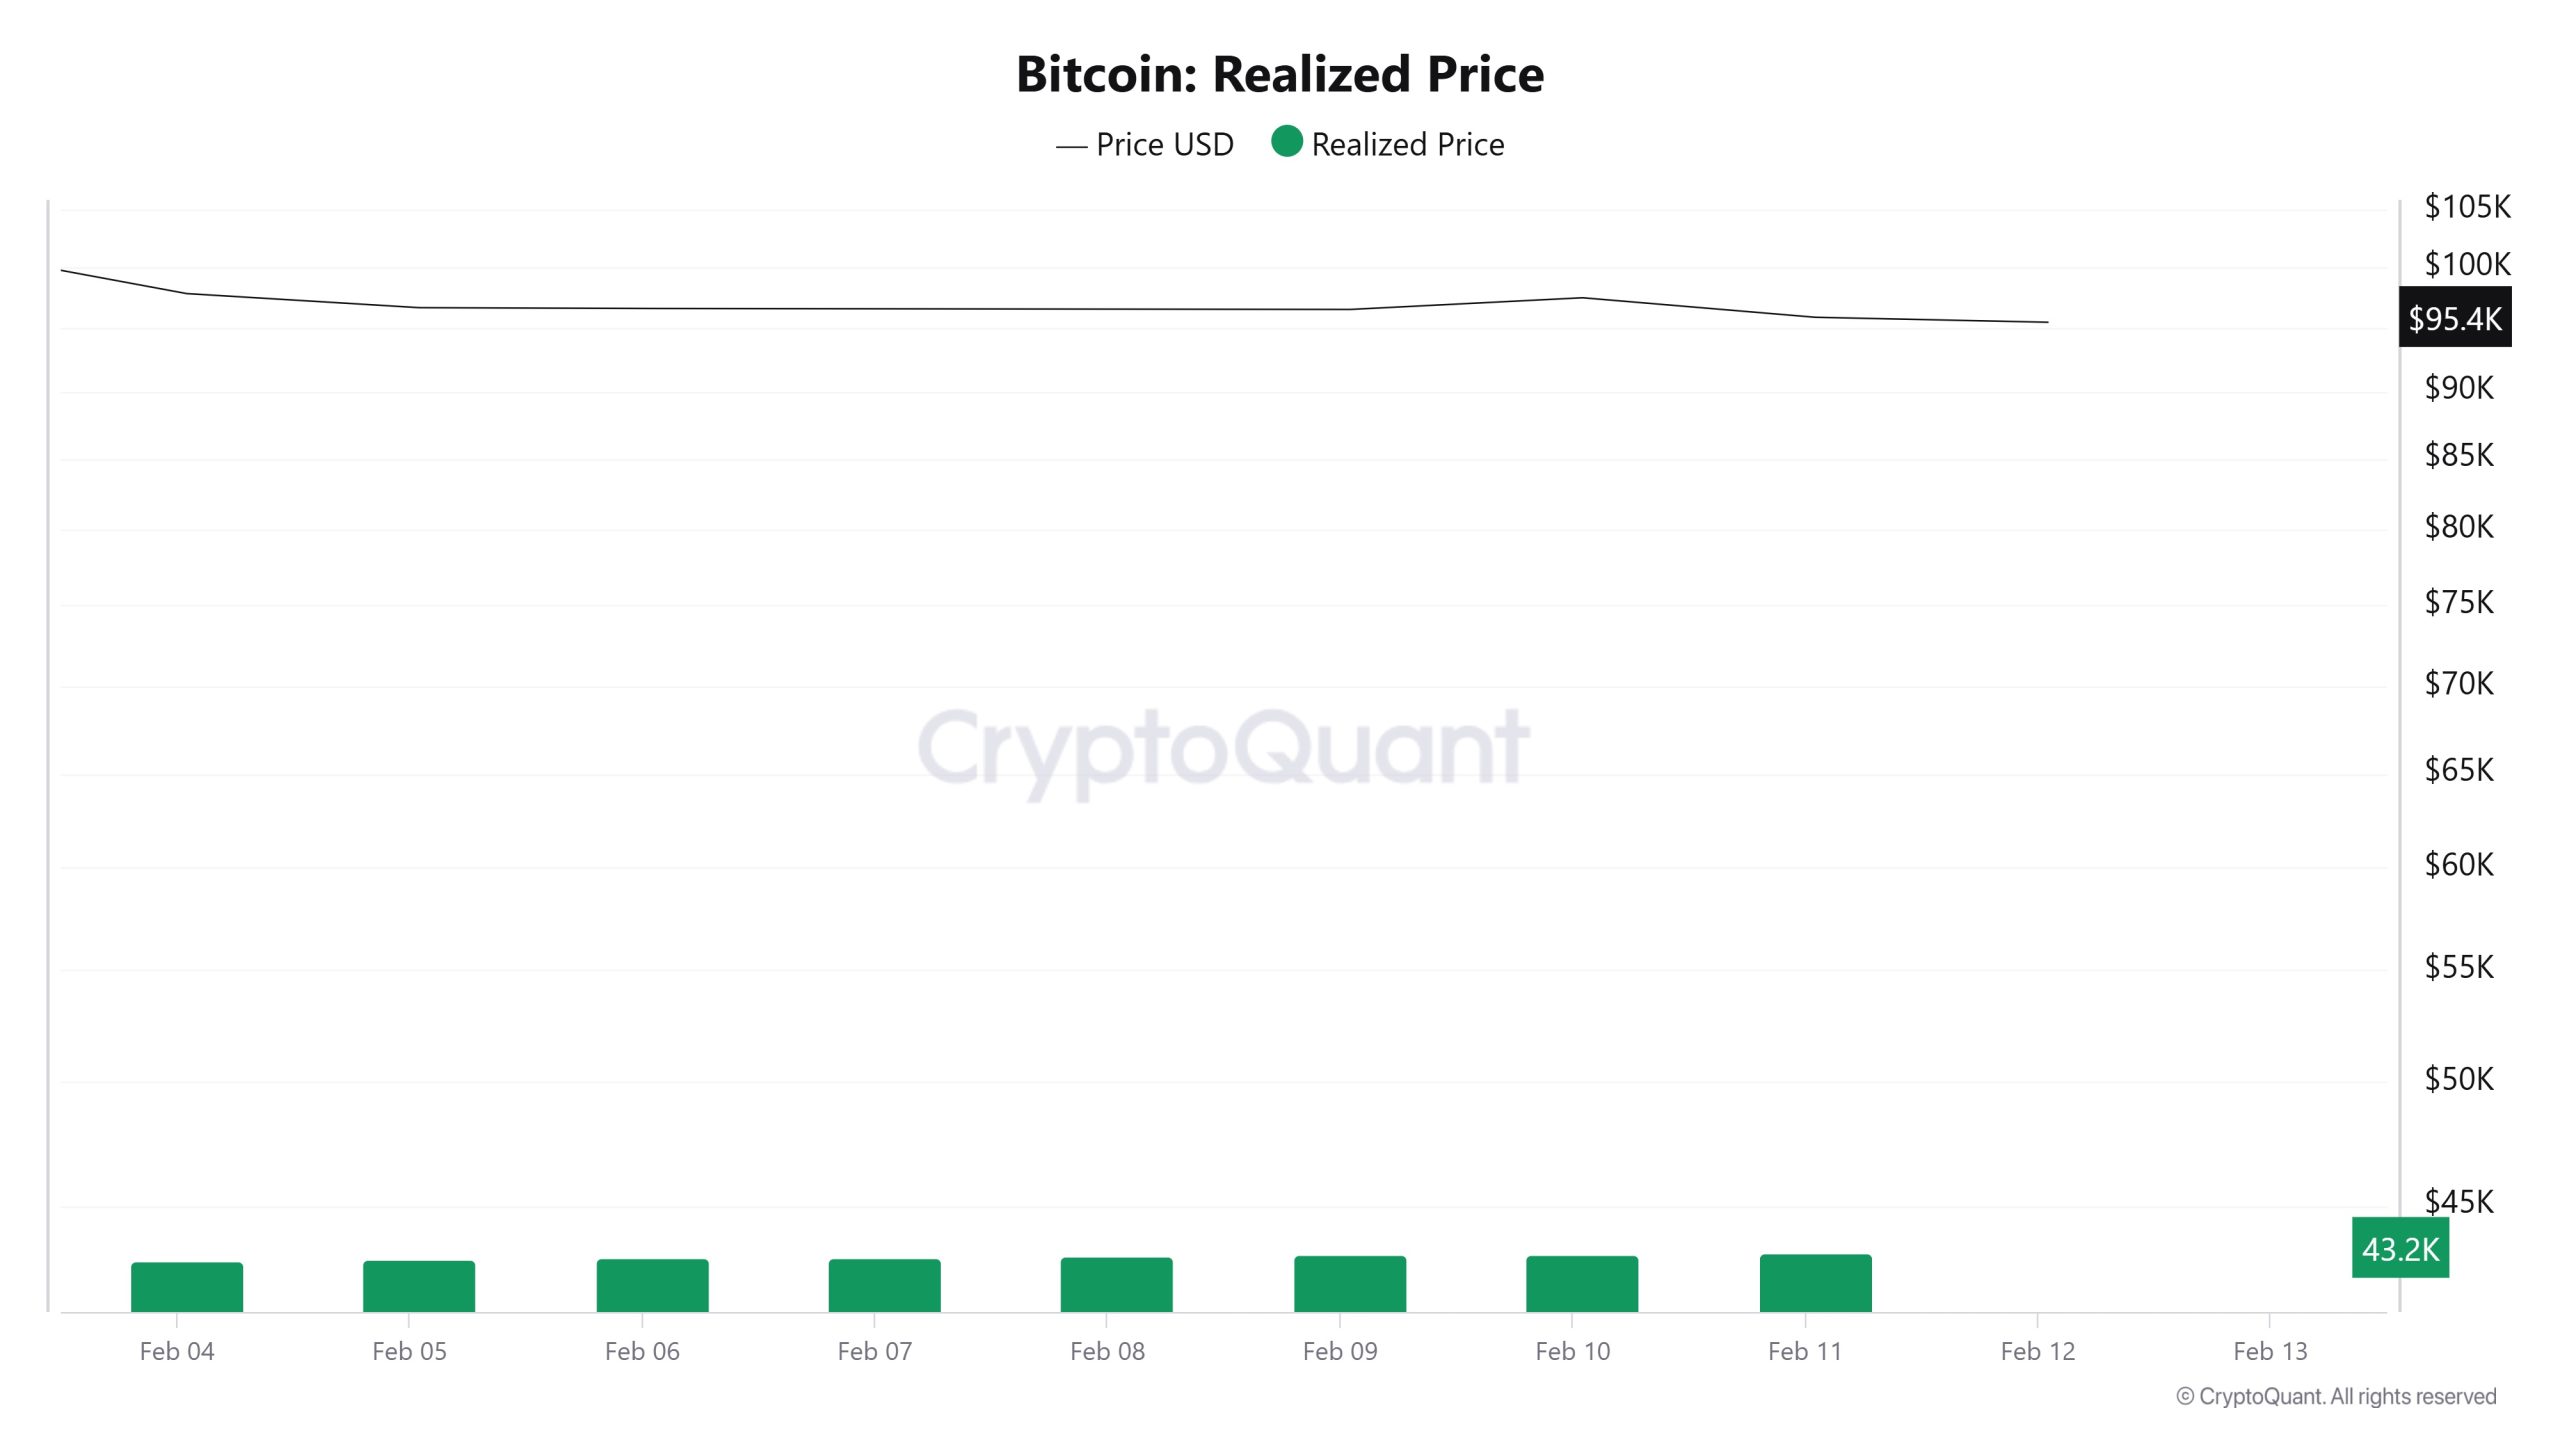
On Februar 5, the Bitcoin price was 96,630 while the Realized Price was 43,014. As of Februar 11, the Bitcoin price was down to 95,842 while the Realized Price was 43,242. Compared to last week, the Bitcoin price decreased by 0.82% while the Realized Price increased by 0.53%.
Spent Output Profit Ratio (SOPR)
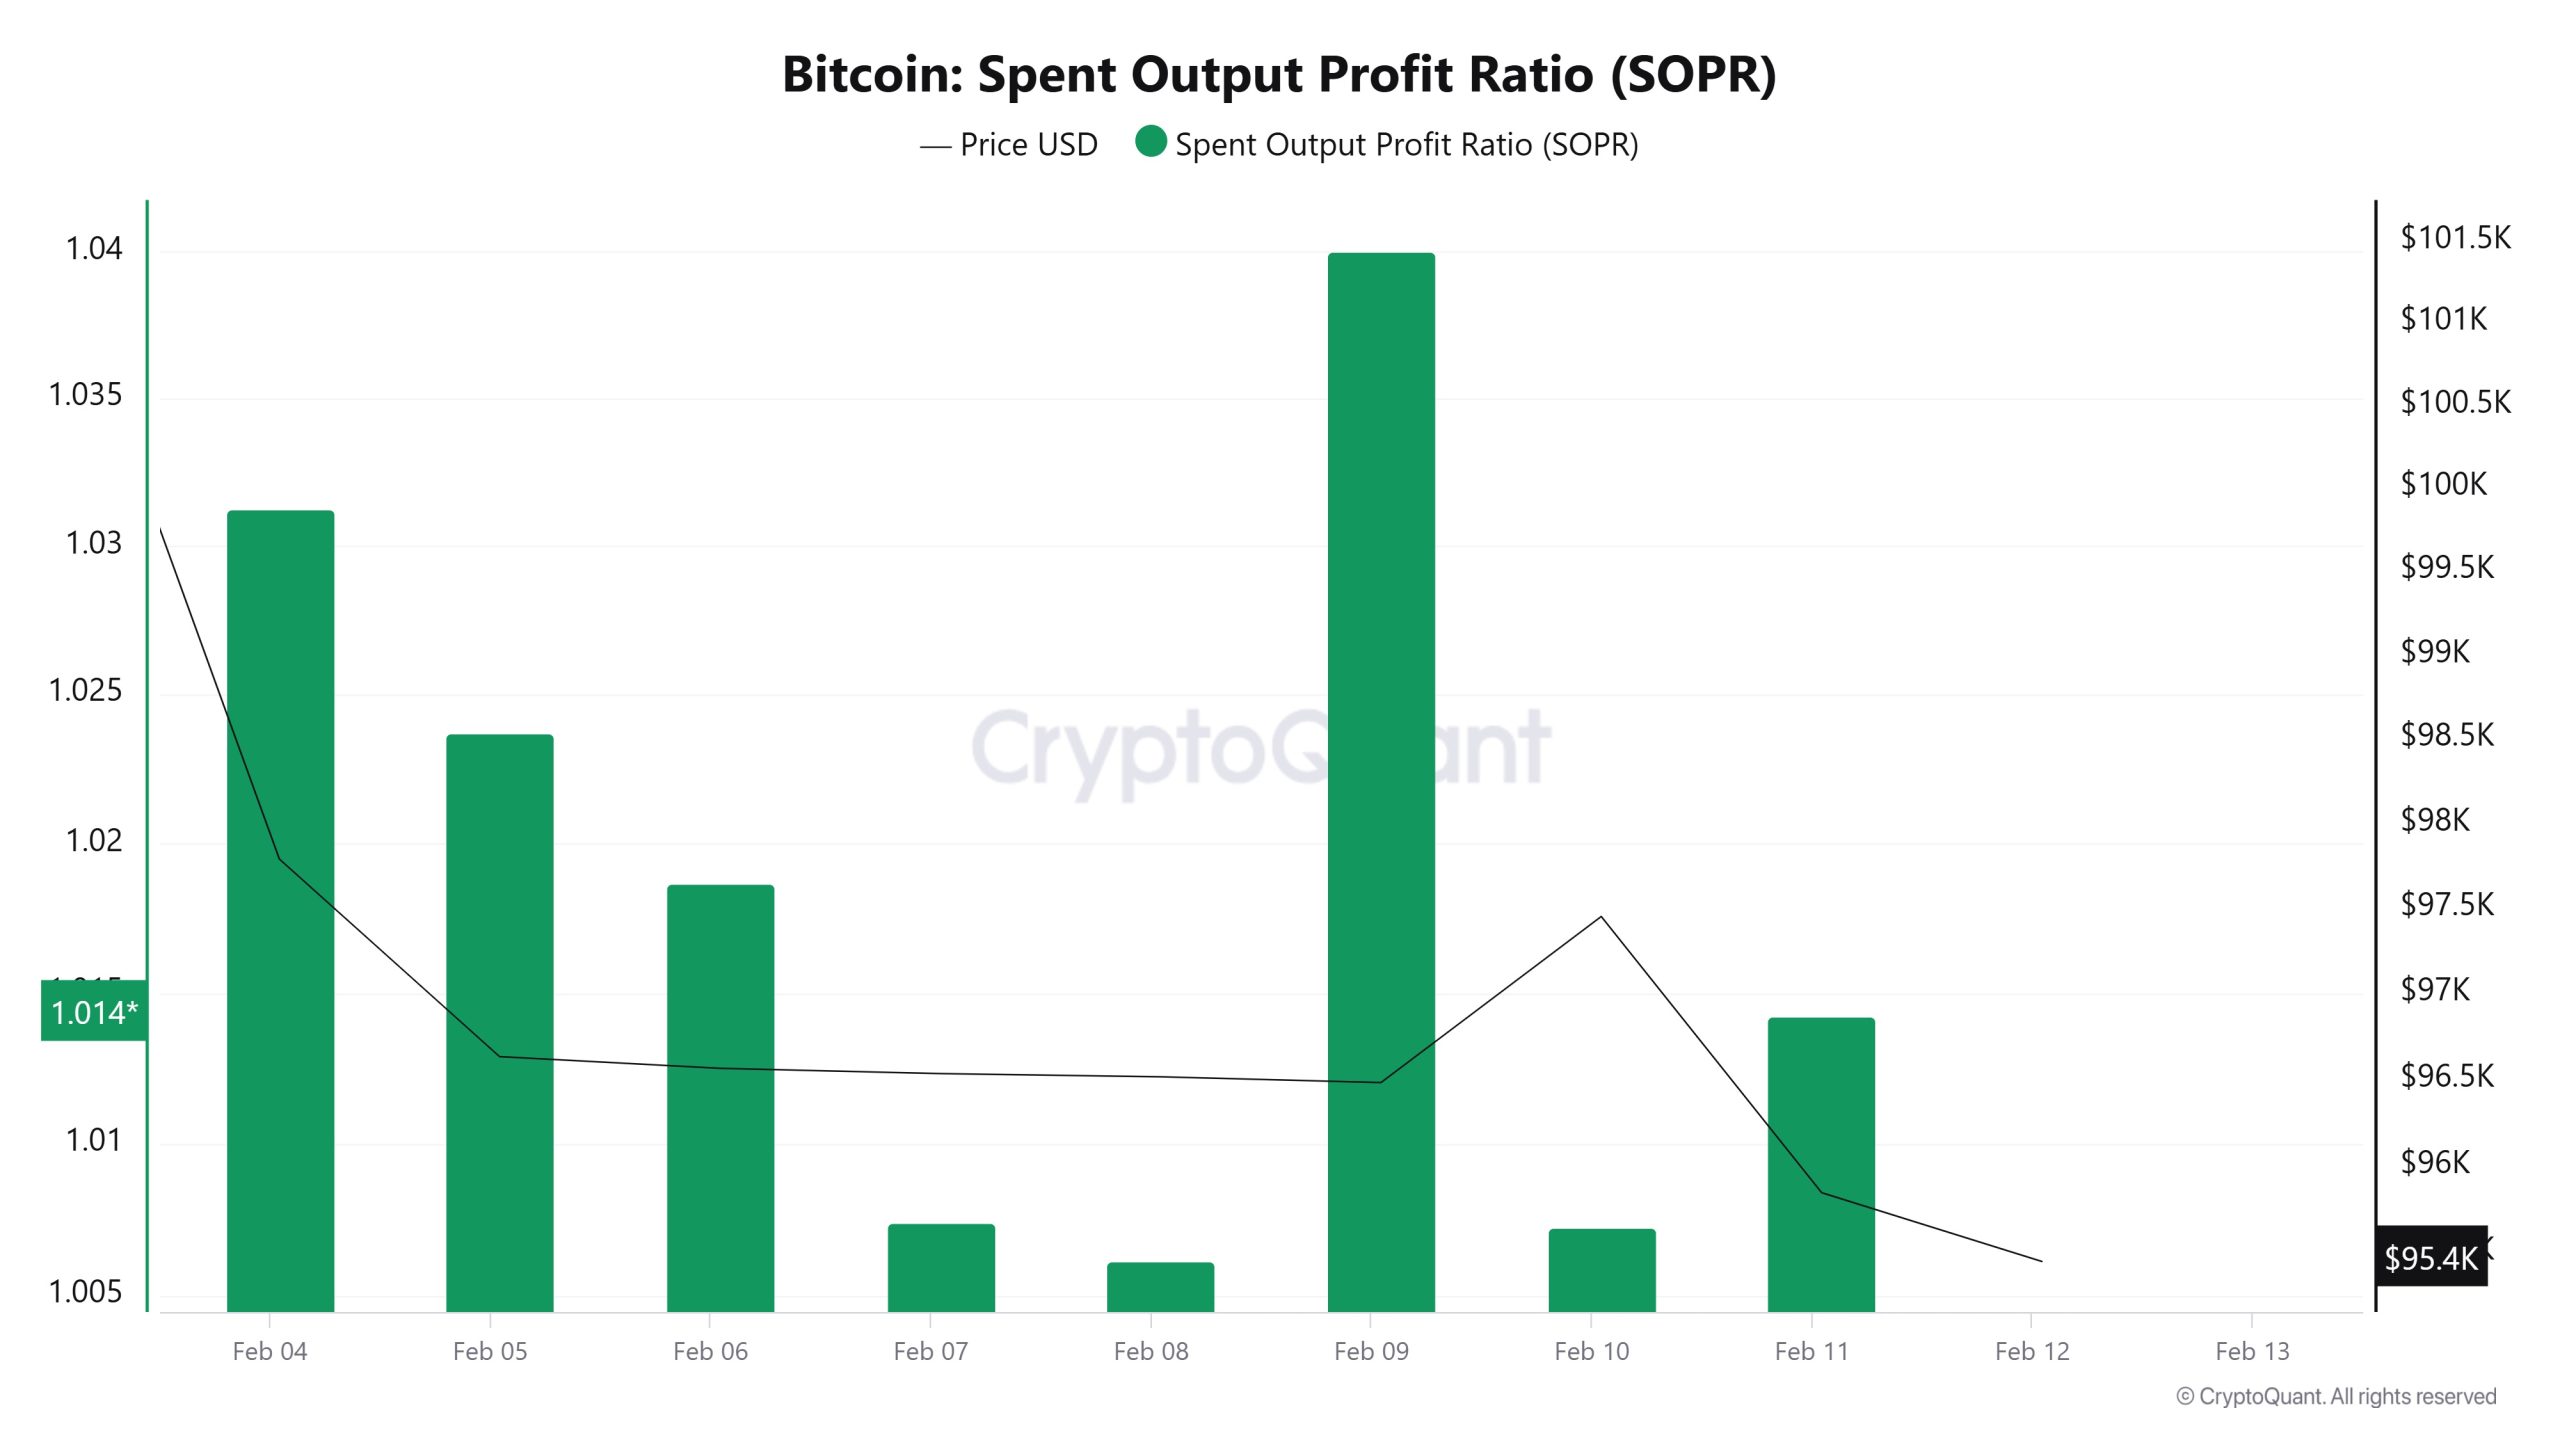
On Februar 5, the Bitcoin price was at 96,630, while the SOPR metric was at 1.02. As of Februar 11, the Bitcoin price fell to 95,842 while the SOPR metric dropped to 1.01. Compared to last week, the Bitcoin price has decreased by 0.82% and the SOPR metric by about 0.98%.
Derivatives
Open Interest
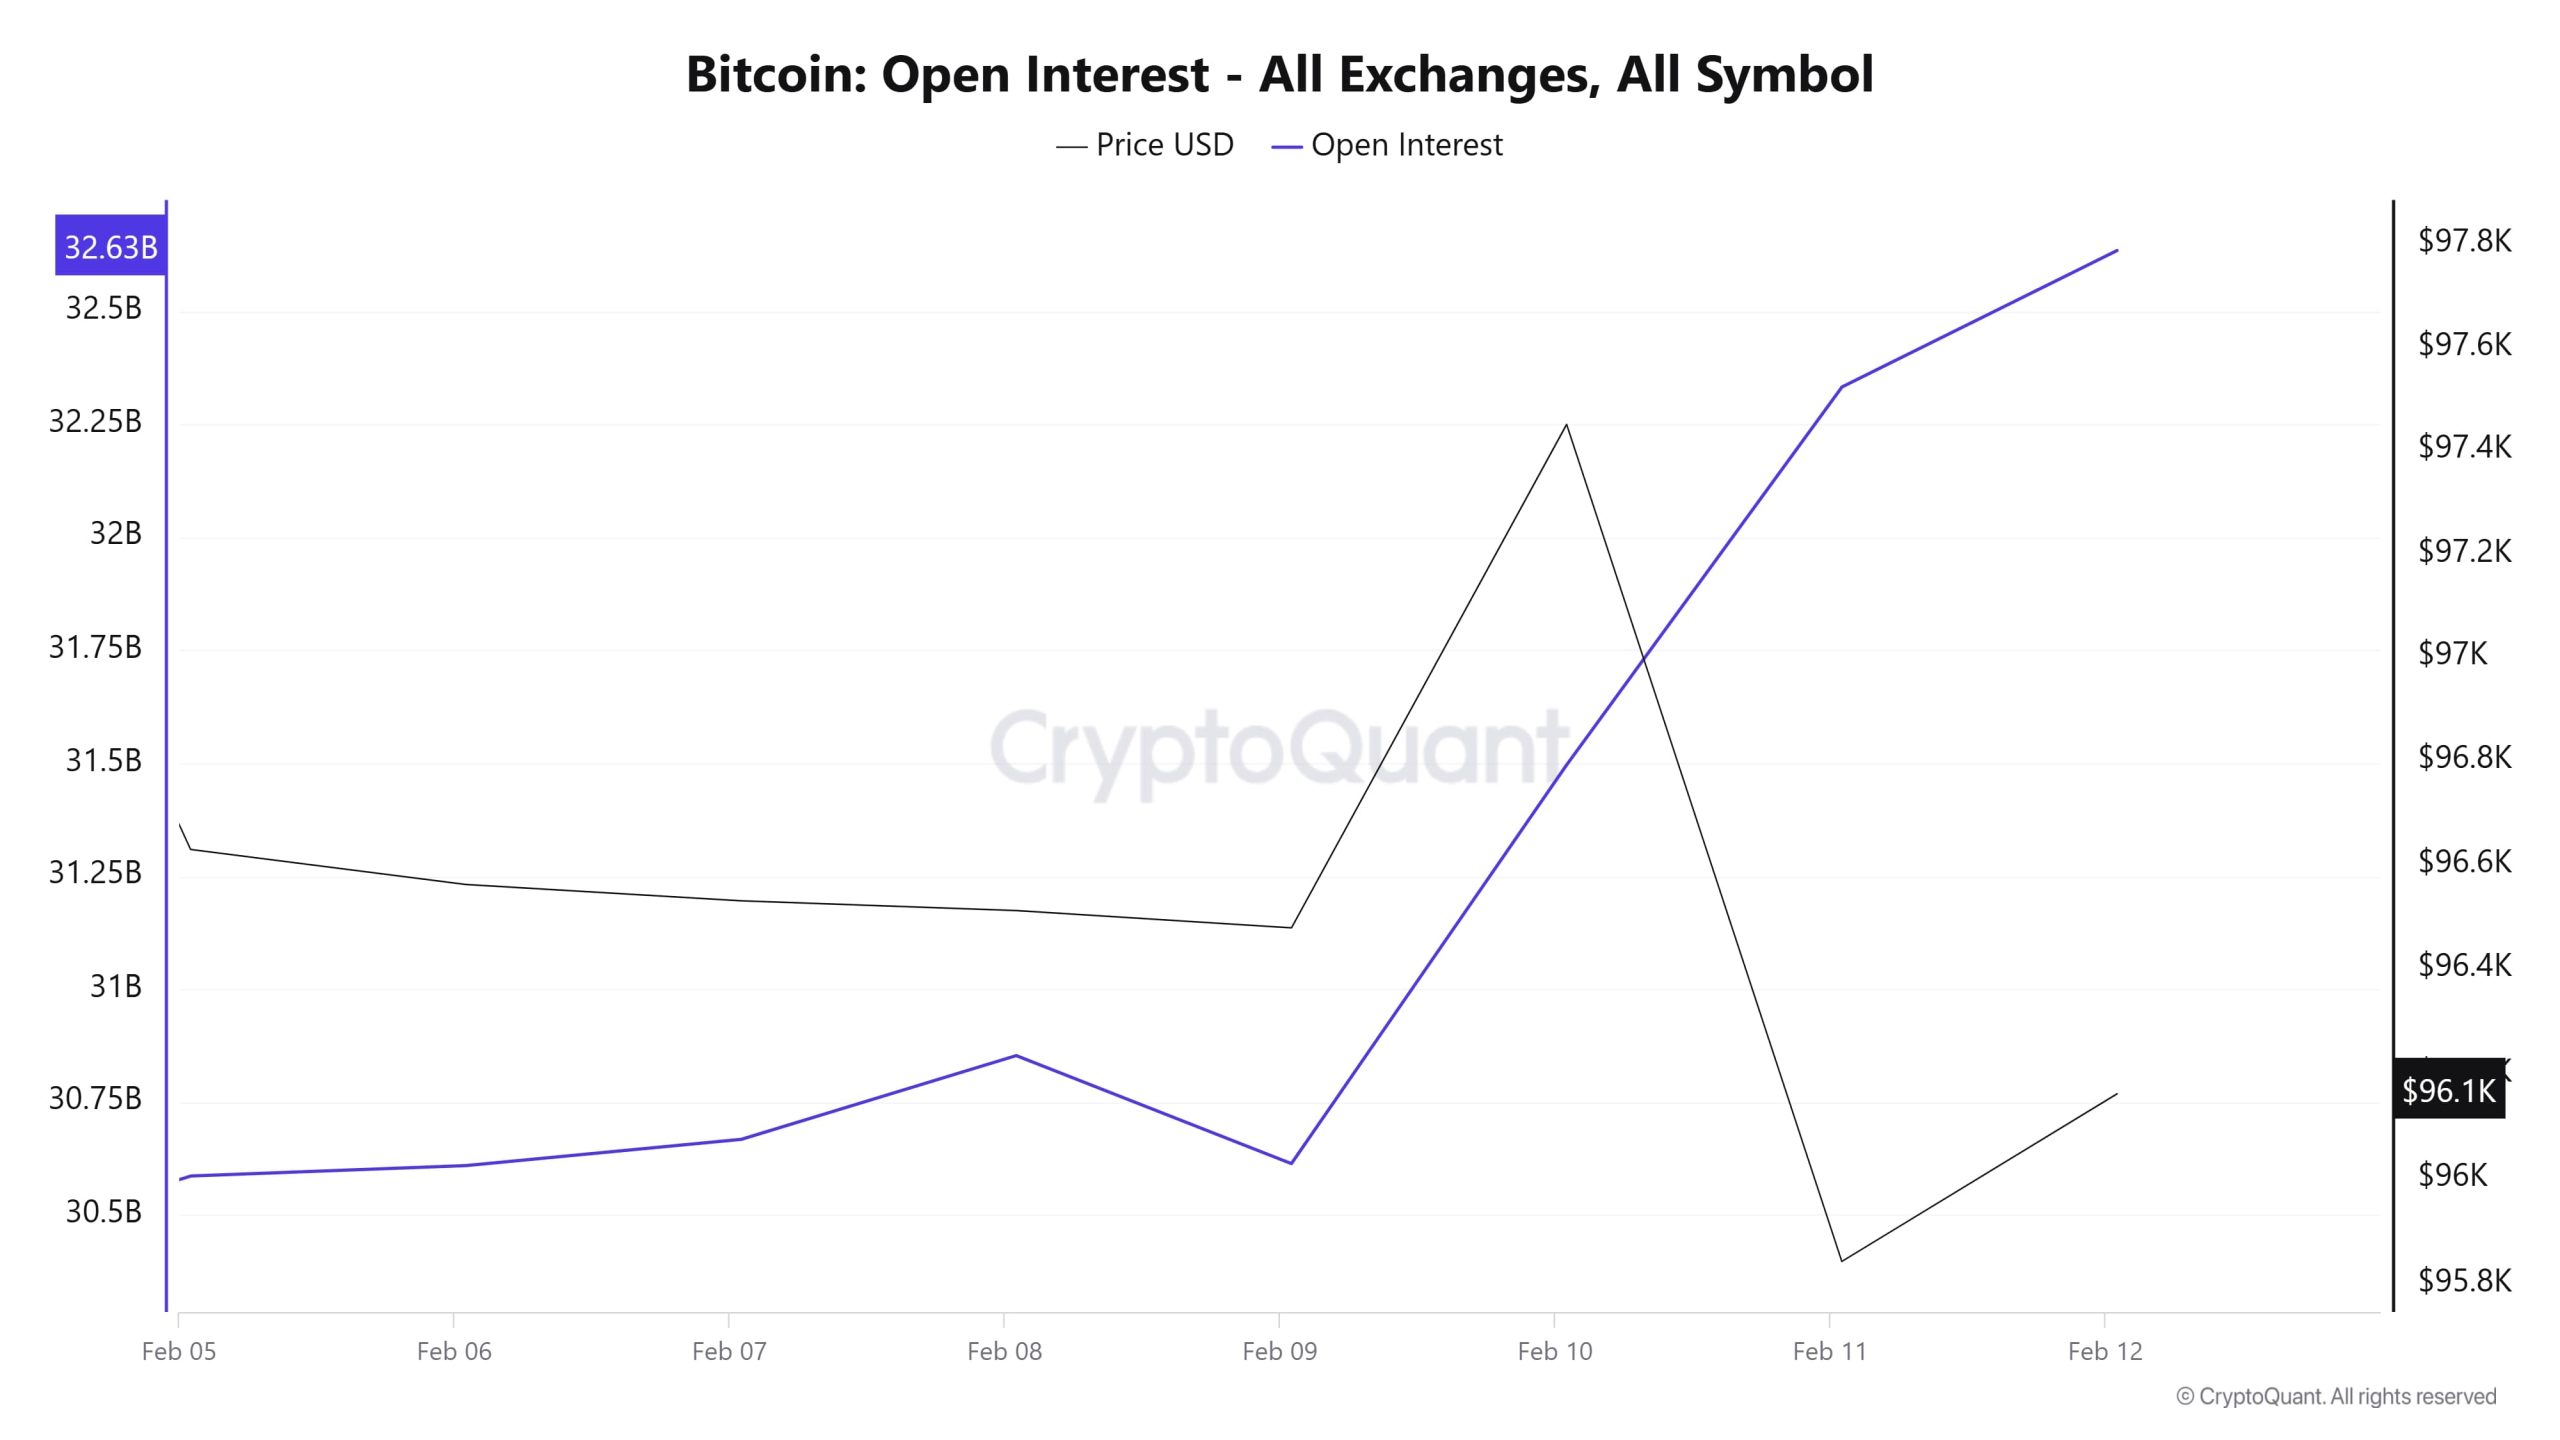
The chart shows Bitcoin’s Open Interest (OI) and price movements. On 5 Februar, OI was around $ 30.5 billion, while it gradually increased to $ 32.63 billion on 12 Februar. During this period, price movements followed a fluctuating course. Between 5-7 Februar, OI was slowly rising while the price was in a downward trend. On 8 Februar, OI continued to rise, but there was no significant movement on the price side. On 9 Februar, the price made a sharp upward movement while the OI fell briefly. However, as of 10 Februar, there was a strong rise in both OI and price.
On 11 Februar, there was a striking situation. While the price fell rapidly, the OI continued to rise. This shows that a high amount of short positions have been opened in the market. When examined together with the funding rate data, it can be said that some of these positions were replaced by long positions as of 11 Februar.
Funding Rate
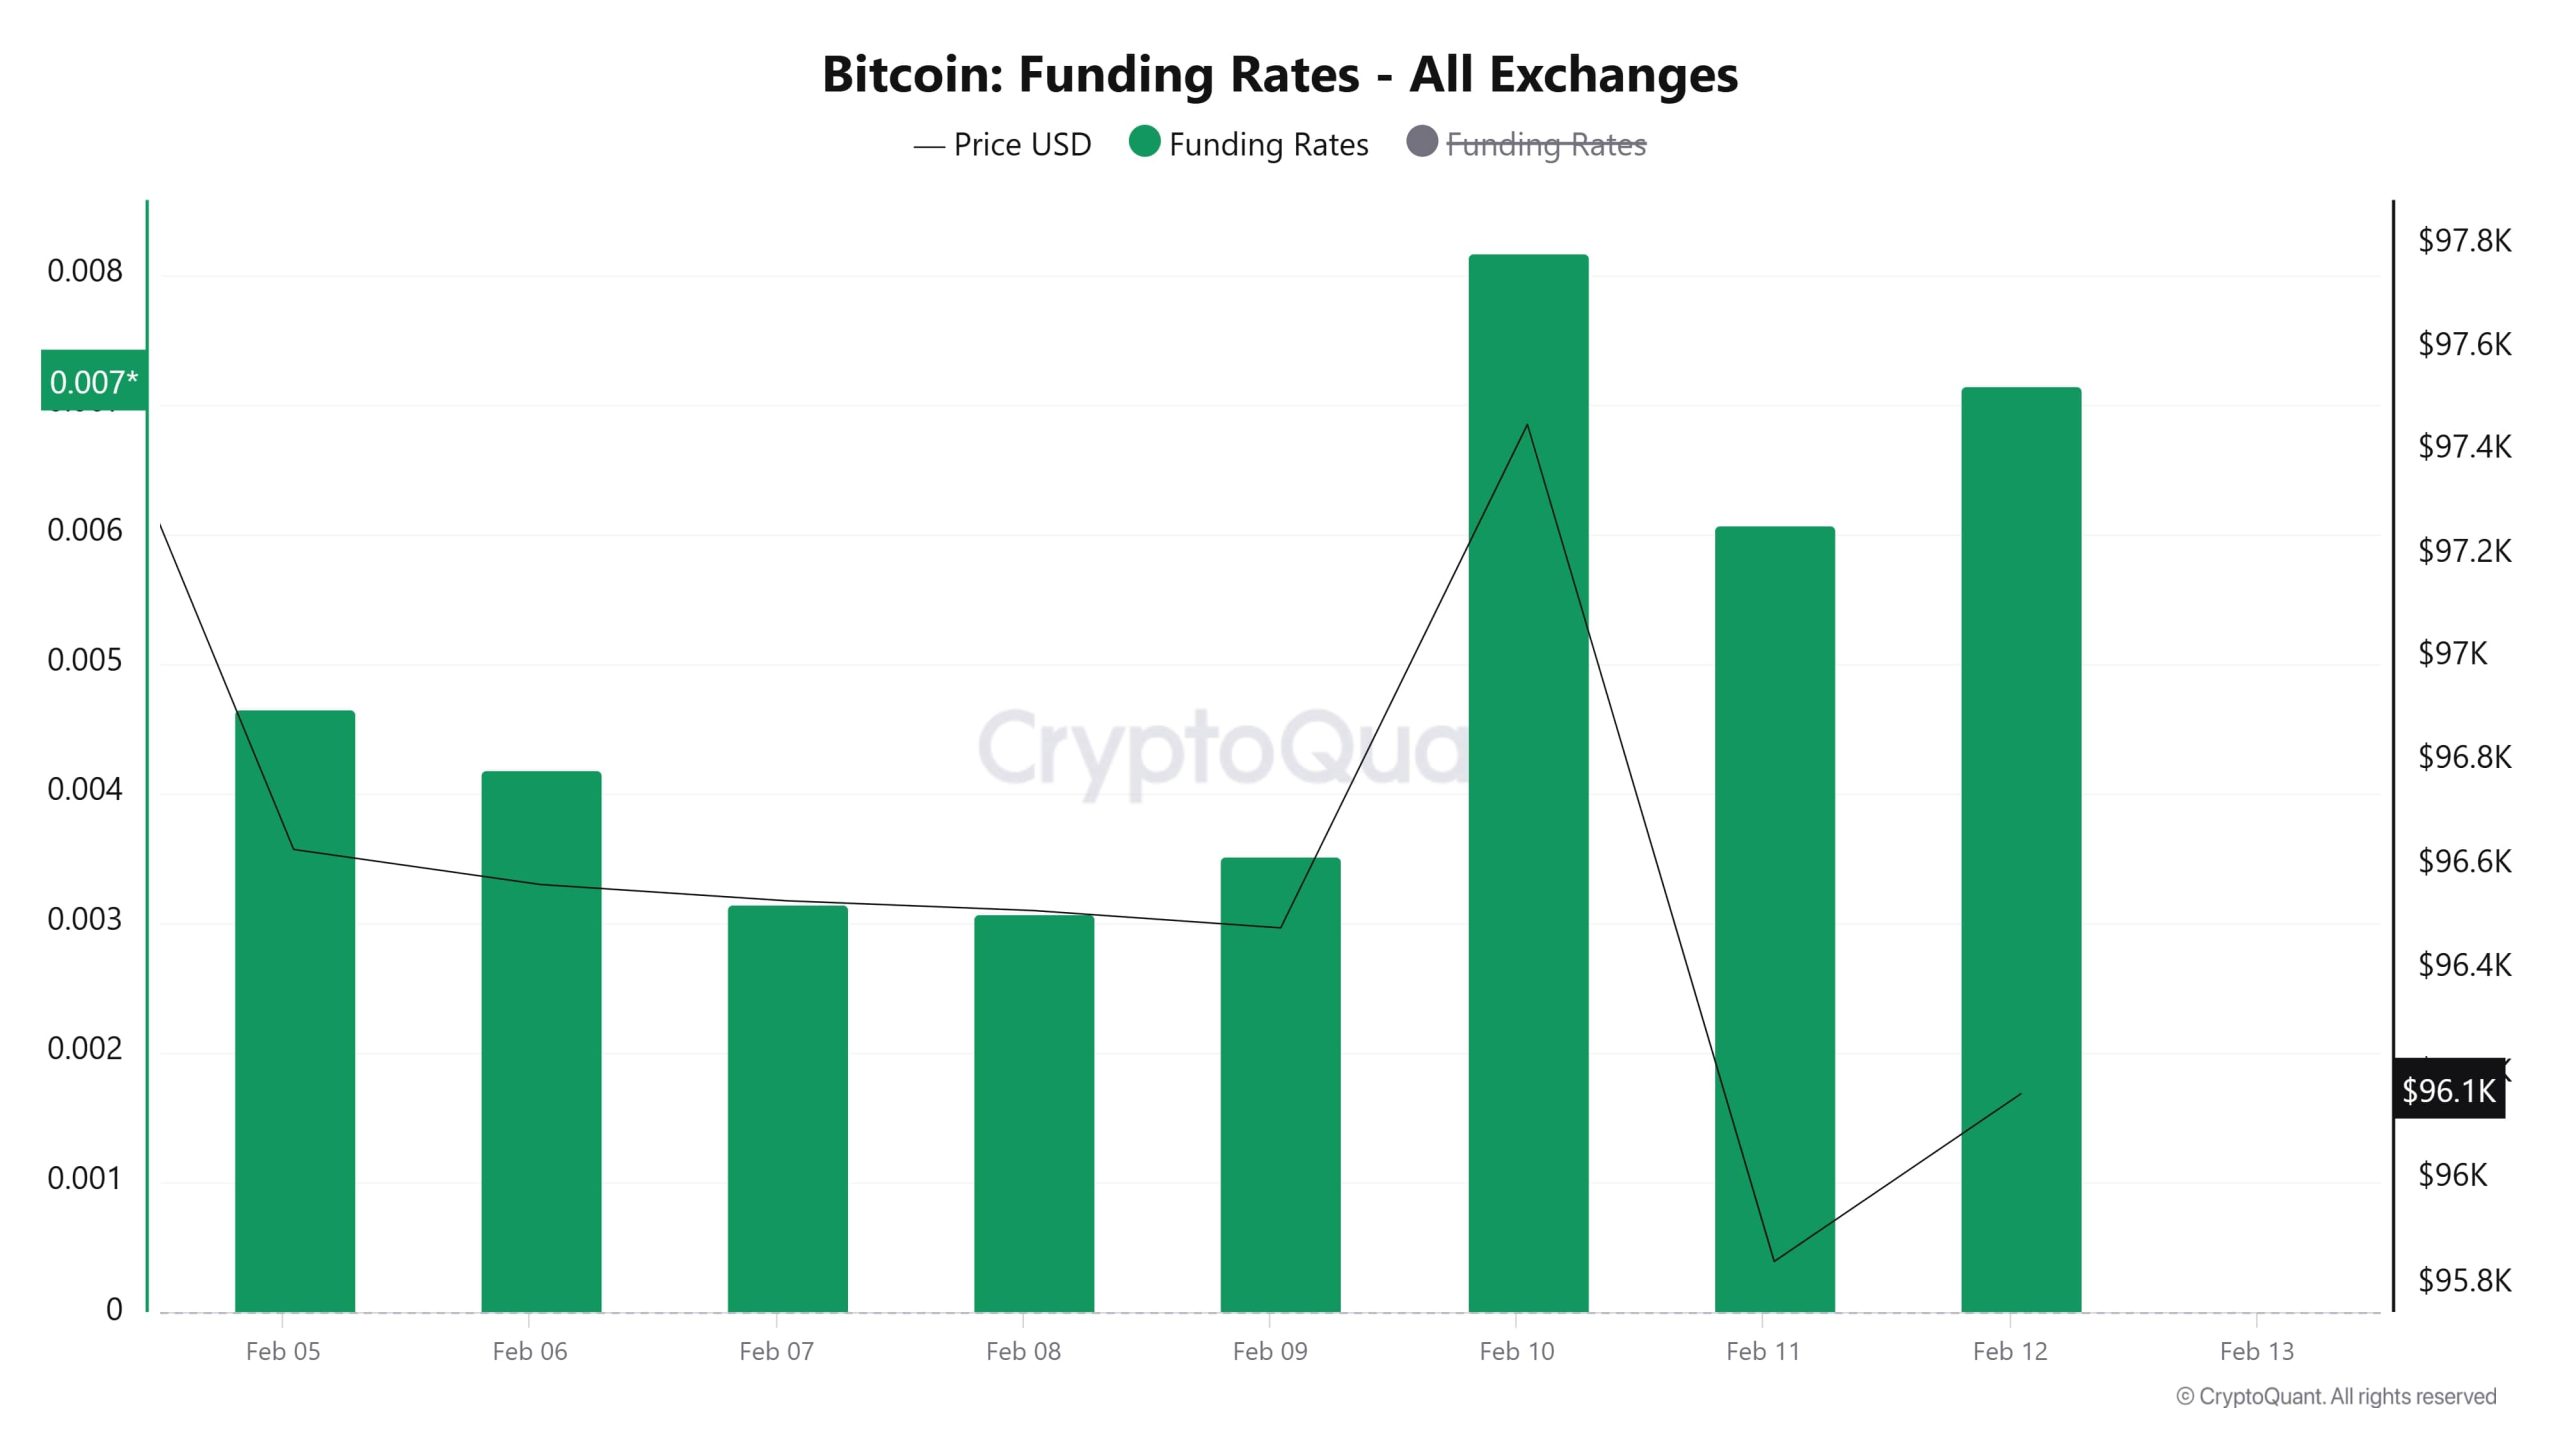
On 5 Februar, the funding rate was 0.005, followed by a gradual decline in the following days, reaching its lowest level on 8 Februar. As of 9 Februar, the funding rate started to rise again and peaked on 10 Februar with a significant increase. On 10 Februar, the funding rate rose sharply while the price also increased during the same period. On 11 Februar, the price fell sharply while the funding rate remained at high levels. On 12 Februar, the funding rate increased again and maintained its high levels and a recovery was also observed on the price side.
In general, funding rate was in positive territory and reached its highest level on 10 Februar. There are parallel and sometimes inversely correlated movements between the funding rate and the price. The fact that the funding rate remained high while the price fell on 11 Februar may indicate the intensity of leveraged long positions.
Long & Short Liquidations
| Date | Long Amount (Million $) | Short Amount (Million $) |
|---|---|---|
| 05 Januar | 35.97 | 18.47 |
| 06 Januar | 28.86 | 23.63 |
| 07 Januar | 42.96 | 104.94 |
| 08 Januar | 9.82 | 5.20 |
| 09 Januar | 23.90 | 8.33 |
| 10 Januar | 10.96 | 25.92 |
| 11 Januar | 36.53 | 12.14 |
| TOTAL | 189.00 | 198.63 |
Supply Distribution
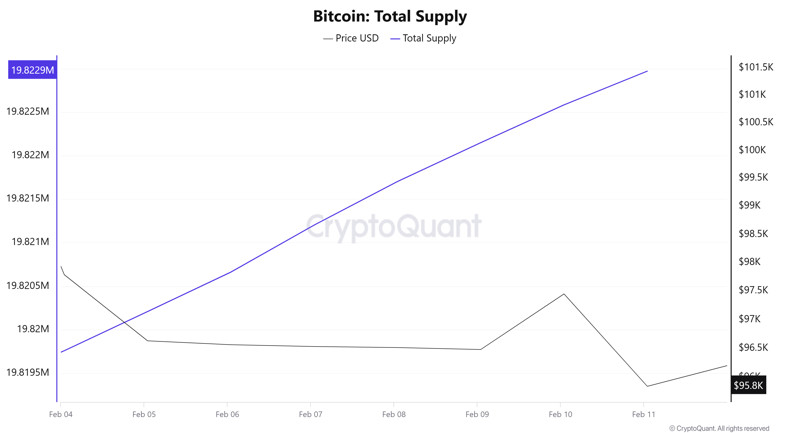
Total Supply: It reached 19,819,757 units, an increase of approximately 0.0162% compared to last week.
New Supply: The amount of BTC produced this week was 3,214.
Velocity: The decline continues compared to the previous week.
| Wallet Category | 04.02.2025 | 11.02.2025 | Change (%) |
|---|---|---|---|
| < 0.1 BTC | 1.349% | 1.347% | -0.15% |
| 0.1 – 1 BTC | 5.405% | 5.402% | -0.06% |
| 1 – 100 BTC | 32.313% | 32.321% | 0.02% |
| 100 – 1k BTC | 23.084% | 23.134% | 0.22% |
| 1k – 100k BTC | 34.339% | 34.228% | -0.32% |
| > 100k BTC | 3.269% | 3.269% | - |
When we look at the supply distribution, there was a slight decrease of 0.15% in the ‘< 0.1 BTC’ category, while a slight decrease of 0.06% was observed in the ‘0.1 – 1 BTC’ category. While there was a limited increase of 0.02% in the ‘1 – 100 BTC’ category, there was a remarkable increase of 0.22% in the ‘100 – 1k BTC’ category. This increase shows that medium-sized investors have become more active in the market. In contrast, there was a 0.32% decrease in the ‘1k – 100k BTC’ category, indicating that some of the large investors reduced their holdings. There was no change in the ‘> 100k BTC’ category.
Exchange Reserve
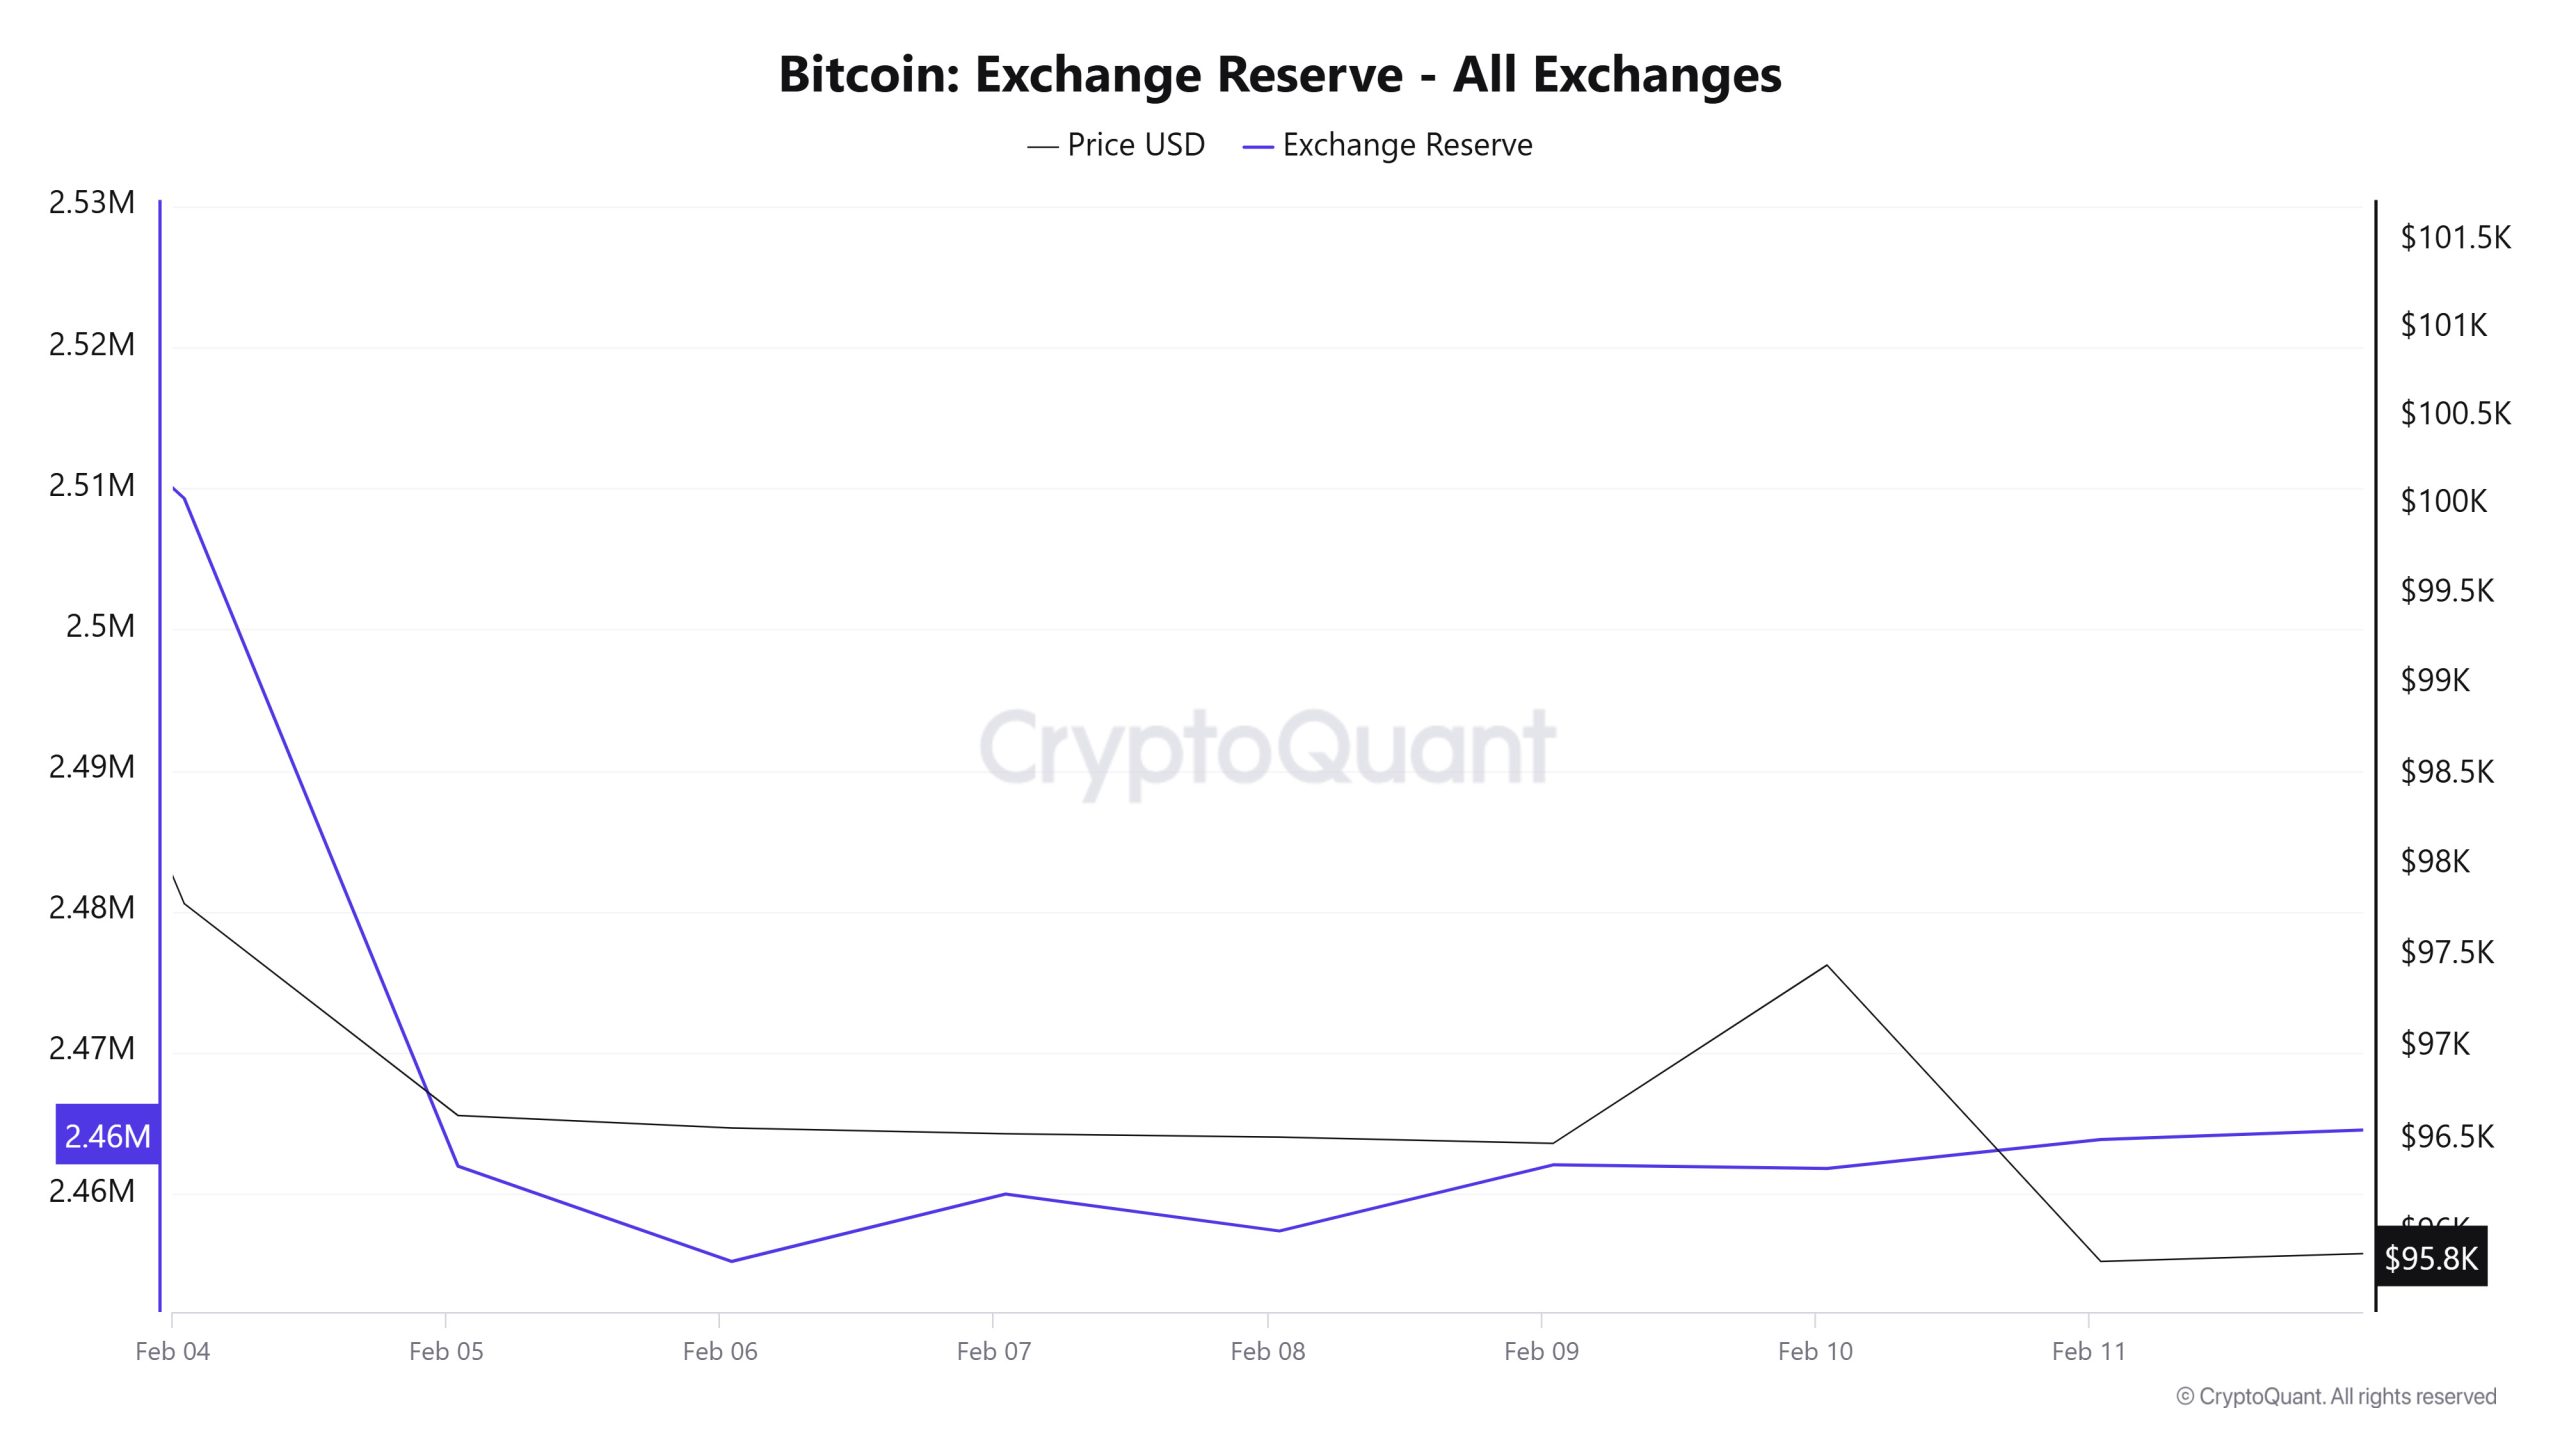
Between 5-11 Februar 2025, there was a total net outflow of 45,450 BTC from Bitcoin reserves on exchanges and reserves decreased by 1.81%. The most remarkable movements in this process were experienced on 5 Februar 2025. On this date, there was a net outflow of 47,332 BTC from the exchanges and a sharp decline in reserves was observed. On the other hand, net inflows of 4,777 BTC and 4,687 BTC on 7 Februar and 9 Februar, respectively, attracted attention. The price of Bitcoin fell by approximately 0.8% during this period. Bitcoin, which closed at $ 96,630 on 5 Februar 2025, closed at $ 95,842 on 11 Februar 2025.
| Date | 5-Feb | 6-Feb | 7-Feb | 8-Feb | 9-Feb | 10-Feb | 11-Feb |
|---|---|---|---|---|---|---|---|
| Exchange Inflow | 35,994 | 35,498 | 34,019 | 17,866 | 18,767 | 25,941 | 36,280 |
| Exchange Outflow | 83,326 | 42,256 | 29,243 | 20,482 | 14,080 | 26,203 | 34,226 |
| Exchange Netflow | -47,332 | -6,758 | 4,777 | -2,616 | 4,687 | -262 | 2,055 |
| Exchange Reserve | 2,461,956 | 2,455,198 | 2,459,975 | 2,457,359 | 2,462,046 | 2,461,784 | 2,463,839 |
| BTC Price | 96,630 | 96,563 | 96,532 | 96,513 | 96,480 | 97,451 | 95,842 |
Fees and Revenues
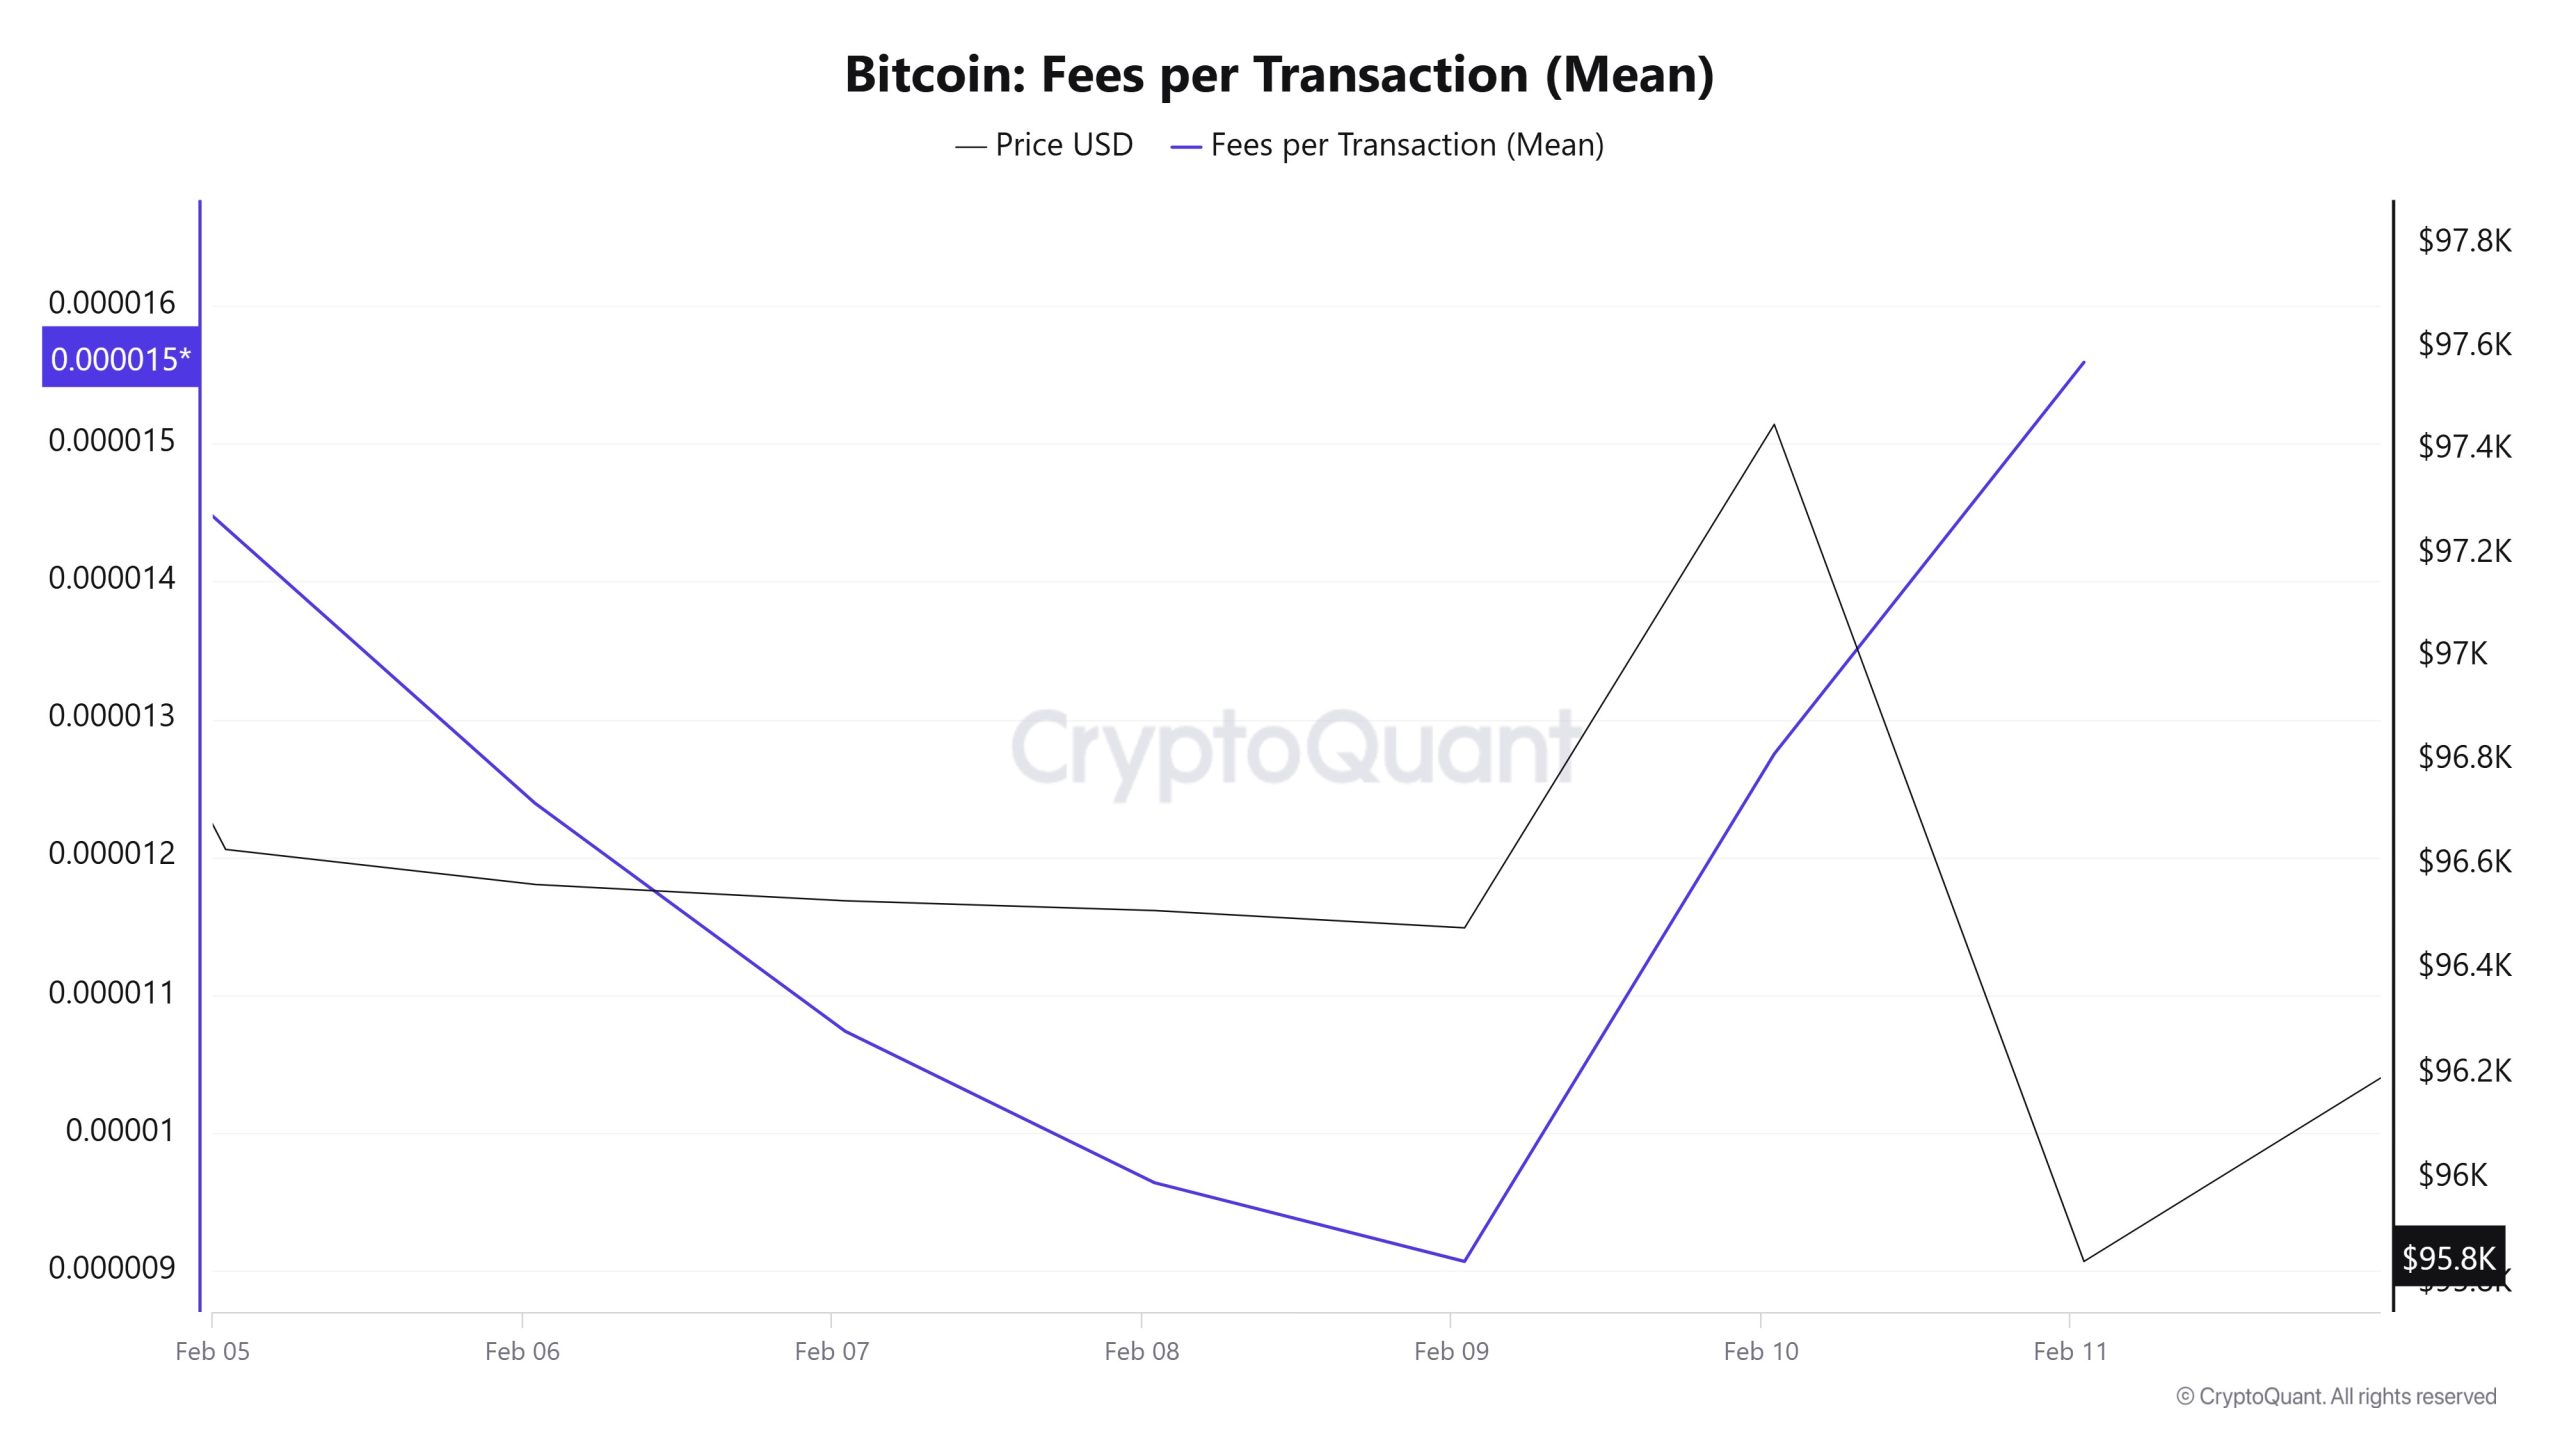
When Bitcoin Fees per Transaction (Mean) data between 05 – 11 Februar is examined, it is seen that this value was at 0.00001439 on 05 Februar, the first day of the week. Until 09 Februar, Fees per Transaction (Mean) value, which followed a similar course with Bitcoin price, decreased to 0.00000907 on 09 Februar and reached the lowest value of the week.
Since then, an upward trend has been observed with increasing high volatility, and on 11 Februar, the last day of the weekly period, Fees per Transaction (Mean) value reached 0.00001559 and closed with the highest value of the week.
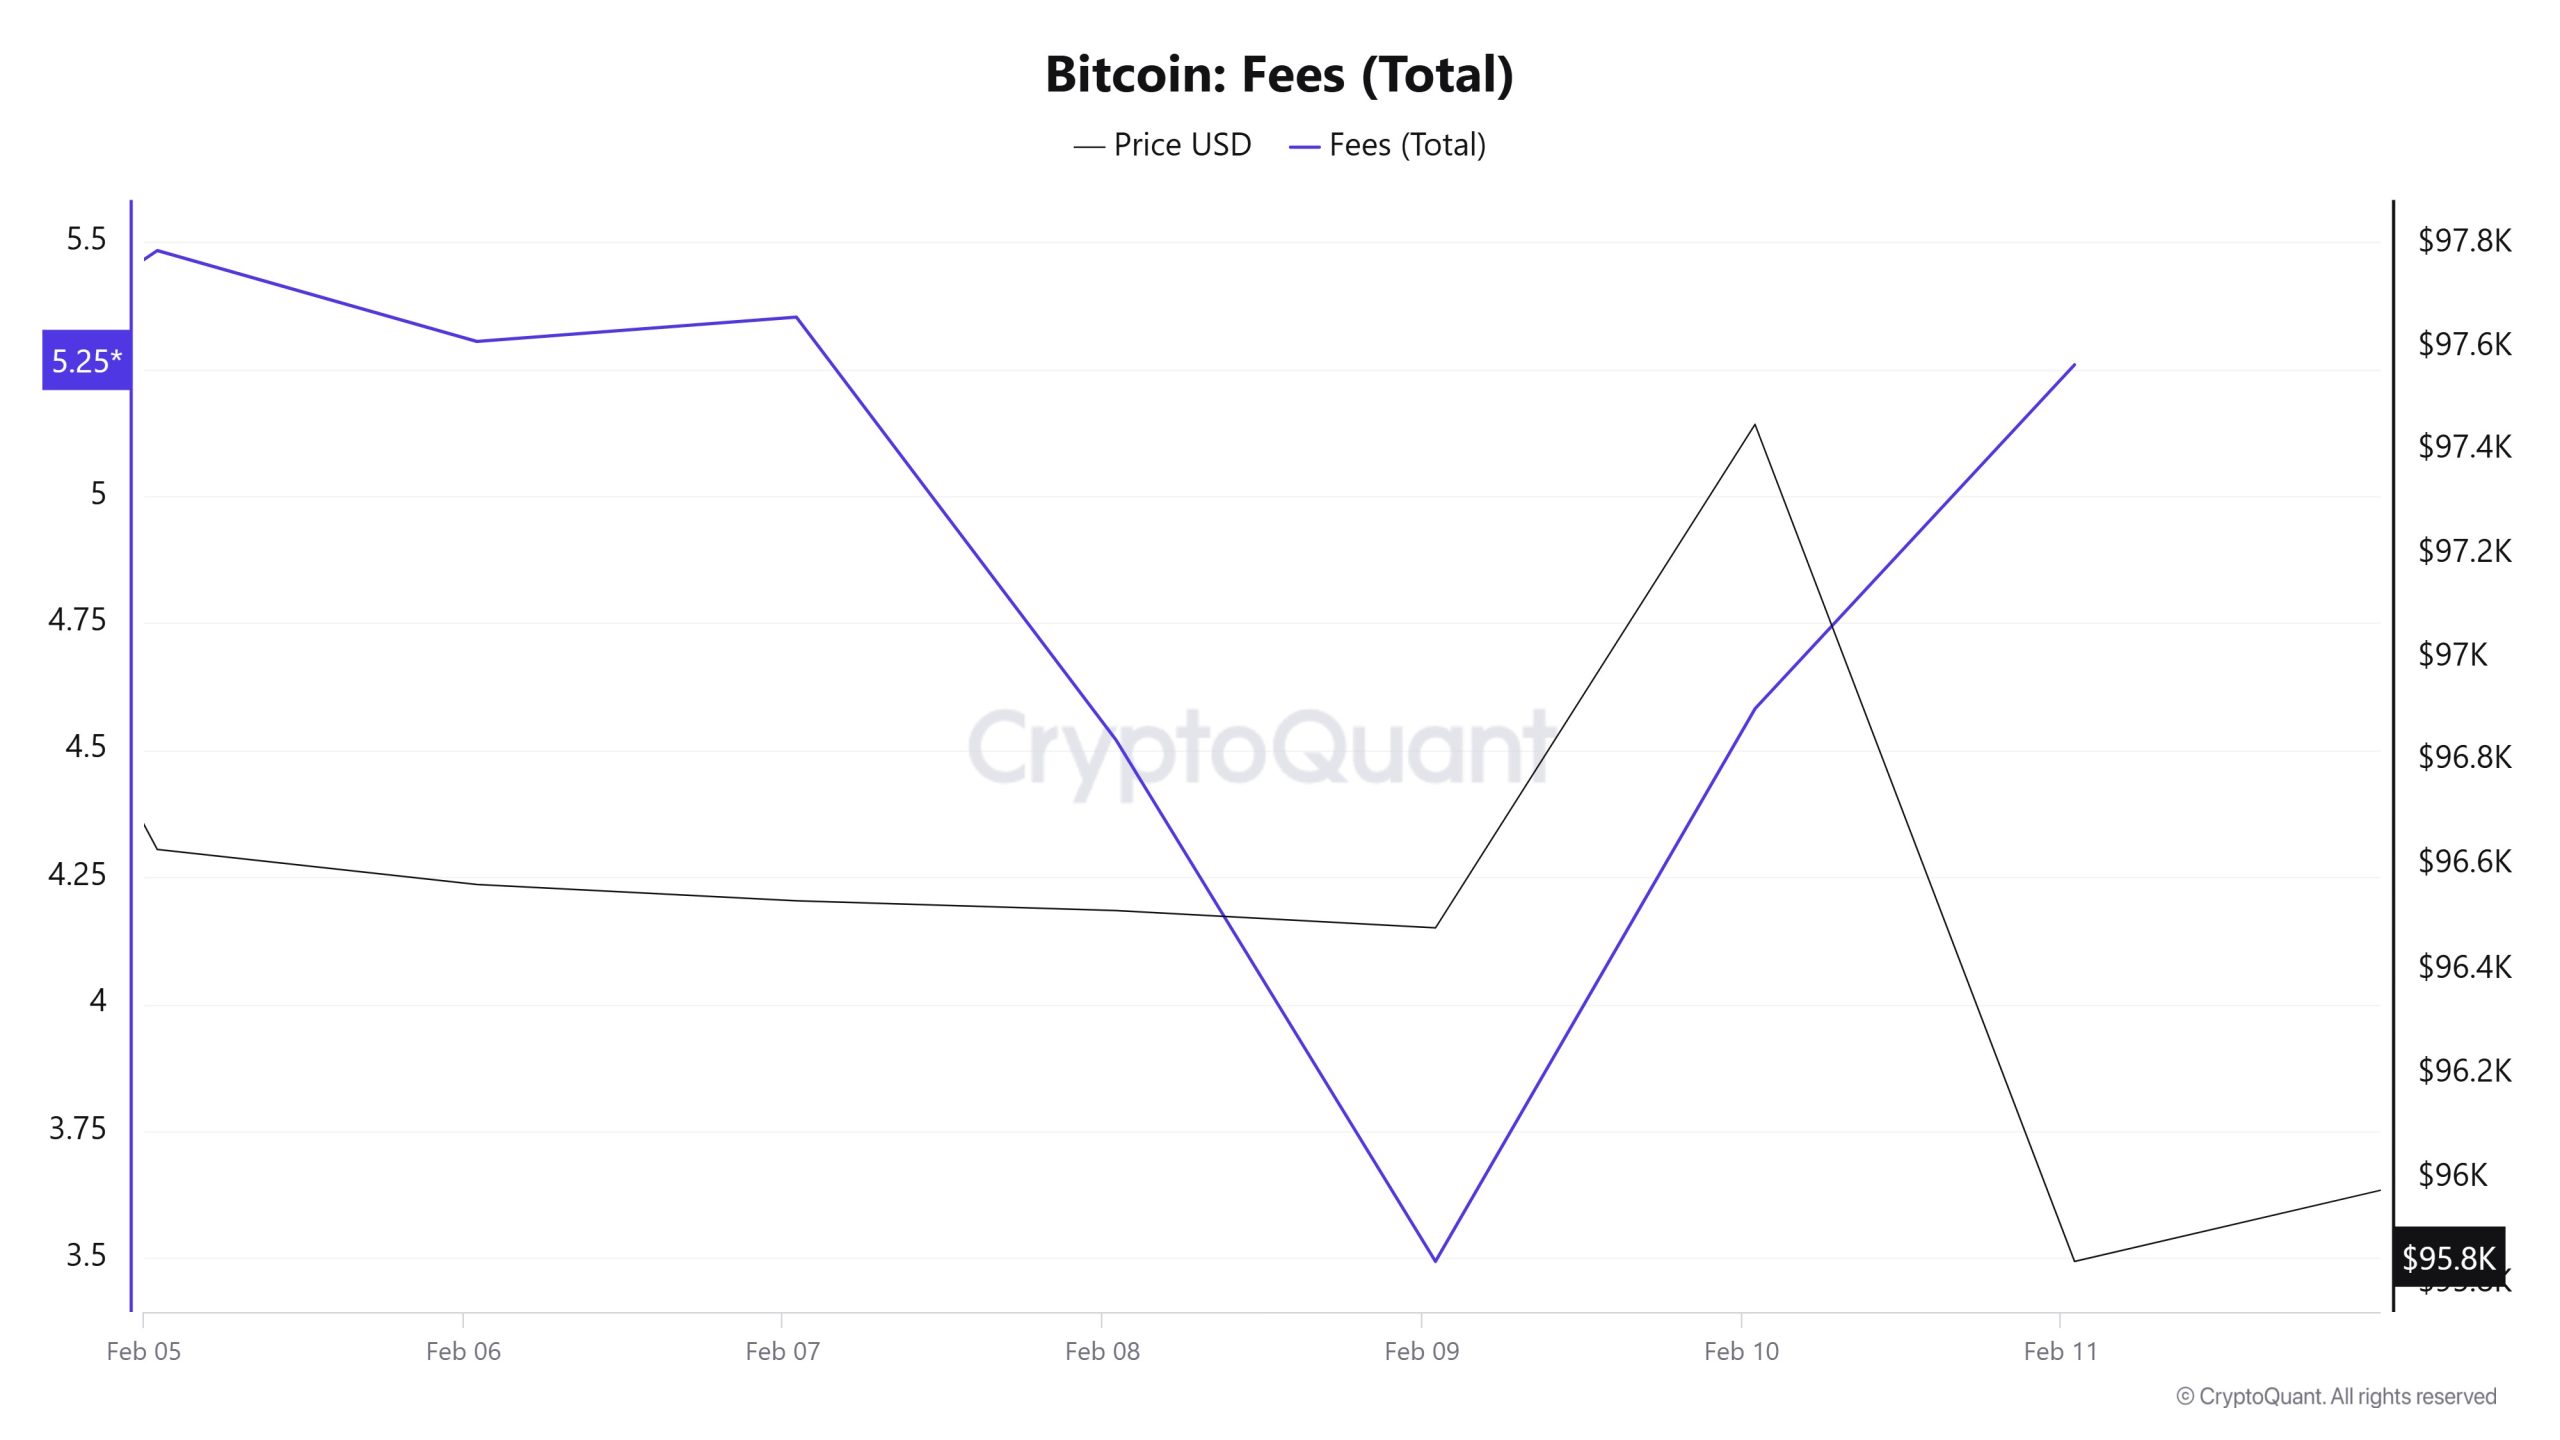
Similarly, when Bitcoin Fees (Total) data between 05 – 11 Februar are examined, it is observed that the Bitcoin Fees (Total) value, which was at 5.48304439 on 05 Februar, the first day of the week, showed a gradual decline until 09 Februar and reached the lowest value of the week by decreasing to 3.49363049 on this date.
However, as of 09 Februar, it was observed that Bitcoin Fees (Total) value started to rise due to the increasing volatility in Bitcoin price, and on 11 Februar, the last day of the weekly period, Bitcoin Fees (Total) value closed at 5.25830099.
Miner Flows
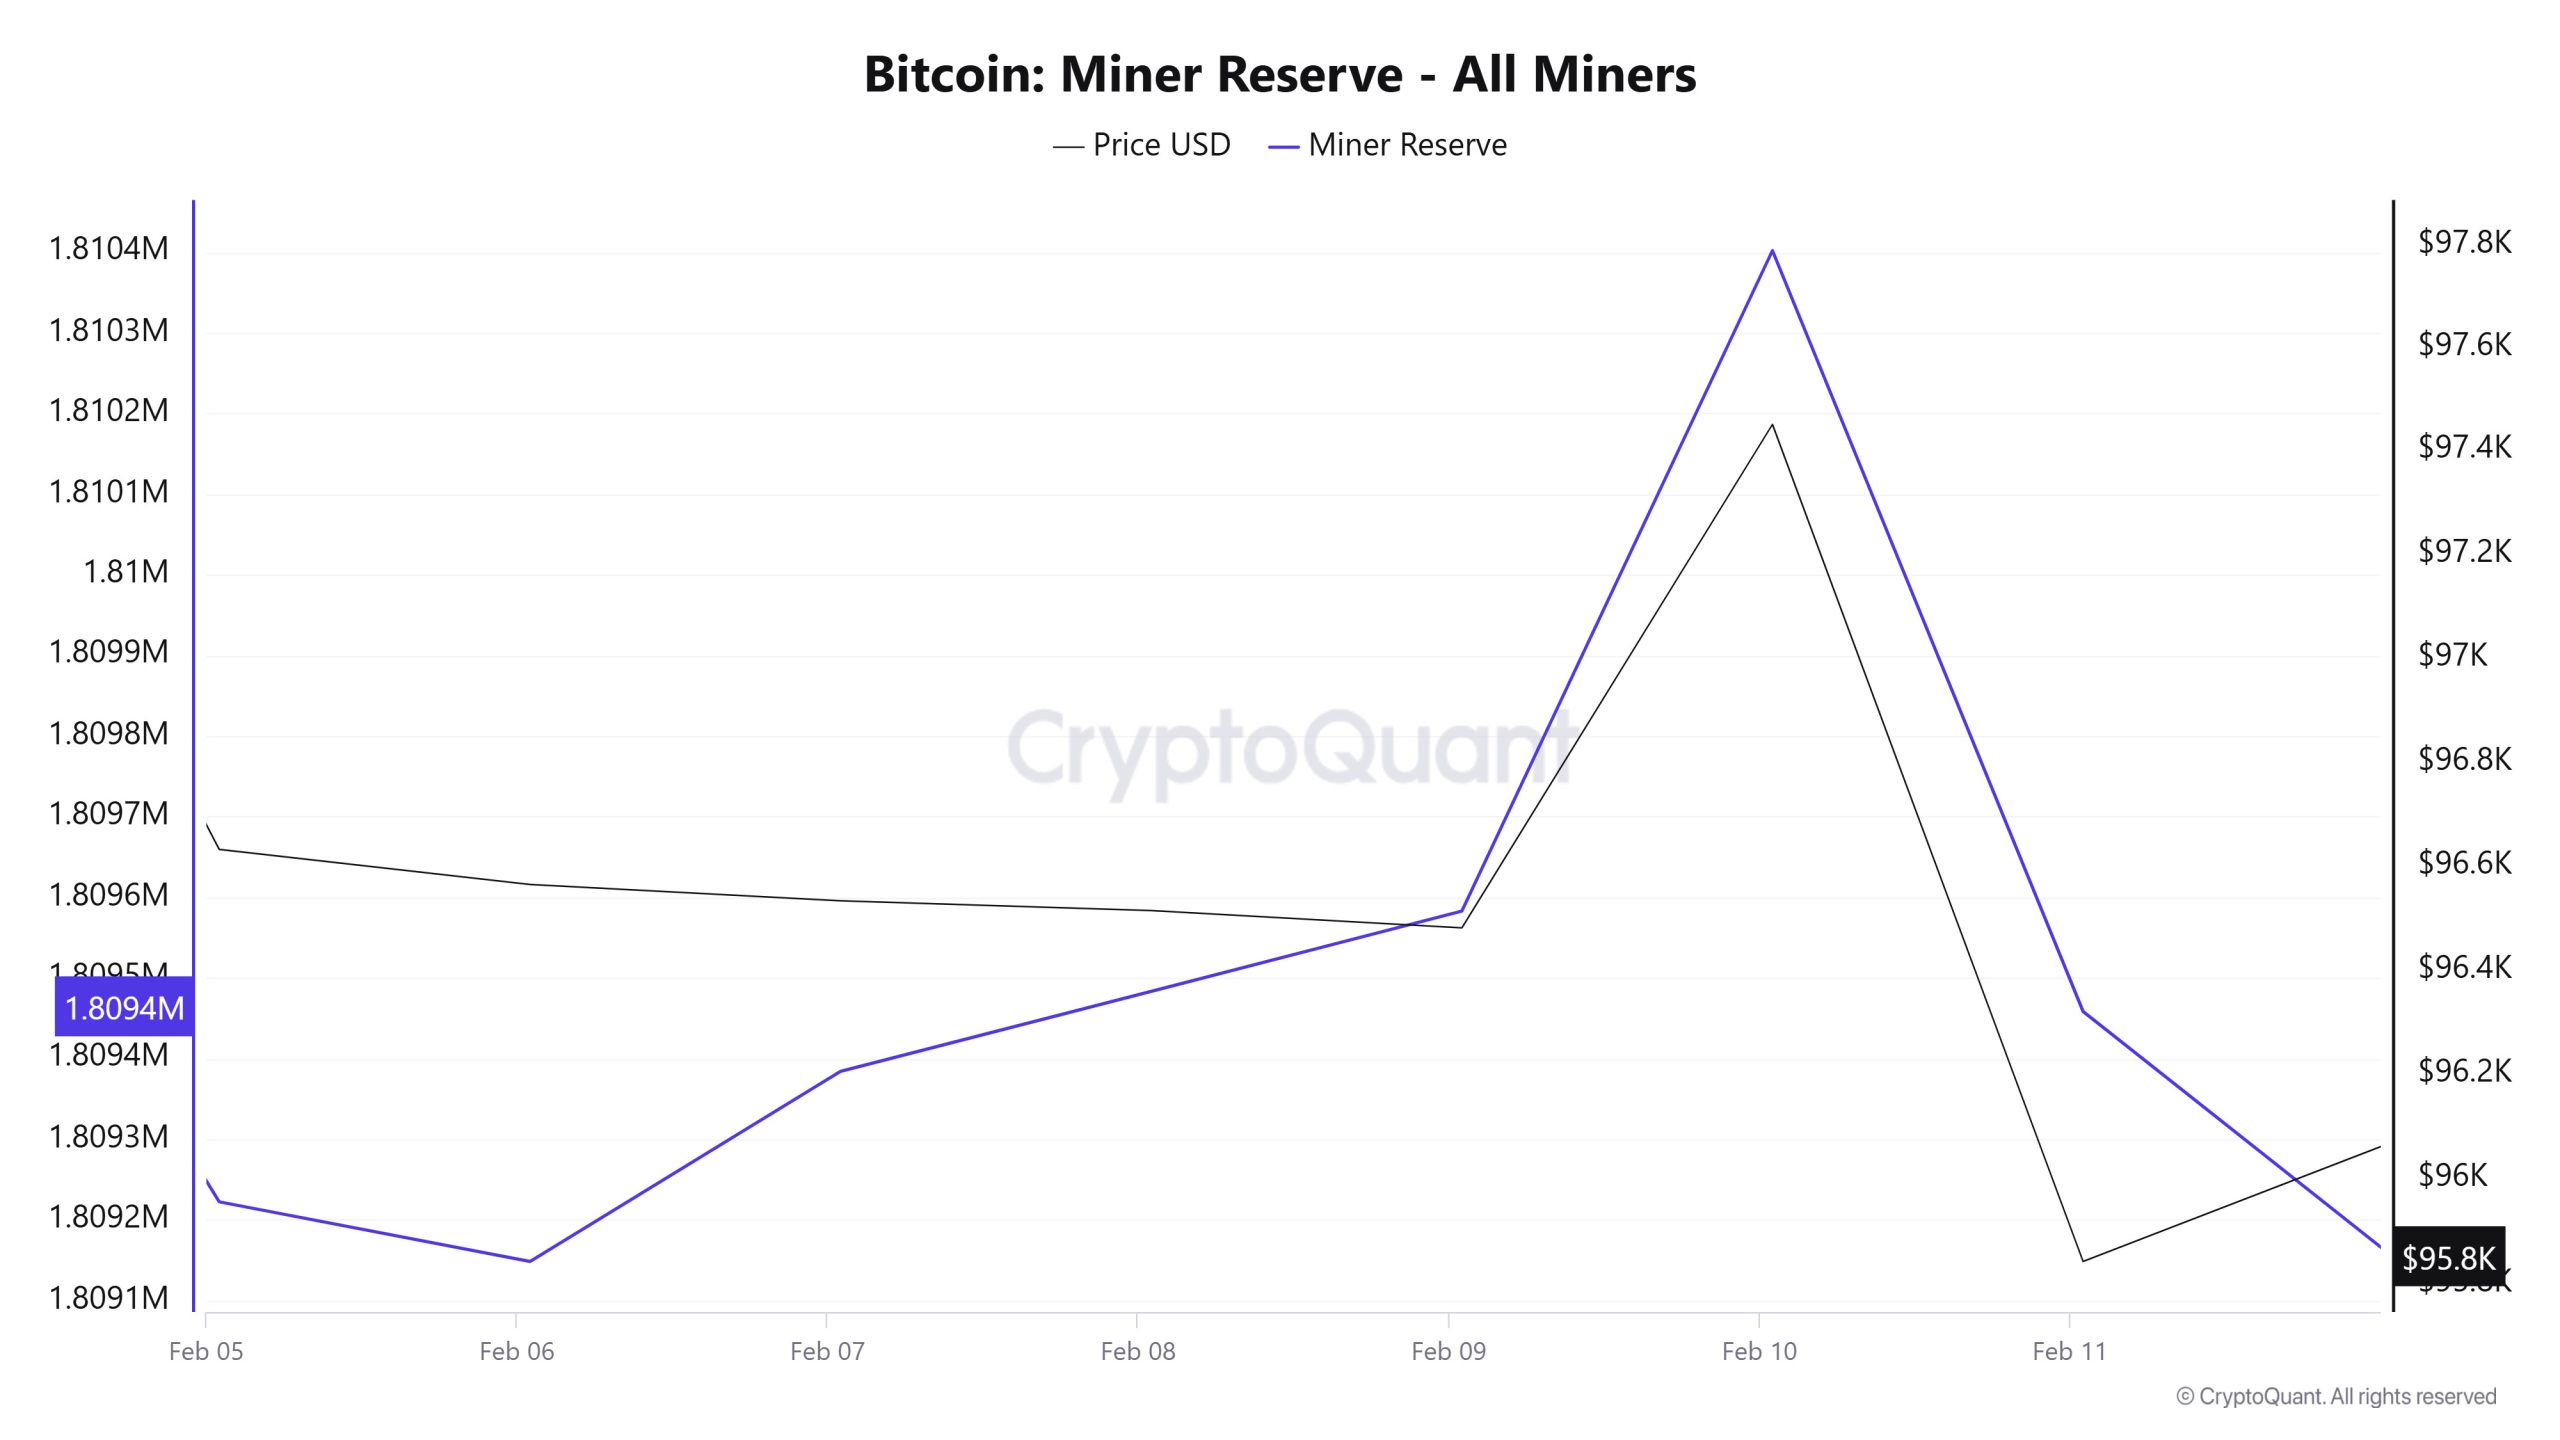
As can be seen in the Miner Reserve table, the number of Bitcoins in miners’ wallets decreased this week. It is seen that Miner Reserve and Bitcoin price are positively correlated throughout this week.
Miner Inflow, Outflow and NetFlow
Between 5 – 11 Februar, 41,431 Bitcoins were output from miners‘wallets, while the amount of Bitcoins that entered miners’ wallets between the same dates was 41,044. Miner NetFlow for this week was -387 Bitcoin. Meanwhile, the Bitcoin price was $ 96,630 on 5 Februar and $ 95,842 on 11 Februar.
Throughout the week, the net flow (Miner NetFlow) was negative as Bitcoin inflow into miner wallets (Miner Inflow) was less than Bitcoin outflow from miner wallets (Miner Outflow).
| Date | 5 Februar | 6 Februar | 7 Februar | 8 Februar | 9 Februar | 10 Februar | 11 Februar |
|---|---|---|---|---|---|---|---|
| Miner Inflow | 4,845.42 | 6,601.65 | 7,807.60 | 5,278.52 | 3,652.78 | 5,589.30 | 7,268.72 |
| Miner Outflow | 5,469.13 | 6,675.57 | 7,571.85 | 5,179.33 | 3,553.24 | 4,770.24 | 8,212.38 |
| Miner Netflow | -623.71 | -73.92 | 235.75 | 99.18 | 99.54 | 819.07 | -943.65 |
Transaction
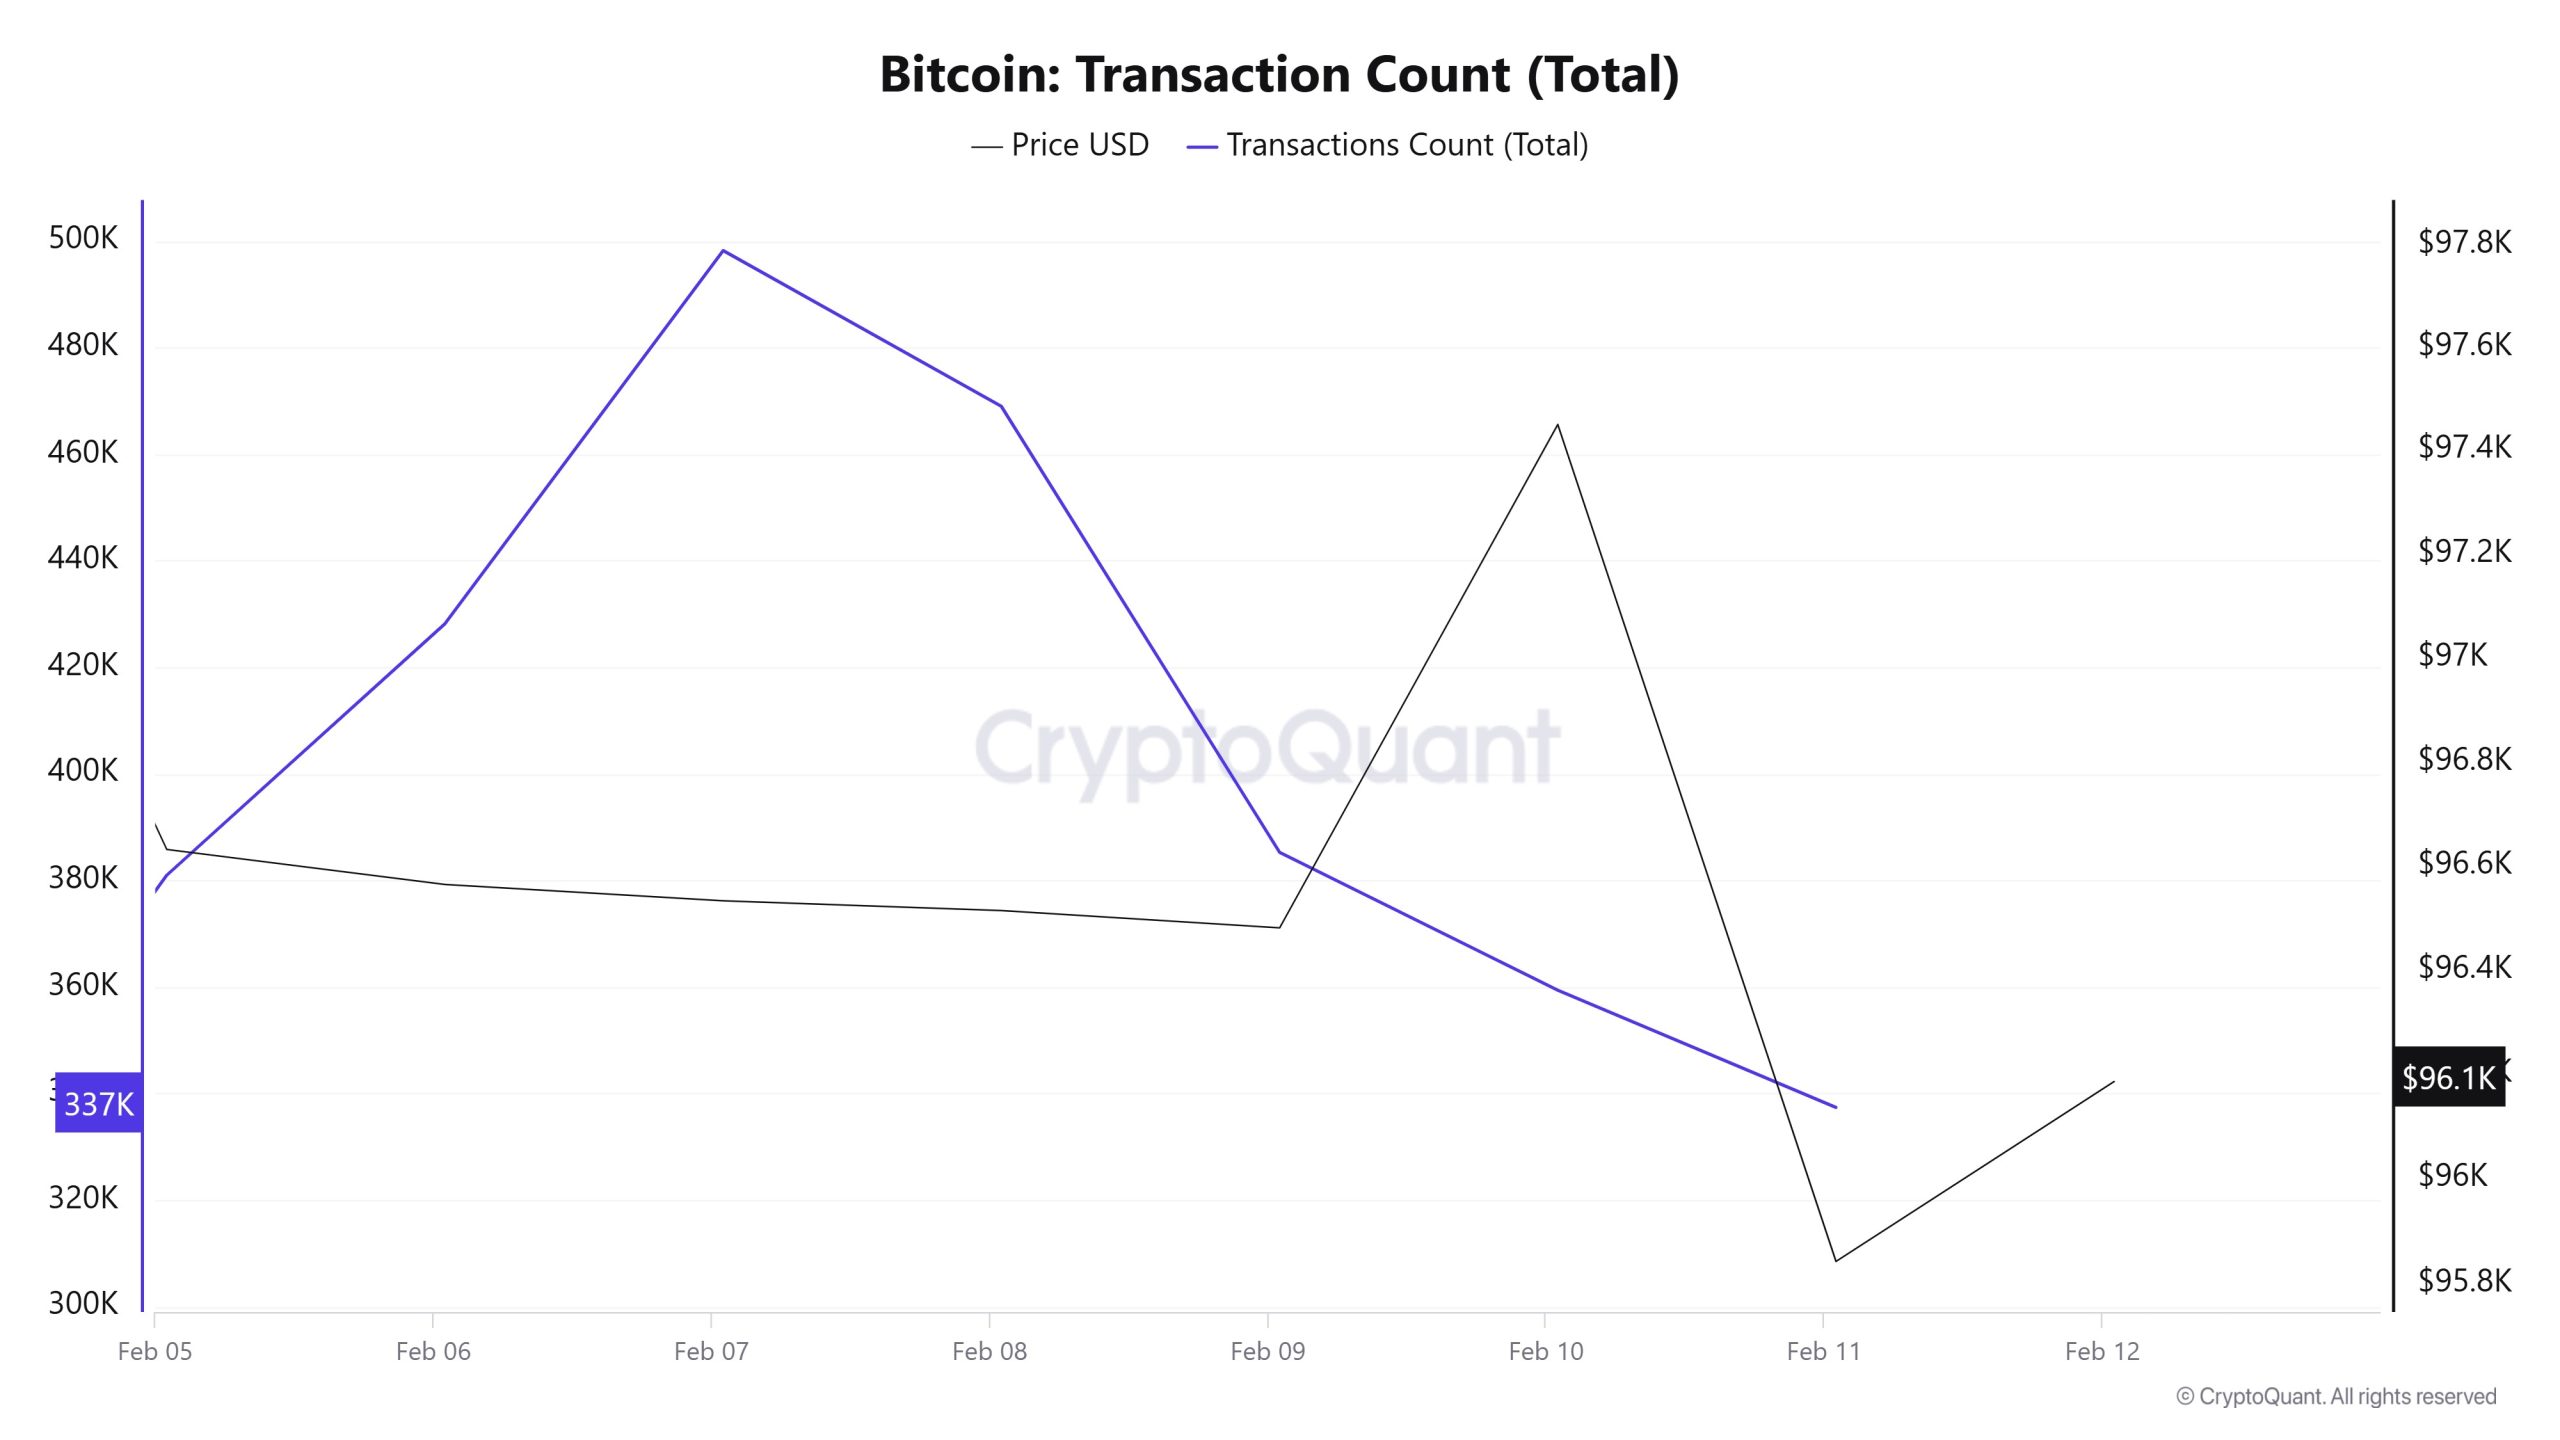
Transaction Count
Between 29 Januar and 4 Februar, a total of 2,427,886 transactions were executed, while between 5-11 Februar, this number increased to 2,858,411, an increase of approximately 17.75%. The lowest trading volume was recorded on Dienstag 11 Februar with 337,389 trades, while the highest was 498,221 on 7 Februar. This may be a sign that it is starting to evolve into a different trend from the trading declines usually observed on weekends.
Tokens Transferred
While the amount of Bitcoin transferred between 29 Januar and 4 Februar was 4,568,006 BTC, this amount decreased to 3,802,662 between 5-11 Februar, a decrease of approximately 16.76%. Nevertheless, as is usually the case, it was observed that the amount of Bitcoin transferred on Saturdays and Sundays was at the lowest levels.
While there was an increase in the number of transactions this week compared to last week, the decrease in the total amount of Bitcoin transferred indicates that the average transfer size, that is, the amount of Bitcoin per transaction, has decreased. This indicates that investors are trading in smaller pieces or that small investors are becoming more involved in the market.
Whale Activities
Cryptoquant CEO Ki Young Ju said on the X platform: ‘Capital has chosen BTC, don’t go against them.’ At the same time, the old whale and the new incoming whale shared a graph they owned, and it was stated that the realised market value of BTC owned by the new whale appeared to be about 2.5 times that of the old whales. On the other hand, Bitcoin whales are reportedly taking advantage of the downtrend to accumulate more Bitcoin. According to Santiment, the number of addresses holding 100 BTC or more increased by 135 in Februar, while the number of those holding less than 100 BTC decreased by 138,680. Santiment added to his words: ‘When whales absorb supply, ideal conditions are created for the market value to rise, even if it takes weeks or months for the price to rise.’ he said. In addition, a significant amount of idle Bitcoin has been moved after sitting untouched for 7 to 10 years, fuelling speculation within the crypto community about potential market impact. According to CryptoQuant analyst Dan, approximately 14,000 BTC were transferred, valued at over $1.3 billion. The move, tracked using the Bitcoin Spent Output Age Bands metric, marks the first time these coins have been used in nearly a decade. While such large transactions often cause market reactions, Dan pointed out that the fact that these coins were not immediately sent to exchanges indicates that their owners did not want to sell them immediately.
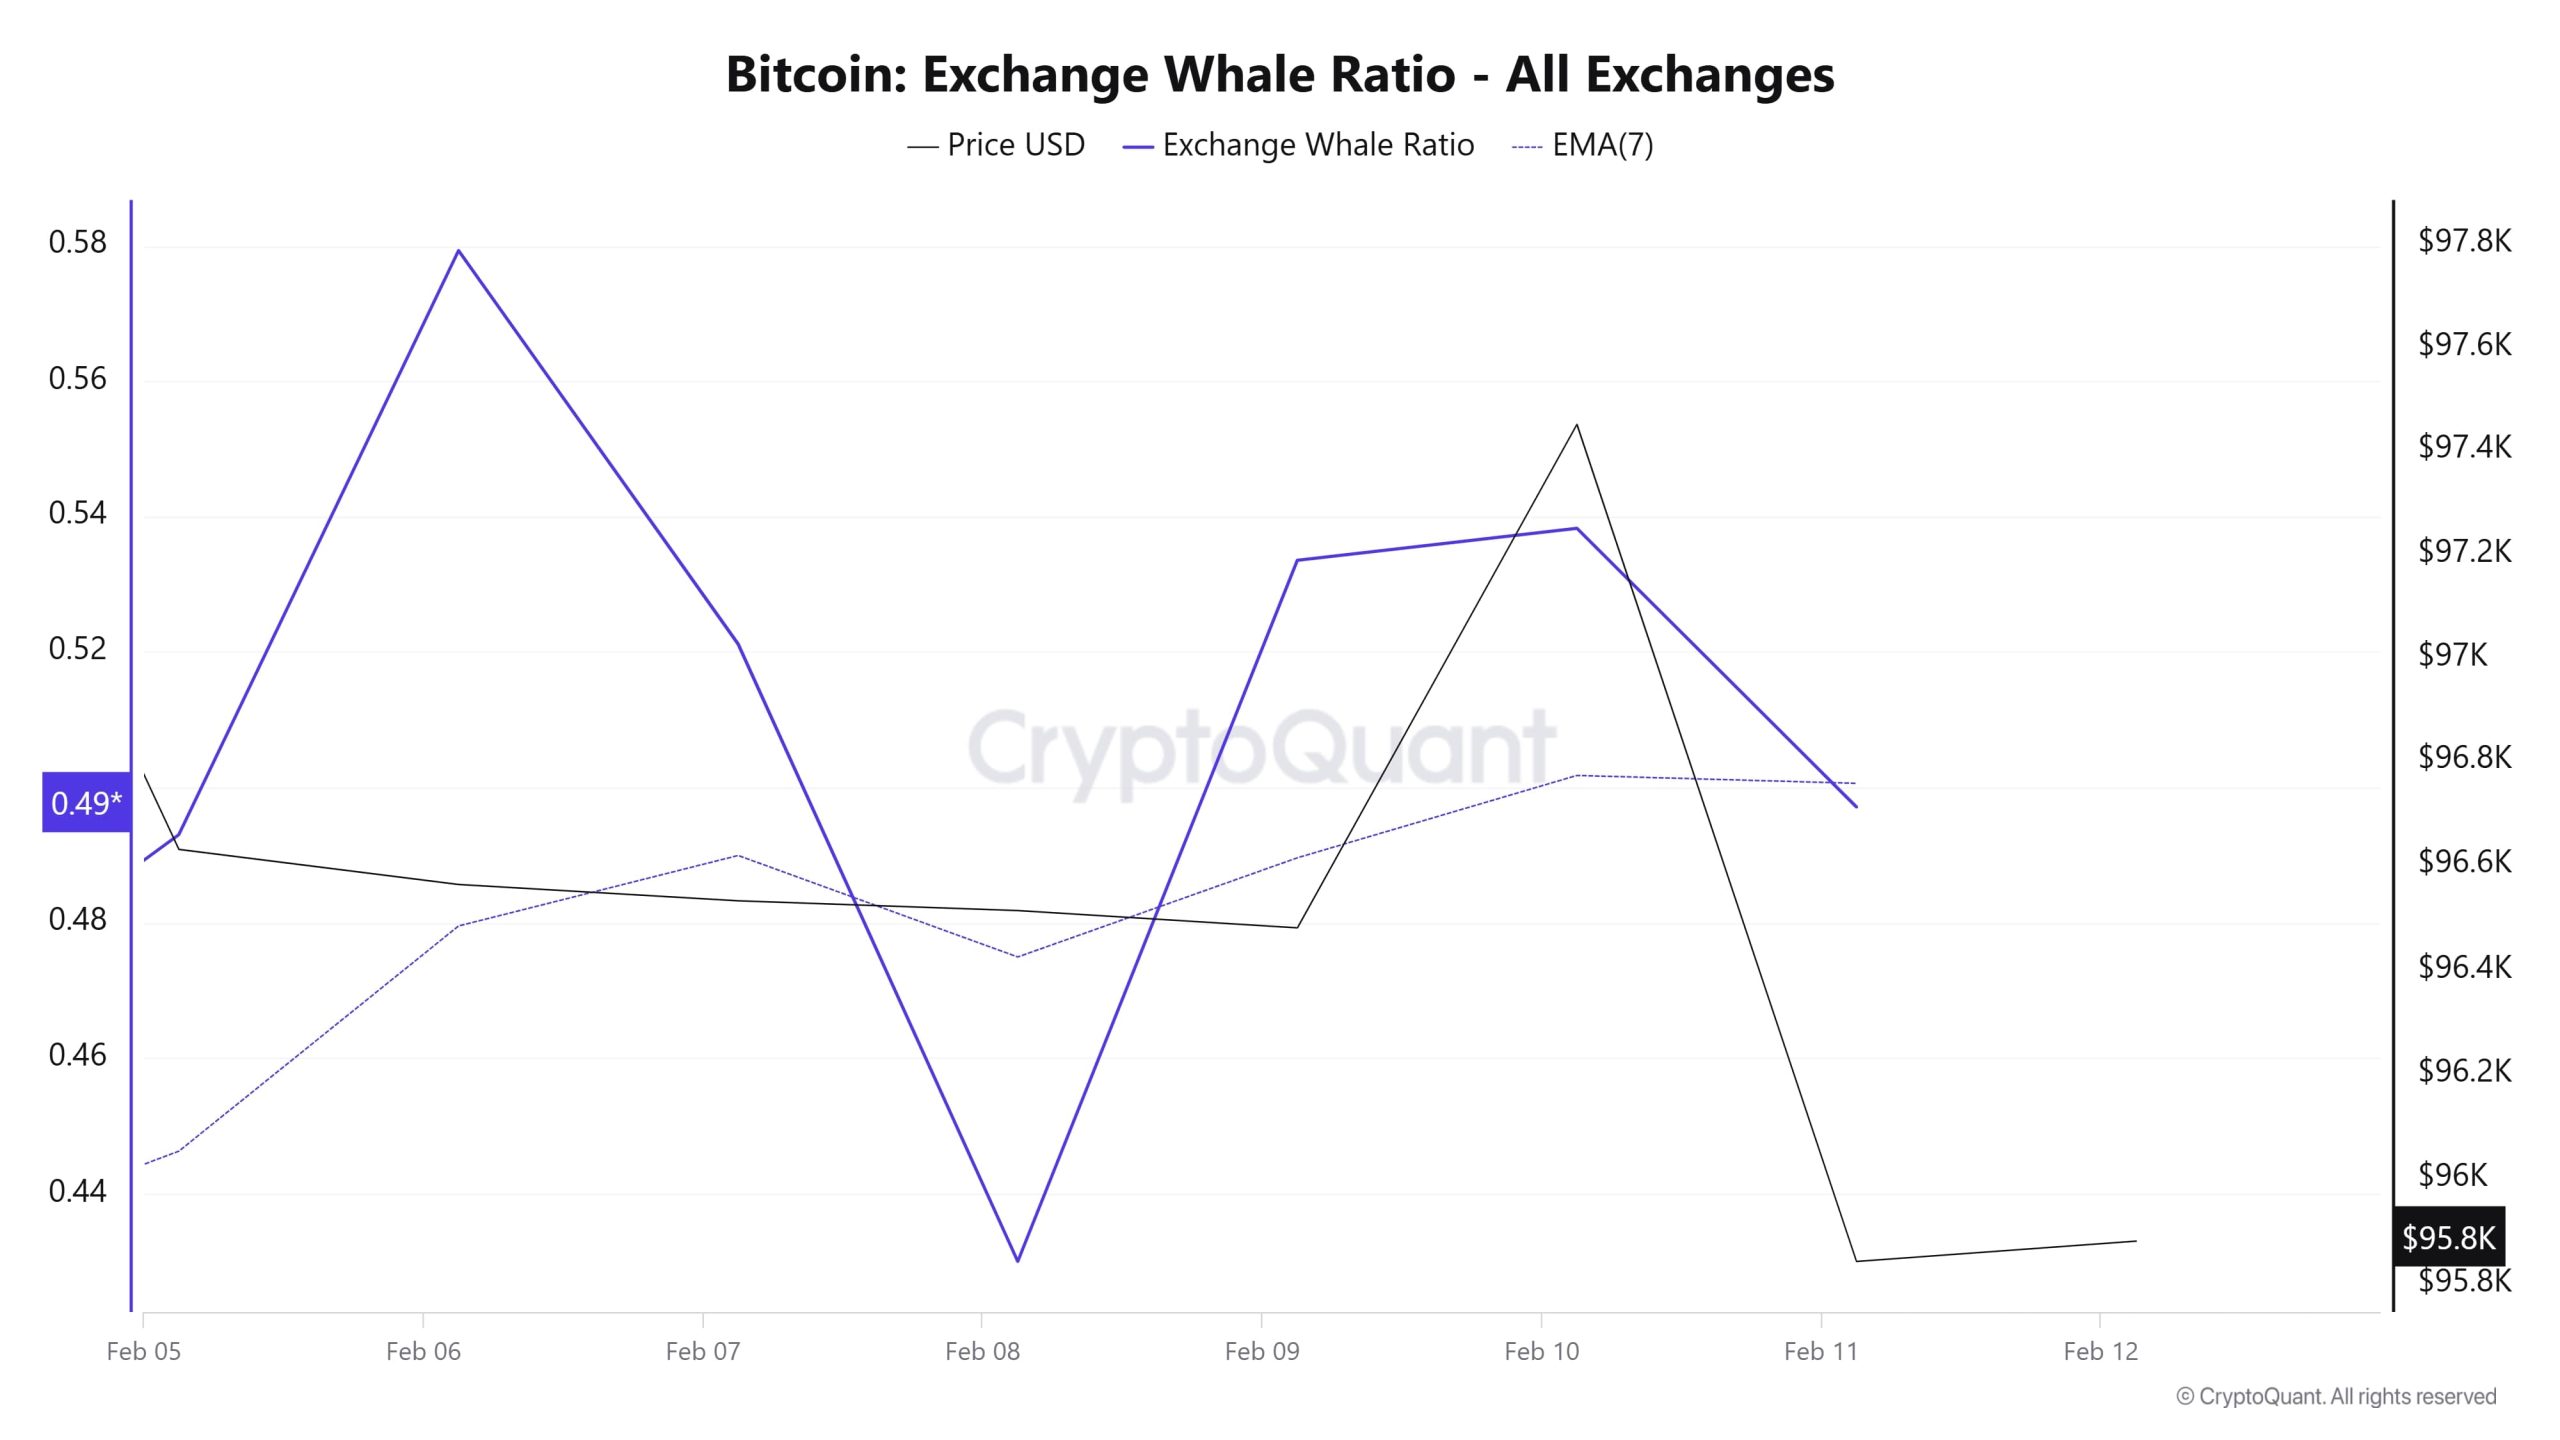
Whales Data
According to the data that attracted attention in the cryptocurrency market in the last 7 days, whale activities on the central stock exchange reached high levels in the first days. When we look at the last 7-day whale movements, the use of central exchanges by whales varies. When we look at the Exchange Whale Ratio metric, it showed that whales used central exchanges very frequently at the beginning of the 7-day process and the value was measured as 0.58. This measurement reached 0.53 in the middle of the process, showing us that whales started to use the central stock exchange less frequently than the first day. At the time of writing, the value is 0.49. When this ratio is above 0.350, it usually means that whales use central exchanges frequently. At the same time, the total BTC transfer decreased by about 15% compared to last week, with 3,802,662 BTC moving.
RECHTLICHER HINWEIS
Die in diesem Dokument enthaltenen Anlageinformationen, Kommentare und Empfehlungen stellen keine Anlageberatungsdienste dar. Die Anlageberatung wird von zugelassenen Instituten auf persönlicher Basis unter Berücksichtigung der Risiko- und Ertragspräferenzen des Einzelnen durchgeführt. Die in diesem Dokument enthaltenen Kommentare und Empfehlungen sind allgemeiner Art. Diese Empfehlungen sind möglicherweise nicht für Ihre finanzielle Situation und Ihre Risiko- und Renditepräferenzen geeignet. Eine Anlageentscheidung, die ausschließlich auf der Grundlage der in diesem Dokument enthaltenen Informationen getroffen wird, kann daher möglicherweise nicht zu Ergebnissen führen, die mit Ihren Erwartungen übereinstimmen.
NOTE: All data used in Bitcoin onchain analysis is based on Cryptoqaunt.
